7.pdf This presentation captures many uses and the significance of the number...
Exam Answers.pdf
1. Question 1
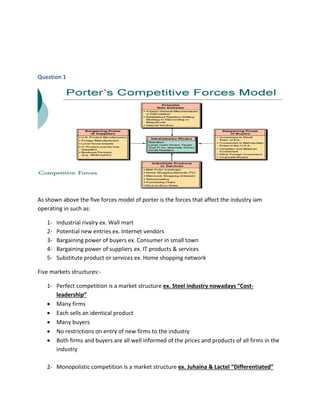
As shown above the five forces model of porter is the forces that affect the industry iam
operating in such as:
1- Industrial rivalry ex. Wall mart
2- Potential new entries ex. Internet vendors
3- Bargaining power of buyers ex. Consumer in small town
4- Bargaining power of suppliers ex. IT products & services
5- Substitute product or services ex. Home shopping network
Five markets structures:-
1- Perfect competition is a market structure ex. Steel industry nowadays “Cost-
leadership”
• Many firms
• Each sells an identical product
• Many buyers
• No restrictions on entry of new firms to the industry
• Both firms and buyers are all well informed of the prices and products of all firms in the
industry
2- Monopolistic competition is a market structure ex. Juhaina & Lactel “Differentiated”
2. 1 | P a g e
• Many firms
• Each firm produces similar but slightly different products—called product differentiation
• Each firm possesses an element of market power
• No restrictions on entry of new firms to the industry
3- Oligopoly is a market structure ex. Telecommunication ( Vodafone , Orange , Etisalat ,
WE ) “Cost-leadership”
• A small number of firms compete
• The firms might produce almost identical products or differentiated products
• Barriers to entry limit entry into the market.
4- Monopoly is a market structure ex. Egypt railways
• One firm produces the entire output of the industry
• There are no close substitutes for the product
• There are barriers to entry that protect the firm from competition by entering firms
Question 2
Economies of scale are features of a firm’s technology that lead to falling long-run average cost
as output increases.
Disagree , because as regard to the economies of scale as the output increases the total
average cost decreases on the long run , not the fixed cost , while the TAC is the TAFC+TAVC.
A firm experiences economies of scale up to some output level. Beyond that output level, it
moves into constant returns to scale or diseconomies of scale. Minimum efficient scale is the
smallest quantity of output at which the long-run average cost reaches its lowest level. If the
long-run average cost curve is U-shaped, the minimum point identifies the minimum efficient
scale output level. The graph below illustrates the answer:-
3. 2 | P a g e
Question 3
The four-firm concentration ratio is the percentage of the total industry sales accounted for by
the four largest firms in the industry.
The Herfindahl–Hirschman index (HHI) is the sum of the squared market shares of the 50
largest firms in the industry. The larger the measure of market concentration, the less
competition that exists in the industry.
Interpretation of HHI
• A market with an HHI of less than 1,000 is regarded as highly competitive
• A market with an HHI between 1,000 and 1,800 is regarded as moderately competitive
• A market with an HHI greater than 1,800 is uncompetitive
Disadvantage:-
The basic simplicity of the HHI carries some inherent disadvantages, primarily in terms of failing
to define the specific market that is being examined in a proper, realistic manner. For example,
consider a situation in which the HHI is used to evaluate an industry determined to have 10
active companies, and each company has about a 10% market share. Using the basic HHI
calculation, the industry would appear highly competitive. However, within the marketplace,
one company might have as much as 80 to 90% of the business for a specific segment of the
market, such as the sale of one specific item. That firm would thus have nearly a total
monopoly for the production and sale of that product.
4. 3 | P a g e
Question 4
The industry of soft drink can be said to be oligobly market structure due to several reasons, we can say
that coca-cola & pepsi controls the majority of the market share by 95.8% as a total market share for the
two huge companies. The highly cost of operating in the market prevent the small companies from
entering the competitive arena. In addition the price behavior of pepsi & coca-cola is exactly the same &
identical in their products. The two huge companies plays a very competitive game in their marketing
campaigns in order to grap the loayality & attention of their consumers. For ex. Pespi latest campaign
with the two great football players ( Messi & Salah ) is to grap the consumers whom in love with the
players , on the other side we can see coca-cola campaign using the Lebanese singer ( Nancy Ajram ) &
etc.
Question 5
Units = 50/day
Selling price = 20/unit
Variable cost= 24000/month
Marginal cost= 20/unit
Revenue = 50*20*30 = 30000
Since the variable cost is 24000 / month if the fixed cost is less than 6000 my decision is to continue.
However, technological change influences both the productivity curves and the cost curves. An increase
in productivity shifts the average and marginal product curves upward and the average and marginal
cost curves downward. If a technological advance brings more capital and less labor into use, fixed costs
increase and variable costs decrease. In this case, average total cost increases at low output levels and
decreases at high output levels.
Changes in the prices of resources shift the cost curves. An increase in a fixed cost shifts the total cost
(TC ) and average total cost (ATC ) curves upward but does not shift the marginal cost (MC ) curve. An
increase in a variable cost shifts the total cost (TC ), average total cost (ATC ), and marginal cost (MC )
curves upwards.
5. 4 | P a g e
Question 6
Yes I agree to a limit that you have to increase your production in order to increase the short term
productivity while maintaining the cost of production. If efficient cannot be attainable in the short term
you may go for the long term efficient.
6. 5 | P a g e
Question 7
(a) Short run, the short run is a time frame in which the quantity of one or more resources used in
production is fixed. For most firms, the capital, called the firm’s plant, is fixed in the short run.
Other resources used by the firm (such as labor, raw materials, and energy) can be changed in
the short run. Short-run decisions are easily reversed. While the long run is a time frame in
which the quantities of all resources including the plant size can be varied. Long-run decisions
are not easily reversed.
(b)
labour hours 0 10 20 30 40 50 60 70 80
marginal product of
labour 0 300 400 500 400 300 200 0 -100
quantity 0 3000 7000 12000 16000 19000 21000 21000 20000
APL 0 300 350 400 400 380 350 300 250
stage
stage 1: increasing return
stage 2: diminishing
return
stage 3: negative
return
(c) The marginal product of labor is the change in total product that results from a one-unit
increase in the quantity of labor employed, with all other inputs remaining the same.
The average product of labor is equal to total product divided by the quantity of labor
employed.
(d) Shown in table
(e) Increasing in productivity means increasing in units produced which reflected by cost of unit will
decrease therefore the fixed cost will be divided upon large number of units produced until the
end of stage1 (increasing return)
(f) 1- marginal product of a worker exceeds the marginal product of the previous worker
2- Marginal product of a worker is less than marginal product of the previous worker