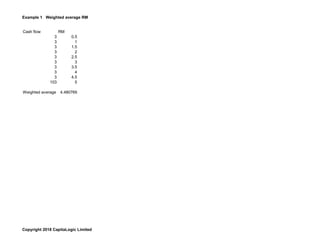
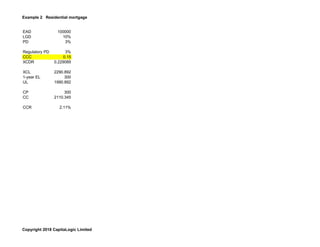
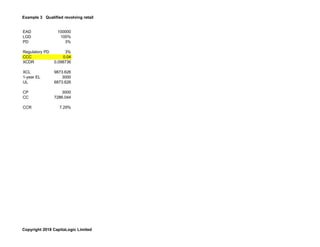
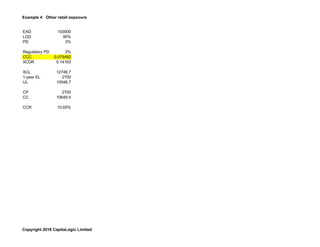
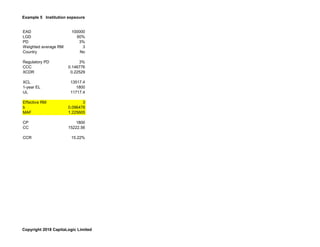
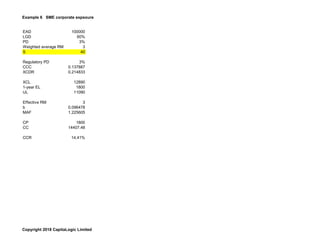
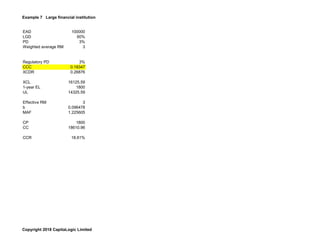
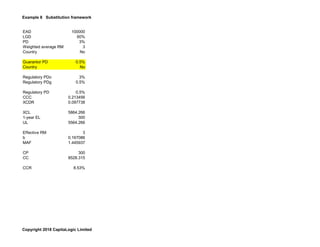
Example Index
Copyright 2018 CapitaLogic Limited
Example Description Excel technique
1 Weighted average RM
2 Residential mortgage
3 Qualified revolving retail exposure
4 Other retail exposure
5 Institution exposure
6 SME corporate exposure
7 Large financial institution exposure
8 Substitution framework
9 Double default framework
10 Partial static hedge
11 Dynamic hedge
12 IRB vs standardized approach on retail debts
13 IRB vs standardized approach on senior debts
14 IRB vs standardized approach on subordinated debts
This Excel workbook is prepared in accordance with
Chapter 18 of the text book
"Managing Credit Risk Under The Basel III Framework, 3
rd
ed"
Authored by :Dr. LAM Yat-fai (林日辉)
Principal, Structured Products Analytics, CapitaLogic Limited
Adjunct Professor of Finance, City University of Hong Kong
Doctor of Business Administration
CFA, CAIA, CAMS, FRM, PRM
Website: https://sites.google.com/site/crmbase
E-mail: crmbasel@gmail.com
Copyright 2018 CapitaLogic Limited
Example 1 Weighted average RM
Cash flow RM
3 0.5
3 1
3 1.5
3 2
3 2.5
3 3
3 3.5
3 4
3 4.5
103 5
Weighted average 4.480769
Copyright 2018 CapitaLogic Limited
Example 2 Residential mortgage
EAD 100000
LGD 10%
PD 3%
Regulatory PD 3%
CCC 0.15
XCDR 0.229089
XCL 2290.892
1-year EL 300
UL 1990.892
CP 300
CC 2110.345
CCR 2.11%
Copyright 2018 CapitaLogic Limited
Example 3 Qualified revolving retail
EAD 100000
LGD 100%
PD 3%
Regulatory PD 3%
CCC 0.04
XCDR 0.098736
XCL 9873.626
1-year EL 3000
UL 6873.626
CP 3000
CC 7286.044
CCR 7.29%
Copyright 2018 CapitaLogic Limited
Example 4 Other retail expsoure
EAD 100000
LGD 90%
PD 3%
Regulatory PD 3%
CCC 0.075492
XCDR 0.14163
XCL 12746.7
1-year EL 2700
UL 10046.7
CP 2700
CC 10649.5
CCR 10.65%
Copyright 2018 CapitaLogic Limited
Example 5 Institution expsoure
EAD 100000
LGD 60%
PD 3%
Weighted average RM 3
Country No
Regulatory PD 3%
CCC 0.146776
XCDR 0.22529
XCL 13517.4
1-year EL 1800
UL 11717.4
Effective RM 3
b 0.096478
MAF 1.225605
CP 1800
CC 15222.56
CCR 15.22%
Copyright 2018 CapitaLogic Limited
Example 6 SME corporate expsoure
EAD 100000
LGD 60%
PD 3%
Weighted average RM 3
S 40
Regulatory PD 3%
CCC 0.137887
XCDR 0.214833
XCL 12890
1-year EL 1800
UL 11090
Effective RM 3
b 0.096478
MAF 1.225605
CP 1800
CC 14407.48
CCR 14.41%
Copyright 2018 CapitaLogic Limited
Example 7 Large financial institution
EAD 100000
LGD 60%
PD 3%
Weighted average RM 3
Regulatory PD 3%
CCC 0.18347
XCDR 0.26876
XCL 16125.59
1-year EL 1800
UL 14325.59
Effective RM 3
b 0.096478
MAF 1.225605
CP 1800
CC 18610.96
CCR 18.61%
Copyright 2018 CapitaLogic Limited
Example 8 Substitution framework
EAD 100000
LGD 60%
PD 3%
Weighted average RM 3
Country No
Guarantor PD 0.5%
Country No
Regulatory PDo 3%
Regulatory PDg 0.5%
Regulatory PD 0.5%
CCC 0.213456
XCDR 0.097738
XCL 5864.266
1-year EL 300
UL 5564.266
Effective RM 3
b 0.167086
MAF 1.445937
CP 300
CC 8528.315
CCR 8.53%
Copyright 2018 CapitaLogic Limited
Example 9 Double default framework
EAD 100000
LGD 60%
PD 3%
Weighted average RM 3
Country No
Guarantor PD 0.5%
Country No
Regulatory PD 3%
CCC 0.146776
XCDR 0.22529
XCL 13517.4
1-year EL 1800
UL 11717.4
PDg 0.5%
Effective RM 3
b 0.167086
MAF 1.445937
DDF 0.95
CP 0
CC 17061.22
CCR 17.06%
Copyright 2018 CapitaLogic Limited
Example 10 Partial static hedge
Origination Deterioration Unprotected Protected Total
Principal 100000 100000 56267.3969 43732.6031
LGD 60% 80% 80%
PD 3% 6% 6%
RM 3 2 2
EL 5239.62 9312 5239.62
EAD 100000 100000 56267.3969 43732.6031
LGD 60% 80% 80% 80%
PD 3% 6% 6% 0.5%
RM 3 2 2 2
Country No No No No
Regulatory PD 3% 6% 6% 1%
CCC 0.14677562 0.12597445 0.12597445 0.21345609
XCDR 0.22528996 0.31211863 0.31211863 0.09773776
XCL 13517.3975 24969.4907 14049.6825 3419.46149
1-year EL 1800 4800 2700.83505 174.930412
UL 11717.3975 20169.4907 11348.8474 3244.53108
Effective RM 3 2 2 2
b 0.0964781 0.07433183 0.07433183 0.16708623
MAF 1.22560513 1.08365969 1.08365969 1.22296874
CP 1800 4800 2700.83505 174.930412 2875.76546
CC 15222.5567 23168.276 13036.1858 4206.03768 17242.2235
CCR 15.22% 23.17% 23.17% 9.62%
Debt Protected by CDS
Copyright 2018 CapitaLogic Limited
Example 11 Dynamic hedge
Origination Deterioration Unprotected Protected Total
Principal 100000 100000 37500 62500
LGD 60% 80% 80%
PD 3% 6% 6%
1-year EL 1800 4800 1800
EAD 100000 100000 73214.2857 26785.7143
LGD 60% 80% 80% 80%
PD 3% 6% 6% 0.5%
RM 3 2 2 2
Country No No No No
Regulatory PD 3% 6% 6% 1%
CCC 0.14677562 0.12597445 0.12597445 0.21345609
XCDR 0.22528996 0.31211863 0.31211863 0.09773776
XCL 13517.3975 24969.4907 18281.2343 2094.38067
1-year EL 1800 4800 3514.28571 107.142857
UL 11717.3975 20169.4907 14766.9486 1987.23781
Effective RM 3 2 2 2
b 0.0964781 0.07433183 0.07433183 0.16708623
MAF 1.22560513 1.08365969 1.08365969 1.22296874
CP 1800 4800 3514.28571 107.142857 3621.42857
CC 15222.5567 23168.276 16962.4878 2576.1495 19538.6373
CCR 15.22% 23.17% 23.17% 9.62%
Debt Protected by CDS
Copyright 2018 CapitaLogic Limited
Example 12 IRB vs SA retail
AA A BBB BB B
EAD 100000 100000 100000 100000 100000
LGD 90% 90% 90% 90% 90%
PD 0.0333% 0.0834% 0.3345% 2.5652% 7.1682%
Regulatory PD 0.03% 0.08% 0.33% 2.57% 7.17%
CCC 0.158494 0.15626 0.145637 0.082969 0.040577
XCDR 0.008924 0.018191 0.048651 0.134435 0.195311
XCL 803.1627 1637.229 4378.63 12099.19 17578.02
1-year EL 29.97 75.06 301.05 2308.68 6451.38
UL 773.1927 1562.169 4077.58 9790.514 11126.64
CP 29.97 75.06 301.05 2308.68 6451.38
CC 819.5843 1655.899 4322.235 10377.94 11794.23
CCR 0.82% 1.66% 4.32% 10.38% 11.79%
SA 6% 6% 6% 6% 6%
Copyright 2018 CapitaLogic Limited
Example 13 IRB vs SA senior
AA A BBB BB B
EAD 100000 100000 100000 100000 100000
LGD 45% 45% 45% 45% 45%
PD 0.0333% 0.0834% 0.3345% 2.5652% 7.1682%
RM 1 1 1 1 1
Country No No No No No
Regulatory PD 0.03% 0.08% 0.33% 2.57% 7.17%
CCC 0.238019 0.235099 0.221519 0.153278 0.123331
XCDR 0.014945 0.029964 0.077054 0.210931 0.343159
XCL 672.535 1348.358 3467.414 9491.893 15442.17
1-year EL 14.985 37.53 150.525 1154.34 3225.69
UL 657.55 1310.828 3316.889 8337.553 12216.48
Effective RM 1 1 1 1 1
b 0.310431 0.256918 0.185573 0.10188 0.069113
MAF 1 1 1 1 1
CC 697.003 1389.478 3515.902 8837.807 12949.47
CCR 0.70% 1.39% 3.52% 8.84% 12.95%
SA 1.60% 4% 4% 8% 8%
Copyright 2018 CapitaLogic Limited
Example 14 IRB vs SA subordinated
AA A BBB BB B
EAD 100000 100000 100000 100000 100000
LGD 75% 75% 75% 75% 75%
PD 0.0333% 0.0834% 0.3345% 2.5652% 7.1682%
RM 1 1 1 1 1
Country No No No No No
Regulatory PD 0.03% 0.08% 0.33% 2.57% 7.17%
CCC 0.238019 0.235099 0.221519 0.153278 0.123331
XCDR 0.014945 0.029964 0.077054 0.210931 0.343159
XCL 1120.892 2247.264 5779.023 15819.82 25736.95
1-year EL 24.975 62.55 250.875 1923.9 5376.15
UL 1095.917 2184.714 5528.148 13895.92 20360.8
Effective RM 1 1 1 1 1
b 0.310431 0.256918 0.185573 0.10188 0.069113
MAF 1 1 1 1 1
CC 1161.672 2315.797 5859.837 14729.68 21582.45
CCR 1.16% 2.32% 5.86% 14.73% 21.58%
SA 1.60% 4% 4% 8% 8%
Copyright 2018 CapitaLogic Limited

18.3 internal ratings based approach

  • 1.
    Example Index Copyright 2018CapitaLogic Limited Example Description Excel technique 1 Weighted average RM 2 Residential mortgage 3 Qualified revolving retail exposure 4 Other retail exposure 5 Institution exposure 6 SME corporate exposure 7 Large financial institution exposure 8 Substitution framework 9 Double default framework 10 Partial static hedge 11 Dynamic hedge 12 IRB vs standardized approach on retail debts 13 IRB vs standardized approach on senior debts 14 IRB vs standardized approach on subordinated debts This Excel workbook is prepared in accordance with Chapter 18 of the text book "Managing Credit Risk Under The Basel III Framework, 3 rd ed" Authored by :Dr. LAM Yat-fai (林日辉) Principal, Structured Products Analytics, CapitaLogic Limited Adjunct Professor of Finance, City University of Hong Kong Doctor of Business Administration CFA, CAIA, CAMS, FRM, PRM Website: https://sites.google.com/site/crmbase E-mail: crmbasel@gmail.com Copyright 2018 CapitaLogic Limited
  • 2.
    Example 1 Weightedaverage RM Cash flow RM 3 0.5 3 1 3 1.5 3 2 3 2.5 3 3 3 3.5 3 4 3 4.5 103 5 Weighted average 4.480769 Copyright 2018 CapitaLogic Limited
  • 3.
    Example 2 Residentialmortgage EAD 100000 LGD 10% PD 3% Regulatory PD 3% CCC 0.15 XCDR 0.229089 XCL 2290.892 1-year EL 300 UL 1990.892 CP 300 CC 2110.345 CCR 2.11% Copyright 2018 CapitaLogic Limited
  • 4.
    Example 3 Qualifiedrevolving retail EAD 100000 LGD 100% PD 3% Regulatory PD 3% CCC 0.04 XCDR 0.098736 XCL 9873.626 1-year EL 3000 UL 6873.626 CP 3000 CC 7286.044 CCR 7.29% Copyright 2018 CapitaLogic Limited
  • 5.
    Example 4 Otherretail expsoure EAD 100000 LGD 90% PD 3% Regulatory PD 3% CCC 0.075492 XCDR 0.14163 XCL 12746.7 1-year EL 2700 UL 10046.7 CP 2700 CC 10649.5 CCR 10.65% Copyright 2018 CapitaLogic Limited
  • 6.
    Example 5 Institutionexpsoure EAD 100000 LGD 60% PD 3% Weighted average RM 3 Country No Regulatory PD 3% CCC 0.146776 XCDR 0.22529 XCL 13517.4 1-year EL 1800 UL 11717.4 Effective RM 3 b 0.096478 MAF 1.225605 CP 1800 CC 15222.56 CCR 15.22% Copyright 2018 CapitaLogic Limited
  • 7.
    Example 6 SMEcorporate expsoure EAD 100000 LGD 60% PD 3% Weighted average RM 3 S 40 Regulatory PD 3% CCC 0.137887 XCDR 0.214833 XCL 12890 1-year EL 1800 UL 11090 Effective RM 3 b 0.096478 MAF 1.225605 CP 1800 CC 14407.48 CCR 14.41% Copyright 2018 CapitaLogic Limited
  • 8.
    Example 7 Largefinancial institution EAD 100000 LGD 60% PD 3% Weighted average RM 3 Regulatory PD 3% CCC 0.18347 XCDR 0.26876 XCL 16125.59 1-year EL 1800 UL 14325.59 Effective RM 3 b 0.096478 MAF 1.225605 CP 1800 CC 18610.96 CCR 18.61% Copyright 2018 CapitaLogic Limited
  • 9.
    Example 8 Substitutionframework EAD 100000 LGD 60% PD 3% Weighted average RM 3 Country No Guarantor PD 0.5% Country No Regulatory PDo 3% Regulatory PDg 0.5% Regulatory PD 0.5% CCC 0.213456 XCDR 0.097738 XCL 5864.266 1-year EL 300 UL 5564.266 Effective RM 3 b 0.167086 MAF 1.445937 CP 300 CC 8528.315 CCR 8.53% Copyright 2018 CapitaLogic Limited
  • 10.
    Example 9 Doubledefault framework EAD 100000 LGD 60% PD 3% Weighted average RM 3 Country No Guarantor PD 0.5% Country No Regulatory PD 3% CCC 0.146776 XCDR 0.22529 XCL 13517.4 1-year EL 1800 UL 11717.4 PDg 0.5% Effective RM 3 b 0.167086 MAF 1.445937 DDF 0.95 CP 0 CC 17061.22 CCR 17.06% Copyright 2018 CapitaLogic Limited
  • 11.
    Example 10 Partialstatic hedge Origination Deterioration Unprotected Protected Total Principal 100000 100000 56267.3969 43732.6031 LGD 60% 80% 80% PD 3% 6% 6% RM 3 2 2 EL 5239.62 9312 5239.62 EAD 100000 100000 56267.3969 43732.6031 LGD 60% 80% 80% 80% PD 3% 6% 6% 0.5% RM 3 2 2 2 Country No No No No Regulatory PD 3% 6% 6% 1% CCC 0.14677562 0.12597445 0.12597445 0.21345609 XCDR 0.22528996 0.31211863 0.31211863 0.09773776 XCL 13517.3975 24969.4907 14049.6825 3419.46149 1-year EL 1800 4800 2700.83505 174.930412 UL 11717.3975 20169.4907 11348.8474 3244.53108 Effective RM 3 2 2 2 b 0.0964781 0.07433183 0.07433183 0.16708623 MAF 1.22560513 1.08365969 1.08365969 1.22296874 CP 1800 4800 2700.83505 174.930412 2875.76546 CC 15222.5567 23168.276 13036.1858 4206.03768 17242.2235 CCR 15.22% 23.17% 23.17% 9.62% Debt Protected by CDS Copyright 2018 CapitaLogic Limited
  • 12.
    Example 11 Dynamichedge Origination Deterioration Unprotected Protected Total Principal 100000 100000 37500 62500 LGD 60% 80% 80% PD 3% 6% 6% 1-year EL 1800 4800 1800 EAD 100000 100000 73214.2857 26785.7143 LGD 60% 80% 80% 80% PD 3% 6% 6% 0.5% RM 3 2 2 2 Country No No No No Regulatory PD 3% 6% 6% 1% CCC 0.14677562 0.12597445 0.12597445 0.21345609 XCDR 0.22528996 0.31211863 0.31211863 0.09773776 XCL 13517.3975 24969.4907 18281.2343 2094.38067 1-year EL 1800 4800 3514.28571 107.142857 UL 11717.3975 20169.4907 14766.9486 1987.23781 Effective RM 3 2 2 2 b 0.0964781 0.07433183 0.07433183 0.16708623 MAF 1.22560513 1.08365969 1.08365969 1.22296874 CP 1800 4800 3514.28571 107.142857 3621.42857 CC 15222.5567 23168.276 16962.4878 2576.1495 19538.6373 CCR 15.22% 23.17% 23.17% 9.62% Debt Protected by CDS Copyright 2018 CapitaLogic Limited
  • 13.
    Example 12 IRBvs SA retail AA A BBB BB B EAD 100000 100000 100000 100000 100000 LGD 90% 90% 90% 90% 90% PD 0.0333% 0.0834% 0.3345% 2.5652% 7.1682% Regulatory PD 0.03% 0.08% 0.33% 2.57% 7.17% CCC 0.158494 0.15626 0.145637 0.082969 0.040577 XCDR 0.008924 0.018191 0.048651 0.134435 0.195311 XCL 803.1627 1637.229 4378.63 12099.19 17578.02 1-year EL 29.97 75.06 301.05 2308.68 6451.38 UL 773.1927 1562.169 4077.58 9790.514 11126.64 CP 29.97 75.06 301.05 2308.68 6451.38 CC 819.5843 1655.899 4322.235 10377.94 11794.23 CCR 0.82% 1.66% 4.32% 10.38% 11.79% SA 6% 6% 6% 6% 6% Copyright 2018 CapitaLogic Limited
  • 14.
    Example 13 IRBvs SA senior AA A BBB BB B EAD 100000 100000 100000 100000 100000 LGD 45% 45% 45% 45% 45% PD 0.0333% 0.0834% 0.3345% 2.5652% 7.1682% RM 1 1 1 1 1 Country No No No No No Regulatory PD 0.03% 0.08% 0.33% 2.57% 7.17% CCC 0.238019 0.235099 0.221519 0.153278 0.123331 XCDR 0.014945 0.029964 0.077054 0.210931 0.343159 XCL 672.535 1348.358 3467.414 9491.893 15442.17 1-year EL 14.985 37.53 150.525 1154.34 3225.69 UL 657.55 1310.828 3316.889 8337.553 12216.48 Effective RM 1 1 1 1 1 b 0.310431 0.256918 0.185573 0.10188 0.069113 MAF 1 1 1 1 1 CC 697.003 1389.478 3515.902 8837.807 12949.47 CCR 0.70% 1.39% 3.52% 8.84% 12.95% SA 1.60% 4% 4% 8% 8% Copyright 2018 CapitaLogic Limited
  • 15.
    Example 14 IRBvs SA subordinated AA A BBB BB B EAD 100000 100000 100000 100000 100000 LGD 75% 75% 75% 75% 75% PD 0.0333% 0.0834% 0.3345% 2.5652% 7.1682% RM 1 1 1 1 1 Country No No No No No Regulatory PD 0.03% 0.08% 0.33% 2.57% 7.17% CCC 0.238019 0.235099 0.221519 0.153278 0.123331 XCDR 0.014945 0.029964 0.077054 0.210931 0.343159 XCL 1120.892 2247.264 5779.023 15819.82 25736.95 1-year EL 24.975 62.55 250.875 1923.9 5376.15 UL 1095.917 2184.714 5528.148 13895.92 20360.8 Effective RM 1 1 1 1 1 b 0.310431 0.256918 0.185573 0.10188 0.069113 MAF 1 1 1 1 1 CC 1161.672 2315.797 5859.837 14729.68 21582.45 CCR 1.16% 2.32% 5.86% 14.73% 21.58% SA 1.60% 4% 4% 8% 8% Copyright 2018 CapitaLogic Limited