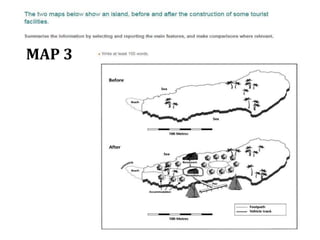
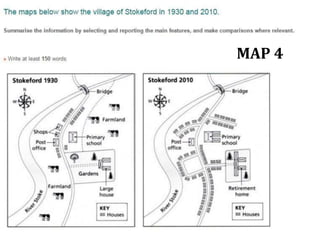
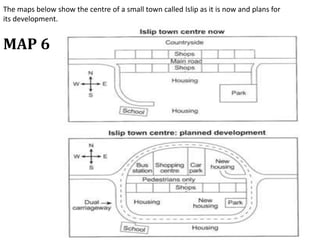
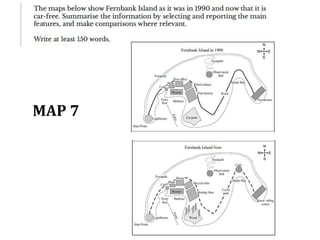
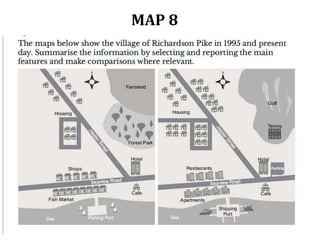
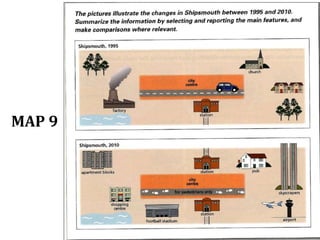
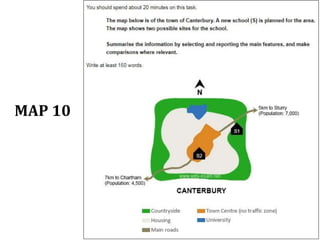
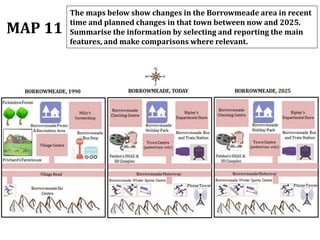
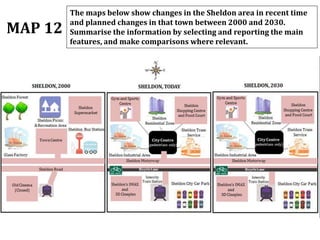
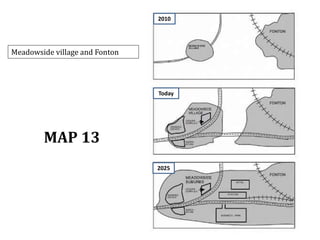
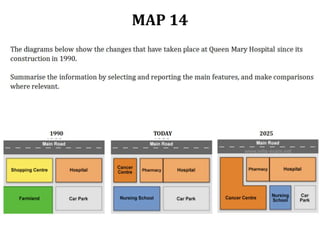
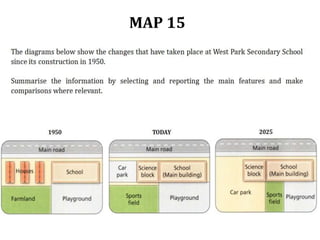
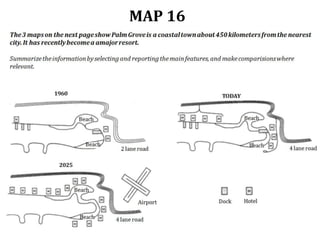
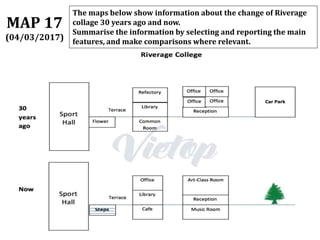
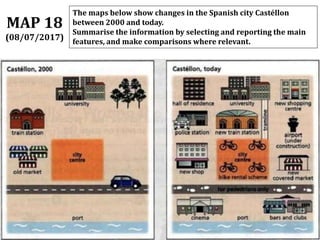
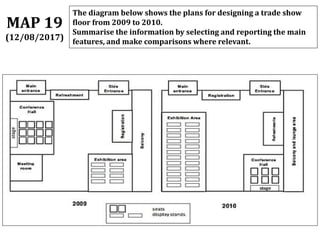
The document provides a series of maps showing current and planned changes in various towns including Islip, Borrowmeade, Sheldon, Meadowside Village, Fonton, Riverage College, Spanish City Castéllon, and Hunderstone. It highlights developments from different time periods, specifically noting changes from recent times up until 2025 or 2030. The instruction is to summarize and compare the main features evident in these maps.
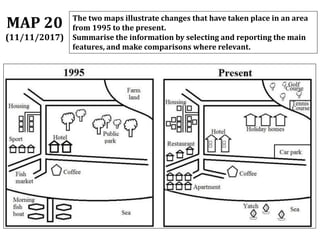


![[IELTS] Academic Writing, Task 1 - Describing Maps - Lesson Slides.pptx](https://cdn.slidesharecdn.com/ss_thumbnails/ieltsacademicwritingtask1-describingmaps-lessonslides-250619212529-235f16b9-thumbnail.jpg?width=640&height=640&fit=bounds)


