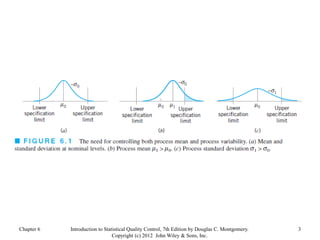
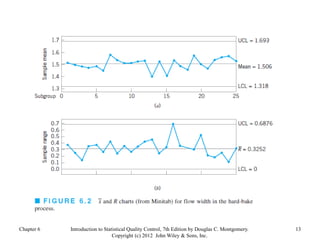
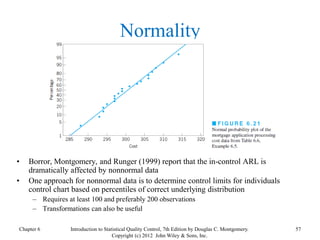
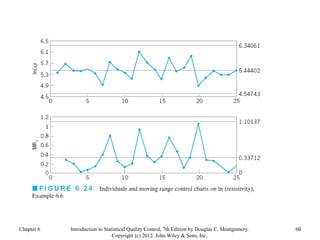
Chapter 6 1
Introduction to Statistical Quality Control, 7th Edition by Douglas C. Montgomery.
Copyright (c) 2012 John Wiley & Sons, Inc.
Chapter 6 2
Introduction to Statistical Quality Control, 7th Edition by Douglas C. Montgomery.
Copyright (c) 2012 John Wiley & Sons, Inc.
Learning Objectives
Chapter 6 3
Introduction to Statistical Quality Control, 7th Edition by Douglas C. Montgomery.
Copyright (c) 2012 John Wiley & Sons, Inc.
Chapter 6 4
Introduction to Statistical Quality Control, 7th Edition by Douglas C. Montgomery.
Copyright (c) 2012 John Wiley & Sons, Inc.
Chapter 6 5
Introduction to Statistical Quality Control, 7th Edition by Douglas C. Montgomery.
Copyright (c) 2012 John Wiley & Sons, Inc.
Subgroup Data with Unknown  and 
Chapter 6 6
Introduction to Statistical Quality Control, 7th Edition by Douglas C. Montgomery.
Copyright (c) 2012 John Wiley & Sons, Inc.
Chapter 6 7
Introduction to Statistical Quality Control, 7th Edition by Douglas C. Montgomery.
Copyright (c) 2012 John Wiley & Sons, Inc.
Chapter 6 8
Introduction to Statistical Quality Control, 7th Edition by Douglas C. Montgomery.
Copyright (c) 2012 John Wiley & Sons, Inc.
Chapter 6 9
Introduction to Statistical Quality Control, 7th Edition by Douglas C. Montgomery.
Copyright (c) 2012 John Wiley & Sons, Inc.
Chapter 6 10
Introduction to Statistical Quality Control, 7th Edition by Douglas C. Montgomery.
Copyright (c) 2012 John Wiley & Sons, Inc.
Phase I Application of and R Charts
• Eqns 6.4 and 6.5 are trial control limits
– Determined from m initial samples
• Typically 20-25 subgroups of size n between 3 and 5
– Any out-of-control points should be examined for assignable causes
• If assignable causes are found, discard points from calculations and
revise the trial control limits
• Continue examination until all points plot in control
• Adopt resulting trial control limits for use
• If no assignable cause is found, there are two options
1. Eliminate point as if an assignable cause were found and revise limits
2. Retain point and consider limits appropriate for control
– If there are many out-of-control points they should be examined for
patterns that may identify underlying process problems
x
Chapter 6 11
Introduction to Statistical Quality Control, 7th Edition by Douglas C. Montgomery.
Copyright (c) 2012 John Wiley & Sons, Inc.
Example 6.1 The Hard Bake Process
Chapter 6 12
Introduction to Statistical Quality Control, 7th Edition by Douglas C. Montgomery.
Copyright (c) 2012 John Wiley & Sons, Inc.
Chapter 6 13
Introduction to Statistical Quality Control, 7th Edition by Douglas C. Montgomery.
Copyright (c) 2012 John Wiley & Sons, Inc.
Chapter 6 14
Introduction to Statistical Quality Control, 7th Edition by Douglas C. Montgomery.
Copyright (c) 2012 John Wiley & Sons, Inc.
Chapter 6 15
Introduction to Statistical Quality Control, 7th Edition by Douglas C. Montgomery.
Copyright (c) 2012 John Wiley & Sons, Inc.
Chapter 6 16
Introduction to Statistical Quality Control, 7th Edition by Douglas C. Montgomery.
Copyright (c) 2012 John Wiley & Sons, Inc.
Chapter 6 17
Introduction to Statistical Quality Control, 7th Edition by Douglas C. Montgomery.
Copyright (c) 2012 John Wiley & Sons, Inc.
Revision of Control Limits
and Center Lines
• Effective use of control charts requires periodic
review and revision of control limits and center lines
• Sometimes users replace the center line on the chart
with a target value
• When R chart is out of control, out-of-control points
are often eliminated to recompute a revised value of
which is used to determine new limits and center line
on R chart and new limits on chart
x
x
R
Chapter 6 18
Introduction to Statistical Quality Control, 7th Edition by Douglas C. Montgomery.
Copyright (c) 2012 John Wiley & Sons, Inc.
Phase II Operation of Charts
• Use of control chart for monitoring future
production, once a set of reliable limits are
established, is called phase II of control chart
usage (Figure 6.4)
• A run chart showing individuals observations
in each sample, called a tolerance chart or
tier diagram (Figure 6.5), may reveal patterns
or unusual observations in the data
Chapter 6 19
Introduction to Statistical Quality Control, 7th Edition by Douglas C. Montgomery.
Copyright (c) 2012 John Wiley & Sons, Inc.
Chapter 6 20
Introduction to Statistical Quality Control, 7th Edition by Douglas C. Montgomery.
Copyright (c) 2012 John Wiley & Sons, Inc.
Chapter 6 21
Introduction to Statistical Quality Control, 7th Edition by Douglas C. Montgomery.
Copyright (c) 2012 John Wiley & Sons, Inc.
Chapter 6 22
Introduction to Statistical Quality Control, 7th Edition by Douglas C. Montgomery.
Copyright (c) 2012 John Wiley & Sons, Inc.
Control vs. Specification Limits
• Control limits are derived
from natural process
variability, or the natural
tolerance limits of a process
• Specification limits are
determined externally, for
example by customers or
designers
• There is no mathematical or
statistical relationship
between the control limits
and the specification limits
Chapter 6 23
Introduction to Statistical Quality Control, 7th Edition by Douglas C. Montgomery.
Copyright (c) 2012 John Wiley & Sons, Inc.
Rational Subgroups
• charts monitor between-sample variability
• R charts measure within-sample variability
• Standard deviation estimate of  used to construct
control limits is calculated from within-sample
variability
• It is not correct to estimate  using
x
Chapter 6 24
Introduction to Statistical Quality Control, 7th Edition by Douglas C. Montgomery.
Copyright (c) 2012 John Wiley & Sons, Inc.
Guidelines for Control Chart Design
• Control chart design requires specification of sample size,
control limit width, and sampling frequency
– Exact solution requires detailed information on statistical
characteristics as well as economic factors
– The problem of choosing sample size and sampling frequency is one of
allocating sampling effort
• For chart, choose as small a sample size is consistent with
magnitude of process shift one is trying to detect. For
moderate to large shifts, relatively small samples are effective.
For small shifts, larger samples are needed.
• For small samples, R chart is relatively insensitive to changes
in process standard deviation. For larger samples (n > 10 or
12), s or s2 charts are better choices.
x
Chapter 6 25
Introduction to Statistical Quality Control, 7th Edition by Douglas C. Montgomery.
Copyright (c) 2012 John Wiley & Sons, Inc.
Chapter 6 26
Introduction to Statistical Quality Control, 7th Edition by Douglas C. Montgomery.
Copyright (c) 2012 John Wiley & Sons, Inc.
Chapter 6 27
Introduction to Statistical Quality Control, 7th Edition by Douglas C. Montgomery.
Copyright (c) 2012 John Wiley & Sons, Inc.
6.2.4 Interpretation of Control Charts
Chapter 6 28
Introduction to Statistical Quality Control, 7th Edition by Douglas C. Montgomery.
Copyright (c) 2012 John Wiley & Sons, Inc.
Chapter 6 29
Introduction to Statistical Quality Control, 7th Edition by Douglas C. Montgomery.
Copyright (c) 2012 John Wiley & Sons, Inc.
• An assumption in performance properties is that the
underlying distribution of quality characteristic is normal
– If underlying distribution is not normal, sampling distributions can be
derived and exact probability limits obtained
• Burr (1967) notes the usual normal theory control limits are
very robust to normality assumption
• Schilling and Nelson (1976) indicate that in most cases,
samples of size 4 or 5 are sufficient to ensure reasonable
robustness to normality assumption for chart
• Sampling distribution of R is not symmetric, thus symmetric
3-sigma limits are an approximation and -risk is not 0.0027.
R chart is more sensitive to departures from normality than
chart.
• Assumptions of normality and independence are not a primary
concern in phase I
x
x
6.2.5 The Effect of Non-normality
Chapter 6 30
Introduction to Statistical Quality Control, 7th Edition by Douglas C. Montgomery.
Copyright (c) 2012 John Wiley & Sons, Inc.
6.2.6 The Operating Characteristic Function
Chapter 6 31
Introduction to Statistical Quality Control, 7th Edition by Douglas C. Montgomery.
Copyright (c) 2012 John Wiley & Sons, Inc.
If the shift is 1.0σ and the sample
size is n = 5, then β = 0.75.
Chapter 6 32
Introduction to Statistical Quality Control, 7th Edition by Douglas C. Montgomery.
Copyright (c) 2012 John Wiley & Sons, Inc.
Chapter 6 33
Introduction to Statistical Quality Control, 7th Edition by Douglas C. Montgomery.
Copyright (c) 2012 John Wiley & Sons, Inc.
Chapter 6 34
Introduction to Statistical Quality Control, 7th Edition by Douglas C. Montgomery.
Copyright (c) 2012 John Wiley & Sons, Inc.
Chapter 6 35
Introduction to Statistical Quality Control, 7th Edition by Douglas C. Montgomery.
Copyright (c) 2012 John Wiley & Sons, Inc.
Chapter 6 36
Introduction to Statistical Quality Control, 7th Edition by Douglas C. Montgomery.
Copyright (c) 2012 John Wiley & Sons, Inc.
Chapter 6 37
Introduction to Statistical Quality Control, 7th Edition by Douglas C. Montgomery.
Copyright (c) 2012 John Wiley & Sons, Inc.
Chapter 6 38
Introduction to Statistical Quality Control, 7th Edition by Douglas C. Montgomery.
Copyright (c) 2012 John Wiley & Sons, Inc.
Development of the control limits:
Thius produces the control limits in equation (6.27)
Chapter 6 39
Introduction to Statistical Quality Control, 7th Edition by Douglas C. Montgomery.
Copyright (c) 2012 John Wiley & Sons, Inc.
This produces the control limits in equation (6.28)
Chapter 6 40
Introduction to Statistical Quality Control, 7th Edition by Douglas C. Montgomery.
Copyright (c) 2012 John Wiley & Sons, Inc.
Chapter 6 41
Introduction to Statistical Quality Control, 7th Edition by Douglas C. Montgomery.
Copyright (c) 2012 John Wiley & Sons, Inc.
Chapter 6 42
Introduction to Statistical Quality Control, 7th Edition by Douglas C. Montgomery.
Copyright (c) 2012 John Wiley & Sons, Inc.
Chapter 6 43
Introduction to Statistical Quality Control, 7th Edition by Douglas C. Montgomery.
Copyright (c) 2012 John Wiley & Sons, Inc.
Chapter 6 44
Introduction to Statistical Quality Control, 7th Edition by Douglas C. Montgomery.
Copyright (c) 2012 John Wiley & Sons, Inc.
Chapter 6 45
Introduction to Statistical Quality Control, 7th Edition by Douglas C. Montgomery.
Copyright (c) 2012 John Wiley & Sons, Inc.
Chapter 6 46
Introduction to Statistical Quality Control, 7th Edition by Douglas C. Montgomery.
Copyright (c) 2012 John Wiley & Sons, Inc.
Chapter 6 47
Introduction to Statistical Quality Control, 7th Edition by Douglas C. Montgomery.
Copyright (c) 2012 John Wiley & Sons, Inc.
Chapter 6 48
Introduction to Statistical Quality Control, 7th Edition by Douglas C. Montgomery.
Copyright (c) 2012 John Wiley & Sons, Inc.
Chapter 6 49
Introduction to Statistical Quality Control, 7th Edition by Douglas C. Montgomery.
Copyright (c) 2012 John Wiley & Sons, Inc.
Chapter 6 50
Introduction to Statistical Quality Control, 7th Edition by Douglas C. Montgomery.
Copyright (c) 2012 John Wiley & Sons, Inc.
Chapter 6 51
Introduction to Statistical Quality Control, 7th Edition by Douglas C. Montgomery.
Copyright (c) 2012 John Wiley & Sons, Inc.
Chapter 6 52
Introduction to Statistical Quality Control, 7th Edition by Douglas C. Montgomery.
Copyright (c) 2012 John Wiley & Sons, Inc.
Chapter 6 53
Introduction to Statistical Quality Control, 7th Edition by Douglas C. Montgomery.
Copyright (c) 2012 John Wiley & Sons, Inc.
Chapter 6 54
Introduction to Statistical Quality Control, 7th Edition by Douglas C. Montgomery.
Copyright (c) 2012 John Wiley & Sons, Inc.
Chapter 6 55
Introduction to Statistical Quality Control, 7th Edition by Douglas C. Montgomery.
Copyright (c) 2012 John Wiley & Sons, Inc.
Chapter 6 56
Introduction to Statistical Quality Control, 7th Edition by Douglas C. Montgomery.
Copyright (c) 2012 John Wiley & Sons, Inc.
Average Run Lengths
• Crowder (1987b) showed that
ARL0 of combined individuals
and moving-range chart with
conventional 3-sigma limits is
generally much less than ARL0
(= 370) of standard Shewhart
control chart
• Ability of individuals chart to
detect small shifts is very poor
– Rather than narrowing the 3-
sigma limits, correct approach to
detecting small shifts is a
cumulative-sum or exponentially
weighted moving-average control
chart (Chapter 9)
Chapter 6 57
Introduction to Statistical Quality Control, 7th Edition by Douglas C. Montgomery.
Copyright (c) 2012 John Wiley & Sons, Inc.
Normality
• Borror, Montgomery, and Runger (1999) report that the in-control ARL is
dramatically affected by nonnormal data
• One approach for nonnormal data is to determine control limits for individuals
control chart based on percentiles of correct underlying distribution
– Requires at least 100 and preferably 200 observations
– Transformations can also be useful
Chapter 6 58
Introduction to Statistical Quality Control, 7th Edition by Douglas C. Montgomery.
Copyright (c) 2012 John Wiley & Sons, Inc.
Chapter 6 59
Introduction to Statistical Quality Control, 7th Edition by Douglas C. Montgomery.
Copyright (c) 2012 John Wiley & Sons, Inc.
Chapter 6 60
Introduction to Statistical Quality Control, 7th Edition by Douglas C. Montgomery.
Copyright (c) 2012 John Wiley & Sons, Inc.
Chapter 6 61
Introduction to Statistical Quality Control, 7th Edition by Douglas C. Montgomery.
Copyright (c) 2012 John Wiley & Sons, Inc.
Chapter 6 62
Introduction to Statistical Quality Control, 7th Edition by Douglas C. Montgomery.
Copyright (c) 2012 John Wiley & Sons, Inc.
Chapter 6 63
Introduction to Statistical Quality Control, 7th Edition by Douglas C. Montgomery.
Copyright (c) 2012 John Wiley & Sons, Inc.
Chapter 6 64
Introduction to Statistical Quality Control, 7th Edition by Douglas C. Montgomery.
Copyright (c) 2012 John Wiley & Sons, Inc.
Chapter 6 65
Introduction to Statistical Quality Control, 7th Edition by Douglas C. Montgomery.
Copyright (c) 2012 John Wiley & Sons, Inc.
Learning Objectives

1624697595.pdf statistical quality control

  • 1.
    Chapter 6 1 Introductionto Statistical Quality Control, 7th Edition by Douglas C. Montgomery. Copyright (c) 2012 John Wiley & Sons, Inc.
  • 2.
    Chapter 6 2 Introductionto Statistical Quality Control, 7th Edition by Douglas C. Montgomery. Copyright (c) 2012 John Wiley & Sons, Inc. Learning Objectives
  • 3.
    Chapter 6 3 Introductionto Statistical Quality Control, 7th Edition by Douglas C. Montgomery. Copyright (c) 2012 John Wiley & Sons, Inc.
  • 4.
    Chapter 6 4 Introductionto Statistical Quality Control, 7th Edition by Douglas C. Montgomery. Copyright (c) 2012 John Wiley & Sons, Inc.
  • 5.
    Chapter 6 5 Introductionto Statistical Quality Control, 7th Edition by Douglas C. Montgomery. Copyright (c) 2012 John Wiley & Sons, Inc. Subgroup Data with Unknown  and 
  • 6.
    Chapter 6 6 Introductionto Statistical Quality Control, 7th Edition by Douglas C. Montgomery. Copyright (c) 2012 John Wiley & Sons, Inc.
  • 7.
    Chapter 6 7 Introductionto Statistical Quality Control, 7th Edition by Douglas C. Montgomery. Copyright (c) 2012 John Wiley & Sons, Inc.
  • 8.
    Chapter 6 8 Introductionto Statistical Quality Control, 7th Edition by Douglas C. Montgomery. Copyright (c) 2012 John Wiley & Sons, Inc.
  • 9.
    Chapter 6 9 Introductionto Statistical Quality Control, 7th Edition by Douglas C. Montgomery. Copyright (c) 2012 John Wiley & Sons, Inc.
  • 10.
    Chapter 6 10 Introductionto Statistical Quality Control, 7th Edition by Douglas C. Montgomery. Copyright (c) 2012 John Wiley & Sons, Inc. Phase I Application of and R Charts • Eqns 6.4 and 6.5 are trial control limits – Determined from m initial samples • Typically 20-25 subgroups of size n between 3 and 5 – Any out-of-control points should be examined for assignable causes • If assignable causes are found, discard points from calculations and revise the trial control limits • Continue examination until all points plot in control • Adopt resulting trial control limits for use • If no assignable cause is found, there are two options 1. Eliminate point as if an assignable cause were found and revise limits 2. Retain point and consider limits appropriate for control – If there are many out-of-control points they should be examined for patterns that may identify underlying process problems x
  • 11.
    Chapter 6 11 Introductionto Statistical Quality Control, 7th Edition by Douglas C. Montgomery. Copyright (c) 2012 John Wiley & Sons, Inc. Example 6.1 The Hard Bake Process
  • 12.
    Chapter 6 12 Introductionto Statistical Quality Control, 7th Edition by Douglas C. Montgomery. Copyright (c) 2012 John Wiley & Sons, Inc.
  • 13.
    Chapter 6 13 Introductionto Statistical Quality Control, 7th Edition by Douglas C. Montgomery. Copyright (c) 2012 John Wiley & Sons, Inc.
  • 14.
    Chapter 6 14 Introductionto Statistical Quality Control, 7th Edition by Douglas C. Montgomery. Copyright (c) 2012 John Wiley & Sons, Inc.
  • 15.
    Chapter 6 15 Introductionto Statistical Quality Control, 7th Edition by Douglas C. Montgomery. Copyright (c) 2012 John Wiley & Sons, Inc.
  • 16.
    Chapter 6 16 Introductionto Statistical Quality Control, 7th Edition by Douglas C. Montgomery. Copyright (c) 2012 John Wiley & Sons, Inc.
  • 17.
    Chapter 6 17 Introductionto Statistical Quality Control, 7th Edition by Douglas C. Montgomery. Copyright (c) 2012 John Wiley & Sons, Inc. Revision of Control Limits and Center Lines • Effective use of control charts requires periodic review and revision of control limits and center lines • Sometimes users replace the center line on the chart with a target value • When R chart is out of control, out-of-control points are often eliminated to recompute a revised value of which is used to determine new limits and center line on R chart and new limits on chart x x R
  • 18.
    Chapter 6 18 Introductionto Statistical Quality Control, 7th Edition by Douglas C. Montgomery. Copyright (c) 2012 John Wiley & Sons, Inc. Phase II Operation of Charts • Use of control chart for monitoring future production, once a set of reliable limits are established, is called phase II of control chart usage (Figure 6.4) • A run chart showing individuals observations in each sample, called a tolerance chart or tier diagram (Figure 6.5), may reveal patterns or unusual observations in the data
  • 19.
    Chapter 6 19 Introductionto Statistical Quality Control, 7th Edition by Douglas C. Montgomery. Copyright (c) 2012 John Wiley & Sons, Inc.
  • 20.
    Chapter 6 20 Introductionto Statistical Quality Control, 7th Edition by Douglas C. Montgomery. Copyright (c) 2012 John Wiley & Sons, Inc.
  • 21.
    Chapter 6 21 Introductionto Statistical Quality Control, 7th Edition by Douglas C. Montgomery. Copyright (c) 2012 John Wiley & Sons, Inc.
  • 22.
    Chapter 6 22 Introductionto Statistical Quality Control, 7th Edition by Douglas C. Montgomery. Copyright (c) 2012 John Wiley & Sons, Inc. Control vs. Specification Limits • Control limits are derived from natural process variability, or the natural tolerance limits of a process • Specification limits are determined externally, for example by customers or designers • There is no mathematical or statistical relationship between the control limits and the specification limits
  • 23.
    Chapter 6 23 Introductionto Statistical Quality Control, 7th Edition by Douglas C. Montgomery. Copyright (c) 2012 John Wiley & Sons, Inc. Rational Subgroups • charts monitor between-sample variability • R charts measure within-sample variability • Standard deviation estimate of  used to construct control limits is calculated from within-sample variability • It is not correct to estimate  using x
  • 24.
    Chapter 6 24 Introductionto Statistical Quality Control, 7th Edition by Douglas C. Montgomery. Copyright (c) 2012 John Wiley & Sons, Inc. Guidelines for Control Chart Design • Control chart design requires specification of sample size, control limit width, and sampling frequency – Exact solution requires detailed information on statistical characteristics as well as economic factors – The problem of choosing sample size and sampling frequency is one of allocating sampling effort • For chart, choose as small a sample size is consistent with magnitude of process shift one is trying to detect. For moderate to large shifts, relatively small samples are effective. For small shifts, larger samples are needed. • For small samples, R chart is relatively insensitive to changes in process standard deviation. For larger samples (n > 10 or 12), s or s2 charts are better choices. x
  • 25.
    Chapter 6 25 Introductionto Statistical Quality Control, 7th Edition by Douglas C. Montgomery. Copyright (c) 2012 John Wiley & Sons, Inc.
  • 26.
    Chapter 6 26 Introductionto Statistical Quality Control, 7th Edition by Douglas C. Montgomery. Copyright (c) 2012 John Wiley & Sons, Inc.
  • 27.
    Chapter 6 27 Introductionto Statistical Quality Control, 7th Edition by Douglas C. Montgomery. Copyright (c) 2012 John Wiley & Sons, Inc. 6.2.4 Interpretation of Control Charts
  • 28.
    Chapter 6 28 Introductionto Statistical Quality Control, 7th Edition by Douglas C. Montgomery. Copyright (c) 2012 John Wiley & Sons, Inc.
  • 29.
    Chapter 6 29 Introductionto Statistical Quality Control, 7th Edition by Douglas C. Montgomery. Copyright (c) 2012 John Wiley & Sons, Inc. • An assumption in performance properties is that the underlying distribution of quality characteristic is normal – If underlying distribution is not normal, sampling distributions can be derived and exact probability limits obtained • Burr (1967) notes the usual normal theory control limits are very robust to normality assumption • Schilling and Nelson (1976) indicate that in most cases, samples of size 4 or 5 are sufficient to ensure reasonable robustness to normality assumption for chart • Sampling distribution of R is not symmetric, thus symmetric 3-sigma limits are an approximation and -risk is not 0.0027. R chart is more sensitive to departures from normality than chart. • Assumptions of normality and independence are not a primary concern in phase I x x 6.2.5 The Effect of Non-normality
  • 30.
    Chapter 6 30 Introductionto Statistical Quality Control, 7th Edition by Douglas C. Montgomery. Copyright (c) 2012 John Wiley & Sons, Inc. 6.2.6 The Operating Characteristic Function
  • 31.
    Chapter 6 31 Introductionto Statistical Quality Control, 7th Edition by Douglas C. Montgomery. Copyright (c) 2012 John Wiley & Sons, Inc. If the shift is 1.0σ and the sample size is n = 5, then β = 0.75.
  • 32.
    Chapter 6 32 Introductionto Statistical Quality Control, 7th Edition by Douglas C. Montgomery. Copyright (c) 2012 John Wiley & Sons, Inc.
  • 33.
    Chapter 6 33 Introductionto Statistical Quality Control, 7th Edition by Douglas C. Montgomery. Copyright (c) 2012 John Wiley & Sons, Inc.
  • 34.
    Chapter 6 34 Introductionto Statistical Quality Control, 7th Edition by Douglas C. Montgomery. Copyright (c) 2012 John Wiley & Sons, Inc.
  • 35.
    Chapter 6 35 Introductionto Statistical Quality Control, 7th Edition by Douglas C. Montgomery. Copyright (c) 2012 John Wiley & Sons, Inc.
  • 36.
    Chapter 6 36 Introductionto Statistical Quality Control, 7th Edition by Douglas C. Montgomery. Copyright (c) 2012 John Wiley & Sons, Inc.
  • 37.
    Chapter 6 37 Introductionto Statistical Quality Control, 7th Edition by Douglas C. Montgomery. Copyright (c) 2012 John Wiley & Sons, Inc.
  • 38.
    Chapter 6 38 Introductionto Statistical Quality Control, 7th Edition by Douglas C. Montgomery. Copyright (c) 2012 John Wiley & Sons, Inc. Development of the control limits: Thius produces the control limits in equation (6.27)
  • 39.
    Chapter 6 39 Introductionto Statistical Quality Control, 7th Edition by Douglas C. Montgomery. Copyright (c) 2012 John Wiley & Sons, Inc. This produces the control limits in equation (6.28)
  • 40.
    Chapter 6 40 Introductionto Statistical Quality Control, 7th Edition by Douglas C. Montgomery. Copyright (c) 2012 John Wiley & Sons, Inc.
  • 41.
    Chapter 6 41 Introductionto Statistical Quality Control, 7th Edition by Douglas C. Montgomery. Copyright (c) 2012 John Wiley & Sons, Inc.
  • 42.
    Chapter 6 42 Introductionto Statistical Quality Control, 7th Edition by Douglas C. Montgomery. Copyright (c) 2012 John Wiley & Sons, Inc.
  • 43.
    Chapter 6 43 Introductionto Statistical Quality Control, 7th Edition by Douglas C. Montgomery. Copyright (c) 2012 John Wiley & Sons, Inc.
  • 44.
    Chapter 6 44 Introductionto Statistical Quality Control, 7th Edition by Douglas C. Montgomery. Copyright (c) 2012 John Wiley & Sons, Inc.
  • 45.
    Chapter 6 45 Introductionto Statistical Quality Control, 7th Edition by Douglas C. Montgomery. Copyright (c) 2012 John Wiley & Sons, Inc.
  • 46.
    Chapter 6 46 Introductionto Statistical Quality Control, 7th Edition by Douglas C. Montgomery. Copyright (c) 2012 John Wiley & Sons, Inc.
  • 47.
    Chapter 6 47 Introductionto Statistical Quality Control, 7th Edition by Douglas C. Montgomery. Copyright (c) 2012 John Wiley & Sons, Inc.
  • 48.
    Chapter 6 48 Introductionto Statistical Quality Control, 7th Edition by Douglas C. Montgomery. Copyright (c) 2012 John Wiley & Sons, Inc.
  • 49.
    Chapter 6 49 Introductionto Statistical Quality Control, 7th Edition by Douglas C. Montgomery. Copyright (c) 2012 John Wiley & Sons, Inc.
  • 50.
    Chapter 6 50 Introductionto Statistical Quality Control, 7th Edition by Douglas C. Montgomery. Copyright (c) 2012 John Wiley & Sons, Inc.
  • 51.
    Chapter 6 51 Introductionto Statistical Quality Control, 7th Edition by Douglas C. Montgomery. Copyright (c) 2012 John Wiley & Sons, Inc.
  • 52.
    Chapter 6 52 Introductionto Statistical Quality Control, 7th Edition by Douglas C. Montgomery. Copyright (c) 2012 John Wiley & Sons, Inc.
  • 53.
    Chapter 6 53 Introductionto Statistical Quality Control, 7th Edition by Douglas C. Montgomery. Copyright (c) 2012 John Wiley & Sons, Inc.
  • 54.
    Chapter 6 54 Introductionto Statistical Quality Control, 7th Edition by Douglas C. Montgomery. Copyright (c) 2012 John Wiley & Sons, Inc.
  • 55.
    Chapter 6 55 Introductionto Statistical Quality Control, 7th Edition by Douglas C. Montgomery. Copyright (c) 2012 John Wiley & Sons, Inc.
  • 56.
    Chapter 6 56 Introductionto Statistical Quality Control, 7th Edition by Douglas C. Montgomery. Copyright (c) 2012 John Wiley & Sons, Inc. Average Run Lengths • Crowder (1987b) showed that ARL0 of combined individuals and moving-range chart with conventional 3-sigma limits is generally much less than ARL0 (= 370) of standard Shewhart control chart • Ability of individuals chart to detect small shifts is very poor – Rather than narrowing the 3- sigma limits, correct approach to detecting small shifts is a cumulative-sum or exponentially weighted moving-average control chart (Chapter 9)
  • 57.
    Chapter 6 57 Introductionto Statistical Quality Control, 7th Edition by Douglas C. Montgomery. Copyright (c) 2012 John Wiley & Sons, Inc. Normality • Borror, Montgomery, and Runger (1999) report that the in-control ARL is dramatically affected by nonnormal data • One approach for nonnormal data is to determine control limits for individuals control chart based on percentiles of correct underlying distribution – Requires at least 100 and preferably 200 observations – Transformations can also be useful
  • 58.
    Chapter 6 58 Introductionto Statistical Quality Control, 7th Edition by Douglas C. Montgomery. Copyright (c) 2012 John Wiley & Sons, Inc.
  • 59.
    Chapter 6 59 Introductionto Statistical Quality Control, 7th Edition by Douglas C. Montgomery. Copyright (c) 2012 John Wiley & Sons, Inc.
  • 60.
    Chapter 6 60 Introductionto Statistical Quality Control, 7th Edition by Douglas C. Montgomery. Copyright (c) 2012 John Wiley & Sons, Inc.
  • 61.
    Chapter 6 61 Introductionto Statistical Quality Control, 7th Edition by Douglas C. Montgomery. Copyright (c) 2012 John Wiley & Sons, Inc.
  • 62.
    Chapter 6 62 Introductionto Statistical Quality Control, 7th Edition by Douglas C. Montgomery. Copyright (c) 2012 John Wiley & Sons, Inc.
  • 63.
    Chapter 6 63 Introductionto Statistical Quality Control, 7th Edition by Douglas C. Montgomery. Copyright (c) 2012 John Wiley & Sons, Inc.
  • 64.
    Chapter 6 64 Introductionto Statistical Quality Control, 7th Edition by Douglas C. Montgomery. Copyright (c) 2012 John Wiley & Sons, Inc.
  • 65.
    Chapter 6 65 Introductionto Statistical Quality Control, 7th Edition by Douglas C. Montgomery. Copyright (c) 2012 John Wiley & Sons, Inc. Learning Objectives