SlideShare a Scribd company logo
1 of 121
Download to read offline
Report No: AUS4531
.
Republic of Indonesia
Inequality and Shared Prosperity
Indonesia’s Rising Divide: why inequality is rising, why it matters and what
can be done
.
June 2015
.
GPVDR
EAST ASIA AND PACIFIC
.
.
2
Standard Disclaimer:
This volume is a product of the staff of the International Bank for Reconstruction and Development/ The World Bank. The findings, interpretations,
and conclusions expressed in this paper do not necessarily reflect the views of the Executive Directors of The World Bank or the governments they
represent. The World Bank does not guarantee the accuracy of the data included in this work. The boundaries, colors, denominations, and other
information shown on any map in this work do not imply any judgment on the part of The World Bank concerning the legal status of any territory
or the endorsement or acceptance of such boundaries.
.
Copyright Statement:
The material in this publication is copyrighted. Copying and/or transmitting portions or all of this work without permission may be a violation of
applicable law. The International Bank for Reconstruction and Development/ The World Bank encourages dissemination of its work and will
normally grant permission to reproduce portions of the work promptly.
For permission to photocopy or reprint any part of this work, please send a request with complete information to the Copyright Clearance Center,
Inc., 222 Rosewood Drive, Danvers, MA 01923, USA, telephone 978-750-8400, fax 978-750-4470, http://www.copyright.com/.
All other queries on rights and licenses, including subsidiary rights, should be addressed to the Office of the Publisher, The World Bank, 1818 H
Street NW, Washington, DC 20433, USA, fax 202-522-2422, e-mail pubrights@worldbank.org.
Indonesia’s
Rising Divide
Why inequality is rising, why it matters
and what can be done
June 2015, World Bank
4
THE WORLD BANK OFFICE JAKARTA
Indonesia Stock Exchange Building Tower II/12th Floor
Jl. Jend. Sudirman Kav. 52-53
Jakarta 12910
Tel: (6221) 5299-3000
Fax: (6221) 5299-3111
Website: www.worldbank.org/id
THE WORLD BANK
1818 H Street NW
Washington, DC 20433, USA
Tel: (202) 458-1876
Fax: (202) 522-1557/1560
Website: www.worldbank.org
Printed in June 2015
The Targeting Poor and Vulnerable Households in Indonesia report is a product of the staff of the World Bank.
The findings, interpretations, and conclusions expressed herein do not necessarily reflect the views of the
Board of Executive Directors of the World Bank or the Government they represent.
The World Bank does not guarantee the accuracy of the data included in this work. The boundaries, colors,
denominations, and other information shown on any map in this work do not imply any judgment on the part
of the World Bank concerning the legal status of any territory or the endorsement or acceptance of such
boundaries.
For any questions regarding this report, please contact Vivi Alatas (valatas@worldbank.org) and Matthew Wai-
Poi (mwaipoi@worldbank.org).
5
Foreword
6
Acknowledgements
Divided Indonesia is a product of the Poverty Global Practice’s team in the World Bank Office Jakarta.
The team, led by Vivi Alatas (Lead Economist, GPVDR), provides technical and policy advice based on
sound empirical research and analysis to the Government of Indonesia in support of national poverty
reduction goals. Support for this report has been generously provided by the Department of Foreign
Affairs and Trade of the Australian Embassy.
This report was prepared by a core team led by Matthew Wai-Poi (Lead Economist, GPVDR) based
on a series of background papers and presentations. The background paper on the Distributional
Impact of Fiscal Policy in Indonesia was written by Rythia Afkar (Consultant, GPVDR), Jon Jellema
(Consultant, GPVDR) and Matthew Wai-Poi; on the Inequality of Opportunity by Grace Hadiwidjaja
(Consultant, GPVDR), Ray Hervandi (Consultant, GPVDR) and Matthew Wai-Poi; and on Perceptions
of Opportunity by Taufik Indrakesuma (Consultant, GPVDR) with the guidance of Edgar Janz (Senior
Knowledge Management Specialist, GPVDR) and Matthew Wai-Poi. Background presentations were
developed on Top Incomes in Indonesia by Michaelino Mervisiano (Consultant, GPVDR), Matthew
Wai-Poi, Monica Wihardja (Consultant, GPVDR) and Dody Suria Wijaya (Consultant, GPVDR); on
Indonesia’s Middle Class by Ririn Purnamasari (Economist, GPVDR), Ikuko Uochi (Consultant, GPVDR)
and Matthew Wai-Poi; on Inequality of Outcomes by Amri Ilmma (Research Analyst, GPVDR), Taufik
Hidayat (Consultant, GPVDR) and Matthew Wai-Poi. Additional contributions were made by Edgar
Janz, Mattia Makovec (Consultant, GPVDR), Michaelino Mervisiano, Astrid Rengganis Savitri
(Consultant, GPVDR), Imam Setiawan (Consultant, GPVDR), and Bagus Arya Wirapati (Consultant,
GPVDR). The report was edited by Edgar Janz.
Excellent comments were received from Peer Reviewers Luis-Felipe Lopez-Calvo (Lead Economist,
GPVDR), Caterina Laderchi (Senior Economist, GPVDR), Hal Hill (H.W. Arndt Professor of Southeast
Asian Economies, Australian National University), as well as from Chantelle Boudreaux (Consultant,
GHNDR), Melissa Chew (Consultant, GHNDR), David Gottlieb (Department of Foreign Affairs and
Trade, Australian Embassy), Pandu Harimurti (Health Specialist, GHNDR), Ahya Ihsan (Economist,
GMFDR), Yue Man Lee (Economist, GMFDR), Norman Loazya (Lead Economist, DECMG), Neil
McCulloch (Director, Economic Policy Program, Oxford Policy Management), Puti Marzoeki (Senior
Health Specialist, GHNDR), Iene Muliati (Social Protection Specialist, GSPDR), Arvind Nair
(Consultant, GMFDR), Truman Packard (Lead Economist, GSPDR), Eko Setyo Pambudi (Research
Analyst, GHNDR), Samer al-Samarrai (Senior Economist, GEDDR), Ali Winoto Subandoro (Health
Specialist, GHNDR), Ajay Tandon (Senior Economist, GHNDR) Violeta Vulovic (Consultant, GMFDR),
Mitch Wiener (Senior Social Protection Specialist, GSPDR), Rob Wrobel (Senior Social Development
Specialist, GSURR), Wei Aun Yap (Consultant, GHNDR). This report has benefited greatly from these.
Editing assistance was provided by Taufik Indrakesuma and Edgar Janz.
This report was produced under the overall guidance of Shubham Chaudhuri (Practice Manager,
GMFDR), Ana Revenga (Senior Director, GPVDR), Carlos Silva-Jaurequi (Lead Economist, GPVDR) and
Salman Zaidi (Practice Manager, GPVDR). Strategic guidance and key comments were provided by
Rodrigo Chaves (Country Director, EACIF), Ndiame Diop (Lead Economist, GMFDR) and Cristobal
Ridao-Cano (Program Leader, EACIF).
The report draws from joint work on fiscal incidence with a team from the Fiscal Policy Office, led by
Luky Alfirman (Head of Macroeconomic Policy Center, PKEM-BKF)and including Arti Dyah Woroutami
(Head of Welfare and Labor Sub-division of PKEM-BKF) and Ahmad Fikri Aulia (Executive of Welfare
and Labor Sub-division of PKEM-BKF). The fiscal incidence work adopts the Commitment to Equity
approach. Launched in 2008, the Commitment to Equity (CEQ) project is an initiative of the Center
for Inter-American Policy and Research (CIPR) and the Department of Economics, Tulane University,
the Center for Global Development and the Inter-American Dialogue. Developed by Nora Lustig and
her team at Tulane University, the Commitment to Equity diagnostic tool relies on a comprehensive
7
fiscal incidence analysis designed to assess how taxation and public expenditures affect income
inequality, poverty, and different socioeconomic groups. For more details, see
http://www.commitmentoequity.org.
The report also draws on joint work on top incomes in Indonesia, done in collaboration with Luky
Alfirman of the Fiscal Policy Office and Bank Indonesia. The Bank Indonesia team includes N.A.
Anggini Sari (Deputy Director, Division Head, Credit Information Regulation, Licensing, and
Development Division, Reporting Management and Compliance Department), Sani Eka Duta
(Assistant Director, Credit Information Division, Reporting Management and Compliance
Department) and Darma Saputra (Reporting Management and Compliance Department)
The perceptions data used in this report and the perceptions background paper were kindly
provided by Lembaga Survei Indonesia (Indonesian Survey Institute).
8
Contents
Foreword.................................................................................................................................................5
Acknowledgements.................................................................................................................................6
Figures.....................................................................................................................................................9
Tables....................................................................................................................................................12
Boxes.....................................................................................................................................................12
Executive Summary...............................................................................................................................13
1. Rising Inequality: Recent Trends and why it Matters ...................................................................36
1.1. Recent trends in inequality...................................................................................................36
1.2. Does inequality matter?........................................................................................................41
2. Why Inequality is Rising ................................................................................................................44
2.1. A framework for understanding inequality ..........................................................................44
2.2. Why an unfair start in life holds the poor back ....................................................................49
2.1.1 A significant degree of overall inequality is explained by circumstances at birth........49
2.1.2 An unfair start begins with differences in child health.................................................51
2.1.3 Changes in fertility patterns are also affecting inequality, both today and tomorrow 58
2.1.4 An unfair start in life continues with differences in skills development and education
62
2.3. Why a widening gap between skilled and unskilled wages is increasing inequality ............69
2.3.1 An increasing demand for and shortage of skilled workers is driving their wages
higher, which benefits those children who got the right start in life ...........................................69
2.3.2 At the same time, most workers are trapped in low paying jobs.................................72
2.3.3 The widening wage gap between few skilled workers and the majority of unskilled
workers is one of the main drivers of increasing inequality in the last decade ...........................76
2.4. Why financial assets are helping the rich pull away from the rest.......................................78
2.5. Why shocks make it even harder for many to catch up .......................................................83
3. How Inequality Can Be Addressed................................................................................................87
3.1. Improving local service delivery, particularly for health, education and family planning....89
3.1.1. Ensuring all children get a fair start in life through quality health care .......................90
3.1.2. Ensuring all children get a fair start in life through quality education .........................94
3.1.3. Revitalizing family planning to help poor households have the family sizes they want
97
3.2. Improving the skills of today’s workforce and providing them more productive jobs.........98
3.2.1. Creating more jobs........................................................................................................98
3.2.2. Improving protection for low-income and vulnerable workers..................................100
3.2.3. Reforming the skills training system to enable workers to access jobs......................101
3.3. Ensuring all households have effective protection from shocks ........................................102
9
2.6.1 Addressing high and volatile rice prices......................................................................102
2.6.2 Strengthening social protection..................................................................................104
2.6.3 Crisis Monitoring and Response: developing a permanent and comprehensive system
107
3.4. Aligning government taxes and spending to better address inequality.............................107
3.4.1 Fiscal policy as a tool to address inequality, now as well as in the future .................107
3.4.2 Spending choices are likely to have the greatest influence on current inequality.....109
3.4.3 Closing the large infrastructure gap can reduce inequality in Indonesia by
strengthening growth, stimulating job, improving access to public services, and lowering food
prices 110
3.4.4 However, fiscal policy needs to remain sustainable...................................................112
3.4.5 The revenue mix used to achieve fiscal sustainability can also influence inequality
today 113
3.5. Most of the recommended policies have broad-based public support as a means of tackling
poverty............................................................................................................................................115
4. Conclusion...................................................................................................................................117
References ..........................................................................................................................................118
Figures
Figure 1.1. Average monthly per capita consumption (IDR) by decile, 2002 and 2014 .......................37
Figure 1.2. Gini coefficient (points) and national poverty rate (percent) 1980-2014 ..........................37
Figure 1.3. Gini coefficient in East Asia, 1990s and 2000s....................................................................38
Figure 1.4. Annualized point change in Gini coefficient in East Asia, 1990s and 2000s.......................38
Figure 1.5. Gini coefficients for lower-middle income countries .........................................................38
Figure 1.6. Population share by class (percent) 2002-14......................................................................39
Figure 1.7. Average conflict incidents for low, medium and high inequality districts..........................42
Figure 1.8. Type of jobs for senior high school graduates....................................................................42
Figure 1.9. Share of national consumption by each quintile: what people think it should be, what
people think it is, what it really is (percent) .........................................................................................43
Figure 2.1. Growth incidence curve by household per capita consumption percentile, 1996-2010 ...44
Figure 2.2. Understanding inequality through an income-generating asset framework with a
reinforcing feedback loop.....................................................................................................................46
Figure 2.3. Percentage of consumption inequality due to differences between and within groups with
different birth circumstances................................................................................................................50
Figure 2.4. Percentage of consumption inequality due to differences between and within groups with
different birth circumstances, by age of birth cohort ..........................................................................50
Figure 2.5. Infant mortality (per 1,000 live births) ...............................................................................51
Figure 2.6. Stunting by country (percent).............................................................................................51
Figure 2.7. Probability of stunting by parents’ education (percent).....................................................52
Figure 2.8. Skilled first ante-natal and post-natal care usage (percent)...............................................52
Figure 2.9. Unskilled deliveries by region (percent) .............................................................................53
Figure 2.10. Unskilled deliveries by per capita consumption decile (percent).....................................53
10
Figure 2.11. Complete immunization rates by different populations (percent)...................................53
Figure 2.12. Age-appropriate breastfeeding by age (percent) .............................................................54
Figure 2.13. Micronutrient intake and deworming by different populations (percent) ......................54
Figure 2.14. Lack of access to clean water and proper sanitation by household per capita
consumption decile (percent)...............................................................................................................54
Figure 2.15. Diarrhea incidence and treatment (percent)....................................................................54
Figure 2.16. Availability of Puskesmas health centers (percent of villages with Puskesmas) and
distance to Puskesmas if not in village (km).........................................................................................55
Figure 2.17. Selected service indicator scores and general service readiness index for Puskesmas by
province, 2011 ......................................................................................................................................56
Figure 2.18. Full immunization rates for children aged 12-23 months by mother’s education (percent
..............................................................................................................................................................57
Figure 2.19. Immunization rates for children based on birth order (percent) .....................................57
Figure 2.20. Urban poverty for housing, water and sanitation ............................................................58
Figure 2.21. Rural poverty for housing, water and sanitation..............................................................58
Figure 2.22. Comparison of actual and counterfactual 2002 Gini if household size in 2002 remained
the same as in 1993 ..............................................................................................................................59
Figure 2.23. Comparison of actual and counterfactual 2014 Gini if household size in 2014 remained
the same as in 2002, and if size continued to decline at the same rate as 1993-2002........................59
Figure 2.24. Years of completed education, 16-18 year olds (percent) ...............................................63
Figure 2.25. Years of completed education, 19-21 year olds (percent) ...............................................63
Figure 2.26. Annual schooling costs by school level (IDR millions).......................................................64
Figure 2.27. Percentage of households with school-aged children receiving a scholarship by
household per capita expenditure deciles............................................................................................64
Figure 2.28. Median monthly incomes of children aged 15-18 years old ............................................64
Figure 2.29. Enrolment of 13-15 year olds by parents’ consumption quintile.....................................65
Figure 2.30. Enrolment of 13-15 year olds by parents’ education .......................................................65
Figure 2.31. Educational attainment probability of children born in the 1960s and 1970s with parents
who did not complete primary, relative to the 1950s cohort (percent) ..............................................65
Figure 2.32. Adult income quintile probability of children born in the 1960s and 1970s with parents
who did not complete primary, relative to the 1950s cohort (percent) ..............................................65
Figure 2.33. ECD enrolment rates for 5-6 year olds by region, gender and income (percent) ............66
Figure 2.34. Probability of 7-14 year old children being in the top or bottom quintile of cognitive
scores by parents’ education (percent)................................................................................................66
Figure 2.35. ECD availability in village (percent) and distance to nearest center if not in village (km)
by region ...............................................................................................................................................67
Figure 2.36. Quality of schooling facilities and teachers (percent) ......................................................67
Figure 2.37. Children who reported reading a text book in the last week (percent)...........................68
Figure 2.38. Children who reported reading a science book in the last week (percent)......................68
Figure 2.39. Employment by education level, 2002-13 (percent) ........................................................69
Figure 2.40. Although the labor force has become more skilled, less than 8% has a university degree
..............................................................................................................................................................70
Figure 2.41. Important skills identified by employers, and skill gaps...................................................70
Figure 2.42. Method for finding job, youth aged 15-24 years old (percent)........................................70
Figure 2.43. Method for finding job, all workers aged 25 years and older (percent)...........................70
Figure 2.44. Youths aged 19-24 years who have attended or competed training course (percent)....71
Figure 2.45. Share of firms providing formal training (percent)...........................................................71
11
Figure 2.46. Annualized wage growth (2001-14) versus sectoral productivity (2012 annual value
added per worker, IDR millions) ...........................................................................................................71
Figure 2.47. Share of total employment, 2014.....................................................................................72
Figure 2.48. Employment growth and labor productivity growth are negatively correlated
(employment and labor productivity growth by sector 2001-2012, percent)......................................72
Figure 2.49. Dependent employment is on the rise, but most workers are still employed in vulnerable
form of work (employment composition by status, percent) ..............................................................73
Figure 2.50. Low-productivity sectors tend to have higher levels of informality (% of informal workers
by sector, 2012) ....................................................................................................................................73
Figure 2.51. Labor market legislation index across countries ..............................................................74
Figure 2.52. Minimum wages in selected East Asian countries (USD per month)................................76
Figure 2.53. Worker wage premium over those with primary education or less, 2003-10 (percent)..77
Figure 2.54. Household per capita consumption premium over those with head of household primary
education or less, 2003-10 (percent)....................................................................................................77
Figure 2.55. Primary wage Gini coefficient, 2000-13............................................................................78
Figure 2.56. Labor share of income, 10 year change (percentage points) ...........................................79
Figure 2.57. Labor share of Indonesian manufacturing income (percent)...........................................79
Figure 2.58. Jakarta Composite Index, 1997-2014................................................................................79
Figure 2.59. Jakarta residential condominium market.........................................................................79
Figure 2.60. Change in share of total wealth held by richest 10 percent of households (percentage
points)...................................................................................................................................................80
Figure 2.61. Share of total wealth held by richest 10 percent of households (percent)......................81
Figure 2.62. Growth incidence curve, 1993-2014 (annual real per capita consumption growth by
household per capita consumption quintile)........................................................................................82
Figure 2.63. Access to health insurance (percent)................................................................................84
Figure 2.64. Access to pensions (percent) ............................................................................................84
Figure 2.65. The three dimensions of universal health coverage.........................................................85
Figure 2.66. CPI and CPI for the poor, 2002-13 ....................................................................................85
Figure 2.67. CPI poor (food) and CPI poor (non-food), 2002-13...........................................................85
Figure 2.68. Poverty and vulnerability rates in Indonesia, 2014 (percent) ..........................................86
Figure 2.69. Proportion of poor who were poor the year before ........................................................86
Figure 3.1. Growth incidence curve, Thailand 2000-06........................................................................88
Figure 3.2. Growth incidence curve, Thailand 2006-10........................................................................88
Figure 3.3. Growth incidence curve, Vietnam 2004-12 ........................................................................88
Figure 3.4. Growth incidence curve, Brazil 2001-09.............................................................................88
Figure 3.5. Public health spending (percent of GDP and out-of-pocket spending (percent of total
health spending) internationally...........................................................................................................90
Figure 3.6. Changes in real health expenditure (percent, 2003-11) and change in birth by skilled
attendant (percent, 2003-11) ...............................................................................................................91
Figure 3.7. Changes in real health expenditure (percent, 2003-11) and change in immunization
coverage (percent, 2003-11).................................................................................................................91
Figure 3.8. Receipt of severance pay, as reported by workers (percent)...........................................100
Figure 3.9. Employees receiving less than minimum wage by consumption quintile (percent)........100
Figure 3.10. Reduction in the Gini Coefficient through fiscal policy, selected countries (Gini points)
............................................................................................................................................................108
Figure 3.11. Inequality reducing effectiveness (EI) and government spending on different programs
and policies, 2012 ...............................................................................................................................109
Figure 3.12. Incidence of indirect taxes in selected countries (percent of market income) ..............114
12
Tables
Table 2.1. Average household size by per capita consumption decile, 1993 and 2002 .......................59
Table 2.2. Average household size by per capita consumption decile, 2002 and 2014 .......................59
Table 2.3. Oral reading fluency advantages based on ECD participation, location and wealth (words
per minute faster than reference)........................................................................................................67
Table 2.4. Ease of doing business in East Asia Pacific...........................................................................75
Table 2.5. Change in consumption Gini 2003-10 decomposed, percentage of change explained.......78
Table 2.6. Household income mobility matrix, 1993-2007...................................................................86
Table 3.1. Drivers of inequality, based on the income-generating asset model ..................................87
Table 3.2 Drivers of inequality and possible tools to address them.....................................................89
Table 3.3. Costs and funding in DKI Jakarta to reach different education standards...........................96
Table 3.4. Providing opportunities for hard work, protecting people from shocks, and eradicating
corruption are seen as top priorities for reducing inequality.............................................................115
Boxes
Box 1.1. Measuring inequality ..............................................................................................................40
Box 2.1. Understanding inequality with growth incidence curves .......................................................45
Box 2.2. Putri is poor with limited assets and low returns ...................................................................48
Box 2.3. Fitri is an emerging consumer with minor asset accumulation..............................................48
Box 2.4. Dewi is an economically secure consumer with improving assets.........................................49
Box 2.5. Siti is upper class with many assets and high returns................ Error! Bookmark not defined.
Box 2.6: Strategic and emerging issues for family planning in Indonesia.............................................61
Box 2.7. Increasing inequality: not just the commodity boom.............................................................82
Box 3.1. Recent reforms in DKI Jakarta show how BOSDA can complement BOS to help schools reach
higher quality standards, support schools in disadvantaged areas, and encourage higher
performance .........................................................................................................................................96
Box 3.2. A public works program for Indonesia..................................................................................106
Box 3.3. Improving infrastructure in Indonesia ..................................................................................111
Box 3.4. Achieving fiscal sustainability: priority actions .....................................................................112
13
Executive Summary
In 2015, Indonesia stands as a divided country, unequal in many ways. There is an income divide
between the richest 10 percent and the rest of the country. This inequality comes about because of
the many other inequalities in Indonesia. People are divided into the haves and have-nots from
before birth. Some children are born healthy and grow up well in their early years; many do not.
Some children go to school and get a quality education; many do not. This means that some young
adults enter the workforce with the right skills that are increasingly needed and rewarded in today’s
modern and dynamic economy; most do not and are trapped in low productivity and low wage jobs.
Some families have access to mechanisms which can protect them from the many shocks which
occur in life; many do not. And a small number of Indonesians have access to financial assets which
increase their wealth over time. This wealth is passed down to their children, both as money and
through health and education. And inequalities are passed on to the next generation, where they are
deepening.
This report asks why inequality is increasing, why it matters, and what can be done. The first
section examines the trend in inequality, which is already relatively high in Indonesia and rising more
quickly than in many other places. It also discusses why it matters; some inequality is good,
providing rewards for hard work and innovation, but when inequality is too high it can be bad for
economic growth, slow poverty reduction, and undermine social harmony. The second section seeks
to understand what the drivers of rising inequality are. Why are not more children growing up
healthy and leaving school with the right skills when there are more schools and health centers than
ever? Why are workers unable to move to more productive jobs where they could get paid more?
How do shocks prevent many hardworking Indonesians from climbing up the economic ladder? And
why might the increasing concentration of wealth in a few hands be both driving inequality higher
today and tomorrow? The final section looks at what can be done if the country is not to grow ever
more divided; a relatively few people living in one Indonesia where they are healthy, happy and
prosperous, and many more living in another Indonesia, aspiring to a better life but unable to attain
it.
I. Trends in Inequality in Indonesia
Inequality has been increasing with most of the economic growth being enjoyed by relatively
few
Inequality in Indonesia is rising rapidly. By most measures, inequality in Indonesia has reached
historically high levels. In 2002, the richest 10 percent of Indonesians consumed as much as the
poorest 42 percent combined; by 2014, they consumed as much the poorest 54 percent. A popular
measure of inequality is the Gini coefficient, where 0 is complete equality and 100 is complete.
During the Asian Financial Crisis, poverty went up sharply while the Gini fell; everyone was affected,
but the richest lost the most. However, since then the Gini has increased from 30 points in 2000 to
41 points in 2014, its highest recorded level. Even this, however, is likely to be underestimated
because household surveys tend to miss out the richest households. Once relatively moderate by
international standards, Indonesia’s level of inequality is now becoming high and climbing faster
than most of its East Asian neighbors.
14
After a long period of stability, the Gini began
rising, then fell with the Asian Financial Crisis,
before rising sharply since recovery.
Gini coefficient (points) and national poverty rate (percent)
1980-2014
The increase in the Gini in Indonesia over the last
two decades is one of the highest in the region.
Gini coefficient in East Asia, 1990s and 2000s
Source: BPS, Susenas and World Bank calculations
Note: Nominal consumption Gini. The national poverty
line was changed in 1998, and the 1996 rate calculated
under both the new and old methodologies.
Note: Consumption Ginis for all countries except Malaysia,
which uses income. The periods for each country are:
Indonesia 1990-2011; Malaysia 1992-2009; Lao PDR 1992-
2008; China 1990-2008; Vietnam 1992-2008; Thailand
1990-2009; the Philippines 1991-2009; and Cambodia
1994-2008.
Source: Kanbur, Rhee and Zhuang (2014) Inequality in Asia
and the Pacific, from PovCalNet.
Fifteen years of sustained growth has reduced poverty and created a growing class of
economically secure households. After recovering from the 1997-98 Asian Financial Crisis,
Indonesia’s real GDP per capita grew at an annual average of 5.4 percent between 2000 and 2014.
This growth helped to pull many out of poverty; the poverty rate has more than halved from 24
percent during the crisis down to 11 percent by 2014. Growth has also helped create a stronger
consumer class than ever before; there are now 45 million people (the richest 18 percent of all
Indonesians) who are economically secure and enjoying a higher quality of life. They are the fastest
growing segment of the population, increasing at 10 percent per year since 2002.1
However, the economically secure are now leaving the other 205 million behind. The benefits of
economic growth have been enjoyed largely by the growing consumer class. Between 2003 and
2010, consumption per person for the richest 10 percent of Indonesians grew at over six percent per
year after adjusting for inflation, but grew at less than two percent per year for the poorest 40
percent. This has contributed both to a slow-down in the pace of poverty, with the number of poor
people falling by only 2 percent per year since 2002, and the numbers of those vulnerable to poverty
falling barely at all.
1
For this report, households in the consumer class in Indonesia are defined as those who are economically
secure from poverty and vulnerability. See note to chart and World Bank (forthcoming (a)) for more details.
0
5
10
15
20
25
30
35
40
45
1980
1983
1986
1989
1992
1995
1998
2001
2004
2007
2010
2013
Gini Poverty (old) Poverty (new)
Suharto
Era
Asian
Financial
Crisis
Democracy,
Decentrali-zation
and Commodity
Boom
GFC and
Aftermath
0
10
20
30
40
50
60 1990s 2000s
15
An economically secure “consumer” class has grown strongly at 10 percent per year since 2002, and now
includes nearly one in five Indonesians. However, reductions in poverty and vulnerability have been very
small.
Population share by class (percent) 2002-14
Source: Susenas and World Bank calculations. The poor are below the national poverty line of around IDR
300,000 per person per month. The vulnerable have a greater than 10 percent chance of being poor the
next year and are under 1.5 times the poverty line. The consumer class are economically secure, with a less
than 10 percent chance of being poor or vulnerable next year, and consume more than IDR 1m per person
per month. The emerging consumer class are safe from poverty but not vulnerability and lie between the
vulnerability and economic security lines. See World Bank (forthcoming (a)) for more details.
II. Why Inequality Matters
Income inequality can be unfair when not everyone has the same initial opportunities
Income inequality is not always a bad thing; it can provide rewards for those who work hard and
take risks. Hard work and innovation benefit society by creating new goods and services that
everyone can enjoy, as well as contributing to a larger economy. This, in turn, can provide the
government with a greater ability to provide public services to all. If this results in a gap between
those hard workers and those who work less hard, then some income inequality may be justified and
even desirable. Many Indonesians share this view. When asked in a 2014 survey whether inequality
is ever acceptable, 74 percent said that “inequality is sometimes acceptable” so long as wealth
acquisition was fair and meritocratic.
Inequality can be unfair, however, when it is due to factors beyond the control of individuals.
There are many inequalities. There are economic inequalities of income, wealth and consumption.
There are also inequalities of opportunities, when not everyone has access to the same
opportunities in life. Factors beyond the control of an individual – where you are born, how
educated or wealthy your parents are, and what access to public services you had when you were
growing up – can have a major influence on how your life turns out. Getting a healthy start in life
and a quality education are fundamental prerequisites for getting a good job and earning a decent
living in the future. When economic inequality arises because of Inequality of opportunity, when not
everyone has a fair start in life, it is unfair. Other factors outside of an individual’s control which can
affect incomes, standard of living and inequality include government policies, such as food import
restrictions which increase the cost of living most for the poor, or patterns of government taxes and
spending which do not collect and channel sufficient resources to help the poor and vulnerable or
those without equal access.
0
20
40
60
80
100
2002 2006 2010 2014
Consumer Class
Emerging Consumer Class
Vulnerable
Poor
10.0
Annual Growth* (%)
2.4
-0.1
-2.2
16
High inequality can also lead to slower growth and poverty reduction and increased conflict
High levels of inequality may slow economic growth, while more equal countries may grow faster.
High inequality may reduce economic growth for all, if poorer people are unable to properly invest in
their children’s development, if people fail to exit poverty and vulnerability and move into the
consumer class, and if people fail to get productive jobs. Recent research indicates that a higher Gini
leads to lower and less stable growth. Moreover, when the share of total income held by the richest
20 percent of people increases by 5 percentage points, economic growth falls by 0.4 percentage
points. At the same time, when the share of total income held by the poorest 20 percent of people
increases by 5 percentage points, growth increases by 1.9 percentage points. Increased income
shares for the second and third poorest 20 percent also increases growth.
High inequality can also have social costs. When people perceive that there are large differences in
income and wealth, it can create social tensions and disharmony, which can in turn create conflict.
Indeed, districts with higher levels of inequality than the average in Indonesia have 1.6 times the
rates of conflict than districts with lower levels of inequality. Conflict in turn can reduce economic
growth through labor disruptions and lower investment. Furthermore, if inequality is due to rent-
seeking behavior – people trying to capture existing resources without generating new wealth
through productive activity – then this also has costs; individuals seek favorable treatment and
protection of their position, leading to misallocation of resources, corruption and nepotism, all of
which have high social and economic costs, including a loss of confidence in public institutions.
In fact, in Indonesians already think inequality is too high. People surveyed estimate, on average,
that the richest fifth of Indonesians account for 38 percent of all consumption. Actually, inequality is
even higher than they think: national data indicate that the richest fifth really enjoy 49 percent of all
household consumption. On average, respondents indicated a preference for a more equal country,
where the richest fifth only account for 28 percent of consumption. They may not know, however,
that this ideal would make Indonesia more equal than almost all other countries in the world.
Not only do surveyed Indonesians believe inequality should be lower than it is now, in reality it is even
higher than they think it currently is.
Share of national consumption by each quintile: what people think it should be, what people think it is, what it really is
(percent)
Source: World Bank (2015a) using LSI (2014) data
0 10 20 30 40 50 60 70 80 90 100
What it actually is
What they think it is
What they think it should be
Poorest Quintile 2 3 4 Richest Quintile
17
Given the high level of inequality in Indonesia and public concern, the consequences of doing
nothing could be serious; urgent action is needed
Given this perception, most Indonesians think that urgent action is needed, which is why
inequality has become a major public issue. Inequality was a key issue in the run-up to the
Indonesian presidential elections, with major national and international media outlets reporting on
rising inequality and both presidential candidates making public statements about strategies to
reduce inequality. They have the support of the public; 47 percent of those surveyed said it was
“very urgent” for the government to address inequality, and another 41 percent thought it was
“quite urgent.”
Taking action will require a better understanding of why inequality is rising, whether this matters,
and what can be done about it. The World Bank initiated a research project to examine inequality
and its drivers in Indonesia. The purpose of the project is to support the Government of Indonesia in
better understanding this emerging issue and be able to make a decision, informed by rigorous
research and evidence, about how to respond. This first section of this summary of the report
examined recent trends in inequality and why these may be concerning. The next section will look
into the reasons why inequality is rising and why a policy response is needed. The third and final
section will consider what government policy makers can do to address increasing inequality.
III. Why Inequality is Rising
To understand what drives inequality in Indonesia and why it is rising, we need to understand how
different households have different resources and how they generate income from them.
Households use different resources to earn income. They use their labor to earn wages and salaries,
but they can also earn income from financial and property assets. Understanding why some
households have better jobs and earn more, and why some households have more financial assets
and earn more, is key to understanding why inequality is rising. Inequality is also influenced by how
this income is spent: how much is consumed (and over how many people is it shared) and how much
saved? In addition, shocks and disasters can suddenly erode household assets and incomes.
18
An income-generating asset framework can help us think about why inequality arises. The framework
includes a reinforcing feedback loop which can transmit inequality over time.
Understanding inequality through an income-generating asset framework with a reinforcing feedback loop
There are four main drivers of inequality in Indonesia that affect both current and future
generations. Applying the framework above, we find that there are four main drivers of inequality in
Indonesia. First, inequality of opportunity means not everyone develops the skills needed to find
well-paying jobs. Second, with an increasing emphasis on skill in the modern economy, the rewards
for those who do get good jobs are increasing, which is driving up wage inequality. At the same time,
those without the skills are getting trapped into informal or low productivity jobs. Third, there are
inequalities in access to wealth that also drive differences in income. Fourth, shocks can affect
inequality at any stage of the framework by eroding a household’s ability to earn an income, save,
and invest in health and education. In the following section we explore each of these drivers.
A. An unequal start to life and the consequences for human resources
A key driver of inequality is that poorer children have an unfair start in life, which
undermines their ability to succeed later in life
Inequality of opportunity from birth can explain a substantial amount of income inequality in later
life. Adult income or consumption inequality is unfair when it is driven by inequality of opportunities
when they were young: the conditions that children are born into and have no ability to change.
One-third of all consumption inequality in Indonesia is due to a small number of factors that are
outside of an individual’s control, a persistently high level. The most significant of these factors is
differences between households based mostly on the level of their parents’ education and, to a
lesser extent, where they were born. Differences in gender explain relatively little of the level of
inequality in Indonesia.
Children’s health and nutrition in the first two years will affect them for the rest of their lives
Inequality of opportunity begins when more than one in three Indonesian children fails to get a
healthy start. Differences in the quality of a household’s human resources, their most important
19
asset, drive a large degree of consumption inequality in Indonesia. These differences start even
before birth. Some children from poorer households do not receive proper nutrition during the
critical development stages – from when they are still in the womb and up until they are two years
old. These children are stunted, failing to reach the right height for their age, develop their cognitive
skills more slowly, reach lower educational levels, and earn less as adults, compared to children who
grow up healthy. This is one of the most important development challenges for Indonesia, where 37
percent of children are stunted, much higher compared to regional neighbors.
The persistently high rates of childhood stunting come in large part from unequal access to
nutrition and quality health services. Many poor children are not properly breastfed and poorer
children are the least likely to be getting the micronutrients they need. Most start the immunization
process but few of them finish it. Also, many children lack access to clean water and proper
sanitation, which increases the risk of illness and affects nutrition. Gaps in access to health care have
been closing over time but remain significant. More importantly, a quality gap persists; facilities in
many places lack the basic amenities and trained and competent personnel required to deliver the
basic health services mandated by law. One reason is that Indonesia has the fifth lowest health
spending relative to GDP in the world.
Childhood stunting is strongly linked to worse
mortality, cognitive, education, and adult income
and health outcomes. Stunting is much higher in
Indonesia than most neighboring countries.
Stunting by country (percent)
Gaps in access to better child health are closing
(such as in water in sanitation as shown), although
quality levels remain persistently low in many
places.
Lack of access to clean water and proper sanitation by
household per capita consumption decile (percent)
Source: WHO Child Nutrition Indicators. Source: Susenas
Child health is also affected by fertility patterns in poorer households; having more children
earlier can negatively affect child health and means sharing limited resources amongst many
members
The family size of poorer households shrank faster than richer households during the 1990s, which
helped to moderate inequality. More people in the house mean less each per person. Poorer
0 10 20 30 40 50
Cambodia
Indonesia
Myanmar
Philippines
Vietnam
Malaysia
Thailand
0
10
20
30
40
50
60
70
80
90
1 2 3 4 5 6 7 8 9 10
Household Per Capita Consumption Decile
Poor sanitation (2002)
Poor sanitation (2011)
Poor water (2002)
Poor water (2011)
20
households tend to be larger with more children, so not only do they have lower incomes than richer
households, but their consumption per person is even less. However, due to an effective national
family planning campaign since the 1970s, the family size of poorer households shrank faster than
richer households during the 1990s. This meant inequality was lower than it would otherwise have
been. With poorer households having less people to spread their income over, their per capita
consumption rose faster and the Gini was 2.5 points lower that than it would have been if relative
household sizes had been the same in 2002 as they were in 1993.
This trend reversed during the 2000s; the family size of richer households is still falling while
poorer households have remained the same size, contributing significantly to rising inequality.
Between 2002, the average household size of the poorer half of Indonesians has remained stable,
while that of the richer half of Indonesians has continued to fall, albeit it more slowly than in the
1990s. This has contributed to the increase in inequality over this period. If reductions in household
sizes for the poor and rich had continued to follow the same pattern as between 1993 and 2002, the
Gini would have been 4 points lower in 2014, at 37 rather than 41.
A key reason for this is that the effectiveness of family planning in Indonesia has fallen over the
last decade. The contraceptive prevalence rate is roughly the same now as it was a decade ago, and
while the unmet need for contraception is not particularly high compared to other countries, it
remains a major reproductive health issue and has shown little signs of falling in recent years.
Moreover, this reflects unequal access to proper family planning between the rich and poor,
especially for longer-term methods to limit family sizes. Decentralization, a lack of political support
at the local level and regulatory deficiencies have weakened family planning. First, the National
Family Planning Agency (BKKBN), previously a strong, centrally run agency, has struggled to maintain
its effectiveness in a decentralized Indonesia, where significant responsibilities for implementation
and monitoring have been devolved to districts. Second, a lack of political commitment to family
planning by local governments has emerged after decentralization, realized in insufficient budgetary
support for family planning.
Furthermore, these demographics changes will have a bearing on opportunities for the next
generation. Not only has the reversal of family size trends for richer and poorer households
contributed to higher consumption inequality today, it will also affect consumption inequality
tomorrow. Smaller family sizes for richer households bring a number of benefits that will advantage
their children compared to those from poorer households. It can contribute to better maternal and
child health outcomes; improved birth spacing allows the mother’s body to recover and deliver more
nutrients, helping babies be born at a healthy weight. It also means more attention can be devoted
to each child, helping prepare them better for entering preschool. Reduced rates of teen pregnancy
can decrease maternal and child mortality rates, as well as the incidence of low birth weight.
Healthier children born into richer families in turn can increase inequality tomorrow because they
have had a better start in life.
While enrolment rates for poorer children have improved, they often do not receive the same
quality of education
Inequality of opportunity deepens when not every child gets a smart start, largely due to unequal
access to quality education in Indonesia. Children living outside of Java or in rural areas, especially
the poor, are less likely to attend early childhood development programs, when learning begins. By
primary school, though, enrolment is nearly universal, and junior secondary enrolment gap between
richer and poorer children has been closing over time. However, poorer children are not making the
transition to the next schooling level at the same rate as richer ones; enrolment rates for the richest
20 percent of children are only 9 percentage points higher in year six (the last year of primary), but
21 percentage points higher in year seven (the beginning of junior high). However, the biggest
21
challenge to an equal start for all is the quality of education. Rural schools and schools in Eastern
Indonesia are less likely to have trained teachers or proper facilities, and teacher absenteeism is a
problem in some places. Even if poorer children stay in school, disparities in educational quality
persist, so that the value of a complete education is often less than it is for better off children. This
negatively affects the learning outcomes of remote and poorer students. For example, Grade 3
children in Java read 26 words faster per minute than those in Nusa Tenggara, Maluku or Papua.
Similarly, richer children read 18 words faster than poorer children. In turn, the low quality of
education for the disadvantaged (the majority of Indonesian children) drives the low average quality
of educational outcomes; 74 percent of Indonesian 15 year-old children do not achieve even Level 1
basic skills (a score of 420) on PISA international mathematics and science tests, the fifth worst share
out of 82 countries (OECD 2015).
The enrolment gap between richer and poorer
children has been closing over time….
Enrolment of 13-15 year olds by parents’ per capita
consumption quintile
…but increasing enrolment rates masks differences
in the quality of education across schools and
regions…
Quality of schooling facilities and teachers (percent)
Source: Susenas 2012 Source: Podes 2011 Infrastructure Survey
…which in turn contribute to Indonesia have some of the worst international test scores in science and
mathematics
Percentage of 15-year olds with international PISA mathematics and science scores below Level 1 (basic skills, 420
points)
Source: OECD 2015
50
60
70
80
90
100
2004 2007 2011 2013
Q1 Q2 Q3 Q4 Q5
55%
77%
92%
49%
68%
86%
62%
86%
98%
33%
45%
61%
0%
10%
20%
30%
40%
50%
60%
70%
80%
90%
100%
All Schools:
Av. Share of
Teachers
with S1
Diploma
Share SMP
with
Laboratory
Share
Schools with
Electricity
National Rural Urban Maluku/Papua
0
20
40
60
80
100
Ghana
SouthAfrica
Indonesia
Qatar
Botswana
Syria
Brazil
Jordan
Argentina
Palestine
Macedonia
Lebanon
Mexico
Bahrain
Malaysia
Kazakhstan
Armenia
UAE
Romania
Turkey
Greece
Ukraine
Croatia
Hungary
UnitedStates
Italy
Lithuania
France
NewZealand
UnitedKingdom
Austria
Australia
Latvia
Netherlands
Switzerland
Liechtenstein
Poland
Vietnam
Macao
Japan
Korea
HongKong
22
Despite closing gaps in access to critical education and health opportunities, inequality continues
to increase, with the role of birth circumstances remaining significant. The significant economic
and education expansions which Indonesians enjoyed in the 1960s and 1970s meant the role of birth
circumstances played by factors such as parents’ education and where you were born and raised fell
from explaining 39 percent of today’s consumption inequality for people born in the 1950s to 34
percent for those born in the 1970s. However, this decline has stopped and may even be reversing
for those born in the 1980s and onwards. This is due in part because access to quality services
remains unequal, even if physical gaps have closed. Therefore the skills gap between advantaged
and disadvantaged children remains. But this alone would not lead to rising inequality. Instead, the
persistent skills gap is combining with an increasing reward for those skills in the modern labor
market to drive inequality higher.
B. Two labor markets: increasing skilled wages for the few skilled workers and a low-
productivity job trap for everyone else
An increasing demand for and shortage of skilled workers is driving their wages higher
In the modern, dynamic, global economy, technological advances, especially in information
technology, means skills are becoming more important. Technological progress has brought
significant benefits in recent decades, with cheaper transportation and cheaper goods, greater
access to markets for those in remote areas, and improved communication and knowledge sharing.
The new technologies underpinning these advances are demanding increasingly more skill to use
and improve. As a consequence, demand for skilled workers in many sectors has increased in most
countries around the world. And these skilled workers tend to be those children who completed
school and benefitted from a high quality education in the first place, highlighting the consequences
of unequal opportunity from birth.
In Indonesia, employers are increasingly demanding more skilled workers, but are struggling to
find them. Employers in Indonesia are also looking for workers with higher skill levels. The
proportion of jobs requiring senior high school or tertiary education has increased over the past
decade from 22 percent in 2002 to 35 percent in 2013. But education levels are not the same as
skills. Despite increasing educational attainment in Indonesia, over half of all firms surveyed in
manufacturing and services outside of education say that finding professionals is “hard” or “very
hard”, and 40 to 50 percent of them said their staff were lacking thinking, behavioral, computer and
language skills.
At the same time, there are few opportunities for those who leave school without the right skills
to improve them. Much of the Indonesian workforce leaves school without basic skills because of
incomplete and poor quality education. There are limited opportunities for them to develop these
skills later in life. Less than one percent of youths aged 19 to 24 years old have attended training
courses in engineering, IT or languages, in part because of limited supply. At the same time, there
are few on-the-job learning opportunities either. Few firms in Indonesia are providing such training,
particularly compared to the rest of East Asia and elsewhere in the world. Around 70 percent of
firms in East Asia employing more than 100 workers offer formal training; in Indonesia less than 40
percent do, and the gap increases for medium and smaller firms compared to the region. With
limited access to “second-chance” skills training opportunities, these workers find it difficult to
improve their skills to find better jobs.
As a consequence, the wages for skilled workers have been increasing faster than those for
unskilled workers. There is an increasing wage gap between skilled and unskilled workers. Skills,
rather than education, are hard to identify in labor force surveys. However, on the whole, wages in
higher productivity sectors which demand more skill, such as financial services, telecommunications
and some manufacturing sectors, have risen faster than in those in lower productivity sectors. On
23
average, every extra IDR 200 million of annual labor productivity enjoyed by a sector corresponded
to one percentage point higher real wage growth each year between 2001 and 2014.2
In this labor
market, workers from richer households, where they are more likely to be better educated and more
skilled, are benefiting from higher wages.
The proportion of employment requiring higher
education levels has been increasing.
Employment by education level, 2002-13 (percent)
Nearly half of employers surveyed identified skill
gaps in staff.
Important skills identified by employers, and skill gaps
Source: Sakernas, World Bank calculations Source: World Bank (2011) Skills for the Labor
Market in Indonesia.
At the same time, most workers are trapped in low paying jobs
With most existing and new jobs being in low productivity sectors, most workers are trapped in
low paying jobs, which are often in the agricultural and informal sectors. Between 2001 and 2012,
a total of over 20 million new jobs were created. Employment creation, however, has been
concentrated in low-productivity, non-skill-intensive sectors. Out of total employment growth, 30
percent occurred in community, social and personal services and 28 percent in wholesale, trade and
retail, while manufacturing contributed only to 16 percent of total growth (3.3 million).
In addition to the low skills of most workers, other factors impede the creation of more productive
jobs, beginning with barriers to competitiveness and productivity. Underinvestment in
infrastructure and a poor investment climate have been major constraints to creating more and
better jobs. Investment in infrastructure collapsed during the Asian Financial Crisis and has not fully
recovered since. Total infrastructure investment declined from an average 7 percent in 1995-97 to
around 3-4 percent of GDP in recent years, compared to over 7 percent in Thailand and Vietnam,
and 10 percent in China over the past decade. Despite rising government spending in recent years,
Indonesia’s core infrastructure stock, such as road networks, ports, electricity, telecommunication
facilities, has not kept pace with economic growth. Indonesia has lost more than 1 percentage point
of additional GDP growth due to under-investment in infrastructure, chiefly transportation.
Problems with transportation are among the worst business constraints for manufacturing firms and
2
Labor productivity is measured here as the value of GDP output in the sector divided by the number of
workers. Worker productivity ranges from around IDR 20 million of GDP in very low productivity sectors, such
as agriculture, to IDR 100-200 million in higher productivity sectors in manufacturing and financial services, to
over IDR 500 million in non-oil and gas mining.
0
20
40
60
80
100
2002 2013
SD or less SMP SMA Tertiary
24
prohibitive transport costs undermine their competitiveness. Raw material producers find
themselves unable to tap growing opportunities linked to final consumer demand. It is cheaper to
import oranges from China than to source them from Kalimantan. At the same time, obtaining
business licenses is very complicated, expensive and time-consuming. Indonesia ranks 114th
out of
189 countries in the ease of doing business, worse than Malaysia (18th
), Thailand (26th
), Vietnam
(78th
), China (90th
) and the Philippines (95th
). For example, obtaining the licenses necessary to start a
new business in manufacturing takes 794 days by law, although actual implementation can be
slower still. And it takes 101 days to get an electricity connection, compared to 35 in Thailand.
Rigid labor market regulations also discourage formal job creation and hinder workers from
moving to more productive sectors while providing ineffective worker protection. Indonesia has
some of the most rigid labor regulations in the region. Indonesia has a minimum severance pay of at
least 100 weeks of wages. At the same time, an increasingly uncertain minimum wage setting
process has resulted in large increases recently; in 2013, 25 provinces increased their minimum
wage by an average of 30 percent and Jakarta increased it by 44 percent, taking it even further
above Thailand and Vietnam, but also above China and the Philippines, despite having one of the
lowest labor productivities. High severance and an uncertain minimum wage process mean firms are
less likely to employ workers formally. Most companies respond by not using formal contracts or
using short-term contracts. At the same time, the legislation protects only a small number of
workers. Most workers receive no severance payment at all (66 percent), while those who do
receive payments usually receive less than they are entitled to; only 7 percent of fired workers
received the full payment. Furthermore, as a consequence of these regulations, workers find it
difficult to move from informal to formal jobs, as formal employers consider high costs of dismissal
and uncertain minimum wages when hiring. At the same time, formal workers are less likely to move
from less productive sectors to more productive ones, since workers who want to move are not
compensated fully for severance by their employers if they leave voluntarily.
Thus, unequal development of skills is combining with rising returns to those skills to drive
inequality higher
Inequality of opportunity in health and education combined with increasing returns to skill are
together increasing inequality. Despite increasing enrolment rates for poorer and disadvantaged
children, the poor quality of education they receive, and often the cognitive disadvantages they
suffer from stunting, mean that they are not obtaining the skills needed to take advantage of the
increasing demand for skilled workers and the increasing rewards which are coming with that. And
since most of the other jobs being created are low productive and often informal, they are trapped
in low wage jobs. At the same time, equipped with skills, workers from richer households are
benefiting from a labor market with a skills shortage.
The widening wage gap between few skilled workers and the majority of unskilled workers is one
of the main drivers of increasing inequality in the last decade. The increasing skilled wage gap is
reflected in higher wage inequality. The Gini coefficient for primary wages increased by around 5
points over the 2000s, contributing to higher inequality. In fact, around 28 percent of the increase in
consumption inequality in the 2000s can be explained by increasing returns to education. Since
there is a wide degree of variation in skill within each level of education, the contribution of
increasing returns to skill, rather than education, is likely to be even higher.
C. High wealth concentration and its consequences
A small number of Indonesians are benefitting from financial assets – sometimes through
corruption – that, in turn, drives higher inequality in the future
Households earn income not only through jobs but also financial assets, which are highly
concentrated amongst the richest households. The share of income generated by labor has been
25
falling and the share generated by capital, such as financial and property assets, has been increasing,
in Indonesia as elsewhere in the world. In Indonesia, this partly reflects the strong returns to these
assets over the last decade. It is largely rich households, however, who have access to these
resources. The richest 10 percent of Indonesians own an estimated 77 percent of all wealth, which is
equal second highest (along with Turkey and Hong Kong) after Russia from a set of 46 countries. This
means that income from financial assets benefits fewer households in Indonesia than elsewhere.
Indonesia has one of the highest concentrations of wealth out of 46 countries with available data
Share of total wealth held by richest 10 percent of households (percent)
Source: Credit Suisse (2014)
Furthermore, accumulated wealth generates even higher incomes in the future, driving inequality
higher. Financial assets are generating higher incomes for only a few wealthy households in
Indonesia, and these households are then saving this income as even more wealth. The share of
wealth owned by the richest 10 percent in Indonesia increased by 7 percentage points between
2007 and 2014, in the top 10 of 46 countries over that period. These increased financial assets today
generate even higher incomes tomorrow.
Some accumulation is due to differential tax treatment of labor and capital income. Increasing
wealth concentration is due, in part, to differences in the way income tax is collected from labor and
capital. For example, there are differences in rates: dividends are taxed at 10 percent, lower than all
but the lowest labor income tax rate and far below the 30 percent top marginal rate which most
dividend earners would otherwise face. At the same time, while the significant capital gains that
have been made from the housing and stock markets are theoretically subject to personal income
tax, in practice monitoring and compliance are weak. Meanwhile, for many workers, income tax on
salaries and wages is withheld by the employer, ensuring a degree of compliance for labor income.
As a consequence, around 95 percent of personal income taxes (around 20 percent of total income
taxes) are collected through withholding, mostly on salaries, and only the remaining 5 percent from
capital income.
Other wealth accumulation is due to various forms of corruption. For some, their financial assets
are gained through personal connections and corrupt practices; in 2014 Indonesia’s Corruption
Perception Index, which measures perceptions of public sector corruption around the world, was a
lowly 34 out of 100 (where 0 means very corrupt and 100 very clean), ranking it 107th
out of 175
countries. This corruption can take the form of legal corruption – awarding of public procurement or
service contracts to connections, appointment of friends and families to lucrative public sector
positions – or illegal corruption, such as the bribing of judges to sway judicial decisions, or the
bribing of officials for preferential treatment.
0
10
20
30
40
50
60
70
80
90
Russia
Turkey
HongKong
Indonesia
Philippines
Thailand
UnitedStates
India
Egypt
Brazil
Peru
Switzerland
Argentina
Malaysia
SouthAfrica
Chile
Sweden
Denmark
Israel
CzechRepublic
SaudiArabia
Norway
Colombia
Mexico
China
Austria
Korea
Poland
Taiwan
Germany
UnitedArabEmirates
Singapore
Ireland
Portugal
Canada
NewZealand
Greece
Spain
Netherlands
Finland
UnitedKingdom
France
Italy
Australia
Japan
Belgium
26
High wealth concentration, even when fair, can have negative consequences for inequality. Even
without illegal or unfair accumulation, a high concentration of wealth might be bad for two reasons.
First, it transmits unequal opportunities across generations, both in terms of greater financial
resources and their earning ability, as well as facilitating a greater investment in the human capital
of the children in wealthier households. Second, high wealth may facilitate the capture of policies
and institutions. For example, the wealthy may use their financial and political influence to make tax
rates on capital lower than labor, or subvert the legal process to avoid prosecution for corruption.
Indonesia’s poor Corruption Perception Index score suggests that not only is wealth sometimes
illicitly gained through the public sector, public officials are sometimes complicit in the subversion of
the proper political and legal process.
D. Shocks erode a household’s ability to earn and save, as well as invest in health and
education
Finally, shocks disproportionately affect poor and vulnerable households, which can prevent
them from climbing up the economic ladder
There are many shocks which can erode household resources and incomes. Households can be
affected by economic, health, social and political shocks, as well as natural disasters. These shocks
can reduce household income through a number of channels. They can affect the underlying assets
that generate income; a natural disaster, for example, might destroy the livestock or equipment
used to make a living. Shocks can also reduce the income that comes from these assets; a drought
might make a harvest meager. They can also reduce how far that income goes in the case of food
price shocks; soaring rice prices linked to rice import restrictions in 2006 saw poverty rise by two
percentage points. And they can reduce tomorrow’s income by depleting today’s assets (for
example, selling a sewing machine to pay for hospital care) or by preventing accumulating assets for
the future (for example, lack of income due to losing a job).
Less than half of all Indonesians have health
insurance
Access to health insurance (percent)
There are more than twice as many vulnerable
Indonesians as there are poor, living less than 50
percent above the poverty line, who fall easily into
poverty if they suffer a shock
Figure xii. Poverty and vulnerability rates in Indonesia,
2014 (percent)
Source: Susenas and World Bank (forthcoming (a))
0
10
20
30
40
50
60
Health insurance
Poor Vulnerable
Emerging Consumer Class Consumer Class
0
5
10
15
20
25
30
35
40
45
Between 1.0x and 1.5x Poverty Line
Below Poverty Line
28 million poor
68 million
vulnerable
27
Note: The poor are under the national poverty line, around PPP$1.30; the vulnerable are under 1.5 times
the poverty line, around $1.90; the emerging consumer class are under 3.5 times the poverty line, around
$4.50; and the consumer class are above this. See World Bank (forthcoming (a)) for details.
Many Indonesians rely on friends and family to deal with these shocks rather than formal
mechanisms. Civil servants and the wealthy have access to health and employment insurance that
they can rely on during shocks. While the government covers health insurance premiums for the
poor and vulnerable, these programs are not always effective because beneficiaries do not know
what services they are eligible for, or cannot access them because of limitations in the supply of
services. Also, for many workers who are neither poor nor rich and working in the informal sector,
expansion in coverage to these households may be years away. When people do not have access to
formal coping mechanisms in times of shock, they usually turn to family and friends. However, this
typically does not provide enough support to fully cope, and does not work when a shock like a
natural disaster hits an entire community. When informal borrowing is not enough, households may
resort to steps that reduce their future income, such as selling productive assets or pulling children
out of school.
Shocks hurt the incomes of all Indonesians, but since richer households are more resilient they are
less likely to be negatively affected. With vulnerability high in Indonesia, small shocks can easily
reduce incomes. While 28 million Indonesians live below the poverty line, a further 68 million live on
less than 50 percent above it. As a consequence, small shocks can easily send the vulnerable into
poverty; in fact, around half of the poor each year were not poor the year before. However, even
non-vulnerable Indonesians will be badly affected by shocks such as illness and disease or
unemployment if they do not have access to insurance or other coping mechanisms. As a
consequence, over a 14-year period, most Indonesians have experienced considerable ups and
downs in terms of their income. But a majority of the richest fifth of households have been able to
remain at the top over this same period of time (although having the most financial assets, they
were most affected by the Asian Financial Crisis when inequality actually fell).
IV. Reducing Inequality
High inequality is not inevitable; policymakers can reduce it by tackling that part of it which
is due to factors outside a person’s control
High and rising inequality is not an inevitable part of the development process; regional neighbors
have grown without increasing disparity between the rich and the poor. Inequality has been rising
quickly in Indonesia at the same time as it was stable or falling in fast growing East Asian neighbors
such as Malaysia, Thailand and Vietnam. This indicates that rising inequality is not an unavoidable
byproduct of rapid growth. In fact, some countries, such as Brazil, have been able to slow and
eventually reverse rising inequality through a planned policy approach.
Inequality can be tackled with policies that reduce the impact of factors outside an individual’s
control which affect their outcomes, and so break the intergenerational transmission of poverty
and inequality. Not all inequality needs to be addressed; the government can aim to address
inequality due to factors outside an individual’s control while leaving the inequality which rewards
individuals for hard work, risk-taking and innovation. This means breaking the cycle of
intergenerational transmission of poverty and inequality and ensuring people are no longer divided
into the haves and have-nots from before birth. All children need to be born healthy, grow up well in
their early years, go to school and get a quality education, and enter the workforce with the right
skills for today’s modern and dynamic economy. In addition, all families need access to mechanisms
which can protect them from the many shocks which occur in life, more Indonesians need to gain
access over time to financial wealth, and pay a fair share of tax on the income they generate. To do
28
this, policymakers have a range of instruments. The best ones to use are those which both address
the main drivers of rising inequality and which are feasible.
The final section of the report examines some of these tools and highlights priority actions. We
examine:
 Improving local service delivery to provide equal opportunities for all: A key to a better
start for the next generation is improved local service delivery, which can improve health,
education and family planning opportunities for all.
 Promoting better jobs and skills training opportunities for the workforce: Today’s workers
who had an unfair start can still improve their skills. When they do, the government can
help make sure there are better jobs available through a better investment climate and
improved regulatory approach.
 Ensuring protection from shocks: Government policies can reduce the frequency and
severity of shocks, as well as provide the coping mechanisms to ensure all households have
access to adequate protection to the shocks which do occur.
 The right fiscal policy: Spending in the right areas, such as on infrastructure, health and
education, social assistance and social insurance, allows a government to create more equal
opportunities for the future and better jobs now, as well as households to protect
themselves. How it funds this spending can also affect inequality today, as well potentially
address some unfair aspects of wealth concentration.
 Further research in selected areas where more needs to be known: Some issues, such as
corruption and the role of institutions in rising inequality, are not well-understood. On other
issues, such as infrastructure, more work is needed to understand what infrastructure is
needed where and would best address inequality of outcomes and opportunities.
A. Local service delivery
In addition to adequate funding, the most important policy action underpinning a better
start in life for all is improved local service delivery.
In a decentralized Indonesia, effective delivery of quality services by local government is essential
if opportunities are to be enjoyed by all. Since democratization and decentralization, the financial
and political powers of local governments have been increased dramatically. So should their
responsibilities be. With much of the authority for key services which provide the opportunities for a
good start in life, such as health, water and sanitation, nutrition and family planning, now being
under local government control, more must be done to ensure they have the means, capacity and
incentives to provide these services in an effective manner.
Key policy actions can underpin improvements in all areas of local service delivery. Local service
delivery can be improved by building the capacities of local government to deliver services, moving
towards a more performance-based transfer system and providing the tools for citizens to monitor
local service delivery. Some priorities for improving local service delivery which cross sectors include
changes in the way central budgeting allocations are made; changes in the incentives local budgeting
face; incentives for achieving local delivery standards; and increased demand for public
accountability. In particular, we look at how this might be achieved in health, education and family
planning.
Specific actions can help ensure that all children – regardless of where they are born or their
family’s economic status – have a healthy start to life…
One of the most important steps in addressing inequality of opportunity begins with improving
access of poorer households to quality health services. Getting the right start for children of poorer
households means getting access to quality health services during the early development stages,
29
without which they will be disadvantaged for the rest of their lives. More spending on health could
help reduce gaps in access. However, the priority is improving the quality of health services. Specific
actions include:
 Increased health financing, with targeted DAK investments and built-in incentives, to
equip local health facilities to deliver results. First, public health spending could be
increased; Indonesia has the fifth-lowest health spending to GDP ratio out of 188 countries,
at 1.2 percent of GDP. But public health spending could also be improved, by making local
governments more accountable and better able to deliver health services on the ground.
One approach is to use targeted investments combined with incentives to deliver results. For
example, multi-year Dana Alokasi Khusus (DAK, or special funding for national priorities)
transfers to districts could be linked to measurable gaps in key health services relative to
basic standards, such as those related to maternal and child health. District contributions
could be reimbursed upon evidence that these services are being provided, and subsequent
DAK allocations can be based not only on gaps but also progress in closing them. Districts
that under-perform could be supported, provided that the problem is a weak capacity to
deliver.
 Producing sufficient competent health workers and ensuring enough of them make it to
disadvantaged areas. There are a number of ways to improve the number, quality and
distribution of health workers. Producing the right number begins with better information
about the dynamics of the health workforce at the national and subnational levels, using
modern planning methods for health workforce production and deployment to reflect real
demand and a greater involvement of the private sector. Quality can be improved through
limiting the recruitment of public servants to those who have been certified according to
national standards, and limiting the reimbursement of services for patients with health
insurance to those services that have been provided by certified health personnel in both
the public and private sector. At the same time, the quality assurance – certification,
accreditation and licensing – of health workers and health professional education can be
improved. Finally, getting enough qualified workers to disadvantaged areas means a public
sector emphasis on the placement of medical doctors in rural underserviced areas to
increase the efficient use of public money, and trying different incentive initiatives to
motivate health workers to work in remote areas than the ones to date.
 Creating demand for health and sanitation services through a strengthening of the
Posyandu cadres. Increasing demand and knowledge for maternal and child health and
water and sanitation services can be promoted through education, social encouragement
and pressure, and incentives, including better socialization of the importance of vital
behaviors; outreach from local health officials, trusted community leaders and NGOs; and
incentives through CCTs or other social assistance programs. In particular, increased
professionalization of Posyandu cadres (community health workers) is important, through
improved training quality, performance-based incentives, and strong supervision from
Puskesmas (sub-district health centers). These cadres can go into every community to make
sure that pregnant women get routine prenatal care, encourage mothers to bring children
for immunization, children with fever get seen immediately for a malaria diagnosis, and
other basic steps that reduce the threat of illness as well as the high costs of late treatment.
With respect to stunting and nutrition, Posyandu cadres can play a key role in ensuring
effective Behavioral Change Communication (BCC), especially tailored personal counseling
focusing on improved caring practices for maternal care and feeding behaviors for infant and
young children. As shown in other countries, regular home visits to provide individualized
support to caregivers are key. Posyandu training pilots under PNPM Generasi could be
further scaled up.
30
…and a smart start…
Gaps in access to schools are closing over time, but this needs to be accompanied by
improvements in the quality of education in order to reduce inequality. Enrolment gaps between
the rich and poor have been closing over time, but the contribution of inequality of opportunity to
overall inequality has not continued to fall because of a persisting quality gap. This is also an
important factor holding back higher economic growth. Getting all kids to stay in school until at least
the end of high school is an important step, which means improving access in some areas, improving
the targeting, coverage, benefit levels and uptake of scholarships for poorer households
everywhere, with inducements for transition to the next schooling level. Nonetheless, there are will
be greater reductions in inequality of opportunity, as well as much bigger gains to economic growth
(the benefits in terms of growth have been estimated for Indonesia to be around seven times higher
for closing the quality gap than for closing the access gap), if the quality gap is addressed. Specific
actions to do this include:
 Ensuring adequate financing of schools, particularly in disadvantaged areas, to attain
minimum quality standards. A recent WB report identifies a number of options to improve
BOS: link funding more directly to education standards in order to signal the importance of
using BOS resources to fulfil these standards; revise the list of eligible items under BOS to
provide schools with the flexibility to invest in quality enhancing inputs; adjust the value of
BOS periodically to account for regional price differences and inflation to ensure that all
schools can meet operating standards; use the BOS formula to provide more funding to
schools serving poor and vulnerable children; and phase out the use of BOS resources to
support the ‘out of pocket’ expenses of poor students in favor of existing targeted programs.
At the same time, local governments can be encouraged and supported their operational
support to schools (BOSDA) in ways that complement BOS; BOS enables the meeting of
minimum service standards, BOSDA can enable the meeting of the higher national education
standards. Recent reforms in DKI Jakarta suggest a potential approach, combining an equity
component (rather than equal spending per person, schools in the 1,000 Islands area receive
more funding because of the higher costs of service provision) and an incentive component
(schools in the top quarter with respect to the level and increase in national test scores
receive an extra allocation the following year). In addition, the targeted and performance-
based DAK investments proposed in health could also be adopted for education based on
district-level education gaps.
 Increasing the competency of teachers everywhere, and ensuring sufficient distribution to
disadvantaged areas. Strategies could include greater selectivity at entry and exit (through
the use of competency tests) and institutional accrediting can help ensure an adequate
supply of competent teachers; recruitment and deployment of competent teachers,
particularly in disadvantaged areas by combining financial incentives, bonding schemes and
group-based postings; stronger professional development and support; and greater teacher
accountability, such as through the use of annual appraisal and competency tests to
determine career progression, and tying contract renewal to performance.
…and to improve local family planning services
Targeted government efforts would help give poorer families equitable access to family planning
services so that they can control the size of their households. Family sizes will fall as economic
growth in Indonesia continues, alongside urbanization and increasing enrolment rates. Efforts are
needed, however, to target poorer households so that they do not fall further behind due to higher
fertility rates. This will require reducing inequalities in the knowledge, use, access and quality of
family planning services. The private sector is unlikely to reach poorer households sufficiently since it
is difficult and costly to reach marginalized and poorer groups. Therefore, greater central and local
31
government efforts are required to revitalize family planning programs, with strategies to target
those who need it the most. Specific actions include:
 Develop local strategies for revitalizing targeted family planning services. Clear
government strategies could improve the provision of family planning information and
services, focusing on marginalized and poorer target groups. An effective strategy would
include a clear delineation of roles and responsibilities for local government, the Ministry of
Health, and the National Family Planning Agency (BKKBN) and focus on: improving the
provision of family planning information and services; and promoting contraceptive use by
couples from poorer and marginalized groups in planning their families. More effort is then
needed to address the unmet contraceptive needs of economically disadvantaged couples,
including through socialization; provision of contraceptive services which are affordable for
poorer households; and increasing the number of midwives who are qualified to insert IUDs
and implants.
 With poorer households less able to access private sector services, adequate funding of
public family planning programs is critical. With family planning budgeting now a local
prerogative, a central agreement between the BKKBN and the Ministry of Home Affairs (who
oversee local government issues) on family planning financing is vital. Local champions of
family planning need to receive technical assistance and local family planning boards could
be established in more districts under existing regulations. The use of DAK could be altered
to allow family planning spending to focus less on infrastructure and more on operational
expenses, such as training of midwives and contraceptive supplies.
B. Improving the skills of today’s workforce and providing them with better access to
productive employment
In the long-run, only improved access to quality health and education will reduce unequal
access to good jobs; in the short-run, more can be done to improve the skills of today’s
workers and create more productive jobs
Indonesia could create better jobs by addressing the barriers and constraints to productivity
growth, particularly through better infrastructure and greater competitiveness. One key area of
reform is improving infrastructure, connectivity, and logistics, discussed in detail in a subsequent
section. Beyond that, Indonesia’s Ease of Doing Business requires constant improvement, as well as
access to finance for small firms looking to expand. Both the manufacturing sector and the
agricultural sector can be a major source of productive, semi-skilled jobs for poor and vulnerable
workers, thus there is added emphasis on revitalizing those sectors.
Indonesia could also implement a “grand bargain” between government, employers, and labor
unions to overhaul labor market regulations. Current labor market regulations in Indonesia are
considered among the most rigid in the region and discourage job creation, but also result in low de
facto protection. Piecemeal reforms of individual regulations is difficult due to the perceived zero-
sum nature of labor market regulations, thus an overall grand bargain may be needed in order to
create a thorough set of reforms that is perceived to be beneficial to both employers, labor unions,
and job seekers.
Reforms in Indonesia’s skills training system can allow workers to upgrade their skills and access
better jobs. A greater degree of involvement by the private sector can create a demand-driven
system where the skills trainings offered are directly relevant to and demanded by employers. A
greater private sector role, particularly in provision and financing of training, also frees up public
funds to expand the training system to all provinces and subsidize the poor and other vulnerable
groups, e.g. women, youth and people living with disabilities.
32
C. Strengthening social protection to help households cope with shocks
Protecting households from shocks requires action on many fronts. Households face shocks from
many sources. Policy action is required in many areas to address such shocks, including coping with
natural disasters, building an effective social insurance system and ensuring adequate health
services, particularly in poorer areas. In addition, the below policy actions could have a particularly
strong impact on reducing inequality through protecting the poor and vulnerable.
Government policies can mitigate the effect of food prices on the poor and vulnerable. There are a
number of policy areas where government can promote stability to prevent shocks from occurring.
One important area that affects the poor is food prices, especially for rice. Domestic rice production
has slowed in recent decades for a number of reasons – including slow mechanization and poor
infrastructure and connectivity – and increased public spending has not agriculture spurred
production. At the same time, price stabilization policies are not effective and may even contribute
to the problem; the current rice import regime is particularly harmful. Effective rice security will
require an effective early warning system and reliable real-time information about prices, stocks and
flows of rice. Over the longer-term, achieving a sustained improvement in Indonesia’s rice security
will require increasing productivity through long-term, structural improvements in the farm sector.
Effective social assistance would not only boost incomes but to also enable the poor and
vulnerable to deal better with shocks. For those unable to cope with shocks themselves or access
contributory social insurance, stronger social assistance is needed. Safety nets have an immediate
impact on reducing poverty and inequality. Indonesia has been building and expanding a social
assistance framework since the wake of the Asian Financial Crisis. However, these programs are not
fully effective in protecting the poor and vulnerable and further reforms could improve the targeting
of these programs, which currently targets chronic poverty rather than poverty due to shocks,
expand the coverage and benefit packages of programs that work so that they provide adequate
protection to all vulnerable households, and add new programs to fill in gaps for those risks which
do not currently have adequate protection.
In addition, for the newly implemented social insurance programs, especially health, it is
important that a sufficient supply of services accompanies expansion in coverage. Access to
preventative and treatment health services for all Indonesians is vital to help protect against the
range of illnesses and accidents which can have catastrophic impacts on household incomes,
spending and savings. While around 90 million Indonesians, many of them poor and vulnerable, have
their premiums covered by the government, there are just as many more people, who while often
not living below the vulnerability line would nonetheless be badly affected by a serious health shock.
Many of these work in the informal sector, do not currently pay premiums, and are not yet covered;
reaching these households will be the main step in achieving universal health coverage. However,
coverage alone does not provide adequate protection against shocks if there is not a corresponding
availability of quality health services for all; the financing and health worker recommendations
discussed under local service delivery are just as necessary to protect against shocks as they are to
provide a healthy start for all children.
Knowing where, when and how to respond when crises hit is also key. Even when the right tools
have been available, Indonesia has not always known when, where and how to respond when crises
strike. Developing a Crisis Monitoring and Response System (CMRS) is essential for detecting the
effects of a crisis and responding appropriately. Such a system has three components: a permanent
and relatively real-time monitoring system at both the national and household level; a pre-agreed
protocol for when, where and which response will be initiated; and pre-agreed institutional
arrangements on planning, coordination, funding and disbursement and monitoring and evaluation.
A CMRS which links closely to existing disaster management tools will help adjust public protection
and support programs to deliver the right protection to the right people.
Final Output - P145471 2015-06-29 06 46

More Related Content

Viewers also liked

Org eqi-mejo-uni4-act3-foro
Org eqi-mejo-uni4-act3-foroOrg eqi-mejo-uni4-act3-foro
Org eqi-mejo-uni4-act3-forojorgezubiate
 
Gestión del cambio consultoría humana
Gestión del cambio consultoría humanaGestión del cambio consultoría humana
Gestión del cambio consultoría humanaConsultoría Humana
 
Documentos secundaria-cienciay ambiente-vii
Documentos secundaria-cienciay ambiente-viiDocumentos secundaria-cienciay ambiente-vii
Documentos secundaria-cienciay ambiente-viiPablo Santos Vilcherrez
 
The Radical Sales Shift - Lessons 6 -12 - Part 4
The Radical Sales Shift - Lessons 6 -12 - Part 4The Radical Sales Shift - Lessons 6 -12 - Part 4
The Radical Sales Shift - Lessons 6 -12 - Part 4The Mezzanine Group
 
Understanding Dementia_ppt
Understanding Dementia_pptUnderstanding Dementia_ppt
Understanding Dementia_pptSusie Zeigler
 
ลดหน้าเอกสารด้วยคำสั่ง Shirk one page
ลดหน้าเอกสารด้วยคำสั่ง Shirk one pageลดหน้าเอกสารด้วยคำสั่ง Shirk one page
ลดหน้าเอกสารด้วยคำสั่ง Shirk one pageFrong Pinipun
 
SMOG READING ANALYSIS AND RYGOR READING ESTIMATES
SMOG READING ANALYSIS AND RYGOR READING ESTIMATESSMOG READING ANALYSIS AND RYGOR READING ESTIMATES
SMOG READING ANALYSIS AND RYGOR READING ESTIMATESfatima logarta
 

Viewers also liked (16)

Ch 5-network devices
Ch 5-network devicesCh 5-network devices
Ch 5-network devices
 
Org eqi-mejo-uni4-act3-foro
Org eqi-mejo-uni4-act3-foroOrg eqi-mejo-uni4-act3-foro
Org eqi-mejo-uni4-act3-foro
 
Gestion documental -Tipos de archivo
Gestion documental -Tipos de archivo Gestion documental -Tipos de archivo
Gestion documental -Tipos de archivo
 
Gestión del cambio consultoría humana
Gestión del cambio consultoría humanaGestión del cambio consultoría humana
Gestión del cambio consultoría humana
 
Anatomy of olfactory system
Anatomy of olfactory systemAnatomy of olfactory system
Anatomy of olfactory system
 
Documentos secundaria-cienciay ambiente-vii
Documentos secundaria-cienciay ambiente-viiDocumentos secundaria-cienciay ambiente-vii
Documentos secundaria-cienciay ambiente-vii
 
CANUTE DESAI CV
CANUTE DESAI CVCANUTE DESAI CV
CANUTE DESAI CV
 
The Radical Sales Shift - Lessons 6 -12 - Part 4
The Radical Sales Shift - Lessons 6 -12 - Part 4The Radical Sales Shift - Lessons 6 -12 - Part 4
The Radical Sales Shift - Lessons 6 -12 - Part 4
 
Taller 3 11 8
Taller 3 11 8Taller 3 11 8
Taller 3 11 8
 
Presentación1
Presentación1Presentación1
Presentación1
 
Understanding Dementia_ppt
Understanding Dementia_pptUnderstanding Dementia_ppt
Understanding Dementia_ppt
 
Cradleprojects
CradleprojectsCradleprojects
Cradleprojects
 
ลดหน้าเอกสารด้วยคำสั่ง Shirk one page
ลดหน้าเอกสารด้วยคำสั่ง Shirk one pageลดหน้าเอกสารด้วยคำสั่ง Shirk one page
ลดหน้าเอกสารด้วยคำสั่ง Shirk one page
 
I3ppw
I3ppwI3ppw
I3ppw
 
Slide share
Slide shareSlide share
Slide share
 
SMOG READING ANALYSIS AND RYGOR READING ESTIMATES
SMOG READING ANALYSIS AND RYGOR READING ESTIMATESSMOG READING ANALYSIS AND RYGOR READING ESTIMATES
SMOG READING ANALYSIS AND RYGOR READING ESTIMATES
 

Similar to Final Output - P145471 2015-06-29 06 46

Pathways-to-Middle-Class-Jobs-in-Indonesia.pdf
Pathways-to-Middle-Class-Jobs-in-Indonesia.pdfPathways-to-Middle-Class-Jobs-in-Indonesia.pdf
Pathways-to-Middle-Class-Jobs-in-Indonesia.pdfFajar Baskoro
 
Indonesia economic prospect world bank desember 2021
Indonesia economic prospect world bank desember 2021Indonesia economic prospect world bank desember 2021
Indonesia economic prospect world bank desember 2021RepublikaDigital
 
Microfinance in Myanmar Sector Assessment
Microfinance in Myanmar Sector AssessmentMicrofinance in Myanmar Sector Assessment
Microfinance in Myanmar Sector AssessmentDr Lendy Spires
 
Microfinance in myanmar sector assessment
Microfinance in myanmar sector assessmentMicrofinance in myanmar sector assessment
Microfinance in myanmar sector assessmentDr Lendy Spires
 
Microfinance in myanmar sector assessment (ifc-cgap) 2013 jan
Microfinance in myanmar   sector assessment (ifc-cgap)   2013 janMicrofinance in myanmar   sector assessment (ifc-cgap)   2013 jan
Microfinance in myanmar sector assessment (ifc-cgap) 2013 janKaungHtetZawSMU
 
Mobile Money for Health Case Study Compendium
Mobile Money for Health Case Study CompendiumMobile Money for Health Case Study Compendium
Mobile Money for Health Case Study CompendiumHFG Project
 
FINANCIAL INCLUSION AND WOMEN EMPOWERMENT IN UGANDA A CASE OF LANGO SUB REGIO...
FINANCIAL INCLUSION AND WOMEN EMPOWERMENT IN UGANDA A CASE OF LANGO SUB REGIO...FINANCIAL INCLUSION AND WOMEN EMPOWERMENT IN UGANDA A CASE OF LANGO SUB REGIO...
FINANCIAL INCLUSION AND WOMEN EMPOWERMENT IN UGANDA A CASE OF LANGO SUB REGIO...ectijjournal
 
Expanding Coverage to Informal Workers: A Study of EPCMD Countries’ Efforts t...
Expanding Coverage to Informal Workers: A Study of EPCMD Countries’ Efforts t...Expanding Coverage to Informal Workers: A Study of EPCMD Countries’ Efforts t...
Expanding Coverage to Informal Workers: A Study of EPCMD Countries’ Efforts t...HFG Project
 
E gov complete-survey-2014 (1)
E gov complete-survey-2014 (1)E gov complete-survey-2014 (1)
E gov complete-survey-2014 (1)Victor Gridnev
 
Etude de l’ONU sur le E-Gouvernement : Cocorico ! la France dans le top 5 des...
Etude de l’ONU sur le E-Gouvernement : Cocorico ! la France dans le top 5 des...Etude de l’ONU sur le E-Gouvernement : Cocorico ! la France dans le top 5 des...
Etude de l’ONU sur le E-Gouvernement : Cocorico ! la France dans le top 5 des...Yves Buisson
 
Integrating Financing of Vertical Health Programs: Lessons from Kyrgyzstan an...
Integrating Financing of Vertical Health Programs: Lessons from Kyrgyzstan an...Integrating Financing of Vertical Health Programs: Lessons from Kyrgyzstan an...
Integrating Financing of Vertical Health Programs: Lessons from Kyrgyzstan an...HFG Project
 
Contribution of Financial Inclusion on the Economic Development of Nigeria 19...
Contribution of Financial Inclusion on the Economic Development of Nigeria 19...Contribution of Financial Inclusion on the Economic Development of Nigeria 19...
Contribution of Financial Inclusion on the Economic Development of Nigeria 19...ijtsrd
 
Private Health Policy Toolkit Final
Private Health Policy Toolkit FinalPrivate Health Policy Toolkit Final
Private Health Policy Toolkit FinalBettina Brunner
 

Similar to Final Output - P145471 2015-06-29 06 46 (20)

Pathways-to-Middle-Class-Jobs-in-Indonesia.pdf
Pathways-to-Middle-Class-Jobs-in-Indonesia.pdfPathways-to-Middle-Class-Jobs-in-Indonesia.pdf
Pathways-to-Middle-Class-Jobs-in-Indonesia.pdf
 
Healthy states progressive India report
Healthy states progressive India reportHealthy states progressive India report
Healthy states progressive India report
 
M health compendium
M health compendiumM health compendium
M health compendium
 
Indonesia economic prospect world bank desember 2021
Indonesia economic prospect world bank desember 2021Indonesia economic prospect world bank desember 2021
Indonesia economic prospect world bank desember 2021
 
Microfinance in Myanmar Sector Assessment
Microfinance in Myanmar Sector AssessmentMicrofinance in Myanmar Sector Assessment
Microfinance in Myanmar Sector Assessment
 
Microfinance in myanmar sector assessment
Microfinance in myanmar sector assessmentMicrofinance in myanmar sector assessment
Microfinance in myanmar sector assessment
 
Microfinance in myanmar sector assessment (ifc-cgap) 2013 jan
Microfinance in myanmar   sector assessment (ifc-cgap)   2013 janMicrofinance in myanmar   sector assessment (ifc-cgap)   2013 jan
Microfinance in myanmar sector assessment (ifc-cgap) 2013 jan
 
Mobile Money for Health Case Study Compendium
Mobile Money for Health Case Study CompendiumMobile Money for Health Case Study Compendium
Mobile Money for Health Case Study Compendium
 
FINANCIAL INCLUSION AND WOMEN EMPOWERMENT IN UGANDA A CASE OF LANGO SUB REGIO...
FINANCIAL INCLUSION AND WOMEN EMPOWERMENT IN UGANDA A CASE OF LANGO SUB REGIO...FINANCIAL INCLUSION AND WOMEN EMPOWERMENT IN UGANDA A CASE OF LANGO SUB REGIO...
FINANCIAL INCLUSION AND WOMEN EMPOWERMENT IN UGANDA A CASE OF LANGO SUB REGIO...
 
Expanding Coverage to Informal Workers: A Study of EPCMD Countries’ Efforts t...
Expanding Coverage to Informal Workers: A Study of EPCMD Countries’ Efforts t...Expanding Coverage to Informal Workers: A Study of EPCMD Countries’ Efforts t...
Expanding Coverage to Informal Workers: A Study of EPCMD Countries’ Efforts t...
 
Indonesian Financial Inclusion – Too Slow by Half!
Indonesian Financial Inclusion – Too Slow by Half!Indonesian Financial Inclusion – Too Slow by Half!
Indonesian Financial Inclusion – Too Slow by Half!
 
HIA Toolkit Final
HIA Toolkit FinalHIA Toolkit Final
HIA Toolkit Final
 
E gov complete-survey-2014 (1)
E gov complete-survey-2014 (1)E gov complete-survey-2014 (1)
E gov complete-survey-2014 (1)
 
Etude de l’ONU sur le E-Gouvernement : Cocorico ! la France dans le top 5 des...
Etude de l’ONU sur le E-Gouvernement : Cocorico ! la France dans le top 5 des...Etude de l’ONU sur le E-Gouvernement : Cocorico ! la France dans le top 5 des...
Etude de l’ONU sur le E-Gouvernement : Cocorico ! la France dans le top 5 des...
 
Integrating Financing of Vertical Health Programs: Lessons from Kyrgyzstan an...
Integrating Financing of Vertical Health Programs: Lessons from Kyrgyzstan an...Integrating Financing of Vertical Health Programs: Lessons from Kyrgyzstan an...
Integrating Financing of Vertical Health Programs: Lessons from Kyrgyzstan an...
 
Contribution of Financial Inclusion on the Economic Development of Nigeria 19...
Contribution of Financial Inclusion on the Economic Development of Nigeria 19...Contribution of Financial Inclusion on the Economic Development of Nigeria 19...
Contribution of Financial Inclusion on the Economic Development of Nigeria 19...
 
World Investment Report 2012 - Towards a New Generation of Investment Policie...
World Investment Report 2012 - Towards a New Generation of Investment Policie...World Investment Report 2012 - Towards a New Generation of Investment Policie...
World Investment Report 2012 - Towards a New Generation of Investment Policie...
 
Private Health Policy Toolkit Final
Private Health Policy Toolkit FinalPrivate Health Policy Toolkit Final
Private Health Policy Toolkit Final
 
Y2y mru publication
Y2y mru publicationY2y mru publication
Y2y mru publication
 
United Nations E-Government Survey 2014
United Nations E-Government Survey 2014United Nations E-Government Survey 2014
United Nations E-Government Survey 2014
 

Final Output - P145471 2015-06-29 06 46

  • 1. Report No: AUS4531 . Republic of Indonesia Inequality and Shared Prosperity Indonesia’s Rising Divide: why inequality is rising, why it matters and what can be done . June 2015 . GPVDR EAST ASIA AND PACIFIC . .
  • 2. 2 Standard Disclaimer: This volume is a product of the staff of the International Bank for Reconstruction and Development/ The World Bank. The findings, interpretations, and conclusions expressed in this paper do not necessarily reflect the views of the Executive Directors of The World Bank or the governments they represent. The World Bank does not guarantee the accuracy of the data included in this work. The boundaries, colors, denominations, and other information shown on any map in this work do not imply any judgment on the part of The World Bank concerning the legal status of any territory or the endorsement or acceptance of such boundaries. . Copyright Statement: The material in this publication is copyrighted. Copying and/or transmitting portions or all of this work without permission may be a violation of applicable law. The International Bank for Reconstruction and Development/ The World Bank encourages dissemination of its work and will normally grant permission to reproduce portions of the work promptly. For permission to photocopy or reprint any part of this work, please send a request with complete information to the Copyright Clearance Center, Inc., 222 Rosewood Drive, Danvers, MA 01923, USA, telephone 978-750-8400, fax 978-750-4470, http://www.copyright.com/. All other queries on rights and licenses, including subsidiary rights, should be addressed to the Office of the Publisher, The World Bank, 1818 H Street NW, Washington, DC 20433, USA, fax 202-522-2422, e-mail pubrights@worldbank.org.
  • 3. Indonesia’s Rising Divide Why inequality is rising, why it matters and what can be done June 2015, World Bank
  • 4. 4 THE WORLD BANK OFFICE JAKARTA Indonesia Stock Exchange Building Tower II/12th Floor Jl. Jend. Sudirman Kav. 52-53 Jakarta 12910 Tel: (6221) 5299-3000 Fax: (6221) 5299-3111 Website: www.worldbank.org/id THE WORLD BANK 1818 H Street NW Washington, DC 20433, USA Tel: (202) 458-1876 Fax: (202) 522-1557/1560 Website: www.worldbank.org Printed in June 2015 The Targeting Poor and Vulnerable Households in Indonesia report is a product of the staff of the World Bank. The findings, interpretations, and conclusions expressed herein do not necessarily reflect the views of the Board of Executive Directors of the World Bank or the Government they represent. The World Bank does not guarantee the accuracy of the data included in this work. The boundaries, colors, denominations, and other information shown on any map in this work do not imply any judgment on the part of the World Bank concerning the legal status of any territory or the endorsement or acceptance of such boundaries. For any questions regarding this report, please contact Vivi Alatas (valatas@worldbank.org) and Matthew Wai- Poi (mwaipoi@worldbank.org).
  • 6. 6 Acknowledgements Divided Indonesia is a product of the Poverty Global Practice’s team in the World Bank Office Jakarta. The team, led by Vivi Alatas (Lead Economist, GPVDR), provides technical and policy advice based on sound empirical research and analysis to the Government of Indonesia in support of national poverty reduction goals. Support for this report has been generously provided by the Department of Foreign Affairs and Trade of the Australian Embassy. This report was prepared by a core team led by Matthew Wai-Poi (Lead Economist, GPVDR) based on a series of background papers and presentations. The background paper on the Distributional Impact of Fiscal Policy in Indonesia was written by Rythia Afkar (Consultant, GPVDR), Jon Jellema (Consultant, GPVDR) and Matthew Wai-Poi; on the Inequality of Opportunity by Grace Hadiwidjaja (Consultant, GPVDR), Ray Hervandi (Consultant, GPVDR) and Matthew Wai-Poi; and on Perceptions of Opportunity by Taufik Indrakesuma (Consultant, GPVDR) with the guidance of Edgar Janz (Senior Knowledge Management Specialist, GPVDR) and Matthew Wai-Poi. Background presentations were developed on Top Incomes in Indonesia by Michaelino Mervisiano (Consultant, GPVDR), Matthew Wai-Poi, Monica Wihardja (Consultant, GPVDR) and Dody Suria Wijaya (Consultant, GPVDR); on Indonesia’s Middle Class by Ririn Purnamasari (Economist, GPVDR), Ikuko Uochi (Consultant, GPVDR) and Matthew Wai-Poi; on Inequality of Outcomes by Amri Ilmma (Research Analyst, GPVDR), Taufik Hidayat (Consultant, GPVDR) and Matthew Wai-Poi. Additional contributions were made by Edgar Janz, Mattia Makovec (Consultant, GPVDR), Michaelino Mervisiano, Astrid Rengganis Savitri (Consultant, GPVDR), Imam Setiawan (Consultant, GPVDR), and Bagus Arya Wirapati (Consultant, GPVDR). The report was edited by Edgar Janz. Excellent comments were received from Peer Reviewers Luis-Felipe Lopez-Calvo (Lead Economist, GPVDR), Caterina Laderchi (Senior Economist, GPVDR), Hal Hill (H.W. Arndt Professor of Southeast Asian Economies, Australian National University), as well as from Chantelle Boudreaux (Consultant, GHNDR), Melissa Chew (Consultant, GHNDR), David Gottlieb (Department of Foreign Affairs and Trade, Australian Embassy), Pandu Harimurti (Health Specialist, GHNDR), Ahya Ihsan (Economist, GMFDR), Yue Man Lee (Economist, GMFDR), Norman Loazya (Lead Economist, DECMG), Neil McCulloch (Director, Economic Policy Program, Oxford Policy Management), Puti Marzoeki (Senior Health Specialist, GHNDR), Iene Muliati (Social Protection Specialist, GSPDR), Arvind Nair (Consultant, GMFDR), Truman Packard (Lead Economist, GSPDR), Eko Setyo Pambudi (Research Analyst, GHNDR), Samer al-Samarrai (Senior Economist, GEDDR), Ali Winoto Subandoro (Health Specialist, GHNDR), Ajay Tandon (Senior Economist, GHNDR) Violeta Vulovic (Consultant, GMFDR), Mitch Wiener (Senior Social Protection Specialist, GSPDR), Rob Wrobel (Senior Social Development Specialist, GSURR), Wei Aun Yap (Consultant, GHNDR). This report has benefited greatly from these. Editing assistance was provided by Taufik Indrakesuma and Edgar Janz. This report was produced under the overall guidance of Shubham Chaudhuri (Practice Manager, GMFDR), Ana Revenga (Senior Director, GPVDR), Carlos Silva-Jaurequi (Lead Economist, GPVDR) and Salman Zaidi (Practice Manager, GPVDR). Strategic guidance and key comments were provided by Rodrigo Chaves (Country Director, EACIF), Ndiame Diop (Lead Economist, GMFDR) and Cristobal Ridao-Cano (Program Leader, EACIF). The report draws from joint work on fiscal incidence with a team from the Fiscal Policy Office, led by Luky Alfirman (Head of Macroeconomic Policy Center, PKEM-BKF)and including Arti Dyah Woroutami (Head of Welfare and Labor Sub-division of PKEM-BKF) and Ahmad Fikri Aulia (Executive of Welfare and Labor Sub-division of PKEM-BKF). The fiscal incidence work adopts the Commitment to Equity approach. Launched in 2008, the Commitment to Equity (CEQ) project is an initiative of the Center for Inter-American Policy and Research (CIPR) and the Department of Economics, Tulane University, the Center for Global Development and the Inter-American Dialogue. Developed by Nora Lustig and her team at Tulane University, the Commitment to Equity diagnostic tool relies on a comprehensive
  • 7. 7 fiscal incidence analysis designed to assess how taxation and public expenditures affect income inequality, poverty, and different socioeconomic groups. For more details, see http://www.commitmentoequity.org. The report also draws on joint work on top incomes in Indonesia, done in collaboration with Luky Alfirman of the Fiscal Policy Office and Bank Indonesia. The Bank Indonesia team includes N.A. Anggini Sari (Deputy Director, Division Head, Credit Information Regulation, Licensing, and Development Division, Reporting Management and Compliance Department), Sani Eka Duta (Assistant Director, Credit Information Division, Reporting Management and Compliance Department) and Darma Saputra (Reporting Management and Compliance Department) The perceptions data used in this report and the perceptions background paper were kindly provided by Lembaga Survei Indonesia (Indonesian Survey Institute).
  • 8. 8 Contents Foreword.................................................................................................................................................5 Acknowledgements.................................................................................................................................6 Figures.....................................................................................................................................................9 Tables....................................................................................................................................................12 Boxes.....................................................................................................................................................12 Executive Summary...............................................................................................................................13 1. Rising Inequality: Recent Trends and why it Matters ...................................................................36 1.1. Recent trends in inequality...................................................................................................36 1.2. Does inequality matter?........................................................................................................41 2. Why Inequality is Rising ................................................................................................................44 2.1. A framework for understanding inequality ..........................................................................44 2.2. Why an unfair start in life holds the poor back ....................................................................49 2.1.1 A significant degree of overall inequality is explained by circumstances at birth........49 2.1.2 An unfair start begins with differences in child health.................................................51 2.1.3 Changes in fertility patterns are also affecting inequality, both today and tomorrow 58 2.1.4 An unfair start in life continues with differences in skills development and education 62 2.3. Why a widening gap between skilled and unskilled wages is increasing inequality ............69 2.3.1 An increasing demand for and shortage of skilled workers is driving their wages higher, which benefits those children who got the right start in life ...........................................69 2.3.2 At the same time, most workers are trapped in low paying jobs.................................72 2.3.3 The widening wage gap between few skilled workers and the majority of unskilled workers is one of the main drivers of increasing inequality in the last decade ...........................76 2.4. Why financial assets are helping the rich pull away from the rest.......................................78 2.5. Why shocks make it even harder for many to catch up .......................................................83 3. How Inequality Can Be Addressed................................................................................................87 3.1. Improving local service delivery, particularly for health, education and family planning....89 3.1.1. Ensuring all children get a fair start in life through quality health care .......................90 3.1.2. Ensuring all children get a fair start in life through quality education .........................94 3.1.3. Revitalizing family planning to help poor households have the family sizes they want 97 3.2. Improving the skills of today’s workforce and providing them more productive jobs.........98 3.2.1. Creating more jobs........................................................................................................98 3.2.2. Improving protection for low-income and vulnerable workers..................................100 3.2.3. Reforming the skills training system to enable workers to access jobs......................101 3.3. Ensuring all households have effective protection from shocks ........................................102
  • 9. 9 2.6.1 Addressing high and volatile rice prices......................................................................102 2.6.2 Strengthening social protection..................................................................................104 2.6.3 Crisis Monitoring and Response: developing a permanent and comprehensive system 107 3.4. Aligning government taxes and spending to better address inequality.............................107 3.4.1 Fiscal policy as a tool to address inequality, now as well as in the future .................107 3.4.2 Spending choices are likely to have the greatest influence on current inequality.....109 3.4.3 Closing the large infrastructure gap can reduce inequality in Indonesia by strengthening growth, stimulating job, improving access to public services, and lowering food prices 110 3.4.4 However, fiscal policy needs to remain sustainable...................................................112 3.4.5 The revenue mix used to achieve fiscal sustainability can also influence inequality today 113 3.5. Most of the recommended policies have broad-based public support as a means of tackling poverty............................................................................................................................................115 4. Conclusion...................................................................................................................................117 References ..........................................................................................................................................118 Figures Figure 1.1. Average monthly per capita consumption (IDR) by decile, 2002 and 2014 .......................37 Figure 1.2. Gini coefficient (points) and national poverty rate (percent) 1980-2014 ..........................37 Figure 1.3. Gini coefficient in East Asia, 1990s and 2000s....................................................................38 Figure 1.4. Annualized point change in Gini coefficient in East Asia, 1990s and 2000s.......................38 Figure 1.5. Gini coefficients for lower-middle income countries .........................................................38 Figure 1.6. Population share by class (percent) 2002-14......................................................................39 Figure 1.7. Average conflict incidents for low, medium and high inequality districts..........................42 Figure 1.8. Type of jobs for senior high school graduates....................................................................42 Figure 1.9. Share of national consumption by each quintile: what people think it should be, what people think it is, what it really is (percent) .........................................................................................43 Figure 2.1. Growth incidence curve by household per capita consumption percentile, 1996-2010 ...44 Figure 2.2. Understanding inequality through an income-generating asset framework with a reinforcing feedback loop.....................................................................................................................46 Figure 2.3. Percentage of consumption inequality due to differences between and within groups with different birth circumstances................................................................................................................50 Figure 2.4. Percentage of consumption inequality due to differences between and within groups with different birth circumstances, by age of birth cohort ..........................................................................50 Figure 2.5. Infant mortality (per 1,000 live births) ...............................................................................51 Figure 2.6. Stunting by country (percent).............................................................................................51 Figure 2.7. Probability of stunting by parents’ education (percent).....................................................52 Figure 2.8. Skilled first ante-natal and post-natal care usage (percent)...............................................52 Figure 2.9. Unskilled deliveries by region (percent) .............................................................................53 Figure 2.10. Unskilled deliveries by per capita consumption decile (percent).....................................53
  • 10. 10 Figure 2.11. Complete immunization rates by different populations (percent)...................................53 Figure 2.12. Age-appropriate breastfeeding by age (percent) .............................................................54 Figure 2.13. Micronutrient intake and deworming by different populations (percent) ......................54 Figure 2.14. Lack of access to clean water and proper sanitation by household per capita consumption decile (percent)...............................................................................................................54 Figure 2.15. Diarrhea incidence and treatment (percent)....................................................................54 Figure 2.16. Availability of Puskesmas health centers (percent of villages with Puskesmas) and distance to Puskesmas if not in village (km).........................................................................................55 Figure 2.17. Selected service indicator scores and general service readiness index for Puskesmas by province, 2011 ......................................................................................................................................56 Figure 2.18. Full immunization rates for children aged 12-23 months by mother’s education (percent ..............................................................................................................................................................57 Figure 2.19. Immunization rates for children based on birth order (percent) .....................................57 Figure 2.20. Urban poverty for housing, water and sanitation ............................................................58 Figure 2.21. Rural poverty for housing, water and sanitation..............................................................58 Figure 2.22. Comparison of actual and counterfactual 2002 Gini if household size in 2002 remained the same as in 1993 ..............................................................................................................................59 Figure 2.23. Comparison of actual and counterfactual 2014 Gini if household size in 2014 remained the same as in 2002, and if size continued to decline at the same rate as 1993-2002........................59 Figure 2.24. Years of completed education, 16-18 year olds (percent) ...............................................63 Figure 2.25. Years of completed education, 19-21 year olds (percent) ...............................................63 Figure 2.26. Annual schooling costs by school level (IDR millions).......................................................64 Figure 2.27. Percentage of households with school-aged children receiving a scholarship by household per capita expenditure deciles............................................................................................64 Figure 2.28. Median monthly incomes of children aged 15-18 years old ............................................64 Figure 2.29. Enrolment of 13-15 year olds by parents’ consumption quintile.....................................65 Figure 2.30. Enrolment of 13-15 year olds by parents’ education .......................................................65 Figure 2.31. Educational attainment probability of children born in the 1960s and 1970s with parents who did not complete primary, relative to the 1950s cohort (percent) ..............................................65 Figure 2.32. Adult income quintile probability of children born in the 1960s and 1970s with parents who did not complete primary, relative to the 1950s cohort (percent) ..............................................65 Figure 2.33. ECD enrolment rates for 5-6 year olds by region, gender and income (percent) ............66 Figure 2.34. Probability of 7-14 year old children being in the top or bottom quintile of cognitive scores by parents’ education (percent)................................................................................................66 Figure 2.35. ECD availability in village (percent) and distance to nearest center if not in village (km) by region ...............................................................................................................................................67 Figure 2.36. Quality of schooling facilities and teachers (percent) ......................................................67 Figure 2.37. Children who reported reading a text book in the last week (percent)...........................68 Figure 2.38. Children who reported reading a science book in the last week (percent)......................68 Figure 2.39. Employment by education level, 2002-13 (percent) ........................................................69 Figure 2.40. Although the labor force has become more skilled, less than 8% has a university degree ..............................................................................................................................................................70 Figure 2.41. Important skills identified by employers, and skill gaps...................................................70 Figure 2.42. Method for finding job, youth aged 15-24 years old (percent)........................................70 Figure 2.43. Method for finding job, all workers aged 25 years and older (percent)...........................70 Figure 2.44. Youths aged 19-24 years who have attended or competed training course (percent)....71 Figure 2.45. Share of firms providing formal training (percent)...........................................................71
  • 11. 11 Figure 2.46. Annualized wage growth (2001-14) versus sectoral productivity (2012 annual value added per worker, IDR millions) ...........................................................................................................71 Figure 2.47. Share of total employment, 2014.....................................................................................72 Figure 2.48. Employment growth and labor productivity growth are negatively correlated (employment and labor productivity growth by sector 2001-2012, percent)......................................72 Figure 2.49. Dependent employment is on the rise, but most workers are still employed in vulnerable form of work (employment composition by status, percent) ..............................................................73 Figure 2.50. Low-productivity sectors tend to have higher levels of informality (% of informal workers by sector, 2012) ....................................................................................................................................73 Figure 2.51. Labor market legislation index across countries ..............................................................74 Figure 2.52. Minimum wages in selected East Asian countries (USD per month)................................76 Figure 2.53. Worker wage premium over those with primary education or less, 2003-10 (percent)..77 Figure 2.54. Household per capita consumption premium over those with head of household primary education or less, 2003-10 (percent)....................................................................................................77 Figure 2.55. Primary wage Gini coefficient, 2000-13............................................................................78 Figure 2.56. Labor share of income, 10 year change (percentage points) ...........................................79 Figure 2.57. Labor share of Indonesian manufacturing income (percent)...........................................79 Figure 2.58. Jakarta Composite Index, 1997-2014................................................................................79 Figure 2.59. Jakarta residential condominium market.........................................................................79 Figure 2.60. Change in share of total wealth held by richest 10 percent of households (percentage points)...................................................................................................................................................80 Figure 2.61. Share of total wealth held by richest 10 percent of households (percent)......................81 Figure 2.62. Growth incidence curve, 1993-2014 (annual real per capita consumption growth by household per capita consumption quintile)........................................................................................82 Figure 2.63. Access to health insurance (percent)................................................................................84 Figure 2.64. Access to pensions (percent) ............................................................................................84 Figure 2.65. The three dimensions of universal health coverage.........................................................85 Figure 2.66. CPI and CPI for the poor, 2002-13 ....................................................................................85 Figure 2.67. CPI poor (food) and CPI poor (non-food), 2002-13...........................................................85 Figure 2.68. Poverty and vulnerability rates in Indonesia, 2014 (percent) ..........................................86 Figure 2.69. Proportion of poor who were poor the year before ........................................................86 Figure 3.1. Growth incidence curve, Thailand 2000-06........................................................................88 Figure 3.2. Growth incidence curve, Thailand 2006-10........................................................................88 Figure 3.3. Growth incidence curve, Vietnam 2004-12 ........................................................................88 Figure 3.4. Growth incidence curve, Brazil 2001-09.............................................................................88 Figure 3.5. Public health spending (percent of GDP and out-of-pocket spending (percent of total health spending) internationally...........................................................................................................90 Figure 3.6. Changes in real health expenditure (percent, 2003-11) and change in birth by skilled attendant (percent, 2003-11) ...............................................................................................................91 Figure 3.7. Changes in real health expenditure (percent, 2003-11) and change in immunization coverage (percent, 2003-11).................................................................................................................91 Figure 3.8. Receipt of severance pay, as reported by workers (percent)...........................................100 Figure 3.9. Employees receiving less than minimum wage by consumption quintile (percent)........100 Figure 3.10. Reduction in the Gini Coefficient through fiscal policy, selected countries (Gini points) ............................................................................................................................................................108 Figure 3.11. Inequality reducing effectiveness (EI) and government spending on different programs and policies, 2012 ...............................................................................................................................109 Figure 3.12. Incidence of indirect taxes in selected countries (percent of market income) ..............114
  • 12. 12 Tables Table 2.1. Average household size by per capita consumption decile, 1993 and 2002 .......................59 Table 2.2. Average household size by per capita consumption decile, 2002 and 2014 .......................59 Table 2.3. Oral reading fluency advantages based on ECD participation, location and wealth (words per minute faster than reference)........................................................................................................67 Table 2.4. Ease of doing business in East Asia Pacific...........................................................................75 Table 2.5. Change in consumption Gini 2003-10 decomposed, percentage of change explained.......78 Table 2.6. Household income mobility matrix, 1993-2007...................................................................86 Table 3.1. Drivers of inequality, based on the income-generating asset model ..................................87 Table 3.2 Drivers of inequality and possible tools to address them.....................................................89 Table 3.3. Costs and funding in DKI Jakarta to reach different education standards...........................96 Table 3.4. Providing opportunities for hard work, protecting people from shocks, and eradicating corruption are seen as top priorities for reducing inequality.............................................................115 Boxes Box 1.1. Measuring inequality ..............................................................................................................40 Box 2.1. Understanding inequality with growth incidence curves .......................................................45 Box 2.2. Putri is poor with limited assets and low returns ...................................................................48 Box 2.3. Fitri is an emerging consumer with minor asset accumulation..............................................48 Box 2.4. Dewi is an economically secure consumer with improving assets.........................................49 Box 2.5. Siti is upper class with many assets and high returns................ Error! Bookmark not defined. Box 2.6: Strategic and emerging issues for family planning in Indonesia.............................................61 Box 2.7. Increasing inequality: not just the commodity boom.............................................................82 Box 3.1. Recent reforms in DKI Jakarta show how BOSDA can complement BOS to help schools reach higher quality standards, support schools in disadvantaged areas, and encourage higher performance .........................................................................................................................................96 Box 3.2. A public works program for Indonesia..................................................................................106 Box 3.3. Improving infrastructure in Indonesia ..................................................................................111 Box 3.4. Achieving fiscal sustainability: priority actions .....................................................................112
  • 13. 13 Executive Summary In 2015, Indonesia stands as a divided country, unequal in many ways. There is an income divide between the richest 10 percent and the rest of the country. This inequality comes about because of the many other inequalities in Indonesia. People are divided into the haves and have-nots from before birth. Some children are born healthy and grow up well in their early years; many do not. Some children go to school and get a quality education; many do not. This means that some young adults enter the workforce with the right skills that are increasingly needed and rewarded in today’s modern and dynamic economy; most do not and are trapped in low productivity and low wage jobs. Some families have access to mechanisms which can protect them from the many shocks which occur in life; many do not. And a small number of Indonesians have access to financial assets which increase their wealth over time. This wealth is passed down to their children, both as money and through health and education. And inequalities are passed on to the next generation, where they are deepening. This report asks why inequality is increasing, why it matters, and what can be done. The first section examines the trend in inequality, which is already relatively high in Indonesia and rising more quickly than in many other places. It also discusses why it matters; some inequality is good, providing rewards for hard work and innovation, but when inequality is too high it can be bad for economic growth, slow poverty reduction, and undermine social harmony. The second section seeks to understand what the drivers of rising inequality are. Why are not more children growing up healthy and leaving school with the right skills when there are more schools and health centers than ever? Why are workers unable to move to more productive jobs where they could get paid more? How do shocks prevent many hardworking Indonesians from climbing up the economic ladder? And why might the increasing concentration of wealth in a few hands be both driving inequality higher today and tomorrow? The final section looks at what can be done if the country is not to grow ever more divided; a relatively few people living in one Indonesia where they are healthy, happy and prosperous, and many more living in another Indonesia, aspiring to a better life but unable to attain it. I. Trends in Inequality in Indonesia Inequality has been increasing with most of the economic growth being enjoyed by relatively few Inequality in Indonesia is rising rapidly. By most measures, inequality in Indonesia has reached historically high levels. In 2002, the richest 10 percent of Indonesians consumed as much as the poorest 42 percent combined; by 2014, they consumed as much the poorest 54 percent. A popular measure of inequality is the Gini coefficient, where 0 is complete equality and 100 is complete. During the Asian Financial Crisis, poverty went up sharply while the Gini fell; everyone was affected, but the richest lost the most. However, since then the Gini has increased from 30 points in 2000 to 41 points in 2014, its highest recorded level. Even this, however, is likely to be underestimated because household surveys tend to miss out the richest households. Once relatively moderate by international standards, Indonesia’s level of inequality is now becoming high and climbing faster than most of its East Asian neighbors.
  • 14. 14 After a long period of stability, the Gini began rising, then fell with the Asian Financial Crisis, before rising sharply since recovery. Gini coefficient (points) and national poverty rate (percent) 1980-2014 The increase in the Gini in Indonesia over the last two decades is one of the highest in the region. Gini coefficient in East Asia, 1990s and 2000s Source: BPS, Susenas and World Bank calculations Note: Nominal consumption Gini. The national poverty line was changed in 1998, and the 1996 rate calculated under both the new and old methodologies. Note: Consumption Ginis for all countries except Malaysia, which uses income. The periods for each country are: Indonesia 1990-2011; Malaysia 1992-2009; Lao PDR 1992- 2008; China 1990-2008; Vietnam 1992-2008; Thailand 1990-2009; the Philippines 1991-2009; and Cambodia 1994-2008. Source: Kanbur, Rhee and Zhuang (2014) Inequality in Asia and the Pacific, from PovCalNet. Fifteen years of sustained growth has reduced poverty and created a growing class of economically secure households. After recovering from the 1997-98 Asian Financial Crisis, Indonesia’s real GDP per capita grew at an annual average of 5.4 percent between 2000 and 2014. This growth helped to pull many out of poverty; the poverty rate has more than halved from 24 percent during the crisis down to 11 percent by 2014. Growth has also helped create a stronger consumer class than ever before; there are now 45 million people (the richest 18 percent of all Indonesians) who are economically secure and enjoying a higher quality of life. They are the fastest growing segment of the population, increasing at 10 percent per year since 2002.1 However, the economically secure are now leaving the other 205 million behind. The benefits of economic growth have been enjoyed largely by the growing consumer class. Between 2003 and 2010, consumption per person for the richest 10 percent of Indonesians grew at over six percent per year after adjusting for inflation, but grew at less than two percent per year for the poorest 40 percent. This has contributed both to a slow-down in the pace of poverty, with the number of poor people falling by only 2 percent per year since 2002, and the numbers of those vulnerable to poverty falling barely at all. 1 For this report, households in the consumer class in Indonesia are defined as those who are economically secure from poverty and vulnerability. See note to chart and World Bank (forthcoming (a)) for more details. 0 5 10 15 20 25 30 35 40 45 1980 1983 1986 1989 1992 1995 1998 2001 2004 2007 2010 2013 Gini Poverty (old) Poverty (new) Suharto Era Asian Financial Crisis Democracy, Decentrali-zation and Commodity Boom GFC and Aftermath 0 10 20 30 40 50 60 1990s 2000s
  • 15. 15 An economically secure “consumer” class has grown strongly at 10 percent per year since 2002, and now includes nearly one in five Indonesians. However, reductions in poverty and vulnerability have been very small. Population share by class (percent) 2002-14 Source: Susenas and World Bank calculations. The poor are below the national poverty line of around IDR 300,000 per person per month. The vulnerable have a greater than 10 percent chance of being poor the next year and are under 1.5 times the poverty line. The consumer class are economically secure, with a less than 10 percent chance of being poor or vulnerable next year, and consume more than IDR 1m per person per month. The emerging consumer class are safe from poverty but not vulnerability and lie between the vulnerability and economic security lines. See World Bank (forthcoming (a)) for more details. II. Why Inequality Matters Income inequality can be unfair when not everyone has the same initial opportunities Income inequality is not always a bad thing; it can provide rewards for those who work hard and take risks. Hard work and innovation benefit society by creating new goods and services that everyone can enjoy, as well as contributing to a larger economy. This, in turn, can provide the government with a greater ability to provide public services to all. If this results in a gap between those hard workers and those who work less hard, then some income inequality may be justified and even desirable. Many Indonesians share this view. When asked in a 2014 survey whether inequality is ever acceptable, 74 percent said that “inequality is sometimes acceptable” so long as wealth acquisition was fair and meritocratic. Inequality can be unfair, however, when it is due to factors beyond the control of individuals. There are many inequalities. There are economic inequalities of income, wealth and consumption. There are also inequalities of opportunities, when not everyone has access to the same opportunities in life. Factors beyond the control of an individual – where you are born, how educated or wealthy your parents are, and what access to public services you had when you were growing up – can have a major influence on how your life turns out. Getting a healthy start in life and a quality education are fundamental prerequisites for getting a good job and earning a decent living in the future. When economic inequality arises because of Inequality of opportunity, when not everyone has a fair start in life, it is unfair. Other factors outside of an individual’s control which can affect incomes, standard of living and inequality include government policies, such as food import restrictions which increase the cost of living most for the poor, or patterns of government taxes and spending which do not collect and channel sufficient resources to help the poor and vulnerable or those without equal access. 0 20 40 60 80 100 2002 2006 2010 2014 Consumer Class Emerging Consumer Class Vulnerable Poor 10.0 Annual Growth* (%) 2.4 -0.1 -2.2
  • 16. 16 High inequality can also lead to slower growth and poverty reduction and increased conflict High levels of inequality may slow economic growth, while more equal countries may grow faster. High inequality may reduce economic growth for all, if poorer people are unable to properly invest in their children’s development, if people fail to exit poverty and vulnerability and move into the consumer class, and if people fail to get productive jobs. Recent research indicates that a higher Gini leads to lower and less stable growth. Moreover, when the share of total income held by the richest 20 percent of people increases by 5 percentage points, economic growth falls by 0.4 percentage points. At the same time, when the share of total income held by the poorest 20 percent of people increases by 5 percentage points, growth increases by 1.9 percentage points. Increased income shares for the second and third poorest 20 percent also increases growth. High inequality can also have social costs. When people perceive that there are large differences in income and wealth, it can create social tensions and disharmony, which can in turn create conflict. Indeed, districts with higher levels of inequality than the average in Indonesia have 1.6 times the rates of conflict than districts with lower levels of inequality. Conflict in turn can reduce economic growth through labor disruptions and lower investment. Furthermore, if inequality is due to rent- seeking behavior – people trying to capture existing resources without generating new wealth through productive activity – then this also has costs; individuals seek favorable treatment and protection of their position, leading to misallocation of resources, corruption and nepotism, all of which have high social and economic costs, including a loss of confidence in public institutions. In fact, in Indonesians already think inequality is too high. People surveyed estimate, on average, that the richest fifth of Indonesians account for 38 percent of all consumption. Actually, inequality is even higher than they think: national data indicate that the richest fifth really enjoy 49 percent of all household consumption. On average, respondents indicated a preference for a more equal country, where the richest fifth only account for 28 percent of consumption. They may not know, however, that this ideal would make Indonesia more equal than almost all other countries in the world. Not only do surveyed Indonesians believe inequality should be lower than it is now, in reality it is even higher than they think it currently is. Share of national consumption by each quintile: what people think it should be, what people think it is, what it really is (percent) Source: World Bank (2015a) using LSI (2014) data 0 10 20 30 40 50 60 70 80 90 100 What it actually is What they think it is What they think it should be Poorest Quintile 2 3 4 Richest Quintile
  • 17. 17 Given the high level of inequality in Indonesia and public concern, the consequences of doing nothing could be serious; urgent action is needed Given this perception, most Indonesians think that urgent action is needed, which is why inequality has become a major public issue. Inequality was a key issue in the run-up to the Indonesian presidential elections, with major national and international media outlets reporting on rising inequality and both presidential candidates making public statements about strategies to reduce inequality. They have the support of the public; 47 percent of those surveyed said it was “very urgent” for the government to address inequality, and another 41 percent thought it was “quite urgent.” Taking action will require a better understanding of why inequality is rising, whether this matters, and what can be done about it. The World Bank initiated a research project to examine inequality and its drivers in Indonesia. The purpose of the project is to support the Government of Indonesia in better understanding this emerging issue and be able to make a decision, informed by rigorous research and evidence, about how to respond. This first section of this summary of the report examined recent trends in inequality and why these may be concerning. The next section will look into the reasons why inequality is rising and why a policy response is needed. The third and final section will consider what government policy makers can do to address increasing inequality. III. Why Inequality is Rising To understand what drives inequality in Indonesia and why it is rising, we need to understand how different households have different resources and how they generate income from them. Households use different resources to earn income. They use their labor to earn wages and salaries, but they can also earn income from financial and property assets. Understanding why some households have better jobs and earn more, and why some households have more financial assets and earn more, is key to understanding why inequality is rising. Inequality is also influenced by how this income is spent: how much is consumed (and over how many people is it shared) and how much saved? In addition, shocks and disasters can suddenly erode household assets and incomes.
  • 18. 18 An income-generating asset framework can help us think about why inequality arises. The framework includes a reinforcing feedback loop which can transmit inequality over time. Understanding inequality through an income-generating asset framework with a reinforcing feedback loop There are four main drivers of inequality in Indonesia that affect both current and future generations. Applying the framework above, we find that there are four main drivers of inequality in Indonesia. First, inequality of opportunity means not everyone develops the skills needed to find well-paying jobs. Second, with an increasing emphasis on skill in the modern economy, the rewards for those who do get good jobs are increasing, which is driving up wage inequality. At the same time, those without the skills are getting trapped into informal or low productivity jobs. Third, there are inequalities in access to wealth that also drive differences in income. Fourth, shocks can affect inequality at any stage of the framework by eroding a household’s ability to earn an income, save, and invest in health and education. In the following section we explore each of these drivers. A. An unequal start to life and the consequences for human resources A key driver of inequality is that poorer children have an unfair start in life, which undermines their ability to succeed later in life Inequality of opportunity from birth can explain a substantial amount of income inequality in later life. Adult income or consumption inequality is unfair when it is driven by inequality of opportunities when they were young: the conditions that children are born into and have no ability to change. One-third of all consumption inequality in Indonesia is due to a small number of factors that are outside of an individual’s control, a persistently high level. The most significant of these factors is differences between households based mostly on the level of their parents’ education and, to a lesser extent, where they were born. Differences in gender explain relatively little of the level of inequality in Indonesia. Children’s health and nutrition in the first two years will affect them for the rest of their lives Inequality of opportunity begins when more than one in three Indonesian children fails to get a healthy start. Differences in the quality of a household’s human resources, their most important
  • 19. 19 asset, drive a large degree of consumption inequality in Indonesia. These differences start even before birth. Some children from poorer households do not receive proper nutrition during the critical development stages – from when they are still in the womb and up until they are two years old. These children are stunted, failing to reach the right height for their age, develop their cognitive skills more slowly, reach lower educational levels, and earn less as adults, compared to children who grow up healthy. This is one of the most important development challenges for Indonesia, where 37 percent of children are stunted, much higher compared to regional neighbors. The persistently high rates of childhood stunting come in large part from unequal access to nutrition and quality health services. Many poor children are not properly breastfed and poorer children are the least likely to be getting the micronutrients they need. Most start the immunization process but few of them finish it. Also, many children lack access to clean water and proper sanitation, which increases the risk of illness and affects nutrition. Gaps in access to health care have been closing over time but remain significant. More importantly, a quality gap persists; facilities in many places lack the basic amenities and trained and competent personnel required to deliver the basic health services mandated by law. One reason is that Indonesia has the fifth lowest health spending relative to GDP in the world. Childhood stunting is strongly linked to worse mortality, cognitive, education, and adult income and health outcomes. Stunting is much higher in Indonesia than most neighboring countries. Stunting by country (percent) Gaps in access to better child health are closing (such as in water in sanitation as shown), although quality levels remain persistently low in many places. Lack of access to clean water and proper sanitation by household per capita consumption decile (percent) Source: WHO Child Nutrition Indicators. Source: Susenas Child health is also affected by fertility patterns in poorer households; having more children earlier can negatively affect child health and means sharing limited resources amongst many members The family size of poorer households shrank faster than richer households during the 1990s, which helped to moderate inequality. More people in the house mean less each per person. Poorer 0 10 20 30 40 50 Cambodia Indonesia Myanmar Philippines Vietnam Malaysia Thailand 0 10 20 30 40 50 60 70 80 90 1 2 3 4 5 6 7 8 9 10 Household Per Capita Consumption Decile Poor sanitation (2002) Poor sanitation (2011) Poor water (2002) Poor water (2011)
  • 20. 20 households tend to be larger with more children, so not only do they have lower incomes than richer households, but their consumption per person is even less. However, due to an effective national family planning campaign since the 1970s, the family size of poorer households shrank faster than richer households during the 1990s. This meant inequality was lower than it would otherwise have been. With poorer households having less people to spread their income over, their per capita consumption rose faster and the Gini was 2.5 points lower that than it would have been if relative household sizes had been the same in 2002 as they were in 1993. This trend reversed during the 2000s; the family size of richer households is still falling while poorer households have remained the same size, contributing significantly to rising inequality. Between 2002, the average household size of the poorer half of Indonesians has remained stable, while that of the richer half of Indonesians has continued to fall, albeit it more slowly than in the 1990s. This has contributed to the increase in inequality over this period. If reductions in household sizes for the poor and rich had continued to follow the same pattern as between 1993 and 2002, the Gini would have been 4 points lower in 2014, at 37 rather than 41. A key reason for this is that the effectiveness of family planning in Indonesia has fallen over the last decade. The contraceptive prevalence rate is roughly the same now as it was a decade ago, and while the unmet need for contraception is not particularly high compared to other countries, it remains a major reproductive health issue and has shown little signs of falling in recent years. Moreover, this reflects unequal access to proper family planning between the rich and poor, especially for longer-term methods to limit family sizes. Decentralization, a lack of political support at the local level and regulatory deficiencies have weakened family planning. First, the National Family Planning Agency (BKKBN), previously a strong, centrally run agency, has struggled to maintain its effectiveness in a decentralized Indonesia, where significant responsibilities for implementation and monitoring have been devolved to districts. Second, a lack of political commitment to family planning by local governments has emerged after decentralization, realized in insufficient budgetary support for family planning. Furthermore, these demographics changes will have a bearing on opportunities for the next generation. Not only has the reversal of family size trends for richer and poorer households contributed to higher consumption inequality today, it will also affect consumption inequality tomorrow. Smaller family sizes for richer households bring a number of benefits that will advantage their children compared to those from poorer households. It can contribute to better maternal and child health outcomes; improved birth spacing allows the mother’s body to recover and deliver more nutrients, helping babies be born at a healthy weight. It also means more attention can be devoted to each child, helping prepare them better for entering preschool. Reduced rates of teen pregnancy can decrease maternal and child mortality rates, as well as the incidence of low birth weight. Healthier children born into richer families in turn can increase inequality tomorrow because they have had a better start in life. While enrolment rates for poorer children have improved, they often do not receive the same quality of education Inequality of opportunity deepens when not every child gets a smart start, largely due to unequal access to quality education in Indonesia. Children living outside of Java or in rural areas, especially the poor, are less likely to attend early childhood development programs, when learning begins. By primary school, though, enrolment is nearly universal, and junior secondary enrolment gap between richer and poorer children has been closing over time. However, poorer children are not making the transition to the next schooling level at the same rate as richer ones; enrolment rates for the richest 20 percent of children are only 9 percentage points higher in year six (the last year of primary), but 21 percentage points higher in year seven (the beginning of junior high). However, the biggest
  • 21. 21 challenge to an equal start for all is the quality of education. Rural schools and schools in Eastern Indonesia are less likely to have trained teachers or proper facilities, and teacher absenteeism is a problem in some places. Even if poorer children stay in school, disparities in educational quality persist, so that the value of a complete education is often less than it is for better off children. This negatively affects the learning outcomes of remote and poorer students. For example, Grade 3 children in Java read 26 words faster per minute than those in Nusa Tenggara, Maluku or Papua. Similarly, richer children read 18 words faster than poorer children. In turn, the low quality of education for the disadvantaged (the majority of Indonesian children) drives the low average quality of educational outcomes; 74 percent of Indonesian 15 year-old children do not achieve even Level 1 basic skills (a score of 420) on PISA international mathematics and science tests, the fifth worst share out of 82 countries (OECD 2015). The enrolment gap between richer and poorer children has been closing over time…. Enrolment of 13-15 year olds by parents’ per capita consumption quintile …but increasing enrolment rates masks differences in the quality of education across schools and regions… Quality of schooling facilities and teachers (percent) Source: Susenas 2012 Source: Podes 2011 Infrastructure Survey …which in turn contribute to Indonesia have some of the worst international test scores in science and mathematics Percentage of 15-year olds with international PISA mathematics and science scores below Level 1 (basic skills, 420 points) Source: OECD 2015 50 60 70 80 90 100 2004 2007 2011 2013 Q1 Q2 Q3 Q4 Q5 55% 77% 92% 49% 68% 86% 62% 86% 98% 33% 45% 61% 0% 10% 20% 30% 40% 50% 60% 70% 80% 90% 100% All Schools: Av. Share of Teachers with S1 Diploma Share SMP with Laboratory Share Schools with Electricity National Rural Urban Maluku/Papua 0 20 40 60 80 100 Ghana SouthAfrica Indonesia Qatar Botswana Syria Brazil Jordan Argentina Palestine Macedonia Lebanon Mexico Bahrain Malaysia Kazakhstan Armenia UAE Romania Turkey Greece Ukraine Croatia Hungary UnitedStates Italy Lithuania France NewZealand UnitedKingdom Austria Australia Latvia Netherlands Switzerland Liechtenstein Poland Vietnam Macao Japan Korea HongKong
  • 22. 22 Despite closing gaps in access to critical education and health opportunities, inequality continues to increase, with the role of birth circumstances remaining significant. The significant economic and education expansions which Indonesians enjoyed in the 1960s and 1970s meant the role of birth circumstances played by factors such as parents’ education and where you were born and raised fell from explaining 39 percent of today’s consumption inequality for people born in the 1950s to 34 percent for those born in the 1970s. However, this decline has stopped and may even be reversing for those born in the 1980s and onwards. This is due in part because access to quality services remains unequal, even if physical gaps have closed. Therefore the skills gap between advantaged and disadvantaged children remains. But this alone would not lead to rising inequality. Instead, the persistent skills gap is combining with an increasing reward for those skills in the modern labor market to drive inequality higher. B. Two labor markets: increasing skilled wages for the few skilled workers and a low- productivity job trap for everyone else An increasing demand for and shortage of skilled workers is driving their wages higher In the modern, dynamic, global economy, technological advances, especially in information technology, means skills are becoming more important. Technological progress has brought significant benefits in recent decades, with cheaper transportation and cheaper goods, greater access to markets for those in remote areas, and improved communication and knowledge sharing. The new technologies underpinning these advances are demanding increasingly more skill to use and improve. As a consequence, demand for skilled workers in many sectors has increased in most countries around the world. And these skilled workers tend to be those children who completed school and benefitted from a high quality education in the first place, highlighting the consequences of unequal opportunity from birth. In Indonesia, employers are increasingly demanding more skilled workers, but are struggling to find them. Employers in Indonesia are also looking for workers with higher skill levels. The proportion of jobs requiring senior high school or tertiary education has increased over the past decade from 22 percent in 2002 to 35 percent in 2013. But education levels are not the same as skills. Despite increasing educational attainment in Indonesia, over half of all firms surveyed in manufacturing and services outside of education say that finding professionals is “hard” or “very hard”, and 40 to 50 percent of them said their staff were lacking thinking, behavioral, computer and language skills. At the same time, there are few opportunities for those who leave school without the right skills to improve them. Much of the Indonesian workforce leaves school without basic skills because of incomplete and poor quality education. There are limited opportunities for them to develop these skills later in life. Less than one percent of youths aged 19 to 24 years old have attended training courses in engineering, IT or languages, in part because of limited supply. At the same time, there are few on-the-job learning opportunities either. Few firms in Indonesia are providing such training, particularly compared to the rest of East Asia and elsewhere in the world. Around 70 percent of firms in East Asia employing more than 100 workers offer formal training; in Indonesia less than 40 percent do, and the gap increases for medium and smaller firms compared to the region. With limited access to “second-chance” skills training opportunities, these workers find it difficult to improve their skills to find better jobs. As a consequence, the wages for skilled workers have been increasing faster than those for unskilled workers. There is an increasing wage gap between skilled and unskilled workers. Skills, rather than education, are hard to identify in labor force surveys. However, on the whole, wages in higher productivity sectors which demand more skill, such as financial services, telecommunications and some manufacturing sectors, have risen faster than in those in lower productivity sectors. On
  • 23. 23 average, every extra IDR 200 million of annual labor productivity enjoyed by a sector corresponded to one percentage point higher real wage growth each year between 2001 and 2014.2 In this labor market, workers from richer households, where they are more likely to be better educated and more skilled, are benefiting from higher wages. The proportion of employment requiring higher education levels has been increasing. Employment by education level, 2002-13 (percent) Nearly half of employers surveyed identified skill gaps in staff. Important skills identified by employers, and skill gaps Source: Sakernas, World Bank calculations Source: World Bank (2011) Skills for the Labor Market in Indonesia. At the same time, most workers are trapped in low paying jobs With most existing and new jobs being in low productivity sectors, most workers are trapped in low paying jobs, which are often in the agricultural and informal sectors. Between 2001 and 2012, a total of over 20 million new jobs were created. Employment creation, however, has been concentrated in low-productivity, non-skill-intensive sectors. Out of total employment growth, 30 percent occurred in community, social and personal services and 28 percent in wholesale, trade and retail, while manufacturing contributed only to 16 percent of total growth (3.3 million). In addition to the low skills of most workers, other factors impede the creation of more productive jobs, beginning with barriers to competitiveness and productivity. Underinvestment in infrastructure and a poor investment climate have been major constraints to creating more and better jobs. Investment in infrastructure collapsed during the Asian Financial Crisis and has not fully recovered since. Total infrastructure investment declined from an average 7 percent in 1995-97 to around 3-4 percent of GDP in recent years, compared to over 7 percent in Thailand and Vietnam, and 10 percent in China over the past decade. Despite rising government spending in recent years, Indonesia’s core infrastructure stock, such as road networks, ports, electricity, telecommunication facilities, has not kept pace with economic growth. Indonesia has lost more than 1 percentage point of additional GDP growth due to under-investment in infrastructure, chiefly transportation. Problems with transportation are among the worst business constraints for manufacturing firms and 2 Labor productivity is measured here as the value of GDP output in the sector divided by the number of workers. Worker productivity ranges from around IDR 20 million of GDP in very low productivity sectors, such as agriculture, to IDR 100-200 million in higher productivity sectors in manufacturing and financial services, to over IDR 500 million in non-oil and gas mining. 0 20 40 60 80 100 2002 2013 SD or less SMP SMA Tertiary
  • 24. 24 prohibitive transport costs undermine their competitiveness. Raw material producers find themselves unable to tap growing opportunities linked to final consumer demand. It is cheaper to import oranges from China than to source them from Kalimantan. At the same time, obtaining business licenses is very complicated, expensive and time-consuming. Indonesia ranks 114th out of 189 countries in the ease of doing business, worse than Malaysia (18th ), Thailand (26th ), Vietnam (78th ), China (90th ) and the Philippines (95th ). For example, obtaining the licenses necessary to start a new business in manufacturing takes 794 days by law, although actual implementation can be slower still. And it takes 101 days to get an electricity connection, compared to 35 in Thailand. Rigid labor market regulations also discourage formal job creation and hinder workers from moving to more productive sectors while providing ineffective worker protection. Indonesia has some of the most rigid labor regulations in the region. Indonesia has a minimum severance pay of at least 100 weeks of wages. At the same time, an increasingly uncertain minimum wage setting process has resulted in large increases recently; in 2013, 25 provinces increased their minimum wage by an average of 30 percent and Jakarta increased it by 44 percent, taking it even further above Thailand and Vietnam, but also above China and the Philippines, despite having one of the lowest labor productivities. High severance and an uncertain minimum wage process mean firms are less likely to employ workers formally. Most companies respond by not using formal contracts or using short-term contracts. At the same time, the legislation protects only a small number of workers. Most workers receive no severance payment at all (66 percent), while those who do receive payments usually receive less than they are entitled to; only 7 percent of fired workers received the full payment. Furthermore, as a consequence of these regulations, workers find it difficult to move from informal to formal jobs, as formal employers consider high costs of dismissal and uncertain minimum wages when hiring. At the same time, formal workers are less likely to move from less productive sectors to more productive ones, since workers who want to move are not compensated fully for severance by their employers if they leave voluntarily. Thus, unequal development of skills is combining with rising returns to those skills to drive inequality higher Inequality of opportunity in health and education combined with increasing returns to skill are together increasing inequality. Despite increasing enrolment rates for poorer and disadvantaged children, the poor quality of education they receive, and often the cognitive disadvantages they suffer from stunting, mean that they are not obtaining the skills needed to take advantage of the increasing demand for skilled workers and the increasing rewards which are coming with that. And since most of the other jobs being created are low productive and often informal, they are trapped in low wage jobs. At the same time, equipped with skills, workers from richer households are benefiting from a labor market with a skills shortage. The widening wage gap between few skilled workers and the majority of unskilled workers is one of the main drivers of increasing inequality in the last decade. The increasing skilled wage gap is reflected in higher wage inequality. The Gini coefficient for primary wages increased by around 5 points over the 2000s, contributing to higher inequality. In fact, around 28 percent of the increase in consumption inequality in the 2000s can be explained by increasing returns to education. Since there is a wide degree of variation in skill within each level of education, the contribution of increasing returns to skill, rather than education, is likely to be even higher. C. High wealth concentration and its consequences A small number of Indonesians are benefitting from financial assets – sometimes through corruption – that, in turn, drives higher inequality in the future Households earn income not only through jobs but also financial assets, which are highly concentrated amongst the richest households. The share of income generated by labor has been
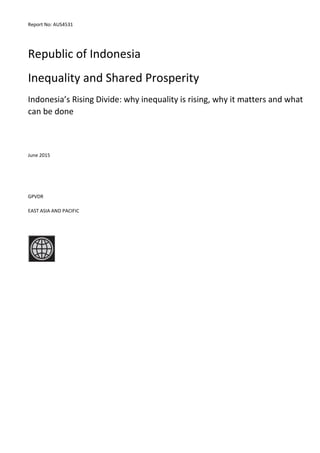
  • 25. 25 falling and the share generated by capital, such as financial and property assets, has been increasing, in Indonesia as elsewhere in the world. In Indonesia, this partly reflects the strong returns to these assets over the last decade. It is largely rich households, however, who have access to these resources. The richest 10 percent of Indonesians own an estimated 77 percent of all wealth, which is equal second highest (along with Turkey and Hong Kong) after Russia from a set of 46 countries. This means that income from financial assets benefits fewer households in Indonesia than elsewhere. Indonesia has one of the highest concentrations of wealth out of 46 countries with available data Share of total wealth held by richest 10 percent of households (percent) Source: Credit Suisse (2014) Furthermore, accumulated wealth generates even higher incomes in the future, driving inequality higher. Financial assets are generating higher incomes for only a few wealthy households in Indonesia, and these households are then saving this income as even more wealth. The share of wealth owned by the richest 10 percent in Indonesia increased by 7 percentage points between 2007 and 2014, in the top 10 of 46 countries over that period. These increased financial assets today generate even higher incomes tomorrow. Some accumulation is due to differential tax treatment of labor and capital income. Increasing wealth concentration is due, in part, to differences in the way income tax is collected from labor and capital. For example, there are differences in rates: dividends are taxed at 10 percent, lower than all but the lowest labor income tax rate and far below the 30 percent top marginal rate which most dividend earners would otherwise face. At the same time, while the significant capital gains that have been made from the housing and stock markets are theoretically subject to personal income tax, in practice monitoring and compliance are weak. Meanwhile, for many workers, income tax on salaries and wages is withheld by the employer, ensuring a degree of compliance for labor income. As a consequence, around 95 percent of personal income taxes (around 20 percent of total income taxes) are collected through withholding, mostly on salaries, and only the remaining 5 percent from capital income. Other wealth accumulation is due to various forms of corruption. For some, their financial assets are gained through personal connections and corrupt practices; in 2014 Indonesia’s Corruption Perception Index, which measures perceptions of public sector corruption around the world, was a lowly 34 out of 100 (where 0 means very corrupt and 100 very clean), ranking it 107th out of 175 countries. This corruption can take the form of legal corruption – awarding of public procurement or service contracts to connections, appointment of friends and families to lucrative public sector positions – or illegal corruption, such as the bribing of judges to sway judicial decisions, or the bribing of officials for preferential treatment. 0 10 20 30 40 50 60 70 80 90 Russia Turkey HongKong Indonesia Philippines Thailand UnitedStates India Egypt Brazil Peru Switzerland Argentina Malaysia SouthAfrica Chile Sweden Denmark Israel CzechRepublic SaudiArabia Norway Colombia Mexico China Austria Korea Poland Taiwan Germany UnitedArabEmirates Singapore Ireland Portugal Canada NewZealand Greece Spain Netherlands Finland UnitedKingdom France Italy Australia Japan Belgium
  • 26. 26 High wealth concentration, even when fair, can have negative consequences for inequality. Even without illegal or unfair accumulation, a high concentration of wealth might be bad for two reasons. First, it transmits unequal opportunities across generations, both in terms of greater financial resources and their earning ability, as well as facilitating a greater investment in the human capital of the children in wealthier households. Second, high wealth may facilitate the capture of policies and institutions. For example, the wealthy may use their financial and political influence to make tax rates on capital lower than labor, or subvert the legal process to avoid prosecution for corruption. Indonesia’s poor Corruption Perception Index score suggests that not only is wealth sometimes illicitly gained through the public sector, public officials are sometimes complicit in the subversion of the proper political and legal process. D. Shocks erode a household’s ability to earn and save, as well as invest in health and education Finally, shocks disproportionately affect poor and vulnerable households, which can prevent them from climbing up the economic ladder There are many shocks which can erode household resources and incomes. Households can be affected by economic, health, social and political shocks, as well as natural disasters. These shocks can reduce household income through a number of channels. They can affect the underlying assets that generate income; a natural disaster, for example, might destroy the livestock or equipment used to make a living. Shocks can also reduce the income that comes from these assets; a drought might make a harvest meager. They can also reduce how far that income goes in the case of food price shocks; soaring rice prices linked to rice import restrictions in 2006 saw poverty rise by two percentage points. And they can reduce tomorrow’s income by depleting today’s assets (for example, selling a sewing machine to pay for hospital care) or by preventing accumulating assets for the future (for example, lack of income due to losing a job). Less than half of all Indonesians have health insurance Access to health insurance (percent) There are more than twice as many vulnerable Indonesians as there are poor, living less than 50 percent above the poverty line, who fall easily into poverty if they suffer a shock Figure xii. Poverty and vulnerability rates in Indonesia, 2014 (percent) Source: Susenas and World Bank (forthcoming (a)) 0 10 20 30 40 50 60 Health insurance Poor Vulnerable Emerging Consumer Class Consumer Class 0 5 10 15 20 25 30 35 40 45 Between 1.0x and 1.5x Poverty Line Below Poverty Line 28 million poor 68 million vulnerable
  • 27. 27 Note: The poor are under the national poverty line, around PPP$1.30; the vulnerable are under 1.5 times the poverty line, around $1.90; the emerging consumer class are under 3.5 times the poverty line, around $4.50; and the consumer class are above this. See World Bank (forthcoming (a)) for details. Many Indonesians rely on friends and family to deal with these shocks rather than formal mechanisms. Civil servants and the wealthy have access to health and employment insurance that they can rely on during shocks. While the government covers health insurance premiums for the poor and vulnerable, these programs are not always effective because beneficiaries do not know what services they are eligible for, or cannot access them because of limitations in the supply of services. Also, for many workers who are neither poor nor rich and working in the informal sector, expansion in coverage to these households may be years away. When people do not have access to formal coping mechanisms in times of shock, they usually turn to family and friends. However, this typically does not provide enough support to fully cope, and does not work when a shock like a natural disaster hits an entire community. When informal borrowing is not enough, households may resort to steps that reduce their future income, such as selling productive assets or pulling children out of school. Shocks hurt the incomes of all Indonesians, but since richer households are more resilient they are less likely to be negatively affected. With vulnerability high in Indonesia, small shocks can easily reduce incomes. While 28 million Indonesians live below the poverty line, a further 68 million live on less than 50 percent above it. As a consequence, small shocks can easily send the vulnerable into poverty; in fact, around half of the poor each year were not poor the year before. However, even non-vulnerable Indonesians will be badly affected by shocks such as illness and disease or unemployment if they do not have access to insurance or other coping mechanisms. As a consequence, over a 14-year period, most Indonesians have experienced considerable ups and downs in terms of their income. But a majority of the richest fifth of households have been able to remain at the top over this same period of time (although having the most financial assets, they were most affected by the Asian Financial Crisis when inequality actually fell). IV. Reducing Inequality High inequality is not inevitable; policymakers can reduce it by tackling that part of it which is due to factors outside a person’s control High and rising inequality is not an inevitable part of the development process; regional neighbors have grown without increasing disparity between the rich and the poor. Inequality has been rising quickly in Indonesia at the same time as it was stable or falling in fast growing East Asian neighbors such as Malaysia, Thailand and Vietnam. This indicates that rising inequality is not an unavoidable byproduct of rapid growth. In fact, some countries, such as Brazil, have been able to slow and eventually reverse rising inequality through a planned policy approach. Inequality can be tackled with policies that reduce the impact of factors outside an individual’s control which affect their outcomes, and so break the intergenerational transmission of poverty and inequality. Not all inequality needs to be addressed; the government can aim to address inequality due to factors outside an individual’s control while leaving the inequality which rewards individuals for hard work, risk-taking and innovation. This means breaking the cycle of intergenerational transmission of poverty and inequality and ensuring people are no longer divided into the haves and have-nots from before birth. All children need to be born healthy, grow up well in their early years, go to school and get a quality education, and enter the workforce with the right skills for today’s modern and dynamic economy. In addition, all families need access to mechanisms which can protect them from the many shocks which occur in life, more Indonesians need to gain access over time to financial wealth, and pay a fair share of tax on the income they generate. To do
  • 28. 28 this, policymakers have a range of instruments. The best ones to use are those which both address the main drivers of rising inequality and which are feasible. The final section of the report examines some of these tools and highlights priority actions. We examine:  Improving local service delivery to provide equal opportunities for all: A key to a better start for the next generation is improved local service delivery, which can improve health, education and family planning opportunities for all.  Promoting better jobs and skills training opportunities for the workforce: Today’s workers who had an unfair start can still improve their skills. When they do, the government can help make sure there are better jobs available through a better investment climate and improved regulatory approach.  Ensuring protection from shocks: Government policies can reduce the frequency and severity of shocks, as well as provide the coping mechanisms to ensure all households have access to adequate protection to the shocks which do occur.  The right fiscal policy: Spending in the right areas, such as on infrastructure, health and education, social assistance and social insurance, allows a government to create more equal opportunities for the future and better jobs now, as well as households to protect themselves. How it funds this spending can also affect inequality today, as well potentially address some unfair aspects of wealth concentration.  Further research in selected areas where more needs to be known: Some issues, such as corruption and the role of institutions in rising inequality, are not well-understood. On other issues, such as infrastructure, more work is needed to understand what infrastructure is needed where and would best address inequality of outcomes and opportunities. A. Local service delivery In addition to adequate funding, the most important policy action underpinning a better start in life for all is improved local service delivery. In a decentralized Indonesia, effective delivery of quality services by local government is essential if opportunities are to be enjoyed by all. Since democratization and decentralization, the financial and political powers of local governments have been increased dramatically. So should their responsibilities be. With much of the authority for key services which provide the opportunities for a good start in life, such as health, water and sanitation, nutrition and family planning, now being under local government control, more must be done to ensure they have the means, capacity and incentives to provide these services in an effective manner. Key policy actions can underpin improvements in all areas of local service delivery. Local service delivery can be improved by building the capacities of local government to deliver services, moving towards a more performance-based transfer system and providing the tools for citizens to monitor local service delivery. Some priorities for improving local service delivery which cross sectors include changes in the way central budgeting allocations are made; changes in the incentives local budgeting face; incentives for achieving local delivery standards; and increased demand for public accountability. In particular, we look at how this might be achieved in health, education and family planning. Specific actions can help ensure that all children – regardless of where they are born or their family’s economic status – have a healthy start to life… One of the most important steps in addressing inequality of opportunity begins with improving access of poorer households to quality health services. Getting the right start for children of poorer households means getting access to quality health services during the early development stages,
  • 29. 29 without which they will be disadvantaged for the rest of their lives. More spending on health could help reduce gaps in access. However, the priority is improving the quality of health services. Specific actions include:  Increased health financing, with targeted DAK investments and built-in incentives, to equip local health facilities to deliver results. First, public health spending could be increased; Indonesia has the fifth-lowest health spending to GDP ratio out of 188 countries, at 1.2 percent of GDP. But public health spending could also be improved, by making local governments more accountable and better able to deliver health services on the ground. One approach is to use targeted investments combined with incentives to deliver results. For example, multi-year Dana Alokasi Khusus (DAK, or special funding for national priorities) transfers to districts could be linked to measurable gaps in key health services relative to basic standards, such as those related to maternal and child health. District contributions could be reimbursed upon evidence that these services are being provided, and subsequent DAK allocations can be based not only on gaps but also progress in closing them. Districts that under-perform could be supported, provided that the problem is a weak capacity to deliver.  Producing sufficient competent health workers and ensuring enough of them make it to disadvantaged areas. There are a number of ways to improve the number, quality and distribution of health workers. Producing the right number begins with better information about the dynamics of the health workforce at the national and subnational levels, using modern planning methods for health workforce production and deployment to reflect real demand and a greater involvement of the private sector. Quality can be improved through limiting the recruitment of public servants to those who have been certified according to national standards, and limiting the reimbursement of services for patients with health insurance to those services that have been provided by certified health personnel in both the public and private sector. At the same time, the quality assurance – certification, accreditation and licensing – of health workers and health professional education can be improved. Finally, getting enough qualified workers to disadvantaged areas means a public sector emphasis on the placement of medical doctors in rural underserviced areas to increase the efficient use of public money, and trying different incentive initiatives to motivate health workers to work in remote areas than the ones to date.  Creating demand for health and sanitation services through a strengthening of the Posyandu cadres. Increasing demand and knowledge for maternal and child health and water and sanitation services can be promoted through education, social encouragement and pressure, and incentives, including better socialization of the importance of vital behaviors; outreach from local health officials, trusted community leaders and NGOs; and incentives through CCTs or other social assistance programs. In particular, increased professionalization of Posyandu cadres (community health workers) is important, through improved training quality, performance-based incentives, and strong supervision from Puskesmas (sub-district health centers). These cadres can go into every community to make sure that pregnant women get routine prenatal care, encourage mothers to bring children for immunization, children with fever get seen immediately for a malaria diagnosis, and other basic steps that reduce the threat of illness as well as the high costs of late treatment. With respect to stunting and nutrition, Posyandu cadres can play a key role in ensuring effective Behavioral Change Communication (BCC), especially tailored personal counseling focusing on improved caring practices for maternal care and feeding behaviors for infant and young children. As shown in other countries, regular home visits to provide individualized support to caregivers are key. Posyandu training pilots under PNPM Generasi could be further scaled up.
  • 30. 30 …and a smart start… Gaps in access to schools are closing over time, but this needs to be accompanied by improvements in the quality of education in order to reduce inequality. Enrolment gaps between the rich and poor have been closing over time, but the contribution of inequality of opportunity to overall inequality has not continued to fall because of a persisting quality gap. This is also an important factor holding back higher economic growth. Getting all kids to stay in school until at least the end of high school is an important step, which means improving access in some areas, improving the targeting, coverage, benefit levels and uptake of scholarships for poorer households everywhere, with inducements for transition to the next schooling level. Nonetheless, there are will be greater reductions in inequality of opportunity, as well as much bigger gains to economic growth (the benefits in terms of growth have been estimated for Indonesia to be around seven times higher for closing the quality gap than for closing the access gap), if the quality gap is addressed. Specific actions to do this include:  Ensuring adequate financing of schools, particularly in disadvantaged areas, to attain minimum quality standards. A recent WB report identifies a number of options to improve BOS: link funding more directly to education standards in order to signal the importance of using BOS resources to fulfil these standards; revise the list of eligible items under BOS to provide schools with the flexibility to invest in quality enhancing inputs; adjust the value of BOS periodically to account for regional price differences and inflation to ensure that all schools can meet operating standards; use the BOS formula to provide more funding to schools serving poor and vulnerable children; and phase out the use of BOS resources to support the ‘out of pocket’ expenses of poor students in favor of existing targeted programs. At the same time, local governments can be encouraged and supported their operational support to schools (BOSDA) in ways that complement BOS; BOS enables the meeting of minimum service standards, BOSDA can enable the meeting of the higher national education standards. Recent reforms in DKI Jakarta suggest a potential approach, combining an equity component (rather than equal spending per person, schools in the 1,000 Islands area receive more funding because of the higher costs of service provision) and an incentive component (schools in the top quarter with respect to the level and increase in national test scores receive an extra allocation the following year). In addition, the targeted and performance- based DAK investments proposed in health could also be adopted for education based on district-level education gaps.  Increasing the competency of teachers everywhere, and ensuring sufficient distribution to disadvantaged areas. Strategies could include greater selectivity at entry and exit (through the use of competency tests) and institutional accrediting can help ensure an adequate supply of competent teachers; recruitment and deployment of competent teachers, particularly in disadvantaged areas by combining financial incentives, bonding schemes and group-based postings; stronger professional development and support; and greater teacher accountability, such as through the use of annual appraisal and competency tests to determine career progression, and tying contract renewal to performance. …and to improve local family planning services Targeted government efforts would help give poorer families equitable access to family planning services so that they can control the size of their households. Family sizes will fall as economic growth in Indonesia continues, alongside urbanization and increasing enrolment rates. Efforts are needed, however, to target poorer households so that they do not fall further behind due to higher fertility rates. This will require reducing inequalities in the knowledge, use, access and quality of family planning services. The private sector is unlikely to reach poorer households sufficiently since it is difficult and costly to reach marginalized and poorer groups. Therefore, greater central and local
  • 31. 31 government efforts are required to revitalize family planning programs, with strategies to target those who need it the most. Specific actions include:  Develop local strategies for revitalizing targeted family planning services. Clear government strategies could improve the provision of family planning information and services, focusing on marginalized and poorer target groups. An effective strategy would include a clear delineation of roles and responsibilities for local government, the Ministry of Health, and the National Family Planning Agency (BKKBN) and focus on: improving the provision of family planning information and services; and promoting contraceptive use by couples from poorer and marginalized groups in planning their families. More effort is then needed to address the unmet contraceptive needs of economically disadvantaged couples, including through socialization; provision of contraceptive services which are affordable for poorer households; and increasing the number of midwives who are qualified to insert IUDs and implants.  With poorer households less able to access private sector services, adequate funding of public family planning programs is critical. With family planning budgeting now a local prerogative, a central agreement between the BKKBN and the Ministry of Home Affairs (who oversee local government issues) on family planning financing is vital. Local champions of family planning need to receive technical assistance and local family planning boards could be established in more districts under existing regulations. The use of DAK could be altered to allow family planning spending to focus less on infrastructure and more on operational expenses, such as training of midwives and contraceptive supplies. B. Improving the skills of today’s workforce and providing them with better access to productive employment In the long-run, only improved access to quality health and education will reduce unequal access to good jobs; in the short-run, more can be done to improve the skills of today’s workers and create more productive jobs Indonesia could create better jobs by addressing the barriers and constraints to productivity growth, particularly through better infrastructure and greater competitiveness. One key area of reform is improving infrastructure, connectivity, and logistics, discussed in detail in a subsequent section. Beyond that, Indonesia’s Ease of Doing Business requires constant improvement, as well as access to finance for small firms looking to expand. Both the manufacturing sector and the agricultural sector can be a major source of productive, semi-skilled jobs for poor and vulnerable workers, thus there is added emphasis on revitalizing those sectors. Indonesia could also implement a “grand bargain” between government, employers, and labor unions to overhaul labor market regulations. Current labor market regulations in Indonesia are considered among the most rigid in the region and discourage job creation, but also result in low de facto protection. Piecemeal reforms of individual regulations is difficult due to the perceived zero- sum nature of labor market regulations, thus an overall grand bargain may be needed in order to create a thorough set of reforms that is perceived to be beneficial to both employers, labor unions, and job seekers. Reforms in Indonesia’s skills training system can allow workers to upgrade their skills and access better jobs. A greater degree of involvement by the private sector can create a demand-driven system where the skills trainings offered are directly relevant to and demanded by employers. A greater private sector role, particularly in provision and financing of training, also frees up public funds to expand the training system to all provinces and subsidize the poor and other vulnerable groups, e.g. women, youth and people living with disabilities.
  • 32. 32 C. Strengthening social protection to help households cope with shocks Protecting households from shocks requires action on many fronts. Households face shocks from many sources. Policy action is required in many areas to address such shocks, including coping with natural disasters, building an effective social insurance system and ensuring adequate health services, particularly in poorer areas. In addition, the below policy actions could have a particularly strong impact on reducing inequality through protecting the poor and vulnerable. Government policies can mitigate the effect of food prices on the poor and vulnerable. There are a number of policy areas where government can promote stability to prevent shocks from occurring. One important area that affects the poor is food prices, especially for rice. Domestic rice production has slowed in recent decades for a number of reasons – including slow mechanization and poor infrastructure and connectivity – and increased public spending has not agriculture spurred production. At the same time, price stabilization policies are not effective and may even contribute to the problem; the current rice import regime is particularly harmful. Effective rice security will require an effective early warning system and reliable real-time information about prices, stocks and flows of rice. Over the longer-term, achieving a sustained improvement in Indonesia’s rice security will require increasing productivity through long-term, structural improvements in the farm sector. Effective social assistance would not only boost incomes but to also enable the poor and vulnerable to deal better with shocks. For those unable to cope with shocks themselves or access contributory social insurance, stronger social assistance is needed. Safety nets have an immediate impact on reducing poverty and inequality. Indonesia has been building and expanding a social assistance framework since the wake of the Asian Financial Crisis. However, these programs are not fully effective in protecting the poor and vulnerable and further reforms could improve the targeting of these programs, which currently targets chronic poverty rather than poverty due to shocks, expand the coverage and benefit packages of programs that work so that they provide adequate protection to all vulnerable households, and add new programs to fill in gaps for those risks which do not currently have adequate protection. In addition, for the newly implemented social insurance programs, especially health, it is important that a sufficient supply of services accompanies expansion in coverage. Access to preventative and treatment health services for all Indonesians is vital to help protect against the range of illnesses and accidents which can have catastrophic impacts on household incomes, spending and savings. While around 90 million Indonesians, many of them poor and vulnerable, have their premiums covered by the government, there are just as many more people, who while often not living below the vulnerability line would nonetheless be badly affected by a serious health shock. Many of these work in the informal sector, do not currently pay premiums, and are not yet covered; reaching these households will be the main step in achieving universal health coverage. However, coverage alone does not provide adequate protection against shocks if there is not a corresponding availability of quality health services for all; the financing and health worker recommendations discussed under local service delivery are just as necessary to protect against shocks as they are to provide a healthy start for all children. Knowing where, when and how to respond when crises hit is also key. Even when the right tools have been available, Indonesia has not always known when, where and how to respond when crises strike. Developing a Crisis Monitoring and Response System (CMRS) is essential for detecting the effects of a crisis and responding appropriately. Such a system has three components: a permanent and relatively real-time monitoring system at both the national and household level; a pre-agreed protocol for when, where and which response will be initiated; and pre-agreed institutional arrangements on planning, coordination, funding and disbursement and monitoring and evaluation. A CMRS which links closely to existing disaster management tools will help adjust public protection and support programs to deliver the right protection to the right people.