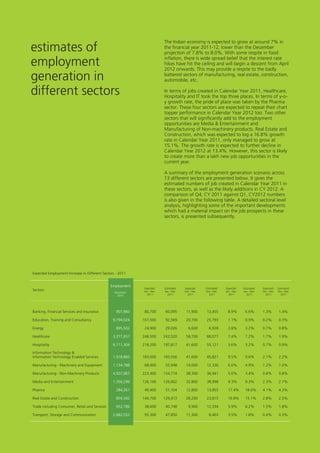
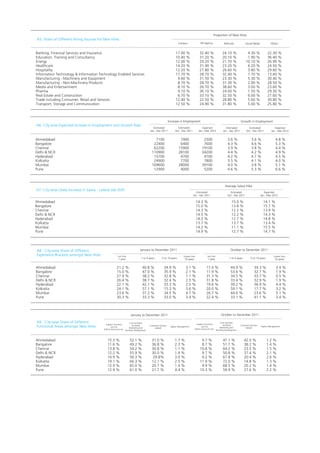
The Ma Foi Randstad Employment Trends Survey analyzes the employment landscape and opportunities in India, highlighting changes in the organized sector from October to December 2011. The report indicates an expected growth of around 7% in the Indian economy for 2011-12, with significant employment potential in sectors such as healthcare, hospitality, and IT. Despite positive growth in several sectors, challenges such as inflation, interest rates, and a depreciating rupee may impact future job creation.