16003.pdf
•
0 likes•12 views

A Study of Investors’ Preference towards Mutual Funds in Kathmandu Metropolitan City, Nepal

Recommended
Recommended
More Related Content
Similar to 16003.pdf
Similar to 16003.pdf (20)
Recently uploaded
Recently uploaded (20)
16003.pdf
- 1. ISSN: 2362-1303 (Paper) | eISSN: 2362-1311(Online) JOURNAL OF ADVANCED ACADEMIC RESEARCH (JAAR) December 2017 130 Vol. 4. No. II www.phdcentre.edu.np A Study of Investors’ Preference towards Mutual Funds in Kathmandu Metropolitan City, Nepal Rajan Bilas Bajracharya1 and Sushil Bhakta Mathema2 1 PhD Scholar, Mewar University, Chittorgarh, Rajasthan, India 2 Research Supervisor, Professor, Tribhuvan University, Kirtipur Corresponding Author Rajan Bilas Bajracharya Email: rajan_vj@hotmail.com ABSTRACT A Mutual Fund is an investment vehicle that pools funds from various investors and invests the funds in stocks, bonds, short-term money-market instruments, other securities or assets or some combination of these investments. The primary goal behind investment in mutual fund is to earn goods return with comparatively low risk. The main objective of this research is to identify investors’ preference towards mutual fund in Kathmandu metropolitan city. By using in structured questionnaire, Description statistical tools like chi-square test have been used for analyzing the data. The findings from this research are that the most of the investors are doubtful to invest the new age investment like mutual funds. KEYWORDS Asset Management Company, Investment Option, Mutual Fund INTRODUCTION A Mutual Fund is an investment vehicle that pools funds from various investors and invests the funds in stocks, bonds, short-term money-market instruments, other securities or assets or some combination of these investments. Investment decisions are carefully taken by the fund managers after sound research and the decisions will be in the significance of the unit holders. Rathnamani (2013) explained that many investors are preferred to invest in mutual fund in order to have high return at low level of risk, safety liquidity. The world of investment has been changing day to day, so investor’s preferences toward investment pattern also changed. In the demographic profile, most of the investors are willing to invest only 10 percent in their annual personal income; around 39 percent of investors belong to age range of 31 to 40 years. In this study investors are willing to take moderate and low level risk; most of the investors belong to moderate investment style. Rajasekar (2013) carried out to know about the investor’s perception with regard to their profile, income, savings pattern, investment patterns and their personality traits. In order to understand the level of investor’s preference, a survey was conducted taking into consideration various parameters involved in investors decision making. A questionnaire survey method was
- 2. ISSN: 2362-1303 (Paper) | eISSN: 2362-1311(Online) JOURNAL OF ADVANCED ACADEMIC RESEARCH (JAAR) December 2017 131 Vol. 4. No. II www.phdcentre.edu.np selected as the investor population is vast a sample size of 150 was taken for the project. The data was analyzed using the statistical tools like percentage analysis, chi square, weighted average. From the findings, it was inferred overall that the investor is highly concerned about safety and growth and liquidity of investments. Most of the respondents are highly satisfied with the benefits and the service rendered by the reliance mutual funds. Mane (2016) examined the customer perception with regard to mutual funds that are the schemes they prefer, the plans they are opting, the reasons behind such selections and also this research dealt with different investment options, which people prefer along with and a part from mutual funds like postal saving schemes, recurring deposits, bonds and shares. The findings from this project are that of the people are hesitant in going for new age investments like mutual funds and prefer to avert risks by investing in less risky investment options like recurring deposits. Most of the studies show the scenario of Indian investors towards mutual fund. But no study is found to investigate the investment preference of Nepalese investors towards mutual fund in Nepal. Research Objective The main objective of this report is to identify investment preference towards mutual fund in Kathmandu metropolitan city. RESEARCH METHODOLOGY Source of Data The present study is based on primary data which was collected using questionnaire method. Sample Size In this study 220 investors had been considered from Kathmandu metropolitan city. However, only 207 respondents have selected due to not sufficiency of data in few questionnaires for data analysis. Data Collection The data were collected using questionnaire from investors like those who are interested in mutual funds scheme and other investment option. Sample Unit The research was conducted in Kathmandu metropolitan city. Statistical Tools In this study, the hypotheses were made and then analyzed with the help of statistical techniques of Chi-Square test for relationship using IBM SPSS software version 20. Both hypotheses were tested with 95 percent confidence level i.e. at 5 percent significant level. Hypothesis H1: There is no significant difference in preferences for investment given by investors. H1: There is no significant difference in Asset Management Company preference given by investor. DATA ANALYSIS AND INTERPRETATION
- 3. ISSN: 2362-1303 (Paper) | eISSN: 2362-1311(Online) JOURNAL OF ADVANCED ACADEMIC RESEARCH (JAAR) December 2017 132 Vol. 4. No. II www.phdcentre.edu.np Table 1: Frequency Distribution of Respondents on the basis of Gender Gender Frequency Percent Valid Percent Cumulative Percent Valid Male 144 69.6 69.6 69.6 Female 63 30.4 30.4 100.0 Total 207 100.0 100.0 Table 1 reveals that 69.6 percent of respondents are male and rest 30.4 percents respondent are females. Table 2: Frequency Distribution of Respondents on the basis of Age Age Frequency Percent Valid Percent Cumulative Percent Valid Less than 30 years 28 13.5 13.5 13.5 30 to 45 years 136 65.7 65.7 79.2 45 to 60 years 36 17.4 17.4 96.6 Above 60 years 7 3.4 3.4 100.0 Total 207 100.0 100.0 Table 2 reveals that out of total respondent’s majority (65.7%) are from the age group of 30 to 45 years followed by 17.4 percent respondents are from 45 to 60 years. Only 3.4 percent are above 60 years of age. Table 3: Frequency Distribution of Respondents on the basis of Occupation Occupation Frequency Percent Valid Percent Cumulative Percent Valid Business 57 27.5 27.5 27.5 Self Employed 65 31.4 31.4 58.9 Employed 81 39.1 39.1 98.1 Others (Retired) 4 1.9 1.9 100.0 Total 207 100.0 100.0 Table 3 reveals that Majority of the respondents which account for more that 39.1 percent are employed and rest 31.4 percent are self employed followed by 27.5 percent who are business. Table 4: Frequency Distribution of Respondents on the basis of Academic Qualification
- 4. ISSN: 2362-1303 (Paper) | eISSN: 2362-1311(Online) JOURNAL OF ADVANCED ACADEMIC RESEARCH (JAAR) December 2017 133 Vol. 4. No. II www.phdcentre.edu.np Education Qualification Frequency Percent Valid Percent Cumulative Percent Valid Up to SLC 15 7.2 7.2 7.2 Up to Higher Secondary 49 23.7 23.7 30.9 Bachelor 76 36.7 36.7 67.6 Masters 67 32.4 32.4 100.0 Total 207 100.0 100.0 Table 4 reveals that 36.7% respondents are having qualification of Bachelor level and 32.4% are the Master level. Table 5: Frequency Distribution of Respondents on the basis of Annual income Annual income Frequency Percent Valid Percent Cumulative Percent Valid Less than 300,000 112 54.1 54.1 54.1 Rs 300,001 to Rs 500,000 68 32.9 32.9 87.0 Rs 500,001 to Rs 800,000 27 13.0 13.0 100.0 Total 207 100.0 100.0 Table 5 reveals that, out of total 32.9% of the respondents are having annual earning between Rs 300,001 to Rs 500,000, rest 54.1 percent of the respondents fall under the category of less than 300,000. Only 13% respondents are having annual income Rs 500,001 to Rs 800,000. Table 6: Frequency Distribution of Respondents on the basis of Annual savings Annual Savings Frequency Percent Valid Percent Cumulative Percent Valid Less than 20% 37 17.9 17.9 17.9 20% to 30% 134 64.7 64.7 82.6 30% to 50% 28 13.5 13.5 96.1 More than 50% 8 3.9 3.9 100.0 Total 207 100.0 100.0 Table 6 reveals that Majority of the respondents (64.7%) are able to save between 20% to 30% of their total earning followed by 17.9% respondent who is able to save less than 20%.
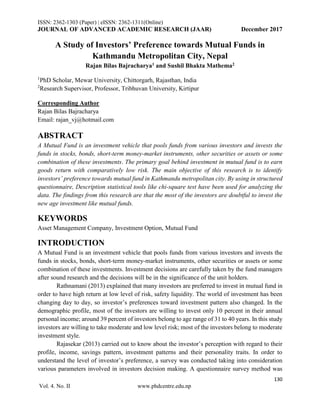
- 5. ISSN: 2362-1303 (Paper) | eISSN: 2362-1311(Online) JOURNAL OF ADVANCED ACADEMIC RESEARCH (JAAR) December 2017 134 Vol. 4. No. II www.phdcentre.edu.np Table 7: Frequency Distribution of Respondents on the basis of Marital Status Marital Status Frequency Percent Valid Percent Cumulative Percent Valid Married 170 82.1 82.1 82.1 Unmarried 37 17.9 17.9 100.0 Total 207 100.0 100.0 Table 7 reveals that 82.1% respondents are married and rest 17.9% is unmarried. Table 8: Investment Option Selected by Number of Investors Investment Options No. Of Investor (%) Bank Deposits 40.10 Bonds and Debenture 5.31 Equity Shares 21.74 Mutual Funds 17.87 Insurance Polices 14.98 Total 100.00 As per investors’ opinion, everyone wants their money should be safely invested by Asset Management company because of the saving which they have deposited are in different investment option. Table 7 shows the safest investment option investors feel the bank deposit because there is no terror of losing fund at any point in time unless bank gets default as chances of it are very less. Bank deposit is absolutely safety investment option for 40.10 percentages and equity shares are second investment option for 21.74 percent by investors’ opinion as shown Figure 1. 0.00 5.00 10.00 15.00 20.00 25.00 30.00 35.00 40.00 45.00 Bank Deposits Bonds and Debenture Equity Shares Mutual Funds Insurance Polices 40.10 5.31 21.74 17.87 14.98 No of Investor (%) Investment Option
- 6. ISSN: 2362-1303 (Paper) | eISSN: 2362-1311(Online) JOURNAL OF ADVANCED ACADEMIC RESEARCH (JAAR) December 2017 135 Vol. 4. No. II www.phdcentre.edu.np Figure 1: Investment Option Analysis of Number of Investors Table 9 Chi-Square Test Frequencies Investment Preference Observed N Expected N Residual Bank Deposit 83 41.4 41.6 Bond and Debenture 11 41.4 -30.4 Equity Share 45 41.4 3.6 Mutual funds 37 41.4 -4.4 Insurance 31 41.4 -10.4 Total 207 Table 9 shows, at 5 percent level of significance with degrees of freedom 4, calculated value of Chi-Square is 67.517, which p-value is 0.000 which is less than 0.05. So, there is enough evidence to conclude that the null hypothesis is rejected that means there is no significant difference in preferences for investment given by investors. Table 10: Asset Management Company Selected by Number of Investors Asset Management Company No. of Investors (%) Siddhartha Capital Limited 41.55 Nabil Investment Banking Ltd 28.50 Global IME Capital Limited 2.42 NMB Capital Limited 6.76 NIBL Capital 11.11 Laxmi Capital Market Limited 9.66 Total 100.00 Table 10 reveals, as per collection of data most preferable Asset Management Company of investors’ opinion is Siddhartha capital Limited because of the schemes are good of Siddhartha capital for getting investors to attract and invest in the scheme and Nabil Investment Banking Ltd is second preference and could be the same reasons for choosing the Asset Management Company for the investment which is shown in Figure 2.
- 7. ISSN: 2362-1303 (Paper) | eISSN: 2362-1311(Online) JOURNAL OF ADVANCED ACADEMIC RESEARCH (JAAR) December 2017 136 Vol. 4. No. II www.phdcentre.edu.np Figure 2: Asset Management Company Analysis of Number of Investors Table 11 Chi-Square Test Frequencies Investment Preference Observed N Expected N Residual Siddhartha Capital Limited 86 34.5 51.5 Nabil Investment Banking Ltd 59 34.5 24.5 Global IME Capital Limited 5 34.5 -29.5 NMB Capital Limited 14 34.5 -20.5 NIBL Capital 23 34.5 -11.5 Laxmi Capital Market Limited 20 34.5 -14.5 Total 207 Table 11 shows, at 5 percent level of significance with degrees of freedom 5, calculated value of Chi-Square is 141.609, which p-value is 0.000 which is less than 0.05. So, there is enough evidence to conclude that the null hypothesis is rejected that means there is no significant difference in Asset Management Company preferences given by investors. 0.00 5.00 10.00 15.00 20.00 25.00 30.00 35.00 40.00 45.00 Siddhartha Capital Limited Nabil Investment Banking Ltd Global IME Capital Limited NMB Capital Limited NIBL Capital Laxmi Capital Market Limited No of Investors (%) Asset Management Company
- 8. ISSN: 2362-1303 (Paper) | eISSN: 2362-1311(Online) JOURNAL OF ADVANCED ACADEMIC RESEARCH (JAAR) December 2017 137 Vol. 4. No. II www.phdcentre.edu.np CONCLUSIONS AND RECOMMENDATIONS Mutual Funds have emerged in term of flexibility, variety, diversification, liquidity and benefits of tax. Investment opportunity can be gain access by Mutual funds Investors that would be limit knowledge and resources that would otherwise be engaged to them due to inadequate resources and knowledge. Mutual funds have the opportunities to make available to solve to investors’ requires, however, the way is to do the proper selection and have a process for monitoring and controlling. In Nepal, the mutual fund industry is at a growing stage and it is incorporating a higher figure of latest funds every year. From the analysis, Research has found that the investors are not feeling sure in investing in mutual fund as they think that the mutual fund is unsafe than the other asset opportunity. The most preference of the investors is the bank deposit because they believe it is the secure and return are fixed. Mutual fund is link with share market and investors are not taking advice to invest in mutual fund from expecting advisor so it creates the difficulty to select the fund beneficial for them. There are a variety of problems facing in selecting mutual fund by investors as an investment option as the share market uncertainties and risk associated with it so investors avoid the investing in mutual fund. The study shows as to how attractive the mutual funds is to an investor and the reason behind investing in mutual funds is the basis of the personal observation of the researcher, the following recommendations have made to change in the mindsets of the people with regard to mutual funds as an investment avenue. REFERENCES Desigan, G., Kalaiselvi, S., & Anusuya, L. (2006). Women investors' perception towwards investment: An empirical study . Indian Journal of Marketing . Jani, D., Patel, B., & Jain, R. (2012). Consumers' Perception towards Mutual Funds as an Investment Option specially focused on Valsad City Located in Gujarat. International Jpurnal of Business Management & Reseach 2(4) , 59-66. Mane, P. (2016). A Study of Investors Perception towards Mutual funds in the city of Aurangabad. The SIJ Transactions on Industrial,Financial & Business Management (IFBM) , 4 (2), 30-38. Parihar, B., Sharma, R., & Parihar, D. (2009). Analyzing Investors' Attitude Towards Mutual funds as an Investment option. The IUP Journal of Management Research 8(7) , 56-64. Reilly, F., & Brown, K. (2003). Investment Analysis and Portfolio Management (7 ed.). Canada, South Western .
- 9. ISSN: 2362-1303 (Paper) | eISSN: 2362-1311(Online) JOURNAL OF ADVANCED ACADEMIC RESEARCH (JAAR) December 2017 138 Vol. 4. No. II www.phdcentre.edu.np Rajasekar, D. D. (2013). A Study on Investor's Preference Towards Mutual funds with Reference to Reliance Private Limited. Chennai- An Empirical Analysis. International Research Journal of Business and Mangement (IRJBM) , III, 38-44. Rathnamani, V. (2013). Investor's Preferences towards Mutual Fund Industry in Trichy. OSR Journal of Business and Management (IOSR JBM) , 6 (6), 48-55. Shah, A., & Baser, N. (2012). Mutual Fund : Behavioral Finance Perspective . Asia Pacific Journal of Marketing & Management Review . Sharma, M., Kaur, H., & Jain, P. (2012). A study on Factor influencing Satisfaction on Investors Towards Mutual funds Industy using Servqual Model: An Empirical Study. International Journal of Management & Business Studies 2(4) . Sharpe, W. F. (1994). Investment . New Delhi: Prentice Hall of India. Singh, B. (2012). A Study on investors' attitude towards mutual funds as an investment otion. International Journal of Research in Management 2 (2) . Singh, B., & Jha, A. (2009). An empirical study on awareness and acceptabiltiy of mutual fund. Regional Student's Conference, ICWAL, (pp. 49-55). Subramanya, P., & Murthy, T. (2013). Investors Attitude Towards Mutual funds (Special Reference to Chikkamagalore District, Karnataka State, India). International Journal of Management and Busniess Studies 3(1) Retrieved from http://www.ijmbs.com/31/subra2.phd . Treynor, J. (1965). How to rate management of investment fund. Harvard Business Review , 63- 75. Walia, N., & Kiran, R. (2009). An analysis of investors' risk perception towards mutual funds servicess. International Journal of Business and Management , 4 (5),106. Websites https://www.nepalstock .com https://www.sharesansar.com https://www.sebon.gov.np https://www.nrb.org.np