SlideShare a Scribd company logo
ASSESSING ENVIRONMENTAL IMPACT
OF BUILDING MATERIALS USING THE
DUTCH APPROACH
The case of the Triodos bank office building using
BREEAM.NL
Marie Chevalerias
Master Thesis in Energy-efficient and Environmental Buildings
Faculty of Engineering | Lund University
Assessing the environmental impact of building materials using the Dutch approach | Chevalerias | 2015
I
Abstract
With the increasing importance accorded to environmental performance of buildings, the goal
of this master thesis is to study the Dutch assessment method for evaluating the environmental
impact caused by the material of an office building project with the Dutch version of the
BREEAM certification scheme.
After doing a literature review to comprehend the current state of affair concerning the
assessment method for environmental impact of building material in the Netherlands, the
MaterialenTool using the National MilieuDatabase was used to assess different scenarios
aiming to reduce the total shadow cost of the building. Along the study, different actors and
users of the Dutch method were interviewed on their expertise and opinions.
In this specific case, the shadow cost of the building was reduced by 25% in total. Reducing
the basement was better than removing it completely, a massive wood construction was
preferred over a laminated wood structure to replace the concrete elements of the building,
the potential of introducing a new type of climate ceiling in the database was demonstrated
and the importance of having reviewed data was shown by changing the type of expanded
polystyrene.
The Dutch environmental impact assessment method revealed itself to be a valuable tool for
the design team although important limitations were revealed, the main one being the
incompleteness of the product database.
Keywords: environmental impact, LCA, shadow cost, building materials, BREEAM.NL, office
building, National MilieuDatabase.
Assessing the environmental impact of building materials using the Dutch approach | Chevalerias | 2015
II
Preface
This study is performed as a degree project within the master programme Energy-efficient
and Environmental Building Design from Lund University (Sweden) as well as part of an
internship at the architectural firm RAU Architects located in Amsterdam (The Netherlands).
During my bachelor in Architecture and my master in Building Sciences, I have developed a
technical approach of the design process and I am very thankful that RAU Architects has
allowed me to find a role to play in one of their many sustainable projects. I would like to
thank Willem Wijnbergen for accepting to meet with me in the first place and making my
internship as pleasant as possible. I want to thank all the employees of RAU architects for
welcoming me in the company and especially Marijn Emanuel and Dennis Grootenboer for
their support and supervision of my work.
I am very grateful to Martin Bijleveld from DGMR, René Klaassen from SHR and Rick
Scholtes from NIBE for accepting to be interviewed and for sharing their experiences with
me.
A special thanks to the Triodos bank for setting an example for a more sustainable world and
for allowing me to take their project as a study case, promoting the spread of knowledge about
the best practice for sustainable design.
I also want to greatly thank Evian Elzinga whose thesis and lectures made me particularly
interested in the field of LCA and the importance of environmental impact aside from energy-
efficiency. I would like to thank Saqib Javed, my supervisor, for his clear feedbacks and
support all along my thesis work, and Dennis Johansson, my examiner, for his detailed
correction.
Finally, I want to express my gratitude to the Hans Eliasson Foundation for supporting our
Master Programme.
Amsterdam, June 2015
Marie Chevalerias
Assessing the environmental impact of building materials using the Dutch approach | Chevalerias | 2015
III
Table of content
Abstract .................................................................................................................................I
Preface..................................................................................................................................II
Table of content.................................................................................................................. III
Terminology........................................................................................................................ V
Terms and definitions........................................................................................................VII
1 Introduction.................................................................................................................. 1
1.1 Background 1
1.2 Motivation 1
1.3 Aim and verifiable goals 1
1.4 Scope 2
2 Literature review.......................................................................................................... 3
2.1 Certification schemes 3
2.1.1 BREEAM.NL 3
2.1.2 MAT1 4
2.2 Dutch context, method, database and tools. 5
2.2.1 SBK method 6
2.2.2 LCA according to the SBK method 6
2.2.3 National Milieu Database (NMD) 9
2.2.4 Other tools 10
2.3 Shadow cost as weighting method 10
2.3.1 What is weighting? 11
2.3.2 What is the meaning of shadow cost? 12
2.4 Other labels and certifications used in the Netherlands 13
2.4.1 NIBE´s Environmental Classification: 14
2.4.2 DUBOkeur®
: 15
2.4.3 C2C®
(or cradle-to-cradle®
): 16
2.5 Research conducted with the Dutch method 16
3 Method ....................................................................................................................... 19
3.1 Description of study case 19
3.2 Practical requirements of the project 22
3.3 Parametric Study 23
3.4 Interviews 23
4 Results........................................................................................................................ 25
4.1 Analysis of preliminary design 25
4.2 Parametric study 28
4.2.1 Modification on basement and foundations 28
4.2.2 Modification of structure 33
4.2.3 Climate ceiling 37
4.2.4 Combining solutions 40
4.3 Other strategies 42
4.3.1 C2C®
and DUBOkeur®
products. 42
4.3.2 Reclaimed materials 43
5 Interviews................................................................................................................... 45
6 Discussion and Conclusions....................................................................................... 49
6.1 Discussion 49
6.2 Conclusions 50
Assessing the environmental impact of building materials using the Dutch approach | Chevalerias | 2015
IV
References .......................................................................................................................... 53
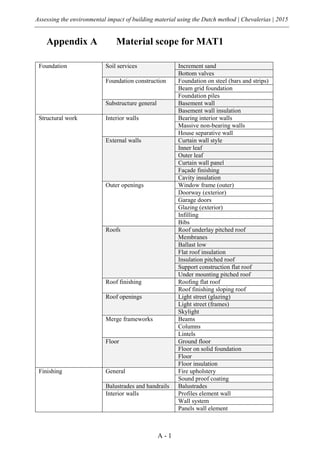
Appendix A Material scope for MAT1.......................................................................A - 1
Appendix B Inventory of materials of preliminary design (in Dutch)...................... B - 1
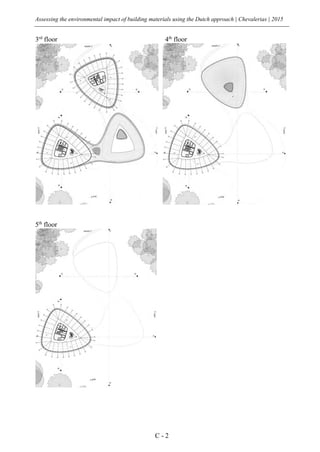
Appendix C Plans of study case.................................................................................. C - 1
Appendix D Interviews (Unedited).............................................................................D - 1
Interview with René Klassen at SHR. D - 1
Interview with Rick Scholtes at NIBE. D - 8
Interview with Martin Bijleveld at DGMR. D - 11
Interview with Dennis Grootenboer at RAU Architects. D - 17
Assessing the environmental impact of building materials using the Dutch approach | Chevalerias | 2015
V
Terminology
AHU: Air Handling Unit
BREEAM: Building Research Establishment Environmental Assessment Methodology
BREEAM.NL: Building Research Establishment Environmental Assessment Methodology
for the Netherlands
BVO: Bruto-VloerOppervlak (Gross Floor Area)
C2C: Cradle-to-cradle
DGBC: Dutch Green Building Council
DGMR: Consultant engineering office
EPD: Environmental Product Declaration
EPS: Expanded Polystyrene Styrofoam
LCA: Life Cycle Assessment
MAT1: section 1 of the material part of BREEAM.NL
MPR: Bepaling van de milieuprestaties van gebouwen en gww-werken (Determination
method of the environmental performance of buildings and civil engineering works)
NIBE: Nederlands Instituut voor Bouwbiologie and Ecologie (Dutch Institute for Building
biology and Ecology.)
NMD: National MilieuDatabase (Dutch Environmental Database)
OSB: Oriented Strand Board
PCR: Product Category Rules
SBR: Stichting Bouw Research (Foundation for Building Research)
SBK: Stichting Bouw Kwaliteit (Foundation for Building Quality)
SHR: Stichting Hout Research (Foundation for Timber Research)
TNO: Nederlandse Organisatie voor Toegepast Natuurwetenschappelijk Onderzoek
(Netherlands Organization for Applied Scientific Research)
TIC: Technische Inhoudelijke Commissie (Technical Content Commission)
Assessing the environmental impact of building materials using the Dutch approach | Chevalerias | 2015
VI
VLCA: Vereniging voor LCA's in de bouw (Association for LCA in construction)
VO: Voorlopig Ontwerp (Preliminary Design)
Environmental Impact Categories:
ADPE: Abiotic Depletion Potential for Non-fossils resources, expressed in kg Sb equivalent.
ADPF: Abiotic Depletion Potential for Fossils resources, expressed in kg Sb equivalent.
AP: Acidification Potential, expressed in kg SO₂ equivalent.
EP: Eutrophication Potential, expressed in kg PO₄ equivalent.
FAETP: Fresh water Aquatic Eco-Toxicity Potential, expressed in kg 1,4-DB equivalent.
GWP100: Global Warming Potential for time horizon 100 years, expressed in kg CO₂
equivalent.
HTP: Human Toxicity Potential, expressed in kg 1,4-DB equivalent.
MAETP: Marine Aquatic Eco-Toxicity Potential, expressed in kg 1,4-DB equivalent.
ODP: Ozone Depletion Potential expressed in kg CFC-11 equivalent.
POCP: Photochemical Oxidant Creation Potential, expressed in kg C₂H₂ equivalent.
TETP: Terrestrial Eco-Toxicity Potential, expressed in kg 1,4-DB equivalent.
Assessing the environmental impact of building materials using the Dutch approach | Chevalerias | 2015
VII
Terms and definitions
Product Category Rules (PCR): Common harmonized calculation rules for the creation of
EPDs specific to a group of products. (Environdec, n.d.)
Shadow cost: Monetary value of something that does not have a market. In this study, the
shadow represent the cost that society is willing to pay to ensure environmental quality.
Re-use: Use of a product a second time after reclaiming it from the waste stream after its first
life-cycle and using it without any major transformation.
LCA: Assessment method to quantify the environmental impact caused by a product over its
whole lifetime.
Solver: Term designating to a mathematic software or computer program that solves a
mathematical problem.
Environmental Impact: Adverse effects caused by substances used or released to the
environment from a project or a process.
Different categories of impacts are used to define and quantify the impact caused to the
environment. The following categories and their definitions are retrieved from the Handbook
on Life Cycle Assessment (Guinée, et al., 2002)
Abiotic Depletion: “Abiotic resources are natural resources (including energy resources)
such as iron ore, crude oil and wind energy, which are regarded as non-living. Abiotic
resource depletion is one of the most frequently discussed impact categories and there is
consequently a wide variety of methods available for characterising contributions to this
category.”
Acidification: “Acidifying pollutants have a wide variety of impacts on soil, groundwater,
surface waters, biological organisms, ecosystems and materials (buildings). Examples include
fish mortality in Scandinavian lakes, forest decline and the crumbling of building materials.
The major acidifying pollutants are SO₂, NOx and NHx.”
Eutrophication: “Eutrophication covers all potential impacts of excessively high
environmental levels of macronutrients, the most important of which are nitrogen (N) and
phosphorus (P). Nutrient enrichment may cause an undesirable shift in species composition
and elevated biomass production in both aquatic and terrestrial ecosystems. In addition, high
nutrient concentrations may also render surface waters unacceptable as a source of drinking
water.”
Terrestrial, Fresh water and Marine Aquatic Eco-Toxicity: “This impact category covers
the impacts of toxic substances on aquatic, terrestrial and sediment ecosystems.”
Global Warming: “Climate change is defined as the impact of human emissions on the
radiative forcing (i.e. heat radiation absorption) of the atmosphere. This may in turn have
adverse impacts on ecosystem health, human health and material welfare. Most of these
Assessing the environmental impact of building materials using the Dutch approach | Chevalerias | 2015
VIII
emissions enhance radiative forcing, causing the temperature at the earth’s surface to rise.
This is popularly referred to as the greenhouse effect.”
Human Toxicity: “This impact category covers the impacts on human health of toxic
substances present in the environment. The health risks of exposure in the workplace are also
sometimes included in LCA. These latter risks are often included in a wider impact category
encompassing more than exposure to toxic substances (e.g. accidents at work).”
Ozone Depletion: “Stratospheric ozone depletion refers to the thinning of the stratospheric
ozone layer as a result of anthropogenic emissions. This causes a greater fraction of solar
UV-B radiation to reach the earth’s surface, with potentially harmful impacts on human
health, animal health, terrestrial and aquatic ecosystems, biochemical cycles and materials.”
Photochemical Oxidant Creation: “Photo-oxidant formation is the formation of reactive
chemical compounds such as ozone by the action of sunlight on certain primary air pollutants.
These reactive compounds may be injurious to human health and ecosystems and may also
damage crops. …Photo-oxidants may be formed in the troposphere under the influence of
ultraviolet light, through photochemical oxidation of Volatile Organic Compounds (VOCs)
and carbon monoxide (CO) in the presence of nitrogen oxides (NOx). Ozone is considered
the most important of these oxidising compounds, along with peroxyacetylnitrate (PAN).
Photo-oxidant formation, also known as summer smog, Los Angeles smog or secondary air
pollution, contrasts with winter smog, or London smog, which is characterised by high levels
of inorganic compounds, mainly particles, carbon monoxide and sulphur compounds. This
latter type of smog causes bronchial irritation, coughing, etc. Winter smog, as far as
considered in this Guide, is part of human toxicity.”
Land use: “This subcategory of land use impacts is concerned with the loss of land as a
resource, in the sense of being temporarily unavailable.”
Assessing the environmental impact of building material using the Dutch method | Chevalerias | 2015
1
1 Introduction
1.1 Background
As the building sector is making more efforts to reduce the energy consumption of building
during their use phase, the importance of reducing the environmental impact of the building
throughout its whole lifespan has increased. This has become especially important since the
accomplishment of energy-efficient buildings often requires the use of more material,
especially for insulation and installations (SBK, 2011). In 2010, material use represented 70%
of the climate impact caused by the Dutch construction industry (Bijleveld, et al., 2014).
Although Life-Cycle Assessment (LCA) is used to determine the environmental performance
of buildings since 1990 (Fava, 2006), it is still a difficult tool to use due to the complexity of
the building as a product and the difficulty to predict its lifespan and the changes it may
undergo (Khasreen, et al., 2009). Also, completing an LCA is a long and fastidious process,
which may be difficult to include in the time accorded to the design process. Besides, the
results are not always easy to interpret nor easy to compare to each other if the different LCAs
were not conducted in the exact same way.
This study focuses on understanding how the Netherlands is trying to solve these problems
by setting up a common method (the SBK method), a harmonized national environmental
database of building products (the National MilieuDatabase, NMD) and various certified tools
enabling to use of this database in the context of the new Dutch regulation (the Building Act
of 2012) and the Dutch version of the Building Research Establishment Environmental
Assessment Method (BREEAM.NL).
1.2 Motivation
The main motivation of this study is to examine how the environmental impact of a building
is assessed in the Netherlands, to better comprehend the underlying theory as well as to
understand the practical and theoretical challenges of its application to the design process of
a building. The case of the Netherlands was chosen because it seems to develop an original
method compared to its European neighbours which could be seen as an example to follow.
The underlying intention of this report is to evaluate how this method helps the design team
to create a building which has the best environmental performance possible. As well as at
determining what the advantages and limitations of this method are and which lessons can be
learned from the Dutch example.
1.3 Aim and verifiable goals
The Dutch method is used on an office building project being designed by RAU Architects at
the time of this thesis. The goal is to create a building with the lowest shadow cost possible
by applying strategies from the design team. The shadow cost of a building is a weighted
single indicator expressed in euros, representing the virtual cost of environmental quality.
This price is constructed since it is does not exist in the actual market and allows users to
compare different products (De Bruyn, et al., 2010).
Assessing the environmental impact of building materials using the Dutch approach | Chevalerias | 2015
2
The following questions are examined:
 What is the effect of the design team’s strategies on reducing the shadow cost of the
building according to the Dutch method?
 What are the pros and cons of the Dutch method for the design team?
1.4 Scope
The study will focus on the specific case of the Triodos bank office building, which is not a
standard office since the intention is to test the limits of the Dutch method. Modifications to
the building are, however, limited by the level of flexibility of the project, which is at the end
of the preliminary design stage.
This project depicts an open plan office of around 13,000 m² placed in a park and next to the
train station of Driebergen-Zeist in the Utrecht region (The Netherlands). Accordingly, the
study focusses on the Dutch version of BREEAM for new office buildings: BREEAM.NL.
Assessing the environmental impact of building materials using the Dutch approach | Chevalerias | 2015
3
2 Literature review
2.1 Certification schemes
A certification scheme is a voluntary assessment that is controlled by the certification
provider. Certification schemes usually use a higher benchmark than the country’s current
regulation in order to encourage progress towards best practice. It allows for recognition of
certified buildings in the market and eventually to compare them to each other thanks to a
grading system. The certification scheme can also be seen as a guideline to ensure that all
objectives are met (BRE, 2015).
2.1.1 BREEAM.NL
The Building Research Establishment Environmental Assessment Methodology (BREEAM)
is a certification scheme developed in the UK by the Building Research Establishment (BRE).
BREEAM aims to measure and certify sustainable value in the built environment according
to a large number of precise criterions based on a set of 5 principles:
 Delivering sustainable solutions.
 Providing a framework.
 Based on sound science.
 Able to support the process of change.
 Delivering value to the occupant of the building.
The grading system is composed of 9 categories: Management, Health and Comfort, Energy,
Transport, Water, Material, Waste, Land use and Ecology and Pollution (BREEAM, 2010).
Each category has a different weight in the total score as shown in Figure 1.
Figure 1 Weight of the different category on the total score of the building.
Once weighted, the scores are added to each other with eventual additional innovation credits.
The resulting total score is evaluated according to a rating with the thresholds presented in
Table 1.
Water 6%
Waste 7.5%
Transport 8%
Pollution 10%
Land Use and Ecology 10%
Management 12%
Materials 12.5%
Health and Comfort 15%
Energy 19%
Assessing the environmental impact of building materials using the Dutch approach | Chevalerias | 2015
4
Table 1 Rating system in BREEAM.NL.
Score Rating
≥30% PASS
≥45% GOOD
≥55% VERY GOOD
≥70% EXCELLENT
≥85% OUTSTANDING
Originally developed for the British context, the BRE created an International and European
version of BREEAM. However in several countries like Sweden, Spain, Norway and
Germany, National Scheme Operators (NSO) in cooperation with BRE developed their own
national BREEAM. This is also the case in the Netherlands with BREEAM.NL under the
initiative of the Dutch Green Building Council (DGBC). One specific aspect of BREEAM.NL
is the section MAT1 which is developed according to Dutch method and tools. The Dutch
calculation is also more complete since it includes more building components than the UK
version of BREEAM (Schmidt, 2012).
2.1.2 MAT1
Mat 1 is a credit of the section Material of BREEAM.NL. It comes with specific validated
calculation tools such as the “MaterialenTool”, which uses the National MilieuDatabase
(NMD) further explained in Section 2.2.3. This study has also used the MaterialenTool
The requirement for this section has a significant impact on the design. Table 2 presents the
requirements to score points in MAT1. A maximum of 8 points can be awarded for this credit.
One additional innovation point can be awarded if a new material, not in the database, is
proposed and is proven to reduce the shadow cost of the building by at least 0,05 euro/m².
Table 2 Scale of available points in MAT1 from BREEAM.NL.
1 point At least three material options are considered that have a significant impact on the
shadow price of the building (at least 5% reduction in total).
2 points The environmental impact of the materials used is below the reference value.
3 points The environmental impact of the materials used is at least 10% below the reference
value.
4 points The environmental impact of the materials used is at least 20% below the reference
value.
5 points The environmental impact of the materials used is at least 30% below the reference
value.
6 points The environmental impact of the materials used is at least 40% below the reference
value.
7 points The environmental impact of the materials used is at least 50% below the reference
value.
8 points The environmental impact of the materials used is at least 60% below the reference
value.
The shadow cost of a building is a weighted price that expresses the environmental impact of
the building in one single indicator. This indicator represents the cost that society should be
Assessing the environmental impact of building materials using the Dutch approach | Chevalerias | 2015
5
willing to pay to counter the impacts on the environment to a sustainable level. A more
detailed explanation of shadow cost can be found in Section 2.3.2.
The lifetime expectancy of a utility building is set at 50 years. The materials of foundation,
basement, walls, roofs, floors, interior walls (including finishing of the components) and
facilities of the building are taken into the scope of the credits. The interior falls outside the
scope, a detailed list of the materials scope can be found in Appendix A.
The current reference value for the BREEAM.NL 2014 is 1 €/m² of Bruto-VloerOppervlak
(BVO)(Gross Floor Area)1
and represents the shadow cost of a standard building without
significantly sustainable materials (DGBC, 2015). The documentation does not precise what
exactly these reference building looks like nor how it is determined. According to
BREEAM.NL expert Martin Bijleveld, it is probably an average of about 10 different
buildings (Bijleveld, 2015). A more precise answer was given by the helpdesk of
BREEAM.NL which stated:
“The original ‘referentiewaarde’ (reference value) is determined by
calculating a small set of “standard”, current building practice,
buildings. Combined with some expert judgement from LCA specialists.
We recently adjusted the ‘referentiewaarde’ by analysing the certified
BREEAM-NL building in recent years and the different databases used
for calculation of the shadow cost. Again, expert judgement was used to
determine the right ‘referentiewaarde’.” (van Noort, 2015)
2.2 Dutch context, method, database and tools.
With the prerequisite that a building should not endanger its users or the environment, the
Building Act 2012 states that every new building with a surface area greater than 100 m²
should provide an environmental performance declaration when applying for a building
permit (Ton, et al., 2015). This decree from the Dutch Building Regulation is in force since
January 2013 (Rijksoverheid, n.d.). So far, quantifying the environmental performance of the
building is enough and no limit value is given yet but it is expected in the coming years. In
BREEAM.NL this limit value is set at 1euro/m²BVO (Dutch Green Building Council, 2014).
In order to ensure comparable results and clarity in the assessment, the Dutch government is
recognizing a national method, a harmonized database and several tools which are used both
for the national building regulation and BREEAM.NL. Consequently, every assessment in the
Netherlands is made with the same assumptions and data (SBRCURnet-Cindy Vissering,
2015).
1
Since the way of measuring the Gross Floor Area of a building can be different around the world
and was here calculated according to the Dutch standard NEN 2580, the GFA will be referred to as
BVO in this report.
Assessing the environmental impact of building materials using the Dutch approach | Chevalerias | 2015
6
2.2.1 SBK method
The national method is the “Bepaling van de milieuprestatie van gebouwen en GWW-
werken” (Determination method for the environmental performance of building and civil
engineer work). This document was made by Stichting for Bouw Kwaliteit (SBK), and is
therefore referred to as the “SBK method” in this report.
The SBK method sets Product Category Rules (PCR) for the creation of product cards inserted
into the National MilieuDatabase (NMD), it also sets the rules for the solver of the tools using
the NMD, see Figure 2. A product card is like an Environmental Product Declarations (EPDs)
which is a standardized way to present the LCA results of a product, but is not called EPD
since it also follows the requirements of the SBK method.
Figure 2 Interaction of method, tool and database to determine the environmental performance
of the building (SBK, 2014).
In other words, the SBK method defines how to conduct the Life-Cycle Assessment (LCA)
of every building product constituting the NMD. This database of product cards is then used
in a tool complying with the SBK method to determine the environmental performance of the
building.
The SBK method is based on the European Standard EN 15804 which has been developed for
EPDs. The EN 15804 is itself based on a number of international LCA standards:
 ISO 14025:2010: Environmental labels and declarations – Type III environmental
declarations – principles and procedures.
 ISO 14044:2006: Environmental management – Life cycle assessment –
requirements and guidelines.
 EN 15978:2011: Sustainability of construction works - Assessment of environmental
performance of buildings - Calculation method.
The SBK method differs from the EN15804 by important additions and deviations made to
fit the Dutch context. Some of these modifications are noted in the following section.
2.2.2 LCA according to the SBK method
In this section the steps to effectuate an LCA are presented with a focus on how these steps
are altered by the SBK method to fit the Dutch context. Therefore, it provides a presentation
SBK method:
Product
Category Rules
Process database
EPD
NMD
product
card
NMD
Basic profile
Use of a
validated
tool
Environmental
performance result:
Total shadow cost of
the building
SBK
method
SBK
method
Assessing the environmental impact of building materials using the Dutch approach | Chevalerias | 2015
7
of the main differences between an international EPD and a Dutch product card found in the
NMD.
LCA is a technique to assess the environmental impact caused by a product. It is carried out
in 4 steps:
1) Goal and scope definition.
2) Inventory Analysis.
3) Impact Assessment.
4) Interpretation.
Although conducted in this order, each decision could influence the other steps, as shown in
Figure 3.
Figure 3 LCA process (Rebitzer, et al., 2004).
1) Goal and scope definition.
The goal and scope definition states how and to whom the results of an LCA are to be
communicated. In this case, the main target group is LCA experts who want to add a
product card to the NMD (see Section 2.2.3). It also defines the following.
 Functional unit: It is critical to later allow analysis and comparison. According to
the LCA handbook (Joint Research Center, 2010), it should clearly describe the
product (what?), its magnitude (how much?), its performance (how well?) and its
duration (for how long?). The single example for a product given in the SBK
Method is: “An inclined plane with a minimum angle of 20 degree which meets
the requirement of the Dutch Building Regulations having a functional life of 75
years and expressed in m².” (SBK, 2014). It is worthy to note that this example
does not seems to comply with the definition stated above since it does not give
from which material this inclined plane is made from. Also, if the producer does
not give substantial proof of his product lifespan, it will be determined according
to the document "levensduur van bouwmaterialen” (lifespan of building
materials) from Stichting Bouw Research (SBR).
 System boundaries: It defines which stages of the life-cycle are included in the
assessment. An EPD is often only from cradle-to-gate (i.e. Production Stage A1,
A2 and A3, see Figure 4) while the product card of the NMD aims for cradle-to-
grave corresponding to the whole life-cycle of the product as can be seen in
Goal and Scope Definition
Inventory Analysis
Impact Assessment
Interpretation
Assessing the environmental impact of building materials using the Dutch approach | Chevalerias | 2015
8
Figure 4. The stages written in light grey and underlined are not included in the
system boundary according to the SBK method.
Figure 4 Life-Cycle stages of building products (SBK, 2014).
 Assumptions and limitations: A number of processes are given a standard value
corresponding to the Dutch context to avoid unjustified differences in the calculation
due to assumptions. In Figure 4, the stages requiring the use of these basic profiles
are framed with a dashed red line.
 Allocations methods: The allocation procedures for reuse and recycling are given in
the SBK method. The system boundaries are established for use and release of
secondary materials through economic cut-off (SBK, 2014).
 Impact categories: The chosen categories can be seen in Table 5. These impact
categories are not the only consequences of the building on the environment. They
are the ones selected because they are considered to be the most relevant. Eco-
Toxicity has been added after a study from TNO (van Harmelen, et al., 2004),
whereas the addition of Land-Use is now under discussion.
 Compared to an international EPD, the indicators on Human and Eco-Toxicity are
added to satisfy the Dutch conditions. The main reason for this addition is the will to
encourage environmental improvements such as the use of “air scrubbers” to improve
air quality which are ignored otherwise (SBRCURnet-Cindy Vissering, 2015).
2) Inventory Analysis.
The Life-Cycle inventory analysis makes a list of all type and quantity of incoming and
outgoing flows. With the SBK method, reference is made to a specific LCA database for
Production Stage
A1 A2 A3
Construction
Stage
A4 A5
Extractionofrawmaterial
Transport
Production
Trasnport
ConstructionandInstallation
Procces
Use Stage
B1 B2 B3 B4 B5
Use
Maintenance
Repair
Replacement
Refurbishment
B7 Operational water use
B6 Operational energy use
End of life Stage
C1 C2 C3 C4
Deconstruction/Demollition
Transport
Wasteprocessing
Disposal
Beyond
Life
cycle
D
D
Re-use,Recovery,Recycling
potential
Assessing the environmental impact of building materials using the Dutch approach | Chevalerias | 2015
9
raw materials and basic processes (SBRCURnet-Cindy Vissering, 2015). A broad
consensus in the Netherlands made SimaPro in combination with the Swiss EcoInvent
database, the main tool to execute LCAs.
3) Impact Assessment.
This step corresponds to translation of different compounds from inventory analysis into
impact categories or a single value indicator. The weighting system is illustrated later in
Figure 5. Although weighting is considered a subjective way to create a single indicator,
the members that established the SBK method agreed to use of the monetization method
which translates different impact categories into a shadow price in euros.
4) Interpretation.
In this step the results are used to make decisions, which are mostly made by comparing
two or more cases. In our case, the single indicator, the shadow cost of the product, is
entered into the NMD to later constitute the shadow cost of the building.
2.2.3 National Milieu Database (NMD)
SBK is the owner and manager of the NMD, the data inside the NMD however, comes from
different sources and is not always owned by SBK. Only when owned by SBK, the product
cards are accessible to the public from the online database2
. The NMD consists of different
databases: one for the basic profile that are used by LCA expert when creating a product card
and one containing the product cards that are visible online and in the tools. The product cards
are sorted into three categories, see Table 3.
Table 3 Categories in the NMD.
Category 1 Category 2 Category 3
Source LCA from single
manufacturer/
producer/supplier.
Branded product.
LCA from group of
manufacturers or
branch association.
Unbranded product.
Unbranded data from
industry/manufacturer/
producer/supplier/client
3rd party verified
according to the
SBK assessment
protocol
Yes Yes No
The data from category 3 is mostly incomplete or expired data which are kept in the NMD
due to lack of better data. These, therefore, get a penalty of +30% to account for uncertainties.
This factor is applied by SBK as a precaution since experience has shown that unverified
results tend to present a low environmental impact due to missing data in the inventory
(Schuurmans, 2014). For a number of products, such as laminated wood, this factor is
probably underestimated (Klaassen, 2015).
2
To consult this database, go to: https://www.milieudatabase.nl/viewNMD/
Assessing the environmental impact of building materials using the Dutch approach | Chevalerias | 2015
10
Two committees were formed by SBK in 2010 to manage the NMD:
 The MBG: “Milieuprestatiecommissie Bouw en GWW” (Environmental
performance committee for Building and Civil Engeneering Work) is in charge of the
policy development: defining project plans, fixing deadlines for the new updates of
the NMD, advising SBK on communication, etc.
 The TIC “Technische Inhoudelijke Commissie” (Technical Content Commission) is
responsible for the substantive technical aspect of the NMD which goes from
elaborating the method and adjusting the product cards to supporting SBK with the
helpdesk (SBK, 2011).
2.2.4 Other tools
The TIC mentioned above is also in charge of certifying tools that use the NMD and the SBK
method. Thanks to this certification, each consultant company can continue to develop and
use their own software while being in compliance with the SBK method. The different tools
presented in Table 4 are the most employed (van der Klauw & van Zeijl, 2014) and can be
used in compliance with both the Building Act 2012 and BREEAM.NL.
Table 4 Tools to calculate environmental performance of a building.
Name of the tool Developer Accessibility
MRPI - MPG W/E Adviseurs Free use online3
GPR Bouwbesluit
GPR Gebouw met MPG W/E Adviseurs License fee required
DGBC MaterialenTool DGMR (NIBE Co-owner) Free download4
The DGBC MaterialenTool was used in this study since it was already being used by the
design team of the study case. Based on GreenCalc+, the version 2.21 was used to comply
with the version 2014 of BREEAM.NL. This most recent version of the MaterialenTool was
also chosen to use the most up-to-date version of the NMD.
The different materials are inserted with their dimensions and their quantity into the program.
The tool then delivers the total shadow cost of the building in €/m²BVO as well as the
environmental impact of the building with the 11 impact categories in absolute values or
weighted shadow cost.
2.3 Shadow cost as weighting method
As suggested above, the environmental performance of a building in the Netherlands includes
11 impact categories, which are stated in Table 5. Each of these selected environmental impact
categories is assigned a shadow price per unit which can then add up to a single environmental
indicator resulting in the total shadow cost of the building.
3
Link to the online tool: http://www.mrpi-mpg.nl/Home/Home
4
The latest Materialentool can be downloaded on the DGBC’s web site: http://www.dgbc.nl/content/materialentool-0
Assessing the environmental impact of building materials using the Dutch approach | Chevalerias | 2015
11
This list is subject to changes as the Land-Use category could be included in the future as the
Eco-toxicity categories were added before (Scholtes, 2015). Also, the shadow price is not a
fixed value but varies with economic and environmental situation as explained further in
Section 2.3.2.
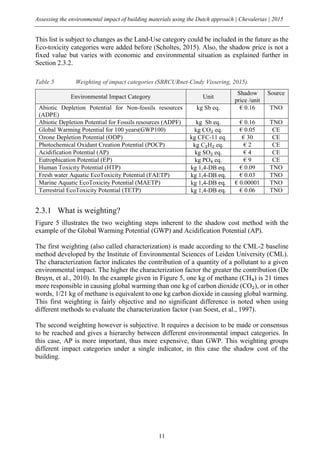
Table 5 Weighting of impact categories (SBRCURnet-Cindy Vissering, 2015).
Environmental Impact Category Unit
Shadow
price /unit
Source
Abiotic Depletion Potential for Non-fossils resources
(ADPE)
kg Sb eq. € 0.16 TNO
Abiotic Depletion Potential for Fossils resources (ADPF) kg Sb eq. € 0.16 TNO
Global Warming Potential for 100 years(GWP100) kg CO₂ eq. € 0.05 CE
Ozone Depletion Potential (ODP) kg CFC-11 eq. € 30 CE
Photochemical Oxidant Creation Potential (POCP) kg C₂H₂ eq. € 2 CE
Acidification Potential (AP) kg SO₂ eq. € 4 CE
Eutrophication Potential (EP) kg PO₄ eq. € 9 CE
Human Toxicity Potential (HTP) kg 1,4-DB eq. € 0.09 TNO
Fresh water Aquatic EcoToxicity Potential (FAETP) kg 1,4-DB eq. € 0.03 TNO
Marine Aquatic EcoToxicity Potential (MAETP) kg 1,4-DB eq. € 0.00001 TNO
Terrestrial EcoToxicity Potential (TETP) kg 1,4-DB eq. € 0.06 TNO
2.3.1 What is weighting?
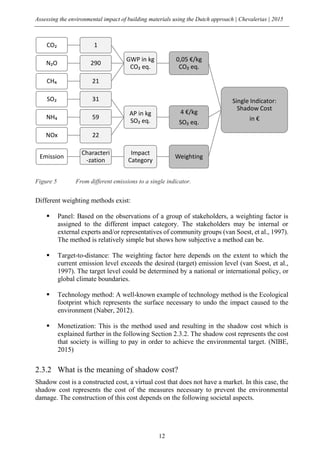
Figure 5 illustrates the two weighting steps inherent to the shadow cost method with the
example of the Global Warming Potential (GWP) and Acidification Potential (AP).
The first weighting (also called characterization) is made according to the CML-2 baseline
method developed by the Institute of Environmental Sciences of Leiden University (CML).
The characterization factor indicates the contribution of a quantity of a pollutant to a given
environmental impact. The higher the characterization factor the greater the contribution (De
Bruyn, et al., 2010). In the example given in Figure 5, one kg of methane (CH₄) is 21 times
more responsible in causing global warming than one kg of carbon dioxide (CO₂), or in other
words, 1/21 kg of methane is equivalent to one kg carbon dioxide in causing global warming.
This first weighting is fairly objective and no significant difference is noted when using
different methods to evaluate the characterization factor (van Soest, et al., 1997).
The second weighting however is subjective. It requires a decision to be made or consensus
to be reached and gives a hierarchy between different environmental impact categories. In
this case, AP is more important, thus more expensive, than GWP. This weighting groups
different impact categories under a single indicator, in this case the shadow cost of the
building.
Assessing the environmental impact of building materials using the Dutch approach | Chevalerias | 2015
12
Figure 5 From different emissions to a single indicator.
Different weighting methods exist:
 Panel: Based on the observations of a group of stakeholders, a weighting factor is
assigned to the different impact category. The stakeholders may be internal or
external experts and/or representatives of community groups (van Soest, et al., 1997).
The method is relatively simple but shows how subjective a method can be.
 Target-to-distance: The weighting factor here depends on the extent to which the
current emission level exceeds the desired (target) emission level (van Soest, et al.,
1997). The target level could be determined by a national or international policy, or
global climate boundaries.
 Technology method: A well-known example of technology method is the Ecological
footprint which represents the surface necessary to undo the impact caused to the
environment (Naber, 2012).
 Monetization: This is the method used and resulting in the shadow cost which is
explained further in the following Section 2.3.2. The shadow cost represents the cost
that society is willing to pay in order to achieve the environmental target. (NIBE,
2015)
2.3.2 What is the meaning of shadow cost?
Shadow cost is a constructed cost, a virtual cost that does not have a market. In this case, the
shadow cost represents the cost of the measures necessary to prevent the environmental
damage. The construction of this cost depends on the following societal aspects.
Single Indicator:
Shadow Cost
in €
0,05 €/kg
CO₂ eq.
GWP in kg
CO₂ eq.
1CO₂
290N₂O
21CH₄
4 €/kg
SO₂ eq.
AP in kg
SO₂ eq.
31SO₂
59NH₄
22NOx
Weighting
Impact
Category
Characteri
-zation
Emission
Assessing the environmental impact of building materials using the Dutch approach | Chevalerias | 2015
13
 Economy: The shadow cost represents the maximum sum that society is willing to
pay to achieve environmental quality (De Bruyn, et al., 2010). It is therefore
dependent on the income level of the society concerned. It can be assessed by direct
surveys or by actual market price analysis.
 Policy target: Since the Netherlands is a democracy, the decision made by the
politicians is considered to reflect the definition of the environmental quality
according to Dutch society.
Figure 6 illustrates how the shadow cost could be determined. The blue curve represents the
supply of options for prevention of emissions. Its price increases as the required reduction is
greater. The red dashed curve corresponds to the demand of society for limiting impacts. The
willingness to pay a higher price to limit the environmental impacts usually increases with
the importance of the damage caused by the emissions. To be cost efficient, the emission
target set by the government should be placed at the equilibrium point between supply and
demand. This point corresponds to the shadow cost.
Figure 6 Shadow cost determination (van Soest, et al., 1997).
In addition of being a single indicator under which all impacts can be grouped, the shadow
cost weighting method has the advantage of giving to environmental impacts the same unit as
real cost, which makes it a convincing unit that all stakeholders of the project can visualize.
2.4 Other labels and certifications used in the Netherlands
Although the NMD is settling as the main tool to assess the environmental impact of building
materials in the Netherlands, different independent labels or certifications are complementing
s
Assessing the environmental impact of building materials using the Dutch approach | Chevalerias | 2015
14
or competing with the national method. In this section the DUBOKEUR label and the C2C
certification are presented since they are mentioned in the BREEAM.NL concerning the
possibility of getting innovation points by using these products. Firstly however, the NIBE’s
environmental classification is explained to clarify how this collection of product data and
their shadow cost is different from the NMD.
2.4.1 NIBE´s Environmental Classification:
The Nederlands Instituut voor BouwBiologie en Ecologie (The Dutch Institute for Building
Biology and Ecology) (NIBE) is an independent company that has created an online
classification of materials 5
that are ranked according to their shadow cost. The shadow cost
of these materials is calculated in the same manner as the NMD product, however, it is not
reviewed by a third party. Most importantly, The NIBE decided to take more environmental
impact categories into consideration as highlighted in bold in Table 6. The resulting shadow
cost for each product is therefore different from the one in the NMD.
Table 6 Impact category and shadow cost applied in the NIBE's environmental classification.
Main
category
Environmental
impact
category
Unit
Method of
characterization
Shadow cost
in €/unit
Source
Used
by:
Emissions
GWP100 kg CO₂ eq.
CML-2
Baseline
0.05 CE
NMD
and
NIBE
ODP
kg CFC-11
eq.
30 CE
HTP kg 1,4-DB eq. 0.09 TNO
FAETP kg 1,4-DB eq. 0.03 TNO
TETP kg 1,4-DB eq. 0.06 TNO
POCP kg C₂H₂ eq. 2 CE
AP kg SO₂ eq. 4 CE
EP kg PO₄ eq. 9 CE
Depletion
of raw
materials
ADPE kg Sb eq. 0.16 TNO
ADPF Sb eq. 0.16 TNO
Biotic
Depletion
Potential
(BDP)
mbp TWIN 0.042202 NIBE
Only
NIBE
Land use Land use PDF/m²/yrs eco-indicator 99 0.20482 NIBE
Nuisance
Malodorous
air
OTV m³
CML2 baseline,
inverse OTV
0.0000000233 NIBE
Road noise DALY Müller-Wenk 321.946 NIBE
Disturbance
by sound
mbp TWIN 0.00000149 NIBE
Disturbance
by light
mbp TWIN 0.024005 NIBE
Disturbance
by calamities
mbp TWIN 0.024005 NIBE
5
The classification is accessible to the public after a free registration on http://www.nibe.info/nl
Assessing the environmental impact of building materials using the Dutch approach | Chevalerias | 2015
15
However, this classification is very transparent, since each product is clearly described with
an extensive functional unit and the results are presented for each impact category in both real
value and weighted shadow cost.
A quick overview of the products is possible and allows to rapidly define which product is
the most environmental friendly with a ranking system going from best choice (i.e. Class 1)
to unacceptable choice (i.e. Class 7). For each class, subcategories a, b or c define preferred
options. The ranking is made according to the best product currently available which is
automatically 1a, while the other products follow the ranking according to an environmental
factor as shown in Table 7.
Table 7 NIBE's classification system (NIBE, 2015).
Class Sub-class Definition Environmental factor
1 a Best choice 1 – 1,1
b > 1,1 – 1,32
c > 1,32 – 1,58
2 a Good choice > 1,58 – 1,9
b > 1,9 – 2,28
c > 2,28 – 2,74
3 a Acceptable choice > 2,74 – 3,28
b > 3,28 – 3,94
c > 3,94 – 4,73
4 a Less good choice > 4,73 – 5,68
b > 5,68 – 6,81
c > 6,81 – 8,17
5 a Not recommended choice > 8,17 – 9,81
b > 9,81 – 11,77
c > 11,77 – 14,12
6 a Bad choice > 14,12 – 16,95
b > 16,95 – 20,34
c > 20,34 – 24,40
7 a Unacceptable choice > 24,40 – 29,29
b > 29,29 – 35,14
c > 35,14 – 42,17
>7c Unacceptable choice > 42,17
2.4.2 DUBOkeur®
:
Since 2004, NIBE has also developed its own product label: DUBOkeur®
(from Duurzaam
Bouwen Keur: Selection for Sustainable Building). The labelled products go under the same
assessment as products in NIBE’s environmental classification, except that these are branded
while the others are generic products. A product receives a DUBOkeur®
label when it is the
best product of its kind of application and stands at least on the 2c grade of the NIBE’s
classification. The product rankings change when new products are added or when products
already labelled are checked every second year. A new best product determines whether the
older products are still good enough to keep the label. This system pushes the manufacturer
to have a competitive product in term of sustainability (Scholtes, 2015). However, the label
only gives a pass or fail, it does not allow to compare the products between each other. Also,
Assessing the environmental impact of building materials using the Dutch approach | Chevalerias | 2015
16
only the functional unit of the product is given. The label stands for itself and no insight is
given about the environmental impact or health characteristic of the product (DUBOKEUR,
2014).
2.4.3 C2C®
(or cradle-to-cradle®
):
The Cradle to Cradle Products Innovation Institute is a non-profit organization which was
created by US architect William McDonough and German chemist Dr. Michael Braungart in
2010 and which administers the Cradle to Cradle Certified™ Product Standard. The institute
has its headquarter in San Francisco and a satellite office for Europe in Venlo (The
Netherlands). The principle of the Cradle-to-cradle® thinking is to continue the life-cycle of
the product beyond the end of its life phase, contrasting from the cradle-to-grave system
boundary. The certification motto is to make products “More good” instead of “less bad”. The
cradle-to-cradle®
product certification is assessed by the mean of 5 categories: Material
health, Material reutilization, Renewable energy and carbon management and Social Fairness
and biodiversity. Each category receives a score: Basic, Bronze, Silver, Gold or Platinum with
the lowest score representing the overall score of the product. The requirements are made to
prove the quality of the product according to the certification standard as well as a guide to
encourage manufacturer toward the next step of the certification. To this day, no product has
yet reached the platinum level.
Since 2011, the NIBE provide additional information about the products in their classification
with a “bron2bron” (source to source) label. It presents how well the product could comply
with the cradle-to-cradle®
principle with 4 indicators: material health, material recycling,
renewable energy and responsible water management.
2.5 Research conducted with the Dutch method
This literature review section looks at research concerning the Dutch assessment method for
environmental impact of building materials. Very few were found in the English language or
with an English abstract, mainly because this method was integrated in the Dutch building
regulations only three years ago. Three studies focusing on specific building component or
practice such as reusing building materials, renovating or using PV panels revealed some
limitations of the Dutch method while a fourth study analyses the first results from the
application of method in the Building regulations.
Naber (2012), in her thesis about the “reuse of hollow core slab from office buildings to
residential buildings” used the LCA software SimaPro in compliance with the Dutch
assessment method. A full life cycle assessment tool was chosen rather than a tool using the
NMD since the latter do not include products that are not actually used in the industry such
as re-usable hollow core slab while SimaPro gives the flexibility to create different processes.
The study therefore examined different scenarios in detail such as deconstruction versus
disassembly, recycled versus new or simply different percentage of reused material in the
building.
Dijkstra (2013) also used SimaPro in his thesis “environmental and economic impact
comparison of renovation concepts for Dutch residential buildings”. The author presented the
Assessing the environmental impact of building materials using the Dutch approach | Chevalerias | 2015
17
shadow cost results not only for the materials but also for the energy use of different
renovation scenarios, which had different lifespan expectancy.
The importance of linking the environmental performance with the energy performance of the
building or product was also demonstrated in a report by Alsema and Anink (2014). In their
report, the authors used the Dutch method for environmental impact assessment and the NMD
with the GPR tool developed by W/E consultants. The study proposed an integrated
environmental performance that assigns an environmental impact factor per unit of different
type of energy. This allowed to show the shadow cost of a building’s materials and the shadow
cost of the energy used by the building in the same figure. Although this method still needs
to be perfected, it would provide the Dutch method for environmental impact assessment with
a valuable additional feature allowing it to balance material and energy use. The study also
pointed out the lack of up to date quality data on PV equipment in the NMD and the need for
its completion.
This lack of data was also identified by van der Klauw and van Zeijl (2014). Emphasizing
another point of view, their article presented the feedback from municipalities and applicants
to construction permit since the application of the Dutch environmental performance
assessment method in January 2013. The main findings of the survey included:
 Many of the submitted assessments were incomplete or inaccurate mainly due to time
or money restrictions.
 The main complaints from the respondents of the survey were the lack of data in the
NMD and the lack of consistency in the requirements between different
municipalities.
 For many municipalities the lack of a maximum allowed value in the building
regulation is the main reason for not being strict about the submission of an
environmental performance assessment.
In the same study by van der Klauw and van Zeijl, the analysis of 261 cases revealed that:
 The shadow costs of the majority of buildings were between 0.40 and 0.80 €/m²BVO.
 A value of 1.2 €/m²BVO or above generally meant that the assessment was inaccurate
or that the building included a large energy plant such as PV or heat pump.
 Office buildings have a relatively higher shadow cost than houses due to the
proportion of installations needed for the building.
 In general, walls, floors and installations are the largest contributors to the total
shadow cost.
 It appears that no correlation exists (in this study) between a low energy performance
and a high environmental performance.
Assessing the environmental impact of building materials using the Dutch approach | Chevalerias | 2015
18
The literature survey suggests that the tools using the NMD can be insufficient to evaluate
certain alternative design that are peculiar or that implement unconventional or new materials.
The need for a more complete database is also clearly expressed. However, the Dutch method
still serve as a common ground to execute full LCA that are then comparable to each other.
Also, the necessity to link the environmental performance of material to the environmental
impact of energy use of the building is clearly demonstrated.
Assessing the environmental impact of building materials using the Dutch approach | Chevalerias | 2015
19
3 Method
The study has been structured as follows:
 The first task was to get familiar with the Dutch context, mainly through a literature
review and then via practice. This has been done by assessing the environmental
impact of a study case of an office building project with the MaterialenTool described
in Section 2.2.4.
 Next, the limits of the tool were tested by a parametric study that aimed to reduce the
environmental impact of the building as much as possible while conserving its
energy-efficiency and overall design.
 Finally, interviews were conducted with different actors and users of the Dutch
method to discuss the efficiency and viability of this method.
3.1 Description of study case
The study case is a project for the new office building of the Dutch bank “Triodos” in
Driebergen-Zeist, in the Region of Utrecht, The Netherlands. The Triodos bank is highly
engaged towards sustainability by supporting sustainable project with a positive social,
environmental and cultural value (Triodos, 2015). The idea behind this new building is to
bring a positive value to the location with the building acting as a platform encouraging the
sharing of knowledge and innovation as well as holding a more traditional headquarter
function.
Figure 7 Location of the building project.
The building with around 13000 m² and up to 5 stories, is placed in historical park “de
Reehorst”, which will stay open to the public. The ground floor of the building should
Assessing the environmental impact of building materials using the Dutch approach | Chevalerias | 2015
20
therefore be able to welcome any visitors of the park as well as clients and employees. This
location benefits from its close access to the train station’’ Driebergen-Zeist’’ and to a quick
access to the highway.
The design team came up with an organic shape inspired by the shape of living cells which
created three towers with a concrete core that merge with each other on the lowest levels (see
Figure 8, right). The building is placed on a spot which was once constructed and strive to
limit the number of tree necessary to cut for the construction. It is also shaped so that it avoids
obstructing the view from the existing historical building Antropia and its height matches the
height of the existing surrounding trees (see Figure 8, left).
Figure 8 Shaping of the building according to the surrounding landscape elements
(Courtesy of RAU Architects).
The facade is entirely glazed with some glass panel being filled with aerogel making the glass
translucent according to the orientation and intimacy level requested. The roof welcomes
greenery and skylights. Figure 9 gives an overview of the building.
Figure 9 Bird’s eye view rendering of the project (Courtesy of RAU Architects).
Assessing the environmental impact of building materials using the Dutch approach | Chevalerias | 2015
21
The structure consists of a concrete core from which the concrete floor extends itself in a
wooden floor supported on the outside by steel columns. This shape aims to optimize the use
of material and maximize the amount of daylight entering the building. Figure 10 proposes
and overview of the main materials of the building in a simplified 3D section of one of the
three tower of the building.
Figure 10 Section showing the structural principle and used materials.
The ground floor has the general function of sharing; it has a restaurant, a conference room,
meeting rooms, an exposition space, a library, etc. The top floors are open plan offices while
the circulation and other functional rooms (toilets, copy machines, storage, etc.) are placed in
the concrete core. The basement holds all facilities that do not require daylight such as:
technical spaces (Air Handling Unit, sprinklers basin, server room), storage areas (bicycles
parking, waste recycling room, archives and other storage room) and other periodical
functions (expedition area, kitchen facilities, showers and locker rooms for employees coming
by bike). The detailed floor plans of the building can be seen in Appendix C.
After a period of latency due to issues raised by the development of other surrounding
projects, the Triodos group decided to re-evaluate the design instead of rushing into the
Definitief Ontwerp phase (definitive design stage). This approach from the client is not such
a common decision and illustrate well the commitment of the Triodos group toward
sustainability by appreciating the time needed to develop new ideas and concepts.
Roof window:
-triple layer glass
-wooden wall
-OSB 30mm
-EPS Rc: 6.5 m²K/W
Curtain wall:
-wood/aluminum
frame
-triple layer glass
Steel beams
160X80mm
Overhang:
-sedum roof system
-OSB 30 mm
-wood beams
-metal coating
Core wall:
-concrete 250 mm
Basement wall:
-concrete 250 mm
-EPS Rc: 6.5 m²K/W
Round concrete
column 400 mm or
300 mm
Ssss
,
s
Roof:
-green roof system
-OSB 30mm
-EPS Rc: 6.5
m²K/W
-wooden floor
Wooden floor:
-wooden beams
-OSB 30mm
-insulation 20 mm
-anhydrite 50 mm
Core floor:
-concrete 250 mm
Ground floor:
-prefabricated
concrete hollow
core slab or
concrete poured on
site 250 mm
-anhydrite 80 mm
-EPS 20 mm
Basement floor:
-concrete 250 mm
-EPS Rc: 6.5
m²K/W
Concrete
foundation poles
,
s
Assessing the environmental impact of building materials using the Dutch approach | Chevalerias | 2015
22
3.2 Practical requirements of the project
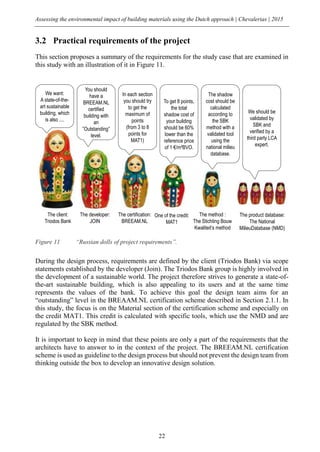
This section proposes a summary of the requirements for the study case that are examined in
this study with an illustration of it in Figure 11.
Figure 11 “Russian dolls of project requirements”.
During the design process, requirements are defined by the client (Triodos Bank) via scope
statements established by the developer (Join). The Triodos Bank group is highly involved in
the development of a sustainable world. The project therefore strives to generate a state-of-
the-art sustainable building, which is also appealing to its users and at the same time
represents the values of the bank. To achieve this goal the design team aims for an
“outstanding” level in the BREAAM.NL certification scheme described in Section 2.1.1. In
this study, the focus is on the Material section of the certification scheme and especially on
the credit MAT1. This credit is calculated with specific tools, which use the NMD and are
regulated by the SBK method.
It is important to keep in mind that these points are only a part of the requirements that the
architects have to answer to in the context of the project. The BREEAM.NL certification
scheme is used as guideline to the design process but should not prevent the design team from
thinking outside the box to develop an innovative design solution.
We want:
A state-of-the-
art sustainable
building, which
is also ....
You should
have a
BREEAM.NL
certified
building with
an
”Outstanding”
level.
In each section
you should try
to get the
maximum of
points
(from 3 to 8
points for
MAT1)
To get 8 points,
the total
shadow cost of
your building
should be 60%
lower than the
reference price
of 1 €/m²BVO.
We should be
validated by
SBK and
verified by a
third party LCA
expert.
The client:
Triodos Bank
The developer:
JOIN
The certification:
BREEAM.NL
One of the credit:
MAT1
The method :
The Stichting Bouw
Kwaliteit’s method
The shadow
cost should be
calculated
according to
the SBK
method with a
validated tool
using the
national milieu
database.
The product database:
The National
MilieuDatabase (NMD)
Assessing the environmental impact of building materials using the Dutch approach | Chevalerias | 2015
23
3.3 Parametric Study
The preliminary design of the study case and its environmental performance was first
analysed in order to understand which part of the building influences its shadow cost most.
Thanks to the ArchiCAD software used by the architects, it was possible to make a precise
inventory of the materials used in the project even at an early design phase. This inventory is
presented in Appendix B.
Then, via a parametric study, different concepts and material options were considered. The
considered options were chosen based on the strategies intuitively thought of by the design
team to reduce the environmental impact of the building and according to the other practical
challenges of the project.
 The reduction or removal of the basement was considered to reduce the direct
footprint of the building on the land and to rearrange the entry to the building.
 According to the fluctuant level of the ground water on the site, different material for
the foundation poles were tested.
 To obtain a warmer atmosphere in the offices and to show the structure of the
building, different wooden structures were designed to replace the concrete core and
steel columns.
 Different innovative type of climate ceiling were assessed.
 Different combinations of solutions were tested and a substitution of products for the
most accurate in the database was effectuated.
Some other ideas to reduce the environmental impact from the building materials were also
studied. These included:
 Certified materials and label recommended by the certification scheme were
investigated.
 The possibility of using material reclaimed from the waste stream was analysed.
3.4 Interviews
Although the Dutch method has been studied through a literature review and the practicality
of the tool has been assessed through its application on the study case, calling on the
knowledge of experts was inevitable to make sure that no aspect of the possibilities and
limitations of the Dutch method has been left out. This opportunity was taken by conducting
extensive discussions about the Dutch method with different actors of the method so that
different points of view could be recorded, from the expert to the user. The term “user” here
is related to the people that use the tools in combination with the NMD such as the
MaterialenTool while “expert” refers to people contributing to the construction of the method
or to the addition of products in the NMD by performing LCAs. Since a quantitative survey
Assessing the environmental impact of building materials using the Dutch approach | Chevalerias | 2015
24
had already been conducted by Alsema and Anink (2014), a qualitative approach was
preferred here, the goal being to sense if the advantages and inconveniences of the Dutch
method were seen similarly at the different levels of use.
The name of the interviewees and their relation to the Dutch method is explained in Table 8.
The interviews took place on different dates with no specific chronological order and were
conducted in the working place of each interviewees. The interviews were conducted as a
conversation rather than a precise interrogation. The discussions of about 1 hour were
recorded and transcribed in writing in its entirety in Appendix D.
Table 8 Name and functions of the interviewees.
Name of the
interviewee
Function as contributor to
the Dutch method
Function as user of
the Dutch method
Other relevant function
Rick Scholtes
Member of the TIC.
Member of VLCA.
Third party reviewer for
product card to be
included in the NMD.
Employee of the NIBE, in
charge of the DUBOKEUR
label and the NIBE’s
environmental classification.
René
Klaassen
Member of VLCA.
Third party reviewer for
product card to be
included in the NMD.
Researcher at the SHR, in
charge of LCA for wooden
products.
Martin
Bijleveld
Sustainability
consultant at
DGMR.
BREEAM.NL expert.
Dennis
Grootenboer
Technical
designer at
RAU Architects
C2C expert.
Assessing the environmental impact of building materials using the Dutch approach | Chevalerias | 2015
25
4 Results
4.1 Analysis of preliminary design
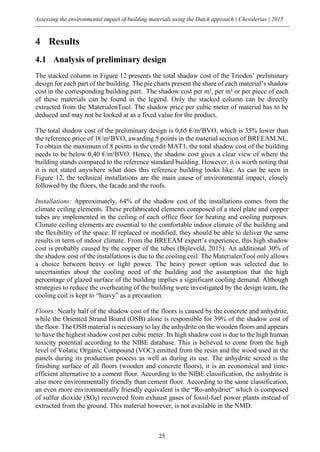
The stacked column in Figure 12 presents the total shadow cost of the Triodos’ preliminary
design for each part of the building. The pie charts present the share of each material’s shadow
cost in the corresponding building part. The shadow cost per m³, per m² or per piece of each
of these materials can be found in the legend. Only the stacked column can be directly
extracted from the MaterialenTool. The shadow price per cubic meter of material has to be
deduced and may not be looked at as a fixed value for the product.
The total shadow cost of the preliminary design is 0,65 €/m²BVO, which is 35% lower than
the reference price of 1€/m²BVO, awarding 5 points in the material section of BREEAM.NL.
To obtain the maximum of 8 points in the credit MAT1, the total shadow cost of the building
needs to be below 0,40 €/m²BVO. Hence, the shadow cost gives a clear view of where the
building stands compared to the reference standard building. However, it is worth noting that
it is not stated anywhere what does this reference building looks like. As can be seen in
Figure 12, the technical installations are the main cause of environmental impact, closely
followed by the floors, the facade and the roofs.
Installations: Approximately, 64% of the shadow cost of the installations comes from the
climate ceiling elements. These prefabricated elements composed of a steel plate and copper
tubes are implemented in the ceiling of each office floor for heating and cooling purposes.
Climate ceiling elements are essential to the comfortable indoor climate of the building and
the flexibility of the space. If replaced or modified, they should be able to deliver the same
results in term of indoor climate. From the BREEAM expert’s experience, this high shadow
cost is probably caused by the copper of the tubes (Bijleveld, 2015). An additional 30% of
the shadow cost of the installations is due to the cooling coil. The MaterialenTool only allows
a choice between heavy or light power. The heavy power option was selected due to
uncertainties about the cooling need of the building and the assumption that the high
percentage of glazed surface of the building implies a significant cooling demand. Although
strategies to reduce the overheating of the building were investigated by the design team, the
cooling coil is kept to “heavy” as a precaution.
Floors: Nearly half of the shadow cost of the floors is caused by the concrete and anhydrite,
while the Oriented Strand Board (OSB) alone is responsible for 39% of the shadow cost of
the floor. The OSB material is necessary to lay the anhydrite on the wooden floors and appears
to have the highest shadow cost per cubic meter. Its high shadow cost is due to the high human
toxicity potential according to the NIBE database. This is believed to come from the high
level of Volatic Organic Compound (VOC) emitted from the resin and the wood used in the
panels during its production process as well as during its use. The anhydrite screed is the
finishing surface of all floors (wooden and concrete floors), it is an economical and time-
efficient alternative to a cement floor. According to the NIBE classification, the anhydrite is
also more environmentally friendly than cement floor. According to the same classification,
an even more environmentally friendly equivalent is the “Ro-anhydriet” which is composed
of sulfur dioxide (SO₂) recovered from exhaust gases of fossil-fuel power plants instead of
extracted from the ground. This material however, is not available in the NMD.
Assessing the environmental impact of building materials using the Dutch approach | Chevalerias | 2015
26
Figure 12 Composition of the shadow cost of the preliminary design.
Facade: The facade is mainly composed of triple layered glass which account for 97% of the
facade’s shadow cost. The frame holding the triple glass is intended to be a wooden frame
with an aluminium coating on the parts of the frame facing the outside. This design choice
made by the architects allows to keep the use of aluminium to a minimum.
Indeed, the aluminium has a very high shadow cost per cubic meter, at least 950 times higher
than the wooden frame. It is interesting to note that this small quantity still places the
0.09
0.12
0.03
0.13
0.12
0.15
0.01
0.00
0.05
0.10
0.15
0.20
0.25
0.30
0.35
0.40
0.45
0.50
0.55
0.60
0.65
OSB - 21.85 €/m³
concrete poured on site - 20.5 €/m³
concrete hollow core slab - 16.6 €/m³
anhydriet 80 - 15.3 €/m³
EPS Rc 0.6 - 13.8 €/m³
wood beams - 8.95 €/m³
mineral wool Rc 0.6 - 5.3 €/m³
facade
floors
roofs
installations
Total shadow cost of the
building / (€/m²BVO)
aluminium profiel - 11623 €/m³
drievoudig glas - 1070.1 €/m³
hout kozijn - 12.2 €/m³
drievoudig glas - 1070.1 €/m³
multiplex - 118.1 €/m³
EPS Rc 6.5 - 29.5 €/m³
OSB - 21.85 €/m³
hout balk - 8.95 €/m³
green roof system - 3.13 €/m²
metal coating - 1.12 €/m²
steel column - 318.94€/m³
prefabricated concrete column - 38.2 €/m³
concrete core - 23.36 €/m³
partition wall - 15.2 €/m³
MDF door - 11.8 €/piece
prefabricated concrete beam - 38.3 €/m³
on site concrete poles - 33.9 €/m³
EPS Rc 6,5 - 32,54 €/m³
beton - 20.5 €/m³
anhydriet - 15.3 €/m³
electric boiler -171.7 €/piece
air handling unit - 3.67 €/piece
climate ceiling - 4.6 €/m²GBO
cooling coil - 2.2 €/m²GBO
heat pump - 0.26 €/m²GBO
foundations
walls
equipment
concrete - 20.5 €/m³
anhydrite - 15.3 €/m³
aluminum coating - 11623 €/m³
triple layer glass - 1070.1 €/m³
wooden frame - 12.2 €/m³
anhydrite - 15.3 €/m³
triple layer glass - 1070.1 €/m³
wooden beam - 8.95 €/m³
electric boiler - 171.7 €/piece
Assessing the environmental impact of building materials using the Dutch approach | Chevalerias | 2015
27
aluminium with a 2,7% share of the shadow cost of the facade compared to the 0,3% of the
wooden frame.
Roofs: As it is the case for the floors, the OSB forms a big part of the roofs’ shadow cost
(32%). Additionally, the EPS, which needs to be of a thermal resistance of 6.5 (m-K)/W to
ensure good energy performance of the building, represents 31% of the shadow cost of the
roofs. Despite its benefits, the system for the green roof also represents a notable 15% of the
roofs’ shadow cost. This score is believed to be due to the usual plastic components in the
drainage system, although, the description of this green roof in the MaterialenTool which is:
“green roof; drainage+filter+subtraat+sedum (excluding roofing)” does not specify which
kind of drainage system is implemented.
Foundations: The category “Foundation” in the MaterialenTool comprises the foundation
poles and the basement exterior and load bearing walls. The use of concrete for the
foundations and the basement creates 67% of the shadow cost. The concrete foundation poles
alone account for 34%, which is due to their high shadow cost per cubic meter as well as their
quantities which was estimated to 200 poles each 10-m long. Also, each of these concrete
components is reinforced with steel and the load bearing capacity of the concrete is mostly
given in the description. The EPS insulation, as it is the case for the roof, also has a significant
share of the shadow cost of the foundations (38%).
This detailed view of the shadow cost of the building allowed the design team to rapidly
identify which part of the building is worth focusing on to reduce the environmental impact
and, in certain cases which specific product contribute to a high shadow cost of the building.
In this study, the roofs, floors and walls are reconsidered altogether as the structure of the
building is studied while the effort to reduce the shadow cost of the installations is focused
on the climate ceiling elements only. If only one material is entered into the MaterialenTool,
it is possible to see the shadow cost of each product. However, little information is given (both
in the tool and on the website) about the product itself: the title of the product is the only
description. When the product card is related to a specific brand, it can be an option to check
the information via the manufacturer but this takes some additional research time. The
dimension of a product is entered by the user in the tool but in certain cases the dimension is
not the best unit to quantify the product. For the EPS insulation for example, the field reserved
for the thickness is used to enter the thermal resistance instead. However, this practice is not
clearly stated and was learnt by making the mistake of inserting the thickness of the insulation
layer and questioning an experienced user of the tool about the anomaly in the results for EPS.
The MaterialenTool also allows users to look at the building’s environmental performance by
environmental impact category with or without weighting. It is interesting to compare the
readability of the output before and after weighting as shown in Figure 13. Although the
environmental impacts are not easily read, it is appreciated that they are accessible. It is
regrettable however, that the share of each phase of the product life-cycle is not visible.
Assessing the environmental impact of building materials using the Dutch approach | Chevalerias | 2015
28
Figure 13 From environmental impact values (left) to shadow costs values (right) of the
preliminary design.
In the left graph, the environmental impact values are expressed in different units (kg per CO₂
eq, kg per SO₂ eq….) which prevents them from being compared to each other’s. Here, the
Marine Aquatic Eco-Toxicity Potential (MAETP) is so great that the others environmental
impact’s effects cannot be read. In the right graph however, the weighted values in euros are
comparable as they have the same units. According to this weighting, the building mainly
impacts the Human Toxicity Potential (HTP) and the Global Warming Potential (GWP) and
it would cost respectively 162 and 159 thousands euros in the virtual market for environmental
quality to compensate for it. Compensating for acidification damage would cost 63 thousand
euros and 23 thousands euros for the eutrophication damages. After weighting, the MAETP
is only the fifth most expensive impact category to compensate for with 13 thousands euros.
In conclusion, the shadow cost weighting not only allows for a comparison of different impact
categories but also gives an image of what these impacts represent.
4.2 Parametric study
Following the analysis of the environmental performance of the preliminary design, several
modifications were tested according to the challenges of the project.
4.2.1 Modification on basement and foundations
The high level of the water table in the park brought the question of the necessity of the
basement to the design team which investigated the possibilities of relocating the functions
158.72
0.35
162.35
1.59
12.93
1.33
4.59
63.48
22.50
0.01
2.78
0
15
30
45
60
75
90
105
120
135
150
165
GWP
ODP
HTP
FAETP
MAETP
TETP
POCP
AP
EP
ADPE
ADPF
Shadow cost / k€
0
20
40
60
80
100
120
140
GWP100/kgCO2eq.
ODP/kgCFC-11eq.
HTP/kg1.4-DBeq.
FAETP/kg1.4-DBeq.
MAETP/kg1.4-DBeq.
TETP/kg1.4-DBeq.
POCP/kgC2H4eq.
AP/kgSO2eq.
EP/kgPO4eq.
ADPE/kgSbeq
ADPF/kgSbeq
Millions
Environmental impact / unit
Assessing the environmental impact of building materials using the Dutch approach | Chevalerias | 2015
29
held by the basement. However, this solution was not as beneficial as expected in reducing
the shadow cost of the building.
When looking at absolute values in Figure 14, the foundations and basement of the
preliminary design (called VO case) represent a total shadow cost of 57000 euros. This
shadow cost can be reduced by 3.5 % by using prefabricated concrete foundation poles and
by 15.8% by using wooden poles instead of concrete poles poured on site. The wooden poles
include a concrete cap that protect the wood from being exposed to air due to a fluctuating
water level. Reducing the basement decreases the shadow cost of the foundation by 28% and
having no basement at all brings a reduction of 79,2% from the VO case. From this graph, it
can be deduced that, in the VO case, the foundations represents 16 000 euros of shadow cost
and the basement 41 000 euros. This difference is likely due to the high shadow cost of the
EPS insulation layer required for the basement which is otherwise applied to the ground floor.
Figure 14 Effects of parametric study on foundation’s total shadow cost.
However, the graph in Figure 14 presents the shadow cost in absolute value while the single
indicator used to express the shadow cost of the building’s materials is expressed relative to
its square meter of gross floor area, in €/m²BVO. This unit means that reducing the total BVO
increases the final total shadow cost of the building, as can be seen in Figure 15.
When the functions of the basement are relocated outside of the building, the definition of
what is included in the BVO of the building can be ambiguous and the decision rest with the
BREEAM assessor. To predict what could be the shadow cost of the building according to
the assessor’s decision, several scenarios are assessed. The different assessed scenarios are
presented in Figure 16 and the results in Figure 15.
57
55
48
41
16
0 10 20 30 40 50 60
VO case
Prefabricated poles
Wooden poles
Reduction basement
Removal basement
Shadow cost of the foundations / k€
Assessing the environmental impact of building materials using the Dutch approach | Chevalerias | 2015
30
Figure 15 Effects of different modification of foundation on the total shadow cost of the building.
VO-case: The base case corresponds to the preliminary design (VO) described in Section 3.1,
its shadow cost is analysed in Section 4.1
Case 1: In this case, the basement is reduced but the BVO remain the same, resulting in a
reduction of 0.03 €/m²BVO. The Air Handling Unit (AHU) is relocated to the roof top with a
very light wooden construction. This way, the surface is still counted in the BVO for a
minimum of material use, which does not increase the shadow cost of the roofs. The same
strategy is applied for the bike storage. A wooden shed is placed next to the building, keeping
to same total BVO for a minimum of added materials. Even though this shed would be next
to the building and not in the same envelope, it is assumed that this surface could be accepted
as being part of the BVO of the building.
Case 2: The basement is reduced as well as the total BVO resulting in an increase of 0.03
euros/m² BVO. The AHU is placed next to the building and is only enclosed by a simple fence
while the bikes are parked in an existing structure. In this case, the BREEAM Assessor could
argue that these surfaces are not part of the building BVO, which, on the whole, increases the
shadow cost per square meter BVO of the building. As a result, the decrease in shadow cost
brought by the reduction of the basement is smaller than the increase brought by the loss of
square meter BVO.
Case 3: The basement is completely removed and the BVO remains the same, resulting in a
decrease of 0.01 €/m²BVO. Even though the removal of the basement reduces the shadow
0.09
0.06 0.07
0.02 0.03
0.08 0.07
0.12
0.12
0.13
0.13
0.14
0.12 0.12
0.03
0.03
0.04
0.03
0.04
0.03 0.03
0.13
0.13
0.14
0.14
0.14
0.13 0.13
0.12
0.12
0.13
0.16
0.13 0.12 0.12
0.15
0.15
0.15
0.15 0.16 0.15 0.15
0.01
0.01
0.02
0.01
0.02
0.01 0.01
0
0.05
0.1
0.15
0.2
0.25
0.3
0.35
0.4
0.45
0.5
0.55
0.6
0.65
0.7
Shadow cost/ (€/m²BVO)
equipment
installation
roofs
floors
inside walls
facade
foundation
Assessing the environmental impact of building materials using the Dutch approach | Chevalerias | 2015
31
cost of the building by 0.07 €/m²BVO, the functions relocated on the ground floor increases
the roofs’, floors’ and facades’ surfaces and thus increases the shadow cost by a total of 0.06
€/m²BVO.
Case 4: The basement is completely removed, the other functions are relocated on the ground
floor without increasing its surface, resulting in an increase of 0.01 €/m²BVO. Although this
case is the one where the most material is eliminated, the fact that the BVO decreases as well
makes the effort of having a more compact building worthless in order to reduce the shadow
cost of the building.
Figure 16 Schematic sections of tested scenarios.
Prefabricated poles: The basement is kept untouched but the concrete foundation poles are
replaced by prefabricated concrete foundation poles resulting in a decrease of 0.01 €/m²BVO
Case 1 Case 2
Case 3 Case 4
Assessing the environmental impact of building materials using the Dutch approach | Chevalerias | 2015
32
Wooden poles: Again, the basement is kept untouched but the concrete foundation poles are
replaced this time by wooden foundation poles decreasing the total shadow cost by 0.02
€/m²BVO.
Reducing or removing the basement is a clear example to reveal the weakness of the
functional unit. Even though using shadow cost per m² allows users to compare building of
different sizes and encourage material efficiency per square meter, it does not encourage a
compact design and space efficiency on the scale of the building. This unit could actually
have the reverse effect of encouraging to build more basement only to increase the total BVO
for a minimum of materials used in order to reduce the environmental performance indicator
of the building.
Looking closer at the shadow cost of the foundation poles per m³ in Figure 17, it is noticed
that the wooden poles have a negative shadow cost, meaning that they have a positive impact
on the environment. This is most likely be due to the CO₂ storing capacity of wood combined
with the fact that little process is needed to transform a tree in a pole.
Figure 17 Shadow cost per m³ of different foundation poles.
Although it is not possible to access the data by life-cycle stage, looking at the shadow cost
per impact category in Figure 18 gives insight into the cause of this negative value. Indeed,
the negative shadow cost of the building is mainly due to the good impact on Global warming
Potential (GWP) which is expressed in CO₂ equivalent as well as Marine Aquatic Eco-
Toxicity Potential (MAETP).
33.93
28.39
-1.78
-5
0
5
10
15
20
25
30
35
concrete
poured on site
prefabricated
poles
wooden poles
Shadow cost/ (€/m³)
Assessing the environmental impact of building materials using the Dutch approach | Chevalerias | 2015
33
Figure 18 Shadow cost per impact category per m³ of different foundation poles.
The product card of the wooden foundation pole is in category 3, meaning that this result can
be doubted, especially if this negative value is abused by implementing too many foundation
poles to lower the total shadow cost of the building. The CO₂ storing capacity of the wood is
a delicate subject and there are different opinion about how to execute the LCA for wood
products. In his interview (see Appendix D), René Klaassen from the Foundation for Wood
Research (SHR) explained how this aspect of their first LCA on wood foundations piles was
corrected by the third party reviewer:
“Well, in the determination method, the wood is CO₂ neutral, which in
the case of the foundation pile is not the case since they really sink CO₂,
you can leave them in the ground for more than 100 years. So you remove
it from your 100 years cycle. It is actually a sink. And that is how you get
your advantage.”
A suggestion of the BREEAM Expert to account for this uncertainty is to count zero shadow
cost for the wooden foundation pole instead of a negative value.
4.2.2 Modification of structure
Based on the general idea that concrete has a high environmental impact and with a will to
integrate more wood in the building, different structural options are tested as shown in Figure
19. A schematic drawing of the tested structures is proposed in Figure 20.
VO case: The structure in VO case is a concrete core with concrete floors extended by
wooden floors and steel columns as suggested by the schematic section above. The ground
floor and basement are made out of concrete.
-15
-10
-5
0
5
10
15
20
25
30
35
40
concrete poured on site
pole
prefab. concrete pole wood pole
Shadow cost / (€/m³)
ADPF
ADPE
EP
AP
POCP
TETP
MAETP
FAETP
HTP
ODP
GWP100
Assessing the environmental impact of building materials using the Dutch approach | Chevalerias | 2015
34
Wooden ground floor: Changing the concrete ground floor to a wooden one decreases the
shadow cost of the floors by 0.02 €/m²BVO but the brick foundation wall necessary to support
it increases the shadow cost of the foundation by 0.01 €/m²BVO, resulting in a total decrease
of the shadow cost of the building by 0.01 €/m²BVO.
Traditional wooden construction: Changing the concrete core (walls and floors) and steel
columns for a wooden construction reduces the shadow cost by 0.02 €/m²BVO. According to
the recommendations of the structural engineer, some laminated wooden beams are
implemented in this design to keep a large free space within the core. The steel columns are
replaced by massive wooden columns of 320x320 millimetres minimum, instead of the
160x80 millimetres of the steel, to ensure fire resistance.
Tree like structure: With laminated wood construction the shadow cost of the building
increases by 0.03 €/m²BVO. The benefice from the laminated wood is the freedom of the
shape which is not possible with a more traditional massive wooden structure. This shape
consists of “T” shaped profiles with the vertical part of the “T” replacing the concrete wall of
the core. It had the big advantage of completely eliminating the columns along the facade,
and leaving the view completely interrupted. This original idea is inspired by trees, for which
branches derive from the stem.
Figure 19 Parametric study of the structure.
0.09 0.10 0.09 0.09
0.12 0.12 0.12 0.12
0.03 0.03 0.02
0.06
0.13 0.11 0.12
0.13
0.12 0.12 0.12
0.12
0.15 0.15 0.15
0.15
0.01 0.01 0.01
0.01
0
0.1
0.2
0.3
0.4
0.5
0.6
0.7
0.8
VO case wooden ground
floor
traditional
wooden
construction
tree like
structure
Shadow cost / (€/m²BVO)
equipment
installation
roofs
floors
inside walls
facade
foundation
Assessing the environmental impact of building materials using the Dutch approach | Chevalerias | 2015
35
Figure 20 Schematic sections of tested structures.
Looking closer at the shadow cost per m³ for different column’s material in Figure 21, the
steel clearly has the biggest negative impact on the environment while the massive wood has
the lowest. Between the concrete and the laminated wood however, the difference is not so
obvious, depending on the amount of steel used to reinforce the concrete. It should be noted
that the laminated wood, as many other material in the NMD is from Category 3 whereas the
concrete is from category 1 or 2 meaning that the LCA´s results have been verified by a third
party.
Figure 21 Shadow cost per m³ of different structural materials.
These results come from the amount of material used in each case. The steel column, even
though being used every 1.8-m along the facade of the VO case remains a hollow element
with a small amount of material while the concrete from the core is a massive element. When
using laminated wood for the structure, big elements are required in order to ensure its load
bearing capacity. Figure 22 presents the volume of steel and concrete needed in the VO case
compared to the volume of laminated wood necessary for the tree like structure.
318.00
38.22
23.36 30.36
8.91
0
50
100
150
200
250
300
350
steel column concrete column concrete wall laminated wood massif wood
shadow cost /(€/m³)
Assessing the environmental impact of building materials using the Dutch approach | Chevalerias | 2015
36
Figure 22 Volume of material for VO case and tree-like structure case.
.
It is interesting to look at the different environmental impact categories per cubic meter to
estimate the difference between wood, laminated wood and concrete in Figure 23.
Figure 23 Environmental impact of different materials for the columns.
From Figure 23 it can be assumed that the processes needed for manufacturing laminated
wood account for more GWP than the CO₂ storing capacity of the wood used in the product
since the GWP goes from -4 euros for the massive wood to 3 euros for the laminated wood.
The Human Toxicity Potential (HTP) of the laminated wood column is almost twice the value
of both the massive wood and the concrete column. This is assumed to be due to the VOC
and glue used in the laminated wood. The Acidification (AP) and Eutrophication potentials
(EP) are also higher in the laminated wood case than both the case of wooden or concrete
5.7
469.7
708.8
0
100
200
300
400
500
600
700
Volume /m³
steel concrete laminated wood
-10
-5
0
5
10
15
20
25
30
35
massive wood column laminated wood column concrete column
Shadow cost / (€/m³)
ADPF
ADPE
EP
AP
POCP
TETP
MAETP
FAETP
HTP
ODP
GWP100
Assessing the environmental impact of building materials using the Dutch approach | Chevalerias | 2015
37
column. According to the interpretation part of a German EPD for laminated wood
(Studiengemeinschaft Holzeimbau e.V., 2013) the heat generation on site causes 32% of the
AP while 33% of the emissions causing EP are due to wood firing on site. According to the
same source, the POCP which is the same in Figure 23 for the massive wood and the laminated
wood, is mainly caused by the drying of wood. It is important to note that in NMD all the
wooden product are classified in category 3 whereas only 6% of the concrete product cards
are in category 3.
4.2.3 Climate ceiling
As explained in Section 4.1, the installations have the largest impact on the shadow cost of
building and within these the climate ceilings have the largest impact. Simply removing these
elements is not an option since a required indoor climate quality should be kept, however,
only one kind of climate ceiling is available in the NMD.
Although the description of the default climate ceiling from the NMD is not very clear in its
composition, it is safe to assume that it is made out of copper tubes for the circulation of water
and a metal plate to radiate the heat or cold into the room since this represent the most standard
climate ceiling element to be found in the market.
A range of climate ceiling types exists in the market, however, none of them have been
included in the NMD yet. To get an idea of whether a different kind of climate ceiling would
be beneficial in reducing the shadow cost of the building, an estimation of the shadow cost
per square meter was made for this study. Figure 24 illustrates different types of climate
ceilings studied. MaterialenTool was used to obtain the shadow cost of different climate
ceilings by combining shadow costs of different materials together as shown in Figure 25.
The details of quantities of material were found using online specifications of products from
different manufacturers.
Figure 24 Different types of climate ceilings (from left to right) Standard, CC1, CC2, CC3.
Assessing the environmental impact of building materials using the Dutch approach | Chevalerias | 2015
38
Figure 25 Estimated shadow cost per m² of different climate ceiling.
Default NMD: The only climate ceiling available in the NMD and described as “steel plate +
pipe” has a shadow cost of 4.59 €/m².
Standard: A standard climate ceiling which is assumed to be the same kind as the default one
from the NMD is composed a copper tube and metal sheet. It also has acoustic advantages
with the perforation of the metal sheet. A shadow cost of 7.36 €/m² was estimated. This high
value is mainly due to the copper pipes. This price is 160% of the default value with which it
is represented in the NMD.
CC1: This product uses polyethylene instead of copper pipe and a plaster board which is
covered by an aluminium foil instead of a metal sheet. The small holes in its surface allows it
to act as an acoustic ceiling panel as well. It comes with a mineral wool insulation layer and
is mounted on steel fixations. Using a plaster panel reduces the shadow cost by 0.40 €/m²
compared to sheet metal. The big improvement is made by the polyethylene pipes which are
0.0
0.5
1.0
1.5
2.0
2.5
3.0
3.5
4.0
4.5
5.0
5.5
6.0
6.5
7.0
7.5
8.0
Default NMD Standard CC1 CC2 CC3
Shadow cost / (€/m²)
steel plate+
copper pipes
copper pipes
steel plate
steel fixation
mineral wool
insulation layer
MDF
plaster work /
plaster board
aluminium foil
polyethyleen or
PeRT pipes
4.59
7.36
1.65 1.58
1.76
Assessing the environmental impact of building materials using the Dutch approach | Chevalerias | 2015
39
60 times lower in shadow cost than copper pipes. The total shadow cost of this climate ceiling
is estimated to 1.65 €/m².
CC2: This product was studied because even though it does not include any acoustic features,
it has the advantages of being applicable to curved surfaces which may be useful for the tree-
like structure. The polyethylene tubes are highly flexible and once fixed to the ceiling, a layer
of plaster is applied on it. This very simple composition resulted in the lowest shadow cost of
1.58 €/m².
CC3: This innovative product resembles the comfort plafond model except that it replaces the
plaster panel by a MDF panel with acoustic features and the polyethylene pipes by PeRT
pipes. As with the comfort plafond model, it includes an aluminium foil, a mineral wool
insulation layer and metal fixations. The MDF cost 0.04 €/m² more than the plaster and the
PeRT cost 0.07 €/m² more than the polyethylene, resulting in a total shadow cost of 1.76€/m².
These estimations show that copper climate ceiling should be avoided to reduce the shadow
cost of the building. These results remain only estimations and conducting an LCA for each
of these products would be much more accurate than adding shadow cost of components.
However, according to the BREEAM.nl expert on the Triodos project, this way of estimating
shadow cost could be accepted by the BREEAM.NL assessor if clearly and thoroughly
documented. Nevertheless, if the reduction brought by this change is significant, the Assessor
might require a more detailed calculation by means of an LCA of the product (Bijleveld,
2015).
Indeed, the next option to include a more environmental friendly climate ceiling in the
calculation is to conduct an LCA according to the SBK method, to have it reviewed by a third
party and to include it in the NMD. This process can take a lot of time, which is why it is
important to first assess whether it is worth the effort, time and money.
The “plaster board” type of climate ceiling is selected because it has the lowest shadow cost
per square meter while being both a climate and acoustic ceiling. Figure 26 shows the effect
of changing the default climate ceiling for a combination of materials similar to the Comfort
Plafond on the total shadow cost of the building. The resulting reduction of 0.06 €/m² proves
that it is indeed relevant to implement a more environmental friendly climate ceiling in the
construction.
According to BREEAM.NL, one innovation point can be awarded in MAT1 for the
introduction of a product which is not already in the NMD and whose shadow cost is at least
0.05 €/m² lower than its alternative in the NMD. The Comfort Plafond is therefore a product
worth the effort of being put in the NMD.
Assessing the environmental impact of building materials using the Dutch approach | Chevalerias | 2015
40
Figure 26 Effect of changing the climate ceiling on the total shadow cost of the building.
4.2.4 Combining solutions
Different combinations of solutions are tested to decide which one has the lowest shadow cost
as can be seen in Figure 27. Combination A corresponds to the improved design that would
have been chosen intuitively while combination B is chosen by selecting all the strategies that
proved to be efficient in reducing the shadow cost of the building during the parametric study.
Combination A is the case where:
 The basement is removed by moving AHU to the roof, bike stand to a wooden shed
and other functions to the increased ground floor.
 The foundations is made of wooden poles.
 The ground floor has a wooden floor.
 The structure is tree-like made from laminated wood.
 The default climate ceiling is changed to CC1.
Combination B represents the case where:
 The basement is reduced by moving AHU to the roof and bike stand to a wooden
shed.
 The foundations is made of wooden poles.
0.09 0.09
0.12 0.12
0.03 0.03
0.13 0.11
0.12
0.12
0.15
0.09
0.01
0.01
0.00
0.05
0.10
0.15
0.20
0.25
0.30
0.35
0.40
0.45
0.50
0.55
0.60
0.65
0.70
VO case CC1
Shadow cost/ (€/m²BVO)
equipment
installation
roofs
floors
inside walls
facade
foundation
15-7-Marie web
15-7-Marie web
15-7-Marie web
15-7-Marie web
15-7-Marie web
15-7-Marie web
15-7-Marie web
15-7-Marie web
15-7-Marie web
15-7-Marie web
15-7-Marie web
15-7-Marie web
15-7-Marie web
15-7-Marie web
15-7-Marie web
15-7-Marie web
15-7-Marie web
15-7-Marie web
15-7-Marie web
15-7-Marie web
15-7-Marie web
15-7-Marie web
15-7-Marie web
15-7-Marie web
15-7-Marie web
15-7-Marie web
15-7-Marie web
15-7-Marie web
15-7-Marie web
15-7-Marie web
15-7-Marie web
15-7-Marie web
15-7-Marie web
15-7-Marie web
15-7-Marie web
15-7-Marie web
15-7-Marie web
15-7-Marie web
15-7-Marie web
15-7-Marie web
15-7-Marie web
15-7-Marie web
15-7-Marie web
15-7-Marie web
15-7-Marie web
15-7-Marie web

More Related Content

Similar to 15-7-Marie web

2017_07_25 Carlo Battisti
2017_07_25 Carlo Battisti2017_07_25 Carlo Battisti
2017_07_25 Carlo Battisti
RESTORE
 
Integrated project
Integrated projectIntegrated project
Integrated project
Sasi Cool
 
Sustainability and Green Engineering
Sustainability and Green EngineeringSustainability and Green Engineering
Sustainability and Green Engineering
Bernard Sustainable Consulting
 
Sustainability and green engineering
Sustainability and green engineeringSustainability and green engineering
Sustainability and green engineering
keroma07
 
Design Engineering-1 Report
Design Engineering-1 ReportDesign Engineering-1 Report
Design Engineering-1 Report
AshishBhadani4
 
Dissertation
DissertationDissertation
STRATEGIC ANALYSIS FOR A SUSTAINABLE TRAVELING EXHIBITION
STRATEGIC ANALYSIS FOR A SUSTAINABLE TRAVELING EXHIBITION STRATEGIC ANALYSIS FOR A SUSTAINABLE TRAVELING EXHIBITION
STRATEGIC ANALYSIS FOR A SUSTAINABLE TRAVELING EXHIBITION
designtango2013
 
C2 cn governance_dirk_part 1
C2 cn governance_dirk_part 1C2 cn governance_dirk_part 1
C2 cn governance_dirk_part 1
C2CNetwork
 
John Gertsakis at the 2014 Innovation Forum
John Gertsakis at the 2014 Innovation ForumJohn Gertsakis at the 2014 Innovation Forum
John Gertsakis at the 2014 Innovation Forum
Locus Research
 
Green Building Construction: Case study on Green Building
Green Building Construction: Case study on Green BuildingGreen Building Construction: Case study on Green Building
Green Building Construction: Case study on Green Building
KetulKhatri
 
Deep Retrofit: Enabling upskilling for professionals
Deep Retrofit: Enabling upskilling for professionals Deep Retrofit: Enabling upskilling for professionals
Deep Retrofit: Enabling upskilling for professionals
SustainableEnergyAut
 
LZ_MADesignPracticeThesis
LZ_MADesignPracticeThesisLZ_MADesignPracticeThesis
LZ_MADesignPracticeThesis
Lisa Zimmermann
 
Process Modeling with IDEF 0
Process Modeling with IDEF 0Process Modeling with IDEF 0
Process Modeling with IDEF 0
Mandar Trivedi
 
Han Brezet_Introduction To Sustainable Pss & Tools
Han Brezet_Introduction To Sustainable Pss & ToolsHan Brezet_Introduction To Sustainable Pss & Tools
Han Brezet_Introduction To Sustainable Pss & Tools
Carlo Vezzoli
 
2014 11 16 ABC PhD tutti i corsi
2014 11 16 ABC PhD tutti i corsi2014 11 16 ABC PhD tutti i corsi
2014 11 16 ABC PhD tutti i corsi
Enrico DeAngelis
 
2. GTC-K Introduction
2. GTC-K Introduction2. GTC-K Introduction
2. GTC-K Introduction
MaxCho
 
Green building challenges
Green building challengesGreen building challenges
Green building challenges
Awanish Shukla
 
NORWAY BREEM: INTRODUCTION AND CASE STUDY
NORWAY BREEM: INTRODUCTION AND CASE STUDYNORWAY BREEM: INTRODUCTION AND CASE STUDY
NORWAY BREEM: INTRODUCTION AND CASE STUDY
Anushka Bhargava
 
What are there behind the eco-labels?
What are there behind the eco-labels?What are there behind the eco-labels?
What are there behind the eco-labels?
Frank Gergaud
 
Ecobuild 2013 - Voluntary Building Standards: Why Bother?
Ecobuild 2013 - Voluntary Building Standards: Why Bother?Ecobuild 2013 - Voluntary Building Standards: Why Bother?
Ecobuild 2013 - Voluntary Building Standards: Why Bother?
The University of Nottingham
 

Similar to 15-7-Marie web (20)

2017_07_25 Carlo Battisti
2017_07_25 Carlo Battisti2017_07_25 Carlo Battisti
2017_07_25 Carlo Battisti
 
Integrated project
Integrated projectIntegrated project
Integrated project
 
Sustainability and Green Engineering
Sustainability and Green EngineeringSustainability and Green Engineering
Sustainability and Green Engineering
 
Sustainability and green engineering
Sustainability and green engineeringSustainability and green engineering
Sustainability and green engineering
 
Design Engineering-1 Report
Design Engineering-1 ReportDesign Engineering-1 Report
Design Engineering-1 Report
 
Dissertation
DissertationDissertation
Dissertation
 
STRATEGIC ANALYSIS FOR A SUSTAINABLE TRAVELING EXHIBITION
STRATEGIC ANALYSIS FOR A SUSTAINABLE TRAVELING EXHIBITION STRATEGIC ANALYSIS FOR A SUSTAINABLE TRAVELING EXHIBITION
STRATEGIC ANALYSIS FOR A SUSTAINABLE TRAVELING EXHIBITION
 
C2 cn governance_dirk_part 1
C2 cn governance_dirk_part 1C2 cn governance_dirk_part 1
C2 cn governance_dirk_part 1
 
John Gertsakis at the 2014 Innovation Forum
John Gertsakis at the 2014 Innovation ForumJohn Gertsakis at the 2014 Innovation Forum
John Gertsakis at the 2014 Innovation Forum
 
Green Building Construction: Case study on Green Building
Green Building Construction: Case study on Green BuildingGreen Building Construction: Case study on Green Building
Green Building Construction: Case study on Green Building
 
Deep Retrofit: Enabling upskilling for professionals
Deep Retrofit: Enabling upskilling for professionals Deep Retrofit: Enabling upskilling for professionals
Deep Retrofit: Enabling upskilling for professionals
 
LZ_MADesignPracticeThesis
LZ_MADesignPracticeThesisLZ_MADesignPracticeThesis
LZ_MADesignPracticeThesis
 
Process Modeling with IDEF 0
Process Modeling with IDEF 0Process Modeling with IDEF 0
Process Modeling with IDEF 0
 
Han Brezet_Introduction To Sustainable Pss & Tools
Han Brezet_Introduction To Sustainable Pss & ToolsHan Brezet_Introduction To Sustainable Pss & Tools
Han Brezet_Introduction To Sustainable Pss & Tools
 
2014 11 16 ABC PhD tutti i corsi
2014 11 16 ABC PhD tutti i corsi2014 11 16 ABC PhD tutti i corsi
2014 11 16 ABC PhD tutti i corsi
 
2. GTC-K Introduction
2. GTC-K Introduction2. GTC-K Introduction
2. GTC-K Introduction
 
Green building challenges
Green building challengesGreen building challenges
Green building challenges
 
NORWAY BREEM: INTRODUCTION AND CASE STUDY
NORWAY BREEM: INTRODUCTION AND CASE STUDYNORWAY BREEM: INTRODUCTION AND CASE STUDY
NORWAY BREEM: INTRODUCTION AND CASE STUDY
 
What are there behind the eco-labels?
What are there behind the eco-labels?What are there behind the eco-labels?
What are there behind the eco-labels?
 
Ecobuild 2013 - Voluntary Building Standards: Why Bother?
Ecobuild 2013 - Voluntary Building Standards: Why Bother?Ecobuild 2013 - Voluntary Building Standards: Why Bother?
Ecobuild 2013 - Voluntary Building Standards: Why Bother?
 

15-7-Marie web

  • 1. ASSESSING ENVIRONMENTAL IMPACT OF BUILDING MATERIALS USING THE DUTCH APPROACH The case of the Triodos bank office building using BREEAM.NL Marie Chevalerias Master Thesis in Energy-efficient and Environmental Buildings Faculty of Engineering | Lund University
  • 2. Assessing the environmental impact of building materials using the Dutch approach | Chevalerias | 2015 I Abstract With the increasing importance accorded to environmental performance of buildings, the goal of this master thesis is to study the Dutch assessment method for evaluating the environmental impact caused by the material of an office building project with the Dutch version of the BREEAM certification scheme. After doing a literature review to comprehend the current state of affair concerning the assessment method for environmental impact of building material in the Netherlands, the MaterialenTool using the National MilieuDatabase was used to assess different scenarios aiming to reduce the total shadow cost of the building. Along the study, different actors and users of the Dutch method were interviewed on their expertise and opinions. In this specific case, the shadow cost of the building was reduced by 25% in total. Reducing the basement was better than removing it completely, a massive wood construction was preferred over a laminated wood structure to replace the concrete elements of the building, the potential of introducing a new type of climate ceiling in the database was demonstrated and the importance of having reviewed data was shown by changing the type of expanded polystyrene. The Dutch environmental impact assessment method revealed itself to be a valuable tool for the design team although important limitations were revealed, the main one being the incompleteness of the product database. Keywords: environmental impact, LCA, shadow cost, building materials, BREEAM.NL, office building, National MilieuDatabase.
  • 3. Assessing the environmental impact of building materials using the Dutch approach | Chevalerias | 2015 II Preface This study is performed as a degree project within the master programme Energy-efficient and Environmental Building Design from Lund University (Sweden) as well as part of an internship at the architectural firm RAU Architects located in Amsterdam (The Netherlands). During my bachelor in Architecture and my master in Building Sciences, I have developed a technical approach of the design process and I am very thankful that RAU Architects has allowed me to find a role to play in one of their many sustainable projects. I would like to thank Willem Wijnbergen for accepting to meet with me in the first place and making my internship as pleasant as possible. I want to thank all the employees of RAU architects for welcoming me in the company and especially Marijn Emanuel and Dennis Grootenboer for their support and supervision of my work. I am very grateful to Martin Bijleveld from DGMR, René Klaassen from SHR and Rick Scholtes from NIBE for accepting to be interviewed and for sharing their experiences with me. A special thanks to the Triodos bank for setting an example for a more sustainable world and for allowing me to take their project as a study case, promoting the spread of knowledge about the best practice for sustainable design. I also want to greatly thank Evian Elzinga whose thesis and lectures made me particularly interested in the field of LCA and the importance of environmental impact aside from energy- efficiency. I would like to thank Saqib Javed, my supervisor, for his clear feedbacks and support all along my thesis work, and Dennis Johansson, my examiner, for his detailed correction. Finally, I want to express my gratitude to the Hans Eliasson Foundation for supporting our Master Programme. Amsterdam, June 2015 Marie Chevalerias
  • 4. Assessing the environmental impact of building materials using the Dutch approach | Chevalerias | 2015 III Table of content Abstract .................................................................................................................................I Preface..................................................................................................................................II Table of content.................................................................................................................. III Terminology........................................................................................................................ V Terms and definitions........................................................................................................VII 1 Introduction.................................................................................................................. 1 1.1 Background 1 1.2 Motivation 1 1.3 Aim and verifiable goals 1 1.4 Scope 2 2 Literature review.......................................................................................................... 3 2.1 Certification schemes 3 2.1.1 BREEAM.NL 3 2.1.2 MAT1 4 2.2 Dutch context, method, database and tools. 5 2.2.1 SBK method 6 2.2.2 LCA according to the SBK method 6 2.2.3 National Milieu Database (NMD) 9 2.2.4 Other tools 10 2.3 Shadow cost as weighting method 10 2.3.1 What is weighting? 11 2.3.2 What is the meaning of shadow cost? 12 2.4 Other labels and certifications used in the Netherlands 13 2.4.1 NIBE´s Environmental Classification: 14 2.4.2 DUBOkeur® : 15 2.4.3 C2C® (or cradle-to-cradle® ): 16 2.5 Research conducted with the Dutch method 16 3 Method ....................................................................................................................... 19 3.1 Description of study case 19 3.2 Practical requirements of the project 22 3.3 Parametric Study 23 3.4 Interviews 23 4 Results........................................................................................................................ 25 4.1 Analysis of preliminary design 25 4.2 Parametric study 28 4.2.1 Modification on basement and foundations 28 4.2.2 Modification of structure 33 4.2.3 Climate ceiling 37 4.2.4 Combining solutions 40 4.3 Other strategies 42 4.3.1 C2C® and DUBOkeur® products. 42 4.3.2 Reclaimed materials 43 5 Interviews................................................................................................................... 45 6 Discussion and Conclusions....................................................................................... 49 6.1 Discussion 49 6.2 Conclusions 50
  • 5. Assessing the environmental impact of building materials using the Dutch approach | Chevalerias | 2015 IV References .......................................................................................................................... 53 Appendix A Material scope for MAT1.......................................................................A - 1 Appendix B Inventory of materials of preliminary design (in Dutch)...................... B - 1 Appendix C Plans of study case.................................................................................. C - 1 Appendix D Interviews (Unedited).............................................................................D - 1 Interview with René Klassen at SHR. D - 1 Interview with Rick Scholtes at NIBE. D - 8 Interview with Martin Bijleveld at DGMR. D - 11 Interview with Dennis Grootenboer at RAU Architects. D - 17
  • 6. Assessing the environmental impact of building materials using the Dutch approach | Chevalerias | 2015 V Terminology AHU: Air Handling Unit BREEAM: Building Research Establishment Environmental Assessment Methodology BREEAM.NL: Building Research Establishment Environmental Assessment Methodology for the Netherlands BVO: Bruto-VloerOppervlak (Gross Floor Area) C2C: Cradle-to-cradle DGBC: Dutch Green Building Council DGMR: Consultant engineering office EPD: Environmental Product Declaration EPS: Expanded Polystyrene Styrofoam LCA: Life Cycle Assessment MAT1: section 1 of the material part of BREEAM.NL MPR: Bepaling van de milieuprestaties van gebouwen en gww-werken (Determination method of the environmental performance of buildings and civil engineering works) NIBE: Nederlands Instituut voor Bouwbiologie and Ecologie (Dutch Institute for Building biology and Ecology.) NMD: National MilieuDatabase (Dutch Environmental Database) OSB: Oriented Strand Board PCR: Product Category Rules SBR: Stichting Bouw Research (Foundation for Building Research) SBK: Stichting Bouw Kwaliteit (Foundation for Building Quality) SHR: Stichting Hout Research (Foundation for Timber Research) TNO: Nederlandse Organisatie voor Toegepast Natuurwetenschappelijk Onderzoek (Netherlands Organization for Applied Scientific Research) TIC: Technische Inhoudelijke Commissie (Technical Content Commission)
  • 7. Assessing the environmental impact of building materials using the Dutch approach | Chevalerias | 2015 VI VLCA: Vereniging voor LCA's in de bouw (Association for LCA in construction) VO: Voorlopig Ontwerp (Preliminary Design) Environmental Impact Categories: ADPE: Abiotic Depletion Potential for Non-fossils resources, expressed in kg Sb equivalent. ADPF: Abiotic Depletion Potential for Fossils resources, expressed in kg Sb equivalent. AP: Acidification Potential, expressed in kg SO₂ equivalent. EP: Eutrophication Potential, expressed in kg PO₄ equivalent. FAETP: Fresh water Aquatic Eco-Toxicity Potential, expressed in kg 1,4-DB equivalent. GWP100: Global Warming Potential for time horizon 100 years, expressed in kg CO₂ equivalent. HTP: Human Toxicity Potential, expressed in kg 1,4-DB equivalent. MAETP: Marine Aquatic Eco-Toxicity Potential, expressed in kg 1,4-DB equivalent. ODP: Ozone Depletion Potential expressed in kg CFC-11 equivalent. POCP: Photochemical Oxidant Creation Potential, expressed in kg C₂H₂ equivalent. TETP: Terrestrial Eco-Toxicity Potential, expressed in kg 1,4-DB equivalent.
  • 8. Assessing the environmental impact of building materials using the Dutch approach | Chevalerias | 2015 VII Terms and definitions Product Category Rules (PCR): Common harmonized calculation rules for the creation of EPDs specific to a group of products. (Environdec, n.d.) Shadow cost: Monetary value of something that does not have a market. In this study, the shadow represent the cost that society is willing to pay to ensure environmental quality. Re-use: Use of a product a second time after reclaiming it from the waste stream after its first life-cycle and using it without any major transformation. LCA: Assessment method to quantify the environmental impact caused by a product over its whole lifetime. Solver: Term designating to a mathematic software or computer program that solves a mathematical problem. Environmental Impact: Adverse effects caused by substances used or released to the environment from a project or a process. Different categories of impacts are used to define and quantify the impact caused to the environment. The following categories and their definitions are retrieved from the Handbook on Life Cycle Assessment (Guinée, et al., 2002) Abiotic Depletion: “Abiotic resources are natural resources (including energy resources) such as iron ore, crude oil and wind energy, which are regarded as non-living. Abiotic resource depletion is one of the most frequently discussed impact categories and there is consequently a wide variety of methods available for characterising contributions to this category.” Acidification: “Acidifying pollutants have a wide variety of impacts on soil, groundwater, surface waters, biological organisms, ecosystems and materials (buildings). Examples include fish mortality in Scandinavian lakes, forest decline and the crumbling of building materials. The major acidifying pollutants are SO₂, NOx and NHx.” Eutrophication: “Eutrophication covers all potential impacts of excessively high environmental levels of macronutrients, the most important of which are nitrogen (N) and phosphorus (P). Nutrient enrichment may cause an undesirable shift in species composition and elevated biomass production in both aquatic and terrestrial ecosystems. In addition, high nutrient concentrations may also render surface waters unacceptable as a source of drinking water.” Terrestrial, Fresh water and Marine Aquatic Eco-Toxicity: “This impact category covers the impacts of toxic substances on aquatic, terrestrial and sediment ecosystems.” Global Warming: “Climate change is defined as the impact of human emissions on the radiative forcing (i.e. heat radiation absorption) of the atmosphere. This may in turn have adverse impacts on ecosystem health, human health and material welfare. Most of these
  • 9. Assessing the environmental impact of building materials using the Dutch approach | Chevalerias | 2015 VIII emissions enhance radiative forcing, causing the temperature at the earth’s surface to rise. This is popularly referred to as the greenhouse effect.” Human Toxicity: “This impact category covers the impacts on human health of toxic substances present in the environment. The health risks of exposure in the workplace are also sometimes included in LCA. These latter risks are often included in a wider impact category encompassing more than exposure to toxic substances (e.g. accidents at work).” Ozone Depletion: “Stratospheric ozone depletion refers to the thinning of the stratospheric ozone layer as a result of anthropogenic emissions. This causes a greater fraction of solar UV-B radiation to reach the earth’s surface, with potentially harmful impacts on human health, animal health, terrestrial and aquatic ecosystems, biochemical cycles and materials.” Photochemical Oxidant Creation: “Photo-oxidant formation is the formation of reactive chemical compounds such as ozone by the action of sunlight on certain primary air pollutants. These reactive compounds may be injurious to human health and ecosystems and may also damage crops. …Photo-oxidants may be formed in the troposphere under the influence of ultraviolet light, through photochemical oxidation of Volatile Organic Compounds (VOCs) and carbon monoxide (CO) in the presence of nitrogen oxides (NOx). Ozone is considered the most important of these oxidising compounds, along with peroxyacetylnitrate (PAN). Photo-oxidant formation, also known as summer smog, Los Angeles smog or secondary air pollution, contrasts with winter smog, or London smog, which is characterised by high levels of inorganic compounds, mainly particles, carbon monoxide and sulphur compounds. This latter type of smog causes bronchial irritation, coughing, etc. Winter smog, as far as considered in this Guide, is part of human toxicity.” Land use: “This subcategory of land use impacts is concerned with the loss of land as a resource, in the sense of being temporarily unavailable.”
  • 10. Assessing the environmental impact of building material using the Dutch method | Chevalerias | 2015 1 1 Introduction 1.1 Background As the building sector is making more efforts to reduce the energy consumption of building during their use phase, the importance of reducing the environmental impact of the building throughout its whole lifespan has increased. This has become especially important since the accomplishment of energy-efficient buildings often requires the use of more material, especially for insulation and installations (SBK, 2011). In 2010, material use represented 70% of the climate impact caused by the Dutch construction industry (Bijleveld, et al., 2014). Although Life-Cycle Assessment (LCA) is used to determine the environmental performance of buildings since 1990 (Fava, 2006), it is still a difficult tool to use due to the complexity of the building as a product and the difficulty to predict its lifespan and the changes it may undergo (Khasreen, et al., 2009). Also, completing an LCA is a long and fastidious process, which may be difficult to include in the time accorded to the design process. Besides, the results are not always easy to interpret nor easy to compare to each other if the different LCAs were not conducted in the exact same way. This study focuses on understanding how the Netherlands is trying to solve these problems by setting up a common method (the SBK method), a harmonized national environmental database of building products (the National MilieuDatabase, NMD) and various certified tools enabling to use of this database in the context of the new Dutch regulation (the Building Act of 2012) and the Dutch version of the Building Research Establishment Environmental Assessment Method (BREEAM.NL). 1.2 Motivation The main motivation of this study is to examine how the environmental impact of a building is assessed in the Netherlands, to better comprehend the underlying theory as well as to understand the practical and theoretical challenges of its application to the design process of a building. The case of the Netherlands was chosen because it seems to develop an original method compared to its European neighbours which could be seen as an example to follow. The underlying intention of this report is to evaluate how this method helps the design team to create a building which has the best environmental performance possible. As well as at determining what the advantages and limitations of this method are and which lessons can be learned from the Dutch example. 1.3 Aim and verifiable goals The Dutch method is used on an office building project being designed by RAU Architects at the time of this thesis. The goal is to create a building with the lowest shadow cost possible by applying strategies from the design team. The shadow cost of a building is a weighted single indicator expressed in euros, representing the virtual cost of environmental quality. This price is constructed since it is does not exist in the actual market and allows users to compare different products (De Bruyn, et al., 2010).
  • 11. Assessing the environmental impact of building materials using the Dutch approach | Chevalerias | 2015 2 The following questions are examined:  What is the effect of the design team’s strategies on reducing the shadow cost of the building according to the Dutch method?  What are the pros and cons of the Dutch method for the design team? 1.4 Scope The study will focus on the specific case of the Triodos bank office building, which is not a standard office since the intention is to test the limits of the Dutch method. Modifications to the building are, however, limited by the level of flexibility of the project, which is at the end of the preliminary design stage. This project depicts an open plan office of around 13,000 m² placed in a park and next to the train station of Driebergen-Zeist in the Utrecht region (The Netherlands). Accordingly, the study focusses on the Dutch version of BREEAM for new office buildings: BREEAM.NL.
  • 12. Assessing the environmental impact of building materials using the Dutch approach | Chevalerias | 2015 3 2 Literature review 2.1 Certification schemes A certification scheme is a voluntary assessment that is controlled by the certification provider. Certification schemes usually use a higher benchmark than the country’s current regulation in order to encourage progress towards best practice. It allows for recognition of certified buildings in the market and eventually to compare them to each other thanks to a grading system. The certification scheme can also be seen as a guideline to ensure that all objectives are met (BRE, 2015). 2.1.1 BREEAM.NL The Building Research Establishment Environmental Assessment Methodology (BREEAM) is a certification scheme developed in the UK by the Building Research Establishment (BRE). BREEAM aims to measure and certify sustainable value in the built environment according to a large number of precise criterions based on a set of 5 principles:  Delivering sustainable solutions.  Providing a framework.  Based on sound science.  Able to support the process of change.  Delivering value to the occupant of the building. The grading system is composed of 9 categories: Management, Health and Comfort, Energy, Transport, Water, Material, Waste, Land use and Ecology and Pollution (BREEAM, 2010). Each category has a different weight in the total score as shown in Figure 1. Figure 1 Weight of the different category on the total score of the building. Once weighted, the scores are added to each other with eventual additional innovation credits. The resulting total score is evaluated according to a rating with the thresholds presented in Table 1. Water 6% Waste 7.5% Transport 8% Pollution 10% Land Use and Ecology 10% Management 12% Materials 12.5% Health and Comfort 15% Energy 19%
  • 13. Assessing the environmental impact of building materials using the Dutch approach | Chevalerias | 2015 4 Table 1 Rating system in BREEAM.NL. Score Rating ≥30% PASS ≥45% GOOD ≥55% VERY GOOD ≥70% EXCELLENT ≥85% OUTSTANDING Originally developed for the British context, the BRE created an International and European version of BREEAM. However in several countries like Sweden, Spain, Norway and Germany, National Scheme Operators (NSO) in cooperation with BRE developed their own national BREEAM. This is also the case in the Netherlands with BREEAM.NL under the initiative of the Dutch Green Building Council (DGBC). One specific aspect of BREEAM.NL is the section MAT1 which is developed according to Dutch method and tools. The Dutch calculation is also more complete since it includes more building components than the UK version of BREEAM (Schmidt, 2012). 2.1.2 MAT1 Mat 1 is a credit of the section Material of BREEAM.NL. It comes with specific validated calculation tools such as the “MaterialenTool”, which uses the National MilieuDatabase (NMD) further explained in Section 2.2.3. This study has also used the MaterialenTool The requirement for this section has a significant impact on the design. Table 2 presents the requirements to score points in MAT1. A maximum of 8 points can be awarded for this credit. One additional innovation point can be awarded if a new material, not in the database, is proposed and is proven to reduce the shadow cost of the building by at least 0,05 euro/m². Table 2 Scale of available points in MAT1 from BREEAM.NL. 1 point At least three material options are considered that have a significant impact on the shadow price of the building (at least 5% reduction in total). 2 points The environmental impact of the materials used is below the reference value. 3 points The environmental impact of the materials used is at least 10% below the reference value. 4 points The environmental impact of the materials used is at least 20% below the reference value. 5 points The environmental impact of the materials used is at least 30% below the reference value. 6 points The environmental impact of the materials used is at least 40% below the reference value. 7 points The environmental impact of the materials used is at least 50% below the reference value. 8 points The environmental impact of the materials used is at least 60% below the reference value. The shadow cost of a building is a weighted price that expresses the environmental impact of the building in one single indicator. This indicator represents the cost that society should be
  • 14. Assessing the environmental impact of building materials using the Dutch approach | Chevalerias | 2015 5 willing to pay to counter the impacts on the environment to a sustainable level. A more detailed explanation of shadow cost can be found in Section 2.3.2. The lifetime expectancy of a utility building is set at 50 years. The materials of foundation, basement, walls, roofs, floors, interior walls (including finishing of the components) and facilities of the building are taken into the scope of the credits. The interior falls outside the scope, a detailed list of the materials scope can be found in Appendix A. The current reference value for the BREEAM.NL 2014 is 1 €/m² of Bruto-VloerOppervlak (BVO)(Gross Floor Area)1 and represents the shadow cost of a standard building without significantly sustainable materials (DGBC, 2015). The documentation does not precise what exactly these reference building looks like nor how it is determined. According to BREEAM.NL expert Martin Bijleveld, it is probably an average of about 10 different buildings (Bijleveld, 2015). A more precise answer was given by the helpdesk of BREEAM.NL which stated: “The original ‘referentiewaarde’ (reference value) is determined by calculating a small set of “standard”, current building practice, buildings. Combined with some expert judgement from LCA specialists. We recently adjusted the ‘referentiewaarde’ by analysing the certified BREEAM-NL building in recent years and the different databases used for calculation of the shadow cost. Again, expert judgement was used to determine the right ‘referentiewaarde’.” (van Noort, 2015) 2.2 Dutch context, method, database and tools. With the prerequisite that a building should not endanger its users or the environment, the Building Act 2012 states that every new building with a surface area greater than 100 m² should provide an environmental performance declaration when applying for a building permit (Ton, et al., 2015). This decree from the Dutch Building Regulation is in force since January 2013 (Rijksoverheid, n.d.). So far, quantifying the environmental performance of the building is enough and no limit value is given yet but it is expected in the coming years. In BREEAM.NL this limit value is set at 1euro/m²BVO (Dutch Green Building Council, 2014). In order to ensure comparable results and clarity in the assessment, the Dutch government is recognizing a national method, a harmonized database and several tools which are used both for the national building regulation and BREEAM.NL. Consequently, every assessment in the Netherlands is made with the same assumptions and data (SBRCURnet-Cindy Vissering, 2015). 1 Since the way of measuring the Gross Floor Area of a building can be different around the world and was here calculated according to the Dutch standard NEN 2580, the GFA will be referred to as BVO in this report.
  • 15. Assessing the environmental impact of building materials using the Dutch approach | Chevalerias | 2015 6 2.2.1 SBK method The national method is the “Bepaling van de milieuprestatie van gebouwen en GWW- werken” (Determination method for the environmental performance of building and civil engineer work). This document was made by Stichting for Bouw Kwaliteit (SBK), and is therefore referred to as the “SBK method” in this report. The SBK method sets Product Category Rules (PCR) for the creation of product cards inserted into the National MilieuDatabase (NMD), it also sets the rules for the solver of the tools using the NMD, see Figure 2. A product card is like an Environmental Product Declarations (EPDs) which is a standardized way to present the LCA results of a product, but is not called EPD since it also follows the requirements of the SBK method. Figure 2 Interaction of method, tool and database to determine the environmental performance of the building (SBK, 2014). In other words, the SBK method defines how to conduct the Life-Cycle Assessment (LCA) of every building product constituting the NMD. This database of product cards is then used in a tool complying with the SBK method to determine the environmental performance of the building. The SBK method is based on the European Standard EN 15804 which has been developed for EPDs. The EN 15804 is itself based on a number of international LCA standards:  ISO 14025:2010: Environmental labels and declarations – Type III environmental declarations – principles and procedures.  ISO 14044:2006: Environmental management – Life cycle assessment – requirements and guidelines.  EN 15978:2011: Sustainability of construction works - Assessment of environmental performance of buildings - Calculation method. The SBK method differs from the EN15804 by important additions and deviations made to fit the Dutch context. Some of these modifications are noted in the following section. 2.2.2 LCA according to the SBK method In this section the steps to effectuate an LCA are presented with a focus on how these steps are altered by the SBK method to fit the Dutch context. Therefore, it provides a presentation SBK method: Product Category Rules Process database EPD NMD product card NMD Basic profile Use of a validated tool Environmental performance result: Total shadow cost of the building SBK method SBK method
  • 16. Assessing the environmental impact of building materials using the Dutch approach | Chevalerias | 2015 7 of the main differences between an international EPD and a Dutch product card found in the NMD. LCA is a technique to assess the environmental impact caused by a product. It is carried out in 4 steps: 1) Goal and scope definition. 2) Inventory Analysis. 3) Impact Assessment. 4) Interpretation. Although conducted in this order, each decision could influence the other steps, as shown in Figure 3. Figure 3 LCA process (Rebitzer, et al., 2004). 1) Goal and scope definition. The goal and scope definition states how and to whom the results of an LCA are to be communicated. In this case, the main target group is LCA experts who want to add a product card to the NMD (see Section 2.2.3). It also defines the following.  Functional unit: It is critical to later allow analysis and comparison. According to the LCA handbook (Joint Research Center, 2010), it should clearly describe the product (what?), its magnitude (how much?), its performance (how well?) and its duration (for how long?). The single example for a product given in the SBK Method is: “An inclined plane with a minimum angle of 20 degree which meets the requirement of the Dutch Building Regulations having a functional life of 75 years and expressed in m².” (SBK, 2014). It is worthy to note that this example does not seems to comply with the definition stated above since it does not give from which material this inclined plane is made from. Also, if the producer does not give substantial proof of his product lifespan, it will be determined according to the document "levensduur van bouwmaterialen” (lifespan of building materials) from Stichting Bouw Research (SBR).  System boundaries: It defines which stages of the life-cycle are included in the assessment. An EPD is often only from cradle-to-gate (i.e. Production Stage A1, A2 and A3, see Figure 4) while the product card of the NMD aims for cradle-to- grave corresponding to the whole life-cycle of the product as can be seen in Goal and Scope Definition Inventory Analysis Impact Assessment Interpretation
  • 17. Assessing the environmental impact of building materials using the Dutch approach | Chevalerias | 2015 8 Figure 4. The stages written in light grey and underlined are not included in the system boundary according to the SBK method. Figure 4 Life-Cycle stages of building products (SBK, 2014).  Assumptions and limitations: A number of processes are given a standard value corresponding to the Dutch context to avoid unjustified differences in the calculation due to assumptions. In Figure 4, the stages requiring the use of these basic profiles are framed with a dashed red line.  Allocations methods: The allocation procedures for reuse and recycling are given in the SBK method. The system boundaries are established for use and release of secondary materials through economic cut-off (SBK, 2014).  Impact categories: The chosen categories can be seen in Table 5. These impact categories are not the only consequences of the building on the environment. They are the ones selected because they are considered to be the most relevant. Eco- Toxicity has been added after a study from TNO (van Harmelen, et al., 2004), whereas the addition of Land-Use is now under discussion.  Compared to an international EPD, the indicators on Human and Eco-Toxicity are added to satisfy the Dutch conditions. The main reason for this addition is the will to encourage environmental improvements such as the use of “air scrubbers” to improve air quality which are ignored otherwise (SBRCURnet-Cindy Vissering, 2015). 2) Inventory Analysis. The Life-Cycle inventory analysis makes a list of all type and quantity of incoming and outgoing flows. With the SBK method, reference is made to a specific LCA database for Production Stage A1 A2 A3 Construction Stage A4 A5 Extractionofrawmaterial Transport Production Trasnport ConstructionandInstallation Procces Use Stage B1 B2 B3 B4 B5 Use Maintenance Repair Replacement Refurbishment B7 Operational water use B6 Operational energy use End of life Stage C1 C2 C3 C4 Deconstruction/Demollition Transport Wasteprocessing Disposal Beyond Life cycle D D Re-use,Recovery,Recycling potential
  • 18. Assessing the environmental impact of building materials using the Dutch approach | Chevalerias | 2015 9 raw materials and basic processes (SBRCURnet-Cindy Vissering, 2015). A broad consensus in the Netherlands made SimaPro in combination with the Swiss EcoInvent database, the main tool to execute LCAs. 3) Impact Assessment. This step corresponds to translation of different compounds from inventory analysis into impact categories or a single value indicator. The weighting system is illustrated later in Figure 5. Although weighting is considered a subjective way to create a single indicator, the members that established the SBK method agreed to use of the monetization method which translates different impact categories into a shadow price in euros. 4) Interpretation. In this step the results are used to make decisions, which are mostly made by comparing two or more cases. In our case, the single indicator, the shadow cost of the product, is entered into the NMD to later constitute the shadow cost of the building. 2.2.3 National Milieu Database (NMD) SBK is the owner and manager of the NMD, the data inside the NMD however, comes from different sources and is not always owned by SBK. Only when owned by SBK, the product cards are accessible to the public from the online database2 . The NMD consists of different databases: one for the basic profile that are used by LCA expert when creating a product card and one containing the product cards that are visible online and in the tools. The product cards are sorted into three categories, see Table 3. Table 3 Categories in the NMD. Category 1 Category 2 Category 3 Source LCA from single manufacturer/ producer/supplier. Branded product. LCA from group of manufacturers or branch association. Unbranded product. Unbranded data from industry/manufacturer/ producer/supplier/client 3rd party verified according to the SBK assessment protocol Yes Yes No The data from category 3 is mostly incomplete or expired data which are kept in the NMD due to lack of better data. These, therefore, get a penalty of +30% to account for uncertainties. This factor is applied by SBK as a precaution since experience has shown that unverified results tend to present a low environmental impact due to missing data in the inventory (Schuurmans, 2014). For a number of products, such as laminated wood, this factor is probably underestimated (Klaassen, 2015). 2 To consult this database, go to: https://www.milieudatabase.nl/viewNMD/
  • 19. Assessing the environmental impact of building materials using the Dutch approach | Chevalerias | 2015 10 Two committees were formed by SBK in 2010 to manage the NMD:  The MBG: “Milieuprestatiecommissie Bouw en GWW” (Environmental performance committee for Building and Civil Engeneering Work) is in charge of the policy development: defining project plans, fixing deadlines for the new updates of the NMD, advising SBK on communication, etc.  The TIC “Technische Inhoudelijke Commissie” (Technical Content Commission) is responsible for the substantive technical aspect of the NMD which goes from elaborating the method and adjusting the product cards to supporting SBK with the helpdesk (SBK, 2011). 2.2.4 Other tools The TIC mentioned above is also in charge of certifying tools that use the NMD and the SBK method. Thanks to this certification, each consultant company can continue to develop and use their own software while being in compliance with the SBK method. The different tools presented in Table 4 are the most employed (van der Klauw & van Zeijl, 2014) and can be used in compliance with both the Building Act 2012 and BREEAM.NL. Table 4 Tools to calculate environmental performance of a building. Name of the tool Developer Accessibility MRPI - MPG W/E Adviseurs Free use online3 GPR Bouwbesluit GPR Gebouw met MPG W/E Adviseurs License fee required DGBC MaterialenTool DGMR (NIBE Co-owner) Free download4 The DGBC MaterialenTool was used in this study since it was already being used by the design team of the study case. Based on GreenCalc+, the version 2.21 was used to comply with the version 2014 of BREEAM.NL. This most recent version of the MaterialenTool was also chosen to use the most up-to-date version of the NMD. The different materials are inserted with their dimensions and their quantity into the program. The tool then delivers the total shadow cost of the building in €/m²BVO as well as the environmental impact of the building with the 11 impact categories in absolute values or weighted shadow cost. 2.3 Shadow cost as weighting method As suggested above, the environmental performance of a building in the Netherlands includes 11 impact categories, which are stated in Table 5. Each of these selected environmental impact categories is assigned a shadow price per unit which can then add up to a single environmental indicator resulting in the total shadow cost of the building. 3 Link to the online tool: http://www.mrpi-mpg.nl/Home/Home 4 The latest Materialentool can be downloaded on the DGBC’s web site: http://www.dgbc.nl/content/materialentool-0
  • 20. Assessing the environmental impact of building materials using the Dutch approach | Chevalerias | 2015 11 This list is subject to changes as the Land-Use category could be included in the future as the Eco-toxicity categories were added before (Scholtes, 2015). Also, the shadow price is not a fixed value but varies with economic and environmental situation as explained further in Section 2.3.2. Table 5 Weighting of impact categories (SBRCURnet-Cindy Vissering, 2015). Environmental Impact Category Unit Shadow price /unit Source Abiotic Depletion Potential for Non-fossils resources (ADPE) kg Sb eq. € 0.16 TNO Abiotic Depletion Potential for Fossils resources (ADPF) kg Sb eq. € 0.16 TNO Global Warming Potential for 100 years(GWP100) kg CO₂ eq. € 0.05 CE Ozone Depletion Potential (ODP) kg CFC-11 eq. € 30 CE Photochemical Oxidant Creation Potential (POCP) kg C₂H₂ eq. € 2 CE Acidification Potential (AP) kg SO₂ eq. € 4 CE Eutrophication Potential (EP) kg PO₄ eq. € 9 CE Human Toxicity Potential (HTP) kg 1,4-DB eq. € 0.09 TNO Fresh water Aquatic EcoToxicity Potential (FAETP) kg 1,4-DB eq. € 0.03 TNO Marine Aquatic EcoToxicity Potential (MAETP) kg 1,4-DB eq. € 0.00001 TNO Terrestrial EcoToxicity Potential (TETP) kg 1,4-DB eq. € 0.06 TNO 2.3.1 What is weighting? Figure 5 illustrates the two weighting steps inherent to the shadow cost method with the example of the Global Warming Potential (GWP) and Acidification Potential (AP). The first weighting (also called characterization) is made according to the CML-2 baseline method developed by the Institute of Environmental Sciences of Leiden University (CML). The characterization factor indicates the contribution of a quantity of a pollutant to a given environmental impact. The higher the characterization factor the greater the contribution (De Bruyn, et al., 2010). In the example given in Figure 5, one kg of methane (CH₄) is 21 times more responsible in causing global warming than one kg of carbon dioxide (CO₂), or in other words, 1/21 kg of methane is equivalent to one kg carbon dioxide in causing global warming. This first weighting is fairly objective and no significant difference is noted when using different methods to evaluate the characterization factor (van Soest, et al., 1997). The second weighting however is subjective. It requires a decision to be made or consensus to be reached and gives a hierarchy between different environmental impact categories. In this case, AP is more important, thus more expensive, than GWP. This weighting groups different impact categories under a single indicator, in this case the shadow cost of the building.
  • 21. Assessing the environmental impact of building materials using the Dutch approach | Chevalerias | 2015 12 Figure 5 From different emissions to a single indicator. Different weighting methods exist:  Panel: Based on the observations of a group of stakeholders, a weighting factor is assigned to the different impact category. The stakeholders may be internal or external experts and/or representatives of community groups (van Soest, et al., 1997). The method is relatively simple but shows how subjective a method can be.  Target-to-distance: The weighting factor here depends on the extent to which the current emission level exceeds the desired (target) emission level (van Soest, et al., 1997). The target level could be determined by a national or international policy, or global climate boundaries.  Technology method: A well-known example of technology method is the Ecological footprint which represents the surface necessary to undo the impact caused to the environment (Naber, 2012).  Monetization: This is the method used and resulting in the shadow cost which is explained further in the following Section 2.3.2. The shadow cost represents the cost that society is willing to pay in order to achieve the environmental target. (NIBE, 2015) 2.3.2 What is the meaning of shadow cost? Shadow cost is a constructed cost, a virtual cost that does not have a market. In this case, the shadow cost represents the cost of the measures necessary to prevent the environmental damage. The construction of this cost depends on the following societal aspects. Single Indicator: Shadow Cost in € 0,05 €/kg CO₂ eq. GWP in kg CO₂ eq. 1CO₂ 290N₂O 21CH₄ 4 €/kg SO₂ eq. AP in kg SO₂ eq. 31SO₂ 59NH₄ 22NOx Weighting Impact Category Characteri -zation Emission
  • 22. Assessing the environmental impact of building materials using the Dutch approach | Chevalerias | 2015 13  Economy: The shadow cost represents the maximum sum that society is willing to pay to achieve environmental quality (De Bruyn, et al., 2010). It is therefore dependent on the income level of the society concerned. It can be assessed by direct surveys or by actual market price analysis.  Policy target: Since the Netherlands is a democracy, the decision made by the politicians is considered to reflect the definition of the environmental quality according to Dutch society. Figure 6 illustrates how the shadow cost could be determined. The blue curve represents the supply of options for prevention of emissions. Its price increases as the required reduction is greater. The red dashed curve corresponds to the demand of society for limiting impacts. The willingness to pay a higher price to limit the environmental impacts usually increases with the importance of the damage caused by the emissions. To be cost efficient, the emission target set by the government should be placed at the equilibrium point between supply and demand. This point corresponds to the shadow cost. Figure 6 Shadow cost determination (van Soest, et al., 1997). In addition of being a single indicator under which all impacts can be grouped, the shadow cost weighting method has the advantage of giving to environmental impacts the same unit as real cost, which makes it a convincing unit that all stakeholders of the project can visualize. 2.4 Other labels and certifications used in the Netherlands Although the NMD is settling as the main tool to assess the environmental impact of building materials in the Netherlands, different independent labels or certifications are complementing s
  • 23. Assessing the environmental impact of building materials using the Dutch approach | Chevalerias | 2015 14 or competing with the national method. In this section the DUBOKEUR label and the C2C certification are presented since they are mentioned in the BREEAM.NL concerning the possibility of getting innovation points by using these products. Firstly however, the NIBE’s environmental classification is explained to clarify how this collection of product data and their shadow cost is different from the NMD. 2.4.1 NIBE´s Environmental Classification: The Nederlands Instituut voor BouwBiologie en Ecologie (The Dutch Institute for Building Biology and Ecology) (NIBE) is an independent company that has created an online classification of materials 5 that are ranked according to their shadow cost. The shadow cost of these materials is calculated in the same manner as the NMD product, however, it is not reviewed by a third party. Most importantly, The NIBE decided to take more environmental impact categories into consideration as highlighted in bold in Table 6. The resulting shadow cost for each product is therefore different from the one in the NMD. Table 6 Impact category and shadow cost applied in the NIBE's environmental classification. Main category Environmental impact category Unit Method of characterization Shadow cost in €/unit Source Used by: Emissions GWP100 kg CO₂ eq. CML-2 Baseline 0.05 CE NMD and NIBE ODP kg CFC-11 eq. 30 CE HTP kg 1,4-DB eq. 0.09 TNO FAETP kg 1,4-DB eq. 0.03 TNO TETP kg 1,4-DB eq. 0.06 TNO POCP kg C₂H₂ eq. 2 CE AP kg SO₂ eq. 4 CE EP kg PO₄ eq. 9 CE Depletion of raw materials ADPE kg Sb eq. 0.16 TNO ADPF Sb eq. 0.16 TNO Biotic Depletion Potential (BDP) mbp TWIN 0.042202 NIBE Only NIBE Land use Land use PDF/m²/yrs eco-indicator 99 0.20482 NIBE Nuisance Malodorous air OTV m³ CML2 baseline, inverse OTV 0.0000000233 NIBE Road noise DALY Müller-Wenk 321.946 NIBE Disturbance by sound mbp TWIN 0.00000149 NIBE Disturbance by light mbp TWIN 0.024005 NIBE Disturbance by calamities mbp TWIN 0.024005 NIBE 5 The classification is accessible to the public after a free registration on http://www.nibe.info/nl
  • 24. Assessing the environmental impact of building materials using the Dutch approach | Chevalerias | 2015 15 However, this classification is very transparent, since each product is clearly described with an extensive functional unit and the results are presented for each impact category in both real value and weighted shadow cost. A quick overview of the products is possible and allows to rapidly define which product is the most environmental friendly with a ranking system going from best choice (i.e. Class 1) to unacceptable choice (i.e. Class 7). For each class, subcategories a, b or c define preferred options. The ranking is made according to the best product currently available which is automatically 1a, while the other products follow the ranking according to an environmental factor as shown in Table 7. Table 7 NIBE's classification system (NIBE, 2015). Class Sub-class Definition Environmental factor 1 a Best choice 1 – 1,1 b > 1,1 – 1,32 c > 1,32 – 1,58 2 a Good choice > 1,58 – 1,9 b > 1,9 – 2,28 c > 2,28 – 2,74 3 a Acceptable choice > 2,74 – 3,28 b > 3,28 – 3,94 c > 3,94 – 4,73 4 a Less good choice > 4,73 – 5,68 b > 5,68 – 6,81 c > 6,81 – 8,17 5 a Not recommended choice > 8,17 – 9,81 b > 9,81 – 11,77 c > 11,77 – 14,12 6 a Bad choice > 14,12 – 16,95 b > 16,95 – 20,34 c > 20,34 – 24,40 7 a Unacceptable choice > 24,40 – 29,29 b > 29,29 – 35,14 c > 35,14 – 42,17 >7c Unacceptable choice > 42,17 2.4.2 DUBOkeur® : Since 2004, NIBE has also developed its own product label: DUBOkeur® (from Duurzaam Bouwen Keur: Selection for Sustainable Building). The labelled products go under the same assessment as products in NIBE’s environmental classification, except that these are branded while the others are generic products. A product receives a DUBOkeur® label when it is the best product of its kind of application and stands at least on the 2c grade of the NIBE’s classification. The product rankings change when new products are added or when products already labelled are checked every second year. A new best product determines whether the older products are still good enough to keep the label. This system pushes the manufacturer to have a competitive product in term of sustainability (Scholtes, 2015). However, the label only gives a pass or fail, it does not allow to compare the products between each other. Also,
  • 25. Assessing the environmental impact of building materials using the Dutch approach | Chevalerias | 2015 16 only the functional unit of the product is given. The label stands for itself and no insight is given about the environmental impact or health characteristic of the product (DUBOKEUR, 2014). 2.4.3 C2C® (or cradle-to-cradle® ): The Cradle to Cradle Products Innovation Institute is a non-profit organization which was created by US architect William McDonough and German chemist Dr. Michael Braungart in 2010 and which administers the Cradle to Cradle Certified™ Product Standard. The institute has its headquarter in San Francisco and a satellite office for Europe in Venlo (The Netherlands). The principle of the Cradle-to-cradle® thinking is to continue the life-cycle of the product beyond the end of its life phase, contrasting from the cradle-to-grave system boundary. The certification motto is to make products “More good” instead of “less bad”. The cradle-to-cradle® product certification is assessed by the mean of 5 categories: Material health, Material reutilization, Renewable energy and carbon management and Social Fairness and biodiversity. Each category receives a score: Basic, Bronze, Silver, Gold or Platinum with the lowest score representing the overall score of the product. The requirements are made to prove the quality of the product according to the certification standard as well as a guide to encourage manufacturer toward the next step of the certification. To this day, no product has yet reached the platinum level. Since 2011, the NIBE provide additional information about the products in their classification with a “bron2bron” (source to source) label. It presents how well the product could comply with the cradle-to-cradle® principle with 4 indicators: material health, material recycling, renewable energy and responsible water management. 2.5 Research conducted with the Dutch method This literature review section looks at research concerning the Dutch assessment method for environmental impact of building materials. Very few were found in the English language or with an English abstract, mainly because this method was integrated in the Dutch building regulations only three years ago. Three studies focusing on specific building component or practice such as reusing building materials, renovating or using PV panels revealed some limitations of the Dutch method while a fourth study analyses the first results from the application of method in the Building regulations. Naber (2012), in her thesis about the “reuse of hollow core slab from office buildings to residential buildings” used the LCA software SimaPro in compliance with the Dutch assessment method. A full life cycle assessment tool was chosen rather than a tool using the NMD since the latter do not include products that are not actually used in the industry such as re-usable hollow core slab while SimaPro gives the flexibility to create different processes. The study therefore examined different scenarios in detail such as deconstruction versus disassembly, recycled versus new or simply different percentage of reused material in the building. Dijkstra (2013) also used SimaPro in his thesis “environmental and economic impact comparison of renovation concepts for Dutch residential buildings”. The author presented the
  • 26. Assessing the environmental impact of building materials using the Dutch approach | Chevalerias | 2015 17 shadow cost results not only for the materials but also for the energy use of different renovation scenarios, which had different lifespan expectancy. The importance of linking the environmental performance with the energy performance of the building or product was also demonstrated in a report by Alsema and Anink (2014). In their report, the authors used the Dutch method for environmental impact assessment and the NMD with the GPR tool developed by W/E consultants. The study proposed an integrated environmental performance that assigns an environmental impact factor per unit of different type of energy. This allowed to show the shadow cost of a building’s materials and the shadow cost of the energy used by the building in the same figure. Although this method still needs to be perfected, it would provide the Dutch method for environmental impact assessment with a valuable additional feature allowing it to balance material and energy use. The study also pointed out the lack of up to date quality data on PV equipment in the NMD and the need for its completion. This lack of data was also identified by van der Klauw and van Zeijl (2014). Emphasizing another point of view, their article presented the feedback from municipalities and applicants to construction permit since the application of the Dutch environmental performance assessment method in January 2013. The main findings of the survey included:  Many of the submitted assessments were incomplete or inaccurate mainly due to time or money restrictions.  The main complaints from the respondents of the survey were the lack of data in the NMD and the lack of consistency in the requirements between different municipalities.  For many municipalities the lack of a maximum allowed value in the building regulation is the main reason for not being strict about the submission of an environmental performance assessment. In the same study by van der Klauw and van Zeijl, the analysis of 261 cases revealed that:  The shadow costs of the majority of buildings were between 0.40 and 0.80 €/m²BVO.  A value of 1.2 €/m²BVO or above generally meant that the assessment was inaccurate or that the building included a large energy plant such as PV or heat pump.  Office buildings have a relatively higher shadow cost than houses due to the proportion of installations needed for the building.  In general, walls, floors and installations are the largest contributors to the total shadow cost.  It appears that no correlation exists (in this study) between a low energy performance and a high environmental performance.
  • 27. Assessing the environmental impact of building materials using the Dutch approach | Chevalerias | 2015 18 The literature survey suggests that the tools using the NMD can be insufficient to evaluate certain alternative design that are peculiar or that implement unconventional or new materials. The need for a more complete database is also clearly expressed. However, the Dutch method still serve as a common ground to execute full LCA that are then comparable to each other. Also, the necessity to link the environmental performance of material to the environmental impact of energy use of the building is clearly demonstrated.
  • 28. Assessing the environmental impact of building materials using the Dutch approach | Chevalerias | 2015 19 3 Method The study has been structured as follows:  The first task was to get familiar with the Dutch context, mainly through a literature review and then via practice. This has been done by assessing the environmental impact of a study case of an office building project with the MaterialenTool described in Section 2.2.4.  Next, the limits of the tool were tested by a parametric study that aimed to reduce the environmental impact of the building as much as possible while conserving its energy-efficiency and overall design.  Finally, interviews were conducted with different actors and users of the Dutch method to discuss the efficiency and viability of this method. 3.1 Description of study case The study case is a project for the new office building of the Dutch bank “Triodos” in Driebergen-Zeist, in the Region of Utrecht, The Netherlands. The Triodos bank is highly engaged towards sustainability by supporting sustainable project with a positive social, environmental and cultural value (Triodos, 2015). The idea behind this new building is to bring a positive value to the location with the building acting as a platform encouraging the sharing of knowledge and innovation as well as holding a more traditional headquarter function. Figure 7 Location of the building project. The building with around 13000 m² and up to 5 stories, is placed in historical park “de Reehorst”, which will stay open to the public. The ground floor of the building should
  • 29. Assessing the environmental impact of building materials using the Dutch approach | Chevalerias | 2015 20 therefore be able to welcome any visitors of the park as well as clients and employees. This location benefits from its close access to the train station’’ Driebergen-Zeist’’ and to a quick access to the highway. The design team came up with an organic shape inspired by the shape of living cells which created three towers with a concrete core that merge with each other on the lowest levels (see Figure 8, right). The building is placed on a spot which was once constructed and strive to limit the number of tree necessary to cut for the construction. It is also shaped so that it avoids obstructing the view from the existing historical building Antropia and its height matches the height of the existing surrounding trees (see Figure 8, left). Figure 8 Shaping of the building according to the surrounding landscape elements (Courtesy of RAU Architects). The facade is entirely glazed with some glass panel being filled with aerogel making the glass translucent according to the orientation and intimacy level requested. The roof welcomes greenery and skylights. Figure 9 gives an overview of the building. Figure 9 Bird’s eye view rendering of the project (Courtesy of RAU Architects).
  • 30. Assessing the environmental impact of building materials using the Dutch approach | Chevalerias | 2015 21 The structure consists of a concrete core from which the concrete floor extends itself in a wooden floor supported on the outside by steel columns. This shape aims to optimize the use of material and maximize the amount of daylight entering the building. Figure 10 proposes and overview of the main materials of the building in a simplified 3D section of one of the three tower of the building. Figure 10 Section showing the structural principle and used materials. The ground floor has the general function of sharing; it has a restaurant, a conference room, meeting rooms, an exposition space, a library, etc. The top floors are open plan offices while the circulation and other functional rooms (toilets, copy machines, storage, etc.) are placed in the concrete core. The basement holds all facilities that do not require daylight such as: technical spaces (Air Handling Unit, sprinklers basin, server room), storage areas (bicycles parking, waste recycling room, archives and other storage room) and other periodical functions (expedition area, kitchen facilities, showers and locker rooms for employees coming by bike). The detailed floor plans of the building can be seen in Appendix C. After a period of latency due to issues raised by the development of other surrounding projects, the Triodos group decided to re-evaluate the design instead of rushing into the Definitief Ontwerp phase (definitive design stage). This approach from the client is not such a common decision and illustrate well the commitment of the Triodos group toward sustainability by appreciating the time needed to develop new ideas and concepts. Roof window: -triple layer glass -wooden wall -OSB 30mm -EPS Rc: 6.5 m²K/W Curtain wall: -wood/aluminum frame -triple layer glass Steel beams 160X80mm Overhang: -sedum roof system -OSB 30 mm -wood beams -metal coating Core wall: -concrete 250 mm Basement wall: -concrete 250 mm -EPS Rc: 6.5 m²K/W Round concrete column 400 mm or 300 mm Ssss , s Roof: -green roof system -OSB 30mm -EPS Rc: 6.5 m²K/W -wooden floor Wooden floor: -wooden beams -OSB 30mm -insulation 20 mm -anhydrite 50 mm Core floor: -concrete 250 mm Ground floor: -prefabricated concrete hollow core slab or concrete poured on site 250 mm -anhydrite 80 mm -EPS 20 mm Basement floor: -concrete 250 mm -EPS Rc: 6.5 m²K/W Concrete foundation poles , s
  • 31. Assessing the environmental impact of building materials using the Dutch approach | Chevalerias | 2015 22 3.2 Practical requirements of the project This section proposes a summary of the requirements for the study case that are examined in this study with an illustration of it in Figure 11. Figure 11 “Russian dolls of project requirements”. During the design process, requirements are defined by the client (Triodos Bank) via scope statements established by the developer (Join). The Triodos Bank group is highly involved in the development of a sustainable world. The project therefore strives to generate a state-of- the-art sustainable building, which is also appealing to its users and at the same time represents the values of the bank. To achieve this goal the design team aims for an “outstanding” level in the BREAAM.NL certification scheme described in Section 2.1.1. In this study, the focus is on the Material section of the certification scheme and especially on the credit MAT1. This credit is calculated with specific tools, which use the NMD and are regulated by the SBK method. It is important to keep in mind that these points are only a part of the requirements that the architects have to answer to in the context of the project. The BREEAM.NL certification scheme is used as guideline to the design process but should not prevent the design team from thinking outside the box to develop an innovative design solution. We want: A state-of-the- art sustainable building, which is also .... You should have a BREEAM.NL certified building with an ”Outstanding” level. In each section you should try to get the maximum of points (from 3 to 8 points for MAT1) To get 8 points, the total shadow cost of your building should be 60% lower than the reference price of 1 €/m²BVO. We should be validated by SBK and verified by a third party LCA expert. The client: Triodos Bank The developer: JOIN The certification: BREEAM.NL One of the credit: MAT1 The method : The Stichting Bouw Kwaliteit’s method The shadow cost should be calculated according to the SBK method with a validated tool using the national milieu database. The product database: The National MilieuDatabase (NMD)
  • 32. Assessing the environmental impact of building materials using the Dutch approach | Chevalerias | 2015 23 3.3 Parametric Study The preliminary design of the study case and its environmental performance was first analysed in order to understand which part of the building influences its shadow cost most. Thanks to the ArchiCAD software used by the architects, it was possible to make a precise inventory of the materials used in the project even at an early design phase. This inventory is presented in Appendix B. Then, via a parametric study, different concepts and material options were considered. The considered options were chosen based on the strategies intuitively thought of by the design team to reduce the environmental impact of the building and according to the other practical challenges of the project.  The reduction or removal of the basement was considered to reduce the direct footprint of the building on the land and to rearrange the entry to the building.  According to the fluctuant level of the ground water on the site, different material for the foundation poles were tested.  To obtain a warmer atmosphere in the offices and to show the structure of the building, different wooden structures were designed to replace the concrete core and steel columns.  Different innovative type of climate ceiling were assessed.  Different combinations of solutions were tested and a substitution of products for the most accurate in the database was effectuated. Some other ideas to reduce the environmental impact from the building materials were also studied. These included:  Certified materials and label recommended by the certification scheme were investigated.  The possibility of using material reclaimed from the waste stream was analysed. 3.4 Interviews Although the Dutch method has been studied through a literature review and the practicality of the tool has been assessed through its application on the study case, calling on the knowledge of experts was inevitable to make sure that no aspect of the possibilities and limitations of the Dutch method has been left out. This opportunity was taken by conducting extensive discussions about the Dutch method with different actors of the method so that different points of view could be recorded, from the expert to the user. The term “user” here is related to the people that use the tools in combination with the NMD such as the MaterialenTool while “expert” refers to people contributing to the construction of the method or to the addition of products in the NMD by performing LCAs. Since a quantitative survey
  • 33. Assessing the environmental impact of building materials using the Dutch approach | Chevalerias | 2015 24 had already been conducted by Alsema and Anink (2014), a qualitative approach was preferred here, the goal being to sense if the advantages and inconveniences of the Dutch method were seen similarly at the different levels of use. The name of the interviewees and their relation to the Dutch method is explained in Table 8. The interviews took place on different dates with no specific chronological order and were conducted in the working place of each interviewees. The interviews were conducted as a conversation rather than a precise interrogation. The discussions of about 1 hour were recorded and transcribed in writing in its entirety in Appendix D. Table 8 Name and functions of the interviewees. Name of the interviewee Function as contributor to the Dutch method Function as user of the Dutch method Other relevant function Rick Scholtes Member of the TIC. Member of VLCA. Third party reviewer for product card to be included in the NMD. Employee of the NIBE, in charge of the DUBOKEUR label and the NIBE’s environmental classification. René Klaassen Member of VLCA. Third party reviewer for product card to be included in the NMD. Researcher at the SHR, in charge of LCA for wooden products. Martin Bijleveld Sustainability consultant at DGMR. BREEAM.NL expert. Dennis Grootenboer Technical designer at RAU Architects C2C expert.
  • 34. Assessing the environmental impact of building materials using the Dutch approach | Chevalerias | 2015 25 4 Results 4.1 Analysis of preliminary design The stacked column in Figure 12 presents the total shadow cost of the Triodos’ preliminary design for each part of the building. The pie charts present the share of each material’s shadow cost in the corresponding building part. The shadow cost per m³, per m² or per piece of each of these materials can be found in the legend. Only the stacked column can be directly extracted from the MaterialenTool. The shadow price per cubic meter of material has to be deduced and may not be looked at as a fixed value for the product. The total shadow cost of the preliminary design is 0,65 €/m²BVO, which is 35% lower than the reference price of 1€/m²BVO, awarding 5 points in the material section of BREEAM.NL. To obtain the maximum of 8 points in the credit MAT1, the total shadow cost of the building needs to be below 0,40 €/m²BVO. Hence, the shadow cost gives a clear view of where the building stands compared to the reference standard building. However, it is worth noting that it is not stated anywhere what does this reference building looks like. As can be seen in Figure 12, the technical installations are the main cause of environmental impact, closely followed by the floors, the facade and the roofs. Installations: Approximately, 64% of the shadow cost of the installations comes from the climate ceiling elements. These prefabricated elements composed of a steel plate and copper tubes are implemented in the ceiling of each office floor for heating and cooling purposes. Climate ceiling elements are essential to the comfortable indoor climate of the building and the flexibility of the space. If replaced or modified, they should be able to deliver the same results in term of indoor climate. From the BREEAM expert’s experience, this high shadow cost is probably caused by the copper of the tubes (Bijleveld, 2015). An additional 30% of the shadow cost of the installations is due to the cooling coil. The MaterialenTool only allows a choice between heavy or light power. The heavy power option was selected due to uncertainties about the cooling need of the building and the assumption that the high percentage of glazed surface of the building implies a significant cooling demand. Although strategies to reduce the overheating of the building were investigated by the design team, the cooling coil is kept to “heavy” as a precaution. Floors: Nearly half of the shadow cost of the floors is caused by the concrete and anhydrite, while the Oriented Strand Board (OSB) alone is responsible for 39% of the shadow cost of the floor. The OSB material is necessary to lay the anhydrite on the wooden floors and appears to have the highest shadow cost per cubic meter. Its high shadow cost is due to the high human toxicity potential according to the NIBE database. This is believed to come from the high level of Volatic Organic Compound (VOC) emitted from the resin and the wood used in the panels during its production process as well as during its use. The anhydrite screed is the finishing surface of all floors (wooden and concrete floors), it is an economical and time- efficient alternative to a cement floor. According to the NIBE classification, the anhydrite is also more environmentally friendly than cement floor. According to the same classification, an even more environmentally friendly equivalent is the “Ro-anhydriet” which is composed of sulfur dioxide (SO₂) recovered from exhaust gases of fossil-fuel power plants instead of extracted from the ground. This material however, is not available in the NMD.
  • 35. Assessing the environmental impact of building materials using the Dutch approach | Chevalerias | 2015 26 Figure 12 Composition of the shadow cost of the preliminary design. Facade: The facade is mainly composed of triple layered glass which account for 97% of the facade’s shadow cost. The frame holding the triple glass is intended to be a wooden frame with an aluminium coating on the parts of the frame facing the outside. This design choice made by the architects allows to keep the use of aluminium to a minimum. Indeed, the aluminium has a very high shadow cost per cubic meter, at least 950 times higher than the wooden frame. It is interesting to note that this small quantity still places the 0.09 0.12 0.03 0.13 0.12 0.15 0.01 0.00 0.05 0.10 0.15 0.20 0.25 0.30 0.35 0.40 0.45 0.50 0.55 0.60 0.65 OSB - 21.85 €/m³ concrete poured on site - 20.5 €/m³ concrete hollow core slab - 16.6 €/m³ anhydriet 80 - 15.3 €/m³ EPS Rc 0.6 - 13.8 €/m³ wood beams - 8.95 €/m³ mineral wool Rc 0.6 - 5.3 €/m³ facade floors roofs installations Total shadow cost of the building / (€/m²BVO) aluminium profiel - 11623 €/m³ drievoudig glas - 1070.1 €/m³ hout kozijn - 12.2 €/m³ drievoudig glas - 1070.1 €/m³ multiplex - 118.1 €/m³ EPS Rc 6.5 - 29.5 €/m³ OSB - 21.85 €/m³ hout balk - 8.95 €/m³ green roof system - 3.13 €/m² metal coating - 1.12 €/m² steel column - 318.94€/m³ prefabricated concrete column - 38.2 €/m³ concrete core - 23.36 €/m³ partition wall - 15.2 €/m³ MDF door - 11.8 €/piece prefabricated concrete beam - 38.3 €/m³ on site concrete poles - 33.9 €/m³ EPS Rc 6,5 - 32,54 €/m³ beton - 20.5 €/m³ anhydriet - 15.3 €/m³ electric boiler -171.7 €/piece air handling unit - 3.67 €/piece climate ceiling - 4.6 €/m²GBO cooling coil - 2.2 €/m²GBO heat pump - 0.26 €/m²GBO foundations walls equipment concrete - 20.5 €/m³ anhydrite - 15.3 €/m³ aluminum coating - 11623 €/m³ triple layer glass - 1070.1 €/m³ wooden frame - 12.2 €/m³ anhydrite - 15.3 €/m³ triple layer glass - 1070.1 €/m³ wooden beam - 8.95 €/m³ electric boiler - 171.7 €/piece
  • 36. Assessing the environmental impact of building materials using the Dutch approach | Chevalerias | 2015 27 aluminium with a 2,7% share of the shadow cost of the facade compared to the 0,3% of the wooden frame. Roofs: As it is the case for the floors, the OSB forms a big part of the roofs’ shadow cost (32%). Additionally, the EPS, which needs to be of a thermal resistance of 6.5 (m-K)/W to ensure good energy performance of the building, represents 31% of the shadow cost of the roofs. Despite its benefits, the system for the green roof also represents a notable 15% of the roofs’ shadow cost. This score is believed to be due to the usual plastic components in the drainage system, although, the description of this green roof in the MaterialenTool which is: “green roof; drainage+filter+subtraat+sedum (excluding roofing)” does not specify which kind of drainage system is implemented. Foundations: The category “Foundation” in the MaterialenTool comprises the foundation poles and the basement exterior and load bearing walls. The use of concrete for the foundations and the basement creates 67% of the shadow cost. The concrete foundation poles alone account for 34%, which is due to their high shadow cost per cubic meter as well as their quantities which was estimated to 200 poles each 10-m long. Also, each of these concrete components is reinforced with steel and the load bearing capacity of the concrete is mostly given in the description. The EPS insulation, as it is the case for the roof, also has a significant share of the shadow cost of the foundations (38%). This detailed view of the shadow cost of the building allowed the design team to rapidly identify which part of the building is worth focusing on to reduce the environmental impact and, in certain cases which specific product contribute to a high shadow cost of the building. In this study, the roofs, floors and walls are reconsidered altogether as the structure of the building is studied while the effort to reduce the shadow cost of the installations is focused on the climate ceiling elements only. If only one material is entered into the MaterialenTool, it is possible to see the shadow cost of each product. However, little information is given (both in the tool and on the website) about the product itself: the title of the product is the only description. When the product card is related to a specific brand, it can be an option to check the information via the manufacturer but this takes some additional research time. The dimension of a product is entered by the user in the tool but in certain cases the dimension is not the best unit to quantify the product. For the EPS insulation for example, the field reserved for the thickness is used to enter the thermal resistance instead. However, this practice is not clearly stated and was learnt by making the mistake of inserting the thickness of the insulation layer and questioning an experienced user of the tool about the anomaly in the results for EPS. The MaterialenTool also allows users to look at the building’s environmental performance by environmental impact category with or without weighting. It is interesting to compare the readability of the output before and after weighting as shown in Figure 13. Although the environmental impacts are not easily read, it is appreciated that they are accessible. It is regrettable however, that the share of each phase of the product life-cycle is not visible.
  • 37. Assessing the environmental impact of building materials using the Dutch approach | Chevalerias | 2015 28 Figure 13 From environmental impact values (left) to shadow costs values (right) of the preliminary design. In the left graph, the environmental impact values are expressed in different units (kg per CO₂ eq, kg per SO₂ eq….) which prevents them from being compared to each other’s. Here, the Marine Aquatic Eco-Toxicity Potential (MAETP) is so great that the others environmental impact’s effects cannot be read. In the right graph however, the weighted values in euros are comparable as they have the same units. According to this weighting, the building mainly impacts the Human Toxicity Potential (HTP) and the Global Warming Potential (GWP) and it would cost respectively 162 and 159 thousands euros in the virtual market for environmental quality to compensate for it. Compensating for acidification damage would cost 63 thousand euros and 23 thousands euros for the eutrophication damages. After weighting, the MAETP is only the fifth most expensive impact category to compensate for with 13 thousands euros. In conclusion, the shadow cost weighting not only allows for a comparison of different impact categories but also gives an image of what these impacts represent. 4.2 Parametric study Following the analysis of the environmental performance of the preliminary design, several modifications were tested according to the challenges of the project. 4.2.1 Modification on basement and foundations The high level of the water table in the park brought the question of the necessity of the basement to the design team which investigated the possibilities of relocating the functions 158.72 0.35 162.35 1.59 12.93 1.33 4.59 63.48 22.50 0.01 2.78 0 15 30 45 60 75 90 105 120 135 150 165 GWP ODP HTP FAETP MAETP TETP POCP AP EP ADPE ADPF Shadow cost / k€ 0 20 40 60 80 100 120 140 GWP100/kgCO2eq. ODP/kgCFC-11eq. HTP/kg1.4-DBeq. FAETP/kg1.4-DBeq. MAETP/kg1.4-DBeq. TETP/kg1.4-DBeq. POCP/kgC2H4eq. AP/kgSO2eq. EP/kgPO4eq. ADPE/kgSbeq ADPF/kgSbeq Millions Environmental impact / unit
  • 38. Assessing the environmental impact of building materials using the Dutch approach | Chevalerias | 2015 29 held by the basement. However, this solution was not as beneficial as expected in reducing the shadow cost of the building. When looking at absolute values in Figure 14, the foundations and basement of the preliminary design (called VO case) represent a total shadow cost of 57000 euros. This shadow cost can be reduced by 3.5 % by using prefabricated concrete foundation poles and by 15.8% by using wooden poles instead of concrete poles poured on site. The wooden poles include a concrete cap that protect the wood from being exposed to air due to a fluctuating water level. Reducing the basement decreases the shadow cost of the foundation by 28% and having no basement at all brings a reduction of 79,2% from the VO case. From this graph, it can be deduced that, in the VO case, the foundations represents 16 000 euros of shadow cost and the basement 41 000 euros. This difference is likely due to the high shadow cost of the EPS insulation layer required for the basement which is otherwise applied to the ground floor. Figure 14 Effects of parametric study on foundation’s total shadow cost. However, the graph in Figure 14 presents the shadow cost in absolute value while the single indicator used to express the shadow cost of the building’s materials is expressed relative to its square meter of gross floor area, in €/m²BVO. This unit means that reducing the total BVO increases the final total shadow cost of the building, as can be seen in Figure 15. When the functions of the basement are relocated outside of the building, the definition of what is included in the BVO of the building can be ambiguous and the decision rest with the BREEAM assessor. To predict what could be the shadow cost of the building according to the assessor’s decision, several scenarios are assessed. The different assessed scenarios are presented in Figure 16 and the results in Figure 15. 57 55 48 41 16 0 10 20 30 40 50 60 VO case Prefabricated poles Wooden poles Reduction basement Removal basement Shadow cost of the foundations / k€
  • 39. Assessing the environmental impact of building materials using the Dutch approach | Chevalerias | 2015 30 Figure 15 Effects of different modification of foundation on the total shadow cost of the building. VO-case: The base case corresponds to the preliminary design (VO) described in Section 3.1, its shadow cost is analysed in Section 4.1 Case 1: In this case, the basement is reduced but the BVO remain the same, resulting in a reduction of 0.03 €/m²BVO. The Air Handling Unit (AHU) is relocated to the roof top with a very light wooden construction. This way, the surface is still counted in the BVO for a minimum of material use, which does not increase the shadow cost of the roofs. The same strategy is applied for the bike storage. A wooden shed is placed next to the building, keeping to same total BVO for a minimum of added materials. Even though this shed would be next to the building and not in the same envelope, it is assumed that this surface could be accepted as being part of the BVO of the building. Case 2: The basement is reduced as well as the total BVO resulting in an increase of 0.03 euros/m² BVO. The AHU is placed next to the building and is only enclosed by a simple fence while the bikes are parked in an existing structure. In this case, the BREEAM Assessor could argue that these surfaces are not part of the building BVO, which, on the whole, increases the shadow cost per square meter BVO of the building. As a result, the decrease in shadow cost brought by the reduction of the basement is smaller than the increase brought by the loss of square meter BVO. Case 3: The basement is completely removed and the BVO remains the same, resulting in a decrease of 0.01 €/m²BVO. Even though the removal of the basement reduces the shadow 0.09 0.06 0.07 0.02 0.03 0.08 0.07 0.12 0.12 0.13 0.13 0.14 0.12 0.12 0.03 0.03 0.04 0.03 0.04 0.03 0.03 0.13 0.13 0.14 0.14 0.14 0.13 0.13 0.12 0.12 0.13 0.16 0.13 0.12 0.12 0.15 0.15 0.15 0.15 0.16 0.15 0.15 0.01 0.01 0.02 0.01 0.02 0.01 0.01 0 0.05 0.1 0.15 0.2 0.25 0.3 0.35 0.4 0.45 0.5 0.55 0.6 0.65 0.7 Shadow cost/ (€/m²BVO) equipment installation roofs floors inside walls facade foundation
  • 40. Assessing the environmental impact of building materials using the Dutch approach | Chevalerias | 2015 31 cost of the building by 0.07 €/m²BVO, the functions relocated on the ground floor increases the roofs’, floors’ and facades’ surfaces and thus increases the shadow cost by a total of 0.06 €/m²BVO. Case 4: The basement is completely removed, the other functions are relocated on the ground floor without increasing its surface, resulting in an increase of 0.01 €/m²BVO. Although this case is the one where the most material is eliminated, the fact that the BVO decreases as well makes the effort of having a more compact building worthless in order to reduce the shadow cost of the building. Figure 16 Schematic sections of tested scenarios. Prefabricated poles: The basement is kept untouched but the concrete foundation poles are replaced by prefabricated concrete foundation poles resulting in a decrease of 0.01 €/m²BVO Case 1 Case 2 Case 3 Case 4
  • 41. Assessing the environmental impact of building materials using the Dutch approach | Chevalerias | 2015 32 Wooden poles: Again, the basement is kept untouched but the concrete foundation poles are replaced this time by wooden foundation poles decreasing the total shadow cost by 0.02 €/m²BVO. Reducing or removing the basement is a clear example to reveal the weakness of the functional unit. Even though using shadow cost per m² allows users to compare building of different sizes and encourage material efficiency per square meter, it does not encourage a compact design and space efficiency on the scale of the building. This unit could actually have the reverse effect of encouraging to build more basement only to increase the total BVO for a minimum of materials used in order to reduce the environmental performance indicator of the building. Looking closer at the shadow cost of the foundation poles per m³ in Figure 17, it is noticed that the wooden poles have a negative shadow cost, meaning that they have a positive impact on the environment. This is most likely be due to the CO₂ storing capacity of wood combined with the fact that little process is needed to transform a tree in a pole. Figure 17 Shadow cost per m³ of different foundation poles. Although it is not possible to access the data by life-cycle stage, looking at the shadow cost per impact category in Figure 18 gives insight into the cause of this negative value. Indeed, the negative shadow cost of the building is mainly due to the good impact on Global warming Potential (GWP) which is expressed in CO₂ equivalent as well as Marine Aquatic Eco- Toxicity Potential (MAETP). 33.93 28.39 -1.78 -5 0 5 10 15 20 25 30 35 concrete poured on site prefabricated poles wooden poles Shadow cost/ (€/m³)
  • 42. Assessing the environmental impact of building materials using the Dutch approach | Chevalerias | 2015 33 Figure 18 Shadow cost per impact category per m³ of different foundation poles. The product card of the wooden foundation pole is in category 3, meaning that this result can be doubted, especially if this negative value is abused by implementing too many foundation poles to lower the total shadow cost of the building. The CO₂ storing capacity of the wood is a delicate subject and there are different opinion about how to execute the LCA for wood products. In his interview (see Appendix D), René Klaassen from the Foundation for Wood Research (SHR) explained how this aspect of their first LCA on wood foundations piles was corrected by the third party reviewer: “Well, in the determination method, the wood is CO₂ neutral, which in the case of the foundation pile is not the case since they really sink CO₂, you can leave them in the ground for more than 100 years. So you remove it from your 100 years cycle. It is actually a sink. And that is how you get your advantage.” A suggestion of the BREEAM Expert to account for this uncertainty is to count zero shadow cost for the wooden foundation pole instead of a negative value. 4.2.2 Modification of structure Based on the general idea that concrete has a high environmental impact and with a will to integrate more wood in the building, different structural options are tested as shown in Figure 19. A schematic drawing of the tested structures is proposed in Figure 20. VO case: The structure in VO case is a concrete core with concrete floors extended by wooden floors and steel columns as suggested by the schematic section above. The ground floor and basement are made out of concrete. -15 -10 -5 0 5 10 15 20 25 30 35 40 concrete poured on site pole prefab. concrete pole wood pole Shadow cost / (€/m³) ADPF ADPE EP AP POCP TETP MAETP FAETP HTP ODP GWP100
  • 43. Assessing the environmental impact of building materials using the Dutch approach | Chevalerias | 2015 34 Wooden ground floor: Changing the concrete ground floor to a wooden one decreases the shadow cost of the floors by 0.02 €/m²BVO but the brick foundation wall necessary to support it increases the shadow cost of the foundation by 0.01 €/m²BVO, resulting in a total decrease of the shadow cost of the building by 0.01 €/m²BVO. Traditional wooden construction: Changing the concrete core (walls and floors) and steel columns for a wooden construction reduces the shadow cost by 0.02 €/m²BVO. According to the recommendations of the structural engineer, some laminated wooden beams are implemented in this design to keep a large free space within the core. The steel columns are replaced by massive wooden columns of 320x320 millimetres minimum, instead of the 160x80 millimetres of the steel, to ensure fire resistance. Tree like structure: With laminated wood construction the shadow cost of the building increases by 0.03 €/m²BVO. The benefice from the laminated wood is the freedom of the shape which is not possible with a more traditional massive wooden structure. This shape consists of “T” shaped profiles with the vertical part of the “T” replacing the concrete wall of the core. It had the big advantage of completely eliminating the columns along the facade, and leaving the view completely interrupted. This original idea is inspired by trees, for which branches derive from the stem. Figure 19 Parametric study of the structure. 0.09 0.10 0.09 0.09 0.12 0.12 0.12 0.12 0.03 0.03 0.02 0.06 0.13 0.11 0.12 0.13 0.12 0.12 0.12 0.12 0.15 0.15 0.15 0.15 0.01 0.01 0.01 0.01 0 0.1 0.2 0.3 0.4 0.5 0.6 0.7 0.8 VO case wooden ground floor traditional wooden construction tree like structure Shadow cost / (€/m²BVO) equipment installation roofs floors inside walls facade foundation
  • 44. Assessing the environmental impact of building materials using the Dutch approach | Chevalerias | 2015 35 Figure 20 Schematic sections of tested structures. Looking closer at the shadow cost per m³ for different column’s material in Figure 21, the steel clearly has the biggest negative impact on the environment while the massive wood has the lowest. Between the concrete and the laminated wood however, the difference is not so obvious, depending on the amount of steel used to reinforce the concrete. It should be noted that the laminated wood, as many other material in the NMD is from Category 3 whereas the concrete is from category 1 or 2 meaning that the LCA´s results have been verified by a third party. Figure 21 Shadow cost per m³ of different structural materials. These results come from the amount of material used in each case. The steel column, even though being used every 1.8-m along the facade of the VO case remains a hollow element with a small amount of material while the concrete from the core is a massive element. When using laminated wood for the structure, big elements are required in order to ensure its load bearing capacity. Figure 22 presents the volume of steel and concrete needed in the VO case compared to the volume of laminated wood necessary for the tree like structure. 318.00 38.22 23.36 30.36 8.91 0 50 100 150 200 250 300 350 steel column concrete column concrete wall laminated wood massif wood shadow cost /(€/m³)
  • 45. Assessing the environmental impact of building materials using the Dutch approach | Chevalerias | 2015 36 Figure 22 Volume of material for VO case and tree-like structure case. . It is interesting to look at the different environmental impact categories per cubic meter to estimate the difference between wood, laminated wood and concrete in Figure 23. Figure 23 Environmental impact of different materials for the columns. From Figure 23 it can be assumed that the processes needed for manufacturing laminated wood account for more GWP than the CO₂ storing capacity of the wood used in the product since the GWP goes from -4 euros for the massive wood to 3 euros for the laminated wood. The Human Toxicity Potential (HTP) of the laminated wood column is almost twice the value of both the massive wood and the concrete column. This is assumed to be due to the VOC and glue used in the laminated wood. The Acidification (AP) and Eutrophication potentials (EP) are also higher in the laminated wood case than both the case of wooden or concrete 5.7 469.7 708.8 0 100 200 300 400 500 600 700 Volume /m³ steel concrete laminated wood -10 -5 0 5 10 15 20 25 30 35 massive wood column laminated wood column concrete column Shadow cost / (€/m³) ADPF ADPE EP AP POCP TETP MAETP FAETP HTP ODP GWP100
  • 46. Assessing the environmental impact of building materials using the Dutch approach | Chevalerias | 2015 37 column. According to the interpretation part of a German EPD for laminated wood (Studiengemeinschaft Holzeimbau e.V., 2013) the heat generation on site causes 32% of the AP while 33% of the emissions causing EP are due to wood firing on site. According to the same source, the POCP which is the same in Figure 23 for the massive wood and the laminated wood, is mainly caused by the drying of wood. It is important to note that in NMD all the wooden product are classified in category 3 whereas only 6% of the concrete product cards are in category 3. 4.2.3 Climate ceiling As explained in Section 4.1, the installations have the largest impact on the shadow cost of building and within these the climate ceilings have the largest impact. Simply removing these elements is not an option since a required indoor climate quality should be kept, however, only one kind of climate ceiling is available in the NMD. Although the description of the default climate ceiling from the NMD is not very clear in its composition, it is safe to assume that it is made out of copper tubes for the circulation of water and a metal plate to radiate the heat or cold into the room since this represent the most standard climate ceiling element to be found in the market. A range of climate ceiling types exists in the market, however, none of them have been included in the NMD yet. To get an idea of whether a different kind of climate ceiling would be beneficial in reducing the shadow cost of the building, an estimation of the shadow cost per square meter was made for this study. Figure 24 illustrates different types of climate ceilings studied. MaterialenTool was used to obtain the shadow cost of different climate ceilings by combining shadow costs of different materials together as shown in Figure 25. The details of quantities of material were found using online specifications of products from different manufacturers. Figure 24 Different types of climate ceilings (from left to right) Standard, CC1, CC2, CC3.
  • 47. Assessing the environmental impact of building materials using the Dutch approach | Chevalerias | 2015 38 Figure 25 Estimated shadow cost per m² of different climate ceiling. Default NMD: The only climate ceiling available in the NMD and described as “steel plate + pipe” has a shadow cost of 4.59 €/m². Standard: A standard climate ceiling which is assumed to be the same kind as the default one from the NMD is composed a copper tube and metal sheet. It also has acoustic advantages with the perforation of the metal sheet. A shadow cost of 7.36 €/m² was estimated. This high value is mainly due to the copper pipes. This price is 160% of the default value with which it is represented in the NMD. CC1: This product uses polyethylene instead of copper pipe and a plaster board which is covered by an aluminium foil instead of a metal sheet. The small holes in its surface allows it to act as an acoustic ceiling panel as well. It comes with a mineral wool insulation layer and is mounted on steel fixations. Using a plaster panel reduces the shadow cost by 0.40 €/m² compared to sheet metal. The big improvement is made by the polyethylene pipes which are 0.0 0.5 1.0 1.5 2.0 2.5 3.0 3.5 4.0 4.5 5.0 5.5 6.0 6.5 7.0 7.5 8.0 Default NMD Standard CC1 CC2 CC3 Shadow cost / (€/m²) steel plate+ copper pipes copper pipes steel plate steel fixation mineral wool insulation layer MDF plaster work / plaster board aluminium foil polyethyleen or PeRT pipes 4.59 7.36 1.65 1.58 1.76
  • 48. Assessing the environmental impact of building materials using the Dutch approach | Chevalerias | 2015 39 60 times lower in shadow cost than copper pipes. The total shadow cost of this climate ceiling is estimated to 1.65 €/m². CC2: This product was studied because even though it does not include any acoustic features, it has the advantages of being applicable to curved surfaces which may be useful for the tree- like structure. The polyethylene tubes are highly flexible and once fixed to the ceiling, a layer of plaster is applied on it. This very simple composition resulted in the lowest shadow cost of 1.58 €/m². CC3: This innovative product resembles the comfort plafond model except that it replaces the plaster panel by a MDF panel with acoustic features and the polyethylene pipes by PeRT pipes. As with the comfort plafond model, it includes an aluminium foil, a mineral wool insulation layer and metal fixations. The MDF cost 0.04 €/m² more than the plaster and the PeRT cost 0.07 €/m² more than the polyethylene, resulting in a total shadow cost of 1.76€/m². These estimations show that copper climate ceiling should be avoided to reduce the shadow cost of the building. These results remain only estimations and conducting an LCA for each of these products would be much more accurate than adding shadow cost of components. However, according to the BREEAM.nl expert on the Triodos project, this way of estimating shadow cost could be accepted by the BREEAM.NL assessor if clearly and thoroughly documented. Nevertheless, if the reduction brought by this change is significant, the Assessor might require a more detailed calculation by means of an LCA of the product (Bijleveld, 2015). Indeed, the next option to include a more environmental friendly climate ceiling in the calculation is to conduct an LCA according to the SBK method, to have it reviewed by a third party and to include it in the NMD. This process can take a lot of time, which is why it is important to first assess whether it is worth the effort, time and money. The “plaster board” type of climate ceiling is selected because it has the lowest shadow cost per square meter while being both a climate and acoustic ceiling. Figure 26 shows the effect of changing the default climate ceiling for a combination of materials similar to the Comfort Plafond on the total shadow cost of the building. The resulting reduction of 0.06 €/m² proves that it is indeed relevant to implement a more environmental friendly climate ceiling in the construction. According to BREEAM.NL, one innovation point can be awarded in MAT1 for the introduction of a product which is not already in the NMD and whose shadow cost is at least 0.05 €/m² lower than its alternative in the NMD. The Comfort Plafond is therefore a product worth the effort of being put in the NMD.
  • 49. Assessing the environmental impact of building materials using the Dutch approach | Chevalerias | 2015 40 Figure 26 Effect of changing the climate ceiling on the total shadow cost of the building. 4.2.4 Combining solutions Different combinations of solutions are tested to decide which one has the lowest shadow cost as can be seen in Figure 27. Combination A corresponds to the improved design that would have been chosen intuitively while combination B is chosen by selecting all the strategies that proved to be efficient in reducing the shadow cost of the building during the parametric study. Combination A is the case where:  The basement is removed by moving AHU to the roof, bike stand to a wooden shed and other functions to the increased ground floor.  The foundations is made of wooden poles.  The ground floor has a wooden floor.  The structure is tree-like made from laminated wood.  The default climate ceiling is changed to CC1. Combination B represents the case where:  The basement is reduced by moving AHU to the roof and bike stand to a wooden shed.  The foundations is made of wooden poles. 0.09 0.09 0.12 0.12 0.03 0.03 0.13 0.11 0.12 0.12 0.15 0.09 0.01 0.01 0.00 0.05 0.10 0.15 0.20 0.25 0.30 0.35 0.40 0.45 0.50 0.55 0.60 0.65 0.70 VO case CC1 Shadow cost/ (€/m²BVO) equipment installation roofs floors inside walls facade foundation