
Recommended
More Related Content
What's hot
What's hot (20)
Similar to 150 international contractors
Similar to 150 international contractors (20)
Recently uploaded
Recently uploaded (20)
150 international contractors
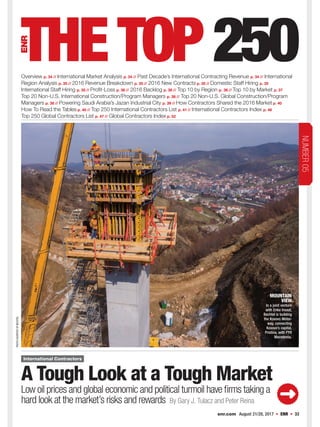
- 1. enr.com August 21/28, 2017 ENR 33 PHOTOCOURTESYOFBECHTEL MOUNTAIN VIEW In a joint venture with Enka Insaat, Bechtel is building the Kosovo Motor- way, connecting Kosovo’s capital, Pristina, with FYR Macedonia. A Tough Look at a Tough Market Low oil prices and global economic and political turmoil have firms taking a hard look at the market’s risks and rewards By Gary J. Tulacz and Peter Reina International Contractors NUMBER05 Overview p. 34 // International Market Analysis p. 34 // Past Decade’s International Contracting Revenue p. 34 // International Region Analysis p. 35 // 2016 Revenue Breakdown p. 35 // 2016 New Contracts p. 35 // Domestic Staff Hiring p. 35 International Staff Hiring p. 35 // Profit-Loss p. 36 // 2016 Backlog p. 36 // Top 10 by Region p. 36 // Top 10 by Market p. 37 Top 20 Non-U.S. International Construction/Program Managers p. 38 // Top 20 Non-U.S. Global Construction/Program Managers p. 38 // Powering Saudi Arabia’s Jazan Industrial City p. 39 // How Contractors Shared the 2016 Market p. 40 How To Read the Tables p. 40 // Top 250 International Contractors List p. 41 // International Contractors Index p. 46 Top 250 Global Contractors List p. 47 // Global Contractors Index p. 52 0821_Top250_Cover_6.indd 33 8/15/17 11:31 AM
- 2. The market for international contractors has been undergoing stresses over the past four years, starting with a drop in commodity metals prices, which curbed the mining sector, closely followed by the collapse in oil prices. International contractors also have had to contend with national political and financial upheavals. The uncertainties in the international construc- tion market can be seen in the results of the ENR Top 250 International Contractors survey. This list ranks firms based on contracting revenue from projects outside of their home countries, measuring their pres- ence in international commerce. ENR’s Top 250 Global Contractors list also ranks contractors based on total worldwide contracting revenue, regardless of project locations. The Top 250 International Contractors reported $468.12 billion in contracting revenue in 2016 from projects outside their home countries, down 6.4%, from $501.14 billion, in 2015. This is the third straight year showing a drop in Top 250 revenue. As a group, firms also reported $927.94 billion in revenue from domestic projects in 2016, up 3.4%, from $897.33 billion, in 2015. On a regional basis, the Middle East was the biggest gainer, up 9.8%, to $84.02 billion, in 2016. This increase still is well below the $91.32 billion earned by the Top 250 in 2012. Europe also saw a modest gain in 2016, rising 2.7%, to $95.99 billion. The international contracting market in Canada continued its free fall, down 18.4%, to $18.72 billion, in 2016 after falling 22.4% last year. The Canadian market is off 45.3% since 2013, reflecting the down- turn in its oil-sands market. The biggest loser was the Latin American market, which declined 42.9% on weakening economies and political turmoil. Among market sectors, the petroleum market is the most prominent one under siege. Revenue from petroleum-related projects among the Top 250 fell 8.6%, to $104.51 billion, in 2016 and is down 16.3% from 2015. The buildings market fell in 2016, down 5.1%, to $101.43 billion, while the power market also sagged, dropping 15.8%, to $45.55 billion. In contrast, the transportation market, the largest international market for the Top 250, has continued to grow through global tumult, rising 3.4%, to $144.38 billion. Greasing the Skids Low oil prices are putting a severe damper on petro- leum projects throughout much of the world. Oil prices per barrel remain in the low $40 range, and many firms believe this price trend will continue for the foreseeable future. An example of the impact of low oil prices was the 34 Ⅲ ENR Ⅲ August 21/28, 2017 enr.com THE TOP 250 INTERNATIONAL CONTRACTORS Water $12,218.8Sewer/Waste $6,013.9 Transportation $144,378.7 Manufacturing $10,097.1 Petroleum $104,507.7 Industrial $14,698.0Telecom $4,769.8 Power $45,552.6 Other $23,258.7 Buildings $101,432.4 Hazardous Waste $1,192.8 0.3% 1.0% 1.3% 2.6% 2.2% 3.1% 5.0% 9.7% 22.3% 30.8% 21.7% SOURCE: ENR (Measured $ millions) Comparing the Past Decade’s International Contractor Revenue *THE 2012 FIGURE IS FOR THE TOP 225 INTERNATIONAL CONTRACTORS. THE EXPANDED TOP 250 LIST FIRMS HAD A COMBINED REVENUE OF $468.1 BILLION. $310.3 2007 $390.0 2008 $383.8 2009 $383.7 2010 $453.0 2011 $468.1 2016 $507.5* 2012 $544.0 2013 (in $ billions) SOURCE: ENR $521.5 2014 $500.1 2015 Int’l Market Analysis “The contracting industry is being affected by the aggressive stand by some government- backed companies from China and Korea with financing offices.” Samer Khoury, President, Engineering and Construction, Consolidated Contractors Group 0821_Top250_Overview.indd 34 8/15/17 11:33 AM
- 3. July 26 announcement by Malaysia’s national oil com- pany, Petronas, that it had cancelled the Pacific North- West LNG project at Port Edward, British Columbia. The decision was a result of “the prolonged depressed prices and shifts in the energy industry,” it noted. Firms in the petroleum market expect more of the same. “Unless oil stabilizes at $50/bbl or above, we should expect the negative trends to continue,” says Samer Khoury, president of engineering and construc- tion at Greece-based Consolidated Contractors Group. But the news is not all bad in the petrochemical arena. Many oil producers are focusing their capital spending on projects to optimize processes and reduce maintenance costs, says Pierroberto Folgiero, CEO of Italy’s Maire Tecnimont Group. “This means pipelines and lots of infrastructure,” he observes. Further, cheap gas is a strong driver in many regions. “The gas-rich USA is kind of the place to be for a downstream contractor,” Folgiero says. Down- stream gas is strong in many regions, whether for export purposes or as feedstock for fertilizer and poly- olefins plants, he notes. On the other hand, the trend toward urbanization has forced nations to invest in infrastructure. “Every nation has drawn the blueprint for the economy [revitalization] and given priority for some large and important projects,” says Li Runyao, commercial manager of China Energy Engineering Corp. Ltd. Urbanization and the subsequent need for sup- porting infrastructure is a global phenomenon. “Egypt, Algeria, Saudi Arabia and Iraq are classified as young, populous, emerging countries with increased demand for infrastructure. These funda- mentals should provide continued opportunities for years to come,” says Osama Bishai, CEO of Egypt’s Orascom Construction. This development has led to a surge in work to support urbanization efforts. The growth of mega- cities and the quest for sustainability are boosting transportation and renewable-energy orders to a de- gree “that had not been the case for decades,” thinks Pietro Salini, CEO of Italy’s Salini Impregilo SpA. Risky Business These trends have caused some large contractors to reassess their portfolios. Many international contrac- tors report having some success in shifting gears. For example, after a period of falling sales, “we are growing again,” says Jérôme Stubler, chairman of Paris-based VINCI Construction. VINCI took this road because of changes in many of its base markets. Cuts in local French government spending hurt VINCI at home in the past few years, says Stubler. At the same time, low oil prices reduced enr.com August 21/28, 2017 ENR 35 OVERVIEW (Measured $ millions) United States $53,595.2 Latin America $30,906.8 North Africa $23,635.8 Europe $95,985.3 Canada $18,717.9 South and Central Africa $37,903.8 20.5% Middle East $84,019.3 17.9% Asia and Australia $120,306.1 25.7% 5.0% 8.1% Arctic/ Antarctic $203.2 0.0% 4.0% Caribbean Islands $2,847.3 0.6% 11.4% 6.6% Domestic Revenue International Revenue Total Revenue Revenue (in $ billions) $1,396.1 $927.9 $468.1 SOURCE: ENR Domestic New Contracts Int’l New Contracts Total New Contracts New Contracts (in $ billions) $1,893.8 $1,386.7 $507.1 SOURCE: ENR Int’l Region Analysis of the Top 250 sent in surveys last year 229 increased international revenue in 2016 48.9% had lower international revenue in 2016 51.1% SOURCE: ENR Increase Decrease Stayed the Same (Measured in firms reporting) Professional International Staff Hiring 80 50 77 Professional Domestic Staff Hiring 83 50 79 0821_Top250_Overview.indd 35 8/15/17 11:38 AM
- 4. demand for its specialty division in that sector and hit infrastructure spending in its African markets, he adds. VINCI retains a network in France’s former African colonies, some of which rely on oil exports. “We see lots of projects, but [they are] lacking financing,” says Stubler. For Sweden’s Skanska AB, the market is “strong in all our geographies,” says Johan Karlström, president and CEO. Compared to last year, orders are up in Nordic and European markets but down in the U.S., where the firm faces “fierce” competition, he adds. Many contractors complain that clients are becoming more demanding and, in some cases, less reliable because of economic upheavals. Lebanon’s Contracting and Trading Co., aka C.A.T. Group, has had some problems pursuing projects “caused by tight cash flows, stricter and riskier contractual terms and conditions, and many cancelled prospects to which we have bid with unclear communication from some clients,” says Georges Hage, group CEO. The Top 10 by Region Domestic Profit Domestic Loss International Profit International Loss Reporting Profit-Loss (Measured in firms reporting) SOURCE: ENR 154 158 37 31 Increase Decrease Stayed the same Total Backlog (Measured in firms reporting) SOURCE: ENR 94 70 52 For expanded content on the ENR Top Lists, see ENR.com/ toplists. Onthe Web 36 ENR August 21/28, 2017 enr.com THE TOP 250 INTERNATIONAL CONTRACTORS 1 ASIA RANK Top 10 Revenue: $56,612.5 Mil. Sector’s Revenue: $120,306.1 Mil.2017 2016 1 4 CHINA COMM. CONSTRUCTION GROUP LTD. 2 2 ACS, ACTIVIDADES DE CONSTRUCCIÓN Y SERVICIOS SA 3 1 HOCHTIEF AKTIENGESELLSCHAFT 4 7 CHINA STATE CONSTRUCTION ENG’G CORP. 5 3 BECHTEL 6 10 CIMIC GROUP LTD. 7 6 POWER CONSTRUCTION CORP. OF CHINA 8 5 SAMSUNG C&T 9 9 HYUNDAI ENG’G & CONSTRUCTION CO. LTD. 10 ** SAIPEM SPA 2 EUROPE RANK Top 10 Revenue: $62,483.1 Mil. Sector’s Revenue: $95,985.3 Mil.2017 2016 1 1 STRABAG 2 2 VINCI 3 8 BECHTEL 4 3 SKANSKA AB 5 ** TECHNIP 6 5 FERROVIAL 7 4 BOUYGUES 8 6 ROYAL BAM GROUP NV 9 9 ACS, ACTIVIDADES DE CONSTRUCCIÓN Y SERVICIOS SA 10 10 RENAISSANCE CONSTRUCTION 3 UNITED STATES RANK Top 10 Revenue: $43,158.1 Mil. Sector’s Revenue: $53,595.2 Mil.2017 2016 1 1 ACS, ACTIVIDADES DE CONSTRUCCIÓN Y SERVICIOS SA 2 2 HOCHTIEF AKTIENGESELLSCHAFT 3 3 SKANSKA AB 4 5 OBAYASHI CORP. 5 7 ORASCOM CONSTRUCTION LTD. 6 8 KAJIMA CORP. 7 6 BOUYGUES 8 ** SALINI IMPREGILO SPA 9 ** FERROVIAL 10 ** OHL SA (OBRASCON HUARTE LAIN SA) 4 MIDDLE EAST RANK Top 10 Revenue: $31,214.1 Mil. Sector’s Revenue: $84,019.3 Mil.2017 2016 1 1 CONSOLIDATED CONTRACTORS GROUP 2 3 PETROFAC LTD. 3 2 HYUNDAI ENG’G & CONSTRUCTION CO. LTD. 4 4 LARSEN & TOUBRO LTD. 5 ** TECNICAS REUNIDAS 6 ** SK E&C 7 8 GS ENGINEERING & CONSTRUCTION 8 6 SAMSUNG C&T 9 10 SAIPEM SPA 10 ** POWER CONSTRUCTION CORP. OF CHINA 5 LATIN AMERICA/CARIBBEAN RANK Top 10 Revenue: $15,661.0 Mil. Sector’s Revenue: $33,754.0 Mil.2017 2016 1 2 ACS, ACTIVIDADES DE CONSTRUCCIÓN Y SERVICIOS SA 2 1 ODEBRECHT ENGENHARIA E CONSTRUCAO SA 3 ** TECHNIP 4 5 OHL SA (OBRASCON HUARTE LAIN SA) 5 ** CITIC CONSTRUCTION CO. LTD. 6 ** CHINA COMM. CONSTRUCTION GROUP LTD. 7 ** POWER CONSTRUCTION CORP. OF CHINA 8 ** VINCI 9 ** SACYR 10 7 HYUNDAI ENG’G & CONSTRUCTION CO. LTD. 6 CANADA RANK Top 10 Revenue: $13,596.2 Mil. Sector’s Revenue: $18,717.9 Mil.2017 2016 1 1 PCL CONSTRUCTION ENTERPRISES INC. 2 3 FLUOR CORP. 3 5 BOUYGUES 4 7 ACS, ACTIVIDADES DE CONSTRUCCIÓN Y SERVICIOS SA 5 4 KIEWIT CORP. 6 6 WORLEYPARSONS 7 8 HOCHTIEF AKTIENGESELLSCHAFT 8 2 BECHTEL 9 ** VINCI 10 10 AECOM 7 AFRICA RANK Top 10 Revenue: $29,592.7 Mil. Sector’s Revenue: $61,539.6 Mil.2017 2016 1 1 CHINA COMM. CONSTRUCTION GROUP LTD. 2 2 POWER CONSTRUCTION CORP. OF CHINA 3 10 CHINA RAILWAY CONSTRUCTION CORP. LTD. 4 3 CHINA RAILWAY GROUP LTD. 5 5 CHINA STATE CONSTR. ENG’G CORP. LTD. 6 4 SAIPEM SPA 7 ** TECHNIP 8 9 ORASCOM CONSTRUCTION LTD. 9 8 VINCI 10 ** DAEWOO ENG’G & CONSTRUCTION CO. LTD. 0821_Top250_Overview.indd 36 8/15/17 11:34 AM
- 5. Many contractors also are concerned about national economic conditions and exchange rates. “The main negative issue we see in the future is the cost of money and the fluctuations in financial markets,” says Cenk Düzyol, a board member of Turkey’s Renaissance Construction. “It has been an uphill battle to sustain cash flow due to hectic international markets and U.S. dollar and euro value fluctuations.” Inflation has hit hard many formerly prosperous markets in Latin America. But other major markets also are experiencing the problem. High inflation in Egypt has increased the cost of investment, says Bishai. “While our contracts have the right provisions and terms that protect us from this, new investors are less likely to develop greenfield projects if the cost of borrowing and investment is elevated,” he adds. Many firms are taking steps to mitigate their risks. On July 14, Skanska said it was booking nearly $100 million of write-downs on troubled U.K. and U.S. projects where unexpected project delays caused costs The Top 10 by Market enr.com August 21/28, 2017 ENR 37 OVERVIEW 1 TRANSPORTATION RANK Top 10 Revenue: $75,234.6 Mil. Sector’s Revenue: $144,378.7 Mil.2017 2016 1 1 CHINA COMM. CONSTRUCTION GROUP LTD. 2 3 ACS, ACTIVIDADES DE CONSTRUCCIÓN Y SERVICIOS SA 3 10 BECHTEL 4 2 VINCI 5 4 BOUYGUES 6 5 STRABAG 7 8 HOCHTIEF AKTIENGESELLSCHAFT 8 7 FERROVIAL 9 9 SKANSKA AB 10 ** SALINI IMPREGILO SPA 2 PETROLEUM RANK Top 10 Revenue: $57,175.2 Mil. Sector’s Revenue: $104,507.7 Mil.2017 2016 1 1 TECHNIP 2 2 SAIPEM SPA 3 5 PETROFAC LTD. 4 3 BECHTEL 5 6 FLUOR CORP. 6 7 TECNICAS REUNIDAS 7 4 JGC CORP. 8 8 CHIYODA CORP. 9 ** ACS, ACTIVIDADES DE CONSTRUCCIÓN Y SERVICIOS SA 10 ** HYUNDAI ENG’G & CONSTRUCTION CO. LTD. 3 BUILDINGS RANK Top 10 Revenue: $51,501.8 Mil. Sector’s Revenue: $101,432.4 Mil.2017 2016 1 2 ACS, ACTIVIDADES DE CONSTRUCCIÓN Y SERVICIOS SA 2 1 HOCHTIEF AKTIENGESELLSCHAFT 3 5 CHINA STATE CONSTR. ENGINEERING CORP. 4 3 SKANSKA AB 5 4 STRABAG 6 6 BOUYGUES 7 10 ROYAL BAM GROUP NV 8 9 KAJIMA CORP. 9 8 PCL CONSTRUCTION ENTERPRISES INC. 10 ** CIMIC GROUP LTD. 4 POWER RANK Top 10 Revenue: $25,744.8 Mil. Sector’s Revenue: $45,552.7 Mil.2017 2016 1 1 POWER CONSTRUCTION CORP. OF CHINA 2 ** CHINA ENERGY ENGINEERING CORP. LTD. 3 3 HYUNDAI ENG’G & CONSTRUCTION CO. LTD. 4 5 VINCI 5 ** SAMSUNG C&T 6 7 ACS, ACTIVIDADES DE CONSTRUCCIÓN Y SERVICIOS SA 7 8 CHINA NATIONAL MACHINERY INDUSTRY CORP. 8 ** HARBIN ELECTRIC INTERNATIONAL CO. LTD. 9 10 LARSEN & TOUBRO LTD. 10 2 ODEBRECHT ENGENHARIA E CONSTRUCAO SA 5 INDUSTRIAL RANK Top 10 Revenue: $9,140.1 Mil. Sector’s Revenue: $14,698.0 Mil.2017 2016 1 2 DANIELI & C. OFFICINE MECCANICHE SPA 2 6 CHINA METALLURGICAL GROUP CORP. 3 1 BECHTEL 4 3 FLUOR CORP. 5 4 ORASCOM CONSTRUCTION LTD. 6 7 STRABAG 7 9 VINCI 8 ** JACOBS 9 ** SINOSTEEL EQUIPMENT & ENG. CO. LTD. 10 ** RENAISSANCE CONSTRUCTION 6 WATER RANK Top 10 Revenue: $6,714.6 Mil. Sector’s Revenue: $12,218.8 Mil.2017 2016 1 1 SALINI IMPREGILO SPA 2 4 OBAYASHI CORP. 3 5 POWER CONSTRUCTION CORP. OF CHINA 4 7 ACS, ACTIVIDADES DE CONSTRUCCIÓN Y SERVICIOS SA 5 2 ODEBRECHT ENGENHARIA E CONSTRUCAO SA 6 3 CHINA COMM. CONSTRUCTION GROUP LTD. 7 9 ACCIONA INFRAESTRUCTURAS 8 6 STRABAG 9 10 CHINA NATIONAL MACHINERY INDUSTRY CORP. 10 ** CGCOC GROUP CO. LTD. 7 MANUFACTURING RANK Top 10 Revenue: $7,271.7 Mil. Sector’s Revenue: $10,097.1 Mil.2017 2016 1 ** CHINA COMM. CONSTRUCTION GROUP LTD. 2 2 SAMSUNG C&T 3 4 SAMSUNG ENGINEERING CO. LTD. 4 6 KAJIMA CORP. 5 5 TAKENAKA CORP. 6 8 WALBRIDGE 7 3 HYUNDAI ENG’G & CONSTRUCTION CO. LTD. 8 7 SHIMIZU CORP. 9 10 ACS, ACTIVIDADES DE CONSTRUCCIÓN Y SERVICIOS SA 10 9 HOCHTIEF AKTIENGESELLSCHAFT 8 SEWER/WASTE RANK Top 10 Revenue: $4,290.2 Mil. Sector’s Revenue: $6,013.9 Mil.2017 2016 1 ** FCC SA 2 ** FERROVIAL 3 ** STANTEC INC. 4 3 SKANSKA AB 5 2 STRABAG 6 7 OBAYASHI CORP. 7 ** POWER CONSTRUCTION CORP. OF CHINA 8 ** CHINA ENERGY ENGINEERING CORP. LTD. 9 6 SALINI IMPREGILO SPA 10 ** BLACK & VEATCH 9 TELECOMMUNICATIONS RANK Top 10 Revenue: $4,604.3 Mil. Sector’s Revenue: $4,769.8 Mil.2017 2016 1 1 VINCI 2 2 ACS, ACTIVIDADES DE CONSTRUCCIÓN Y SERVICIOS SA 3 3 HOCHTIEF AKTIENGESELLSCHAFT 4 ** ZHEJIANG CONSTRUCTION INVESTMENT GRP. CO. LTD. 5 4 SKANSKA AB 6 9 FLUOR CORP. 7 8 STRUCTURE TONE 8 ** DAELIM INDUSTRIAL CO. LTD. 9 ** KINDEN CORP. 10 ** NATA CONST. TOURISM TRADE AND INDUSTRY CO. #59 MAIRE TECNIMONT GROUP and Sinopec Engineering Group won a $3.9-billion contract for work at the Amursky gas plant in Amur, Russia. 0821_Top250_Overview.indd 37 8/15/17 11:34 AM
- 6. to rise, it claimed. This state of affairs has caused Skanska to become more risk-averse. “We will be very selective in new bids,” says Karlström. Salini Impregilo, too, is reducing its risk profile by diversifying from megaprojects to “more regular work,” notes Salini. Its top-10 projects now account for half of total sales, down from two-thirds in 2014. Further, it is cutting in half its 2014 African exposure, aiming to generate 30% of sales in the U.S. this year. Having acquired Connecticut-based Lane Construc- tion Corp. in 2015, Salini now ranks the U.S. as its biggest market. Competition also is ramping up risks in the inter- national market. Some firms are being assisted in the global market by their government’s policies. “The Chinese government has made related beneficial pol- icies for us, such as advocating Chinese enterprises to go globally,” says Li of China Energy Engineering Corp. He notes that China’s Belt and Road Initiative has helped “deepen the cooperation between different nations or regions.” But many old-line contractors are uncomfortable with the level of government assistance given to new competitors. “The contracting industry is being affected by the aggressive stand by some government- backed companies from China and Korea with financ- ing offices. This is something that we are facing more and more,” says Khoury. Europe Shows Some Life The European market has been sluggish for several years, and Britain’s vote last year to exit the European Union caused many contractors to pause. However, the continental market has shown some resilience. In Western Europe, VINCI has been “very success- ful in Paris,” picking up major infrastructure work, says Stubler. And the firm won large contracts this year on the U.K.’s high-speed railroad and the long, Denmark- Germany immersed tube tunnel. Local French govern- ment spending “has been recovering slowly,” he says. Skanska’s Nordic markets are strong, “especially in Sweden,” says Karlström. The U.K.’s planned departure from the EU creates “uncertainties,” he admits. But after a period of weakness, the recovery of Skanska’s business in Poland is growing. Stubler also sees recovery in central and Eastern Europe, supported by EU funding. However, he says Greek construction remains slow. He notes that this year’s completion of vast motorway projects marks the end of an era for Greece (see related story, p. 26). Turkey’s Renaissance Construction is betting big on Europe. In 2013, it acquired Swiss-based Alpine Bau GmbH, Hergiswil, and recently completed the 38 ENR August 21/28, 2017 enr.com THE TOP 250 INTERNATIONAL CONTRACTORS THE TOP 20 NON-U.S. FIRMS IN INTERNATIONAL CONSTRUCTION MANAGEMENT AND PROGRAM MANAGEMENT FEES AGENCY PROGRAM TOTAL CM FEES MGMT. FEE CM / PM RANK FIRM ($ MIL) ($ MIL) ($ MIL) 1 WSP, Montreal, Canada 627.2 535.9 1,163.1 2 ARCADIS NV, Amsterdam, The Netherlands 243.0 462.0 705.0 3 TURNER & TOWNSEND INC., New York, U.S.A. 0.0 579.3 579.3 4 WORLEYPARSONS, North Sydney, Australia 338.0 236.0 574.0 5 DAR GROUP, DUBAI, UAE, Dubai, U.A.E. 207.5 102.7 310.2 6 COLLIERS INTERNATIONAL, Toronto, Canada 213.0 0.0 213.0 7 HOCHTIEF AKTIENGESELLSCHAFT, Essen, Germany 188.0 01.0 189.0 8 TECHNIP, Paris, France 0.0 185.0 185.0 9 KEO INTERNATIONAL CONSULTANTS, Shuwaikh, Kuwait 83.9 35.1 119.0 10 SAMSUNG C&T, Seongnam-si, S. Korea 106.0 0.0 106.0 11 EHAF CONSULTING ENGINEERS, Cairo, Egypt 96.3 0.0 96.3 12 PROJACS INTERNATIONAL, Manama, Bahrain 62.7 12.7 75.4 13 ASSYSTEM, Paris, France 60.0 0.0 60.0 14 ARUP, London, U.K. 43.1 0.0 43.1 15 MANENS-TIFS SPA, Padova, Italy 42.1 0.0 42.1 16 WL MEINHARDT GROUP PTY. LTD., Melbourne, Australia 31.7 0.0 31.7 17 PM GROUP, Dublin, Ireland 30.1 0.0 30.1 18 SNC-LAVALIN INC., MontrÈal, Canada 27.1 0.0 27.1 19 AYESA, Sevilla, Spain 22.1 3.9 26.0 20 HANMIGLOBAL CO. LTD., Seoul, S. Korea 20.1 0.7 20.8 *BASED ON FEES FOR MANAGEMENT SERVICES PROVIDED ON A FEE-ONLY BASIS FOR PROJECTS OUTSIDE THE FIRM’S HOME COUNTRY THE TOP 20 NON-U.S. FIRMS IN TOTAL GLOBAL CONSTRUCTION MANAGEMENT AND PROGRAM MANAGEMENT FEES* AGENCY PROGRAM TOTAL CM FEES MGMT. FEE CM / PM RANK FIRM ($ MIL) ($ MIL) ($ MIL) 1 WSP, Montreal, Canada 771.1 596.0 1,367.1 2 ARCADIS NV, Amsterdam, The Netherlands 269.0 490.0 759.0 3 TURNER & TOWNSEND INC., New York, U.S.A. 0.0 673.2 673.2 4 WORLEYPARSONS, North Sydney, Australia 419.0 238.0 657.0 5 DAR GROUP, DUBAI, UAE, Dubai, U.A.E. 207.5 102.7 310.2 6 COLLIERS INTERNATIONAL, Toronto, Canada 245.0 0.0 245.0 7 HOCHTIEF AKTIENGESELLSCHAFT, Essen, Germany 188.0 3.0 191.0 8 TECHNIP, Paris, France 0.0 185.0 185.0 9 ASTAD, Doha, Qatar 39.1 144.0 183.1 10 EHAF CONSULTING ENGINEERS, Cairo, Egypt 137.1 0.0 137.1 11 KEO INTERNATIONAL CONSULTANTS, Shuwaikh, Kuwait 89.5 37.4 126.9 12 HANMIGLOBAL CO. LTD., Seoul, S. Korea 116.4 3.7 120.1 13 SNC-LAVALIN INC., Montreal, Canada 112.1 0.0 112.1 14 SAMSUNG C&T, Seongnam-si, S. Korea 106.0 0.0 106.0 15 SAUDI CONSULTING SERVICES-SAUDCONSULT, Riyadh, Saudi Arabia 104.5 0.0 104.5 16 ASSYSTEM, Paris, France 93.0 0.0 93.0 17 PROJACS INTERNATIONAL, Manama, Bahrain 65.6 12.7 78.3 18 ARUP, London, U.K. 76.2 0.0 76.2 19 CHINA ALUMINUM INT’L ENGINEERING CORP. LTD., Beijing, China 36.2 26.1 62.3 20 YOOSHIN ENGINEERING CORP., Seoul, S. Korea 53.9 0.0 53.9 *BASED ON FEES FOR MANAGEMENT SERVICES PROVIDED ON A FEE-ONLY BASIS FOR ALL PROJECTS, DOMESTIC AND INTERNATIONAL 0821_Top250_Overview.indd 38 8/15/17 11:34 AM
- 7. OVERVIEW Many firms feel the continuing political and eco- nomic turmoil is harming Middle East work, which “remains one of the most interesting markets,” says Salini. Sanctions on Saudi Arabia and Qatar over claimed terrorist ties and political interference with GCC neighbors’ internal affairs resulted in “some force majeure impact on costs due to some restric- tions on the sourcing of some goods,” he notes. The sanctions on Qatar may have a big impact on contracting in the region. “The political unrest that has manifested in certain geographies—cutting off diplomatic ties with Qatar, along with the imposition of [the] air, land and sea embargo—are weighing on the economic outlook of the Middle East region,” says Subrahmanyan. One surprising trend in the Middle East is the move toward renewable energy. “First we believed that this would be simply a trend that governments would subsidize just to use the green-energy label. However … we witnessed economies of scale that rendered power from renewable energies even more viable than from fossil-fuel sources,” says Hage. In Asia, VINCI is developing a big presence in Aus- tralia through its current acquisition of Seymour Whyte Ltd., which has a focus on transportation work and posted half-year sales of $185 million. With competition for megaprojects already intense, VINCI is looking for more modest, regular business, says Stubler. Among international players targeting Australian megaprojects is Bechtel Inc., which recently became the owner’s delivery management partner for the 15.5 km of twin tunnels and stations on phase two of Syd- ney’s metro. With a long track record in the country’s now-slowing oil, gas and minerals market, the firm is diversifying into civil infrastructure, says Ailie MacAdam, Bechtel’s global leader for rail. Germany’s Hochtief AG, which controls Australia’s CPB Contractors (formerly Leighton Contractors/ Thiess), won a slice of the $2.3-billion Sydney metro tunneling work. Last month, CPB became the civil partner in a joint venture delivering $800 million of rail systems on Melbourne’s new metro. Paris-based Bouygues SA is on that metro’s winning team for a privately financed contract to build the 9 km of twin tunnels and stations. In Perth, Salini Impregilo is “about to start exca- vating an extension of a rail line,” notes Salini. Under a design-build-maintain contract secured last year, the firm leads a joint venture that is boring 8 km of twin tunnels on the Forrestfield-Airport Link. In Latin America, the political environment and limited financial resources are dampening develop- ment, notes Salini. But opportunities exist. “We have enr.com August 21/28, 2017 Ⅲ ENR Ⅲ 39 final acquisition of 100% of Ballast Nedam, the Netherlands. “With these acquisitions, not only are we entering the European market but adding on to what we have on the infrastructure side, as well,” says Cenk Düzyol, a Renaissance board member. Troubled Times in the Middle East The Middle East market has been a mixed bag in the past two years. The continuing weak oil prices and strained fiscal balances of Gulf Cooperation Council (GCC) countries have led to deferment or cancellation of not just oil-and-gas work but also many regional public infrastructure projects. National budget shortfalls have led many Middle Eastern countries to take steps to fill in the funding gap. “The GCC has approved the introduction of a value- added tax in 2018 [and] is also contemplating the intro- duction of other taxes to counteract the fall in revenue due to low oil prices,” says S.N. Subrahmanyan, CEO of India’s Larsen & Toubro. For example, Saudi Arabia has introduced a 2.5% annual tax on “white lands”— that is, undeveloped land designated for residential or commercial use. But many countries in the Middle East continue to press ambitious building plans. For example, Kuwait’s upcoming infrastructure projects for the next 10 years is estimated at $83 billion, says Jalal Chaarawi, business development manager of Kuwait’s Combined Group Contracting Co. He also notes that, with the upcoming 2022 World Cup, there will be increases in infrastructure projects in Qatar. PHOTOCOURTESYOFCONSOLIDATEDCONTRACTORSGROUP As part of the Jazan Industrial City project in Saudi Arabia, Consolidated Contractors Group (No. 19) is working on six sulfur-recovery units on the 3,900-MW integrated gasification combined-cycle power plant. CCC’sPowerMegaproject Energy “The GCC has approved the introduction of a value-added tax in 2018 [and] is also contemplating the introduction of other taxes to counteract the fall in revenues due to low oil prices.” S.N. Subrahmanyan, CEO, Larsen & Toubro Ltd. #91 CONTRACTING AND TRADING CO. C.A.T. is working on Saudi Aramco’s Onshore Maintain Potential Program to maintain upstream infrastructure. 0821_Top250_Overview.indd 39 8/15/17 11:35 AM
- 8. just started excavating a hydraulic tunnel in Buenos Aires,” he says. And VINCI’s specialty unit Sole- tanche Freyssinet SA is spreading into new markets in Latin America with recent wins in Peru and Chile, according to Stubler. Although many contractors continue to see opportunities in Latin America, they recognize the difficulties. “Our best opportunities have been in Latin America, though the region, almost as a whole, faces problems in the national economies,” says Flavio Faria, CEO of Odebrecht Engineering & Construction-Industrial Engineering. Karlström also see “a strong pipeline of projects” in the U.S., although the “Trump effect” has yet to materialize. “We are focusing on core geographies, Companies are ranked according to construction revenue generated outside of each company’s home country in 2016 in U.S. $ millions. Firms not ranked last year are designated **. Some markets may not add up to 100% due to omission of "other" miscellaneous market category and rounding. NA=Not available. †=Includes revenue of subsidiaries, the names of which now are available through www.ENR.com. Figures include prime contracts, shares of joint ventures, subcontracts, design- construct contracts and construction management-at-risk contracts when a firm's risks are similar to those of a general contractor. Figures also include the value of installed equipment when a firm has prime responsibility for specifying and procuring it within the scope of a construction contract. General Building includes commercial buildings, offices, stores, educational facilities, government buildings, hospitals, medical facilities, hotels, apartments, housing, etc. Manufacturing comprises auto, electronic assembly, textile plants, etc. Power comprises thermal and hydroelec- tric power plants, waste-to-energy plants, transmission lines, substations, cogenera- tion plants, etc. Water Supply includes dams, reservoirs, transmission pipelines, distribution mains, irrigation canals, desalination and drinking-water treatment plants, water pumping stations, etc. Sewerage / Solid Waste includes sanitary and storm sewers, treatment plants, pumping plants, incinerators, industrial waste facilities, etc. Industrial Processcomprisespulpand papermills,steelmills,nonferrousmetal refineries,pharmaceuticalplants,chemical plants,foodandotherprocessingplants,etc. Petroleum includes refineries, petrochemical plants, offshore facilities, pipelines, etc. Transportation includes airports, bridges, roads, canals, locks, dredging, marine facilities, piers, railroads, tunnels, etc. Hazardous Waste includes chemical, nuclear waste treatment, asbestos and lead abatement, etc. Telecommunications comprises transmission lines, cabling, towers and antennae, data centers, etc. How To Read the Tables 40 Ⅲ ENR Ⅲ August 21/28, 2017 enr.com THE TOP 250 INTERNATIONAL CONTRACTORS OVERVIEW HOW THE TOP INTERNATIONAL CONTRACTORS SHARED THE 2016 MARKET DESIGNER NATIONALITY # OF FIRMS INT’L REVENUE MIDDLE EAST ASIA AFRICA EUROPE UNITED STATES CANADA LAT. AMER / CARIB. $ MIL. % $ MIL. % $ MIL. % $ MIL. % $ MIL. % $ MIL. % $ MIL. % $ MIL. % AMERICAN 43 41,874.7 8.9 4,440.2 5.3 9,263.3 7.7 1,598.1 2.6 12,757.5 13.3 NA NA 11,033.3 58.9 2,782.5 8.2 CANADIAN 3 3,597.2 0.8 842.3 1.0 1,190.0 1.0 208.4 0.3 339.0 0.4 968.6 1.8 NA NA 48.8 0.1 EUROPEAN 46 210,737.1 45.0 29,594.1 35.2 33,262.1 27.6 14,626.2 23.8 69,591.8 72.5 40,338.5 75.3 5,730.9 30.6 17,593.5 52.1 BRITISH 2 8,817.3 1.9 6,719.6 8.0 330.0 0.3 427.0 0.7 1,232.7 1.3 9.0 0.0 0.0 0.0 99.0 0.3 GERMAN 2 23,560.8 5.0 1,165.2 1.4 8,792.2 7.3 147.3 0.2 1,113.0 1.2 11,204.1 20.9 972.4 5.2 166.6 0.5 FRENCH 3 41,737.3 8.9 1,340.6 1.6 5,850.2 4.9 4,713.7 7.7 21,104.4 22.0 3,774.0 7.0 2,099.7 11.2 2,854.7 8.5 ITALIAN 14 26,673.3 5.7 6,431.1 7.7 4,821.2 4.0 5,781.5 9.4 4,106.9 4.3 2,221.8 4.1 557.5 3.0 2,753.3 8.2 DUTCH 3 8,522.0 1.8 631.4 0.8 847.9 0.7 443.0 0.7 5,979.7 6.2 0.0 0.0 0.0 0.0 620.1 1.8 SPANISH 11 58,988.2 12.6 6,003.4 7.1 11,909.7 9.9 1,147.5 1.9 12,341.5 12.9 16,629.5 31.0 2,042.6 10.9 8,914.1 26.4 OTHER EUROPEAN 11 42,438.1 9.1 7,302.9 8.7 710.9 0.6 1,966.2 3.2 23,713.6 24.7 6,500.1 12.1 58.7 0.3 2,185.6 6.5 AUSTRALIAN 3 8,807.6 1.9 1,797.2 2.1 5,414.0 4.5 152.8 0.2 89.0 0.1 10.0 0.0 1,255.7 6.7 88.9 0.3 JAPANESE 13 24,425.0 5.2 1,433.1 1.7 11,237.9 9.3 282.6 0.5 3,183.2 3.3 7,684.1 14.3 360.2 1.9 244.1 0.7 CHINESE 65 98,722.5 21.1 13,419.2 16.0 38,264.1 31.8 34,559.6 56.2 2,721.0 2.8 1,985.8 3.7 69.7 0.4 7,703.1 22.8 KOREAN 11 33,938.6 7.3 15,387.4 18.3 12,237.3 10.2 2,708.9 4.4 985.6 1.0 410.2 0.8 264.7 1.4 1,944.6 5.8 TURKISH 46 25,591.0 5.5 7,624.7 9.1 8,468.9 7.0 3,136.7 5.1 6,210.4 6.5 148.5 0.3 0.0 0.0 1.8 0.0 BRAZILIAN 2 4,615.8 1.0 91.5 0.1 0.0 0.0 1,468.5 2.4 41.3 0.0 84.9 0.2 0.0 0.0 2,929.6 8.7 ALL OTHERS 18 15,607.9 3.3 9,389.6 11.2 968.4 0.8 2,797.8 4.5 66.6 0.1 1,964.7 3.7 3.6 0.0 417.1 1.2 ALL FIRMS 250 467,917.4 100.0 84,019.3 100.0 120,306.1 100.0 61,539.6 100.0 95,985.3 100.0 53,595.2 100.0 18,717.9 100.0 33,754.0 100.0 SOURCE: ENR. NOTE: EXCLUDING $203.24 MILLION IN ARCTIC/ANTARCTIC OR UNALLOCATED core competencies and selecting projects very care- fully,” he adds. Since President Trump’s revival of U.S. oil pipeline projects, VINCI is “waiting for the bids,” adds Stubler. Several major international contractors have made significant acquisitions to gain entry into the U.S. market. One major transaction was Orascom’s acqui- sition of Des Moines-based contractor The Weitz Co. “In the U.S., we are the EPC contractor on two large, complex industrial projects,” says Bishai of Orascom. He notes that Weitz is building the Iowa Fertilizer Co. plant, the first world-scale nitrogen fertilizer plant to be built in the U.S. in the past 25 years, and Beaumont, Texas-based Natgasoline LLC, the largest merchant methanol plant in the U.S. Ⅲ Sanctions against Qatar resulted in “some force majeure impact on costs.” Pietro Salini, CEO, Salini Impregilo SpA #99 CTCI CORP. is working on the Petronas Refinery and Petrochemicals Integrated Development (RAPID) project in Pengerang, Johor, Malaysia. 0821_Top250_Overview.indd 40 8/15/17 11:35 AM
- 9. GENERALBUILDING WATERSUPPLY TRANSPORTATION MANUFACTURING SEWER/WASTE HAZARDOUSWASTE POWER INDUS./PETROLEUM TELECOM TOTAL 2016 NEW CONTRACTS $ MILINT’LFIRM RANK 2017 2016 2016 REVENUE $ MIL. THE TOP 250 INTERNATIONAL CONTRACTORS 1 1 ACS, ACTIVIDADES DE CONSTRUCCION Y SERVICIOS SA, Madrid, Spain† 32,598.2 37,333.9 32,598.2 34 1 6 2 0 11 30 0 4 2 2 HOCHTIEF AKTIENGESELLSCHAFT, Essen, NRW, Germany† 22,927.0 24,022.0 25,791.0 46 1 0 1 0 5 25 0 5 3 3 CHINA COMMUNICATIONS CONSTRUCTION GROUP LTD., Beijing, China† 21,201.0 70,780.0 36,784.0 6 12 0 2 0 0 79 0 0 4 4 VINCI, Rueil Malmaison, France† 17,367.3 42,667.9 16,269.6 6 0 15 2 0 6 46 1 10 5 5 BECHTEL, San Francisco, Calif., U.S.A.† 16,406.0 24,251.0 4,437.0 0 0 0 1 0 40 59 0 0 6 9 BOUYGUES, Paris, France† 12,257.0 26,354.0 13,107.0 27 0 8 1 0 1 56 2 0 7 7 TECHNIP, Paris, France† 12,113.0 12,230.0 5,484.0 0 0 0 0 0 100 0 0 0 8 10 SKANSKA AB, Stockholm, Sweden† 12,110.0 15,414.0 15,680.0 49 2 5 0 3 4 34 0 1 9 8 STRABAG, Vienna, Austria† 12,008.7 14,220.9 13,202.0 36 0 0 4 3 6 50 0 0 10 11 POWER CONSTRUCTION CORP. OF CHINA, Beijing, China† 11,595.9 43,324.7 27,751.8 9 0 57 7 2 3 19 0 0 11 14 CHINA STATE CONSTRUCTION ENGINEERING CORP. LTD., Beijing, China 10,358.8 124,656.7 17,163.5 63 0 1 1 0 1 34 0 0 12 12 SAIPEM SPA, San Donato Milanese, Italy 8,949.0 9,121.0 324.0 0 0 0 0 0 99 1 0 0 13 16 FERROVIAL, Madrid, Spain 8,943.0 11,834.9 14,939.1 15 0 6 2 13 0 54 0 0 14 13 HYUNDAI ENGINEERING & CONSTRUCTION CO. LTD., Seoul, S. Korea† 8,664.0 17,694.5 7,307.4 11 5 33 0 1 36 14 0 0 15 19 PETROFAC LTD., Jersey, Channel Islands, U.K.† 7,070.0 7,070.0 1,265.0 0 0 0 0 0 100 0 0 0 16 15 FLUOR CORP., Irving, Texas, U.S.A.† 6,952.0 15,185.9 9,700.0 11 1 2 0 0 80 1 3 1 17 27 CIMIC GROUP LTD., North Sydney, NSW, Australia† 6,730.6 18,180.6 8,073.6 31 0 0 4 0 1 44 0 0 18 25 SALINI IMPREGILO SPA, Milan, Italy 6,249.3 6,779.3 8,693.4 4 0 0 20 3 0 61 0 0 19 21 CONSOLIDATED CONTRACTORS GROUP, Athens, Attica, Greece† 6,124.7 6,124.7 3,499.0 19 0 1 0 0 49 30 0 0 20 17 SAMSUNG C&T, Seongnam-si, S. Korea 5,900.0 11,062.0 4,454.0 11 19 37 0 0 9 22 0 0 21 20 CHINA RAILWAY GROUP LTD., Beijing, China† 5,565.6 114,226.0 15,398.4 26 2 0 0 0 0 53 0 0 22 26 TECNICAS REUNIDAS, Madrid, Spain† 5,024.3 5,128.1 1,039.0 0 0 8 1 0 91 1 0 0 23 55 CHINA RAILWAY CONSTRUCTION CORP. LTD., Beijing, China† 4,945.0 94,748.0 14,035.0 32 0 0 1 0 1 63 0 0 24 24 ROYAL BAM GROUP NV, Bunnik, Utrecht, The Netherlands† 4,907.0 7,696.0 NA 61 0 0 0 0 0 39 0 0 25 18 JGC CORP., Yokohama, Japan† 4,395.0 5,020.0 2,326.0 0 0 0 0 0 100 0 0 0 26 30 CHIYODA CORP., Yokohama, Kanagawa, Japan† 4,325.6 5,192.4 1,972.4 0 0 2 0 0 94 3 0 0 27 ** CHINA ENERGY ENGINEERING CORP. LTD., Beijing, China† 4,297.0 24,973.1 17,849.2 5 0 81 6 4 1 4 0 0 28 22 GS ENGINEERING & CONSTRUCTION, Seoul, S. Korea† 4,295.0 9,468.6 1,799.3 5 4 2 0 1 71 16 0 0 29 6 ODEBRECHT ENGENHARIA E CONSTRUCAO SA, Sao Paulo, SP, Brazil† 4,167.8 5,397.6 1,172.0 4 0 29 13 1 13 41 0 0 30 33 OBAYASHI CORP., Tokyo, Japan† 4,009.0 16,270.0 5,595.0 0 0 8 27 7 0 58 0 0 31 23 CHINA NATIONAL MACHINERY INDUSTRY CORP., Beijing, China† 3,992.2 5,760.2 9,434.6 11 1 48 11 1 8 17 0 0 32 34 ORASCOM CONSTRUCTION LTD., Dubai, U.A.E.† 3,975.0 4,033.0 3,692.9 32 0 18 1 0 27 15 0 0 33 37 LARSEN & TOUBRO LTD., Mumbai, Maharashtra, India† 3,974.8 12,707.6 5,044.5 3 0 37 0 1 26 32 0 0 34 29 SAMSUNG ENGINEERING CO. LTD., Seoul, S. Korea† 3,565.8 5,802.5 1,349.0 0 17 3 0 2 77 0 0 0 35 39 SK E&C, Seoul, S. Korea† 3,557.7 6,453.9 254.1 0 0 8 6 0 70 16 0 0 36 31 PCL CONSTRUCTION ENTERPRISES INC., Denver, Colo., U.S.A.† 3,533.6 6,012.3 4,181.6 63 0 4 0 2 26 4 0 0 37 28 OHL SA (OBRASCON HUARTE LAIN SA), Madrid, Spain† 3,375.7 4,248.9 3,333.3 16 0 0 2 0 6 76 0 0 38 44 RENAISSANCE CONSTRUCTION, Ankara, Turkey† 3,257.3 3,932.7 2,149.5 39 2 12 2 0 23 17 0 0 39 57 TOYO ENGINEERING CORP., Chiba, Japan† 3,216.9 3,849.7 843.2 0 0 14 0 0 85 0 0 0 40 43 KAJIMA CORP., Tokyo, Japan† 3,202.2 14,301.8 2,462.5 74 17 1 0 0 3 5 0 0 41 83 FCC SA, Madrid, Spain† 3,190.8 6,595.9 2,827.9 2 0 0 9 40 0 35 2 0 42 40 POLIMEKS INSAAT TAAHHUT VE SAN. TIC. AS, Istanbul, Turkey 2,921.5 2,921.5 NA 51 0 0 0 0 0 38 0 0 43 41 SNC-LAVALIN INC., Montreal, Quebec, Canada† 2,865.2 4,371.7 3,068.9 6 0 14 0 0 76 3 0 0 44 52 JAN DE NUL GROUP (SOFIDRA SA), Capellen, Luxemburg† 2,797.0 2,809.0 2,820.0 7 0 0 0 3 11 33 0 0 45 35 NCC AB, Solna, Sweden 2,775.0 6,184.0 2,474.0 0 0 0 0 0 0 0 0 0 46 51 DAEWOO ENGINEERING & CONSTRUCTION CO. LTD., Seoul, S. Korea 2,764.4 9,072.9 932.0 8 0 29 3 2 35 23 0 0 47 53 ASTALDI, Rome, Italy† 2,656.9 3,139.4 3,672.7 10 0 17 0 0 0 70 0 0 48 49 CHINA METALLURGICAL GROUP CORP., Beijing, China† 2,519.0 29,402.0 11,701.2 37 0 3 0 1 47 2 0 1 49 36 CB&I LLC, The Woodlands, Texas, U.S.A.† 2,506.3 8,462.5 2,606.0 0 0 0 0 0 99 0 0 0 50 67 CHINA NATIONAL CHEMICAL ENGINEERING GROUP CORP., Beijing, China† 2,472.3 7,759.8 2,535.4 1 0 46 3 0 46 0 0 0 enr.com August 21/28, 2017 ENR 41 The Top 250 List 0821_Top250_IC_List.indd 41 8/15/17 11:45 AM
- 10. THE TOP 250 INTERNATIONAL CONTRACTORS GENERALBUILDING WATERSUPPLY TRANSPORTATION MANUFACTURING SEWER/WASTE HAZARDOUSWASTE POWER INDUS./PETROLEUM TELECOM TOTAL 2016 NEW CONTRACTS $ MILINT’LFIRM RANK 2017 2016 2016 REVENUE $ MIL. 51 63 ACCIONA INFRAESTRUCTURAS, Madrid, Spain† 2,287.6 3,785.5 4,261.6 11 3 19 21 2 0 44 0 0 52 47 ROYAL BOSKALIS WESTMINSTER NV, Papendrecht, The Netherlands† 2,253.0 2,861.0 2,202.0 0 0 23 0 0 41 15 0 0 53 75 SINOPEC ENGINEERING (GROUP) CO. LTD., Beijing, China† 2,180.5 5,928.0 1,561.3 0 0 0 0 0 100 0 0 0 54 42 DAELIM INDUSTRIAL CO. LTD., Seoul, S. Korea† 2,161.4 7,094.9 1,855.4 0 8 33 2 0 42 13 0 2 55 66 PORR AG, Vienna, Austria 2,104.0 4,131.0 2,360.0 33 0 0 0 0 0 67 0 0 56 58 CITIC CONSTRUCTION CO. LTD., Beijing, China 2,005.2 2,062.1 1,574.0 71 10 1 5 0 2 7 0 0 57 56 DANIELI & C. OFFICINE MECCANICHE SPA, Friuli Venezia Giulia, Italy† 1,989.0 2,135.0 1,800.0 0 0 0 0 0 100 0 0 0 58 59 MOTA-ENGIL, Porto, Portugal† 1,901.0 2,554.0 2,460.0 22 0 2 8 4 0 63 0 1 59 87 MAIRE TECNIMONT GROUP, Milan, Italy† 1,766.7 2,177.2 1,584.4 0 0 10 0 0 89 1 0 0 60 69 JOANNOU & PARASKEVAIDES GROUP OF COS., Guernsey, Channel Islands, U.K. 1,747.3 1,747.3 2,351.0 41 0 5 0 1 2 52 0 0 61 72 BESIX, Brussels, Belgium† 1,732.5 2,611.3 1,431.6 56 0 0 11 1 0 32 0 0 62 70 SACYR, Madrid, Spain† 1,679.0 3,264.0 1,304.0 8 0 2 5 0 13 71 0 0 63 76 SHAPOORJI PALLONJI AND CO. PVT. LTD., Mumbai, Maharashtra, India† 1,654.5 3,812.2 1,500.0 88 0 0 0 0 0 12 0 0 64 77 QINGJIAN GROUP CO. LTD., Qingdao, Shandong, China† 1,640.4 7,636.2 406.7 96 0 0 0 0 0 3 0 0 65 54 JACOBS, Dallas, Texas, U.S.A. 1,610.1 3,377.7 1,209.4 2 2 3 1 0 90 3 0 0 66 80 PENTA-OCEAN CONSTRUCTION CO. LTD., Tokyo, Japan† 1,527.7 4,002.1 858.3 37 1 0 0 5 2 55 0 0 67 88 HARBIN ELECTRIC INTERNATIONAL CO. LTD., Harbin, Heilongjiang, China 1,502.4 1,502.4 2,388.7 0 0 100 0 0 0 0 0 0 68 50 POSCO ENGINEERING & CONSTRUCTION, Incheon, S. Korea† 1,483.6 5,822.9 NA 14 7 22 0 2 42 12 0 0 69 71 WORLEYPARSONS, North Sydney, NSW, Australia 1,383.0 1,507.0 296.0 0 0 0 0 0 99 0 1 0 70 64 KIEWIT CORP., Omaha, Neb., U.S.A.† 1,362.2 7,861.9 1,021.2 0 0 9 0 0 43 36 0 0 71 65 VAN OORD DREDGING & MARINE CONTRACTORS, Rotterdam,The Netherlands† 1,362.0 1,798.6 2,766.5 0 0 5 0 0 10 85 0 0 72 79 ENKA INSAAT VE SANAYI AS, Istanbul, Turkey† 1,337.4 1,452.7 880.4 17 0 30 0 0 40 13 0 0 73 84 CHINA PETROLEUM ENGINEERING & CONSTRUCTION CORP., Beijing, China† 1,262.7 2,931.4 2,250.8 0 0 0 0 0 100 0 0 0 74 73 SHIMIZU CORP., Tokyo, Japan† 1,259.4 12,567.5 672.7 30 34 0 0 0 19 15 0 0 75 78 TAKENAKA CORP., Osaka, Japan† 1,255.0 9,486.0 738.0 22 42 0 0 0 0 35 0 0 76 81 TAV CONSTRUCTION, Istanbul, Turkey 1,253.0 1,481.7 1,015.6 15 0 0 0 0 0 85 0 0 77 62 KBR, Houston, Texas, U.S.A.† 1,200.0 2,352.0 NA 0 0 0 0 0 100 0 0 0 78 93 YAPI MERKEZI INSAAT VE SANAYI AS, Istanbul, Turkey† 1,170.1 1,237.3 233.0 0 0 0 0 1 0 99 0 0 79 ** ALARKO CONTRACTING GROUP, Istanbul, Turkey 1,071.9 2,730.9 1,037.0 0 0 0 0 3 0 97 0 0 80 85 HANWHA ENGINEERING & CONSTRUCTION CORP., Seoul, S. Korea† 1,017.0 2,697.4 672.0 26 0 10 0 0 54 10 0 0 81 82 AECOM, Los Angeles, Calif., U.S.A.† 982.7 8,322.2 1,509.4 39 2 1 0 0 45 12 0 0 82 90 ARABIAN CONSTRUCTION COMPANY SAL, Beirut, Lebanon† 970.5 1,121.5 1,252.4 85 0 0 2 0 8 0 0 0 83 74 CHINA INTERNATIONAL WATER & ELECTRIC CORP. (CWE), Beijing, China† 935.3 935.3 1,820.5 4 0 42 30 0 3 21 0 0 84 ** TBEA CO. LTD., Changji, Xinjiang, China† 912.7 4,565.5 4,319.8 0 16 84 0 0 0 0 0 0 85 135 LIMAK INSAAT SANAYI VE TICARET AS, Ankara, Turkey 908.0 1,624.0 400.0 5 0 13 0 0 0 82 0 0 86 86 ANT YAPI SANAYI VE TICARET CJSC, Istanbul, Turkey† 889.4 990.2 439.0 100 0 0 0 0 0 0 0 0 87 94 SOCIETA ITALIANA PER CONDOTTE SPA, Rome, Italy† 889.3 1,455.7 643.1 14 0 0 2 0 0 79 0 0 88 68 CHINA PETROLEUM PIPELINE ENG’G CO. LTD., Landfang, Hebei, China† 881.0 2,344.0 2,003.9 0 0 0 0 0 99 0 0 0 89 122 RIZZANI DE ECCHER, Pozzuolo del Friuli, Italy† 869.9 1,026.1 476.2 38 0 0 1 0 0 53 0 0 90 103 CHINA JIANGXI CORP. FOR INT’L ECON. & TECH. COOP., Nanchang, China† 830.3 935.7 1,486.1 43 0 10 11 1 0 34 0 0 91 132 CONTRACTING AND TRADING CO.“C.A.T.”, Beirut, Lebanon† 824.8 825.5 520.0 1 0 0 6 0 87 6 0 0 92 137 GAP INSAAT YATIRIM VE DIS TICARET AS, Istanbul, Turkey 822.6 847.2 NA 31 0 0 0 0 15 54 0 0 93 128 CHINA ELECTRIC POWER EQUIPMENT & TECHN. CO. LTD., Beijing, China† 810.1 1,028.8 115.4 0 0 100 0 0 0 0 0 0 94 117 ZHEJIANG CONSTRUCTION INVESTMENT GRP., Hangzhou, Zhejiang, China† 799.6 10,808.3 920.9 84 0 0 0 1 0 1 0 15 95 111 ZHONGMEI ENGINEERING GROUP LTD., Nanchang, Jiangxi, China† 797.4 797.4 691.2 22 0 1 19 0 0 58 0 0 96 109 CHINA ZHONGYUAN ENGINEERING CORP., Beijing, China 797.3 797.3 NA 0 0 100 0 0 0 0 0 0 97 99 BONATTI SPA, Parma, Emilia Romagna, Italy† 796.0 846.0 701.0 0 0 0 0 0 100 0 0 0 98 ** UNIVERSAL ACARSAN HEALTHCARE & HOSPITAL CONSTR., Gaziantep,Turkey 790.0 790.0 NA 100 0 0 0 0 0 0 0 0 99 100 CTCI CORP., Taipei, Taiwan† 787.0 2,104.1 699.3 0 7 3 0 6 82 2 0 0 100 91 THE ARAB CONTRACTORS CO., Cairo, Egypt† 765.0 2,286.0 1,000.0 34 0 0 1 4 0 60 0 0 42 ENR August 21/28, 2017 enr.com 0821_Top250_IC_List.indd 42 8/15/17 11:45 AM
- 11. GENERALBUILDING WATERSUPPLY TRANSPORTATION MANUFACTURING SEWER/WASTE HAZARDOUSWASTE POWER INDUS./PETROLEUM TELECOM TOTAL 2016 NEW CONTRACTS $ MILINT’LFIRM RANK 2017 2016 2016 REVENUE $ MIL. 101 110 BL HARBERT INTERNATIONAL, Birmingham, Ala., U.S.A. 763.2 1,253.9 870.7 100 0 0 0 0 0 0 0 0 102 97 CGCOC GROUP CO. LTD., Beijing, China† 742.8 748.4 1,197.1 18 0 0 38 2 0 41 0 0 103 112 NORINCO INTERNATIONAL COOPERATION LTD., Beijing, China 741.0 758.3 1,502.4 4 0 49 0 0 1 33 0 0 104 92 CHINA GENERAL TECHNOLOGY (GROUP) HOLDING CO. LTD., Beijing, China† 727.1 2,799.1 2,845.8 0 15 69 2 0 0 15 0 0 105 98 NATA CONSTRUCTION TOURISM TRADE AND INDUSTRY CO., Ankara,Turkey† 718.0 1,124.0 18.0 0 0 0 0 0 0 94 0 6 106 129 CHINA NONFERROUS METAL IND.’S FOREIGN ENG’G & CONSTR., Beijing, China 694.6 762.3 1,657.9 0 0 0 0 0 100 0 0 0 107 ** MCCONNELL DOWELL, Hawthorn, Victoria, Australia 694.0 1,262.0 636.0 9 0 2 17 0 23 37 0 0 108 116 XPCC CONSTRUCTION & ENGINEERING (GROUP) CO., Urumqi, Xinjiang, China† 664.8 4,268.5 NA 64 0 0 1 0 6 29 0 0 109 133 MAPA INSAAT VE TICARET AS, Ankara, Turkey 662.6 1,124.6 120.7 34 0 0 21 0 0 45 0 0 110 101 CALIK ENERJI SAN. VE TIC. AS, Ankara, Turkey† 643.0 643.0 714.5 0 0 100 0 0 0 0 0 0 111 106 BAUER AG, Schrobenhausen, Bavaria, Germany† 633.8 1,022.3 716.7 29 3 18 9 3 11 23 0 4 112 118 TEKFEN CONSTRUCTION AND INSTALLATION CO. INC., Istanbul, Turkey† 623.0 935.0 2,493.0 7 0 0 0 0 9 32 52 0 113 108 C.M.C. DI RAVENNA SOCIETE COOPERATIVA, Ravenna, Italy, Italy† 622.9 1,136.5 1,016.8 1 0 19 29 0 0 43 0 0 114 123 ATLAS TEXAS CONSTRUCTION AND TRADING INC., Katy, Texas, U.S.A.† 622.0 647.0 435.6 100 0 0 0 0 0 0 0 0 115 95 CHINA JIANGSU INT’L ECON.-TECH. COOP. GRP. LTD., Nanjing, Jiangsu, China† 621.5 1,875.6 815.4 85 0 0 5 2 0 8 0 0 116 145 ANHUI FOREIGN ECONOMIC CONSTRUCTION (GROUP) CO. LTD., Anhui, China† 601.4 707.2 367.5 60 0 0 1 0 0 39 0 0 117 105 SHANGHAI CONSTRUCTION GROUP, Shanghai, China 600.5 27,853.4 582.3 43 0 4 0 4 3 46 0 0 118 ** STANTEC INC., Edmonton, Alberta, Canada† 569.0 569.0 341.3 0 0 7 33 59 0 0 0 0 119 113 COMSA CORP., Barcelona, Catalonia, Spain 563.0 1,137.0 NA 0 0 0 0 0 0 87 0 0 120 147 DIA HOLDING FZCO, Dubai, U.A.E.† 555.8 555.8 NA 100 0 0 0 0 0 0 0 0 121 178 IMPRESA PIZZAROTTI & C. SPA, Parma, Italy† 554.2 863.8 1,119.2 61 0 0 2 0 0 37 0 0 122 61 GRUPO ISOLUX CORSAN SA, Madrid, Spain† 553.9 797.8 782.4 0 0 0 0 1 35 64 0 0 123 143 SICIM SPA, Busseto (PR), Italy† 538.0 541.0 700.0 0 0 0 0 0 100 0 0 0 124 125 SINOPEC ZHONGYUAN PETROLEUM ENGINEERING LTD., Puyang City, China† 535.9 982.2 348.3 0 0 0 0 0 100 0 0 0 125 157 SEMBOL ULUSLARARASI YATIRIM TARIM PEYSAJ INSAAT, Istanbul, Turkey 521.0 521.0 NA 100 0 0 0 0 0 0 0 0 126 124 CHINA GEO-ENGINEERING CORP., Beijing, China† 517.3 703.8 679.9 15 0 2 33 1 0 35 0 0 127 131 ZHONGDING INTERNATIONAL ENG’G CO. LTD., Nanching, Jiangxi, China† 514.6 514.6 262.0 68 0 19 0 0 10 1 0 0 128 146 DOGUS INSAAT VE TICARET AS, Istanbul, Turkey† 512.4 732.0 383.0 0 0 0 0 0 0 100 0 0 129 160 SINOSTEEL EQUIPMENT & ENGINEERING CO. LTD., Beijing, China 492.3 1,006.0 1,072.1 0 0 0 0 0 100 0 0 0 130 141 KUZU GROUP, Istanbul, Turkey 475.0 592.2 145.0 100 0 0 0 0 0 0 0 0 131 168 CHINA WU YI CO. LTD., Fuzhou, Fujian, China† 470.0 1,862.0 485.1 31 0 0 3 0 11 53 0 1 132 107 DONGFANG ELECTRIC CORP., Chengdu, Sichuan, China† 464.7 5,291.8 278.5 0 0 100 0 0 0 0 0 0 133 119 CHINA HUANQIU CONTRACTING & ENGINEERING CORP. LTD., Beijing, China† 461.9 1,596.6 3,516.8 0 0 0 0 0 100 0 0 0 134 121 YUKSEL INSAAT CO. INC., Ankara, Turkey† 455.2 596.9 542.4 41 0 0 19 0 0 40 0 0 135 162 TAISEI CORP., Tokyo, Japan† 454.0 12,135.0 44.0 17 0 1 0 0 0 47 0 0 136 134 GHELLA SPA, Rome, Italy† 451.0 687.0 246.0 0 0 14 1 4 0 77 0 0 137 142 WALBRIDGE, Detroit, Mich., U.S.A.† 451.0 1,450.6 179.0 0 100 0 0 0 0 0 0 0 138 96 ANDRADE GUTIERREZ ENGENHARIA, Belo Horizonte, Minas Gerais, Brazil 448.0 1,253.0 33.0 14 0 0 9 0 37 40 0 0 139 167 CHINA SHANDONG INTERNATIONAL ECO. & TECHN. COOP. GRP., Jinan, China 437.1 437.1 315.3 30 0 0 0 0 27 44 0 0 140 151 ONUR TAAHHUT TASIMACILIK INSAAT TICARET VE SANAYI, Ankara, Turkey† 433.9 477.9 240.9 0 0 0 0 0 9 55 0 0 141 249 SHANGHAI ELECTRIC GROUP CO. LTD., Shanghai, China† 432.2 1,129.6 2,737.9 0 0 100 0 0 0 0 0 0 142 115 BEIJING CONSTRUCTION ENGINEERING GROUP CO. LTD., Beijing, China† 429.9 7,178.9 645.5 95 0 0 1 0 0 3 0 0 143 150 JIANGSU NANTONG SANJIAN CONSTR. GROUP CO., Haimen, Jiangsu, China† 428.8 8,370.0 NA 100 0 0 0 0 0 0 0 0 144 165 PUNJ LLOYD LTD., Gurgaon, Haryana, India† 428.0 698.0 48.0 0 0 0 0 0 100 0 0 0 145 140 PER AARSLEFF A/S, Viby J, Denmark† 425.9 1,560.7 421.7 0 49 6 0 1 0 44 0 0 146 183 YANJIAN GROUP CO. LTD., Yantai, Shandong, China† 419.7 1,717.0 382.6 63 10 6 0 0 9 8 0 0 147 127 ANHUI CONSTRUCTION ENGINEERING GROUP CO. LTD., Hefei, Anhui, China† 416.4 7,680.0 46.9 76 0 0 3 5 0 16 0 0 148 188 CADDELL CONSTRUCTION CO. (DE) LLC, Montgomery, Ala., U.S.A. 414.7 576.3 603.8 100 0 0 0 0 0 0 0 0 149 153 SHENYANG YUANDA ALUMINUM INDUS. ENG’G CO. LTD., Shenyang, China† 412.8 1,102.7 528.1 97 0 0 0 0 0 3 0 0 150 130 CHINA HENAN INT’L COOP. GROUP CO. LTD., Zhengzhou, Henan, China 404.8 404.8 1,054.6 0 0 1 6 9 0 84 0 0 enr.com August 21/28, 2017 ENR 43 #22 TECNICAS REUNIDAS AND DAEWOO E&C on Aug. 5 were selected to build a 230,000-bbl-per- day refinery at Al Wusta, Oman. 0821_Top250_IC_List.indd 43 8/15/17 11:45 AM
- 12. THE TOP 250 INTERNATIONAL CONTRACTORS GENERALBUILDING WATERSUPPLY TRANSPORTATION MANUFACTURING SEWER/WASTE HAZARDOUSWASTE POWER INDUS./PETROLEUM TELECOM TOTAL 2016 NEW CONTRACTS $ MILINT’LFIRM RANK 2017 2016 2016 REVENUE $ MIL. 151 148 NUROL CONSTRUCTION AND TRADING CO. INC., Istanbul, Turkey† 392.9 1,128.4 14.3 71 0 0 4 0 0 25 0 0 152 156 SENER INGENIERÌA Y SISTEMAS SA, Las Arenas (Getxo), Vizcaya, Spain† 392.1 406.4 504.6 0 17 65 0 0 18 0 0 0 153 144 SHANGHAI URBAN CONSTRUCTION (GROUP) CORP., Shanghai, China† 388.4 5,420.1 805.3 0 10 0 0 0 0 90 0 0 154 ** GULSAN CONSTRUCTION, Ankara, Turkey 380.8 849.5 NA 0 0 0 0 0 0 100 0 0 155 ** GRUPO EMPRESARIAL SAN JOSE SA, Madrid, Spain† 380.7 646.3 421.9 86 3 0 0 0 0 11 0 0 156 138 ILK CONSTRUCTION, Istanbul, Turkey 376.8 376.8 27.7 27 0 0 0 0 66 7 0 0 157 149 BLACK & VEATCH, Overland Park, Kan., U.S.A.† 363.3 1,637.1 74.1 0 0 36 5 31 28 0 0 0 158 173 ESER CONTRACTING, Ankara, Turkey 360.8 363.8 NA 37 0 0 4 2 0 57 0 0 159 186 YUNNAN CONSTRUCTION & INVEST. HOLDING GROUP CO., Kunming, China† 355.7 355.7 308.5 82 0 3 1 0 5 8 0 0 160 176 SINOPEC OILFIELD SERVICE SHENGLI CORP., Dongying, Shandong, China 344.3 1,221.1 189.0 0 0 0 0 0 100 0 0 0 161 139 GILBANE BUILDING CO., Providence, R.I., U.S.A. 343.2 4,677.1 805.5 41 0 0 0 0 51 2 6 0 162 155 GAMA, Ankara, Turkey† 337.9 803.0 385.2 1 0 75 2 0 21 0 0 0 163 179 CHINA NATIONAL COMPLETE PLANT IMP. & EXP. CORP., Beijing, China† 335.2 335.2 713.4 27 0 0 0 0 73 0 0 0 164 114 METKA, Marousi, Greece† 333.9 464.2 249.2 0 0 98 0 0 0 0 0 0 165 158 STFA CONSTRUCTION GROUP, Istanbul, Turkey 333.7 359.8 481.4 0 0 0 0 1 0 92 0 0 166 ** TEPE INSAAT SANAYI AS, Ankara, Turkey† 333.5 399.0 NA 12 0 0 0 0 52 36 0 0 167 169 KAYI INSAAT SANAYI VE TICARET AS, Istanbul, Turkey† 321.3 341.3 350.0 88 0 0 0 0 12 0 0 0 168 174 ESTA INSAAT SANAYI LOJISTIK VE DIS TIC. ANONIM SIRKETI, Istanbul,Turkey 318.3 318.3 128.5 100 0 0 0 0 0 0 0 0 169 ** WOOD GROUP, Houston, Texas, U.S.A.† 317.4 1,499.6 289.5 0 0 0 0 0 99 0 0 0 170 191 TTCL PUBLIC CO. LTD., Bangkok, Thailand† 317.0 488.0 NA 0 0 11 25 0 64 0 0 0 171 ** CHINA NUCLEAR ENGINEERING CORP. LTD., Beijing, China† 316.0 4,923.8 1,247.2 16 0 50 0 1 21 7 0 0 172 203 LOTTE ENGINEERING & CONSTRUCTION CO. LTD., Seoul, S. Korea† 302.6 4,039.6 189.5 17 0 18 0 0 47 18 0 0 173 180 COMBINED GROUP CONTRACTING CO. (K.S.C.), Safat, Kuwait 301.5 757.2 310.4 70 0 0 0 0 0 30 0 0 174 215 THE WALSH GROUP LTD., Chicago, Ill., U.S.A.† 298.6 5,052.2 281.5 57 0 0 0 16 0 25 0 2 175 182 IC ICTAS INSAAT SANAYI VE TICARET AS, Istanbul, Turkey† 285.7 917.5 NA 0 0 0 0 0 0 100 0 0 176 193 ASLAN YAPI VE TICARET AS, Ankara, Turkey 273.0 275.2 85.3 100 0 0 0 0 0 0 0 0 177 ** SHANGDONG DEJIAN GROUP CO. LTD., Dezhou City, Shandong, China 270.3 752.2 29.6 88 0 0 0 0 11 0 0 0 178 159 MOHAMMED ABDULMOHSIN AL-KHARAFI WLL, Kuwait City, Kuwait† 268.7 738.5 262.0 13 0 0 32 22 0 31 0 0 179 185 NANTONG CONSTRUCTION GROUP CO. LTD., Nantong, Jiangsu, China† 264.2 2,414.3 41.2 91 0 0 0 0 9 0 0 0 180 171 BEIJING URBAN CONSTRUCTION GROUP CO. LTD., Beijing, China† 263.6 9,653.0 485.1 69 0 0 0 3 2 26 0 0 181 194 CHINA DALIAN INT’L ECO. & TECH. COOP. GRP. LTD., Dalian, Liaoning, China† 259.5 284.0 90.9 26 0 0 0 0 5 69 0 0 182 152 GYM (GRANA Y MONTERO), Lima, Peru 254.0 1,185.0 211.0 3 0 0 0 0 38 0 0 0 183 187 KINDEN CORP., Tokyo, Japan 253.0 4,296.0 NA 23 32 1 4 4 16 3 0 18 184 175 HAZAMA ANDO CORP., Tokyo, Japan 249.0 3,351.0 NA 8 64 0 5 0 9 13 0 0 185 204 JIANGSU NANTONG LIUJIAN CONSTR. GROUP CO., Rugao City, Jiangsu, China† 241.5 4,576.4 107.0 100 0 0 0 0 0 0 0 0 186 217 METAG INSAAT TICARET AS, Ankara, Turkey 235.3 270.0 64.1 4 14 0 0 0 0 82 0 0 187 206 SMK GROUP, Ankara, Turkey 235.3 285.5 64.1 4 0 0 14 0 0 82 0 0 188 190 STRUCTURE TONE, New York, N.Y., U.S.A.† 227.1 4,010.6 198.0 77 0 0 0 0 0 0 0 23 189 154 SSANGYONG ENGINEERING & CONSTRUCTION CO. LTD., Seoul, S. Korea† 227.0 704.0 438.0 65 0 0 0 0 0 35 0 0 190 222 AE ARMA-ELECTROPANC, Istanbul, Turkey† 226.7 262.8 109.1 77 0 0 0 0 0 23 0 0 191 228 BARNARD CONSTRUCTION CO. INC., Bozeman, Mont., U.S.A.† 220.9 617.0 NA 0 0 100 0 0 0 0 0 0 192 221 MATRIX SERVICE CO., Tulsa, Okla., U.S.A.† 217.8 1,323.5 NA 0 0 78 0 0 22 0 0 0 193 196 CHINA GANSU INT’L CORP. FOR ECO. & TECHN. COOP., Lanzhou, China† 216.3 261.2 372.7 41 0 2 0 0 29 28 0 0 194 195 SUMMA TURIZM YATIRIMCILIGI AS, Ankara, Turkey† 210.9 210.9 153.0 75 0 0 0 0 0 25 0 0 195 126 ALBERICI-FLINTCO, St. Louis, Mo., U.S.A.† 210.3 2,003.8 277.5 3 4 1 5 1 85 2 0 0 196 200 BAYBURT GRUP AS, Ankara, Turkey† 206.3 790.9 NA 0 0 0 0 0 0 100 0 0 197 177 ICM SPA IMPRESA COSTRUZIONI MALTAURO, Vicenza, Italy 204.0 346.9 398.8 66 0 0 4 0 0 30 0 0 198 ** CENTURI CONSTRUCTION GROUP, Phoenix, Ariz., U.S.A.† 203.9 1,139.1 166.2 0 0 0 0 5 95 0 0 0 199 192 SUMITOMO MITSUI CONSTRUCTION CO. LTD., Tokyo, Japan† 201.4 2,724.9 170.6 5 20 0 13 0 0 61 0 0 200 231 ANEL ELEKTRIK, Istanbul, Turkey† 198.7 216.1 324.0 7 0 1 0 0 0 93 0 0 44 ENR August 21/28, 2017 enr.com 0821_Top250_IC_List.indd 44 8/15/17 11:45 AM
- 13. GENERALBUILDING WATERSUPPLY TRANSPORTATION MANUFACTURING SEWER/WASTE HAZARDOUSWASTE POWER INDUS./PETROLEUM TELECOM TOTAL 2016 NEW CONTRACTS $ MILINT’LFIRM RANK 2017 2016 2016 REVENUE $ MIL. 201 198 PETRO. PROJECTS & TECH. CONSULTATIONS CO. (PETROJET), Cairo, Egypt 192.7 1,154.3 192.7 14 0 0 0 0 79 0 0 0 202 211 YANTAI INT’L ECO. & TECHN. COOP. GRP. CO. LTD., Yantai, Shandong, China† 183.7 274.7 210.0 100 0 0 0 0 0 0 0 0 203 213 CHONGQING INT’L CONSTRUCTION CORP., Chongqing, China† 182.7 642.7 261.1 4 0 0 1 1 0 94 0 0 204 ** MORTENSON CONSTRUCTION, Minneapolis, Minn., U.S.A.† 179.5 3,816.6 12.7 0 0 100 0 0 0 0 0 0 205 239 DCK WORLDWIDE LLC, Pittsburgh, Pa., U.S.A.† 175.6 275.7 165.7 100 0 0 0 0 0 0 0 0 206 226 YENIGUN CONSTRUCTION INDUSTRY AND COMMERCE INC., Ankara, Turkey† 173.8 497.6 52.0 79 0 0 0 0 16 5 0 0 207 223 TUTOR PERINI CORP., Sylmar, Calif., U.S.A.† 170.7 5,711.9 86.6 42 0 0 0 0 0 58 0 0 208 ** BARTON MALOW CO., Southfield, Mich., U.S.A. 170.0 2,425.5 8.6 0 98 2 0 0 0 0 0 0 209 ** GRAHAM, Calgary, Alberta, Canada† 163.0 1,655.0 63.0 79 3 0 0 0 2 17 0 0 210 218 ZHEJIANG COMMUNICATIONS CONSTRUCTION GROUP CO., Hangzhou, China† 161.6 2,145.5 414.9 0 0 0 4 0 0 96 0 0 211 235 PARSONS, Pasadena, Calif., U.S.A.† 160.4 485.3 NA 48 0 0 0 0 0 52 0 0 212 202 AEGION CORP., Chesterfield, Mo., U.S.A. 159.0 849.0 NA 6 0 0 0 58 32 4 0 0 213 210 AMEC FOSTER WHEELER, Atlanta, Ga., U.S.A.† 159.0 1,540.0 121.8 13 1 19 1 0 42 0 0 0 214 227 AMERICAN BRIDGE CO., Coraopolis, Pa., U.S.A.† 152.6 472.3 80.5 0 0 0 0 0 0 100 0 0 215 164 MICHELS CORP., Brownsville, Wis., U.S.A. 148.0 1,979.0 139.6 0 0 0 0 1 99 0 0 0 216 ** GURBAG GROUP, Ankara, Turkey† 140.4 141.2 NA 64 0 0 36 0 0 0 0 0 217 181 ANSALDO ENERGIA SPA, Genova, Italy 137.1 151.2 241.9 0 0 100 0 0 0 0 0 0 218 205 HENSEL PHELPS, Greeley, Colo., U.S.A.† 135.3 3,547.1 19.4 0 100 0 0 0 0 0 0 0 219 241 MICHAEL BAKER INTERNATIONAL, Pittsburgh, Pa., U.S.A.† 134.1 134.1 36.0 21 0 0 0 0 0 79 0 0 220 ** PINGGAO GROUP CO. LTD., Pingdingshan, Henan, China† 132.1 232.5 119.2 0 0 100 0 0 0 0 0 0 221 219 RAILWORKS CORP., New York, N.Y., U.S.A.† 129.8 611.4 78.4 0 0 0 0 0 0 100 0 0 222 216 ENERGOPROJEKT HOLDING PLC, Belgrade, Serbia† 125.4 255.3 82.8 55 0 13 0 0 0 33 0 0 223 184 CENGIZ CONSTRUCTION INDUSTRY & TRADE CO. INC., Istanbul, Turkey 124.5 1,368.0 174.2 0 0 0 0 0 0 61 0 0 224 246 KOLIN INSAAT TURIZM SANAYI VE TICARET AS, Ankara, Turkey† 120.3 1,197.2 1,007.3 0 0 0 9 0 2 89 0 0 225 ** DEKINSAN GRUP INSAAT AS, Ankara, Turkey 118.5 120.5 233.5 100 0 0 0 0 0 0 0 0 226 ** MAKYOL INSAAT SANAYI TURIZM VE TICARET AS, Istanbul, Turkey 118.0 1,003.0 NA 0 0 0 0 0 0 100 0 0 227 208 ECC, Burlingame, Calif., U.S.A.† 117.3 202.8 42.7 50 0 7 24 0 2 0 17 0 228 ** JIANGSU ZHONGNAN CONSTR. INDUS. GROUP CO., Haimen, Jiangsu, China† 113.8 6,630.4 86.6 100 0 0 0 0 0 0 0 0 229 189 SHANDONG ZIJIAN CONSTRUCTION GROUP CO. LTD., Zibo, Shandong, China 110.3 1,333.0 59.8 100 0 0 0 0 0 0 0 0 230 ** CHINA TRIUMPH INTERNATIONAL ENGINEERING CO. LTD., Shanghai, China† 106.3 702.5 563.1 0 0 0 0 0 100 0 0 0 231 247 ENG’G FOR THE PETROLEUM & PROCESS INDUSTRIES “ENPPI”, Cairo, Egypt† 95.5 236.7 42.4 0 0 0 0 0 100 0 0 0 232 ** THE CONTI GROUP, Edison, N.J., U.S.A. 92.9 364.4 93.6 75 0 11 0 0 11 0 2 0 233 224 ZAFER TAAHHUT INSAAT VE TICARET AS, Ankara, Turkey 92.1 161.5 109.5 96 4 0 0 0 0 0 0 0 234 ** SALFACORP SA, Santiago, Region Metropolitana, Chile† 91.0 996.0 124.0 100 0 0 0 0 0 0 0 0 235 197 KAYSON, Tehran, Iran† 89.9 257.6 NA 85 0 0 10 0 0 4 0 0 236 ** PERNIX GROUP INC., Lombard, Ill., U.S.A.† 86.0 299.4 226.5 93 0 7 0 0 0 0 0 0 237 237 WEEKS MARINE INC., Cranford, N.J., U.S.A.† 85.1 780.0 35.6 0 0 0 90 0 0 3 7 0 238 240 SOUTHLAND/RENDA/JBROS, Roanoke, Texas, U.S.A.† 83.5 484.6 NA 0 0 0 100 0 0 0 0 0 239 ** POLAT YOL YAPI SANAYI VE TICARET AS, Istanbul, Turkey† 79.6 190.5 145.4 0 0 0 0 0 0 100 0 0 240 ** BEIJING UNI-CONSTRUCTION GROUP CO. LTD., Beijing, China 79.4 7,243.7 13.8 100 0 0 0 0 0 0 0 0 241 232 TODA CORP., Tokyo, Japan† 77.0 3,648.0 99.0 23 42 0 10 0 25 0 0 0 242 234 HASKELL, Jacksonville, Fla., U.S.A.† 74.5 753.3 67.3 0 5 0 0 0 95 0 0 0 243 220 BURNS & MCDONNELL, Kansas City, Mo., U.S.A. 73.4 1,090.1 NA 0 0 100 0 0 0 0 0 0 244 ** CABA INSAAT ENERJI TURIZM SANAYI VE TICARET AS, Ankara, Turkey† 73.0 95.0 NA 100 0 0 0 0 0 0 0 0 245 ** CHINA ALUMINUM INTERNATIONAL ENGINEERING CORP. LTD., Beijing, China† 67.1 2,233.3 608.7 45 0 0 0 0 55 0 0 0 246 ** MCM, Miami, Fla., U.S.A. 62.8 327.9 43.4 65 0 0 3 0 0 33 0 0 247 244 ELECTRA LTD., Ramat Gan, Israel† 62.2 1,444.2 41.4 100 0 0 0 0 0 0 0 0 248 ** BALFOUR BEATTY US, Dallas, Texas, U.S.A.† 59.8 4,640.5 NA 100 0 0 0 0 0 0 0 0 249 225 GREAT LAKES DREDGE & DOCK, Oak Brook, Ill., U.S.A. 59.4 767.6 77.3 0 0 0 0 0 0 100 0 0 250 ** MBD INSAAT SANAYI TURIZM M¸HENDISLIK VE TIC., Ankara, Turkey† 58.0 70.0 22.0 100 0 0 0 0 0 0 0 0 enr.com August 21/28, 2017 ENR 45 #27 CHINA ENERGY ENGINEERING CORP. is building two 600-MW coal-fired power-plant units in Hai Duong Province, Vietnam. 0821_Top250_IC_List.indd 45 8/15/17 11:45 AM
- 14. RANK RANK RANK RANKFIRM FIRM FIRM FIRM Where to find the Top 250 THE TOP 250 INTERNATIONAL CONTRACTORS DIRECTORY 46 ENR August 21/28, 2017 enr.com A ACCIONA Infraestructuras51 ACS,Actividades de Construccion y Servicios SA 1 AE Arma-Electropanc 190 AECOM81 Aegion Corp. 212 Alarko Contracting Group 79 Alberici-Flintco195 Amec Foster Wheeler 213 American Bridge Co. 214 Andrade Gutierrez Engenharia 138 Anel Elektrik 200 Anhui Construction Engineering Group Co. Ltd. 147 Anhui Foreign Economic Construction (Group) Co. Ltd. 116 Ansaldo Energia SpA 217 Ant Yapi Sanayi ve Ticaret CJSC 86 The Arab Contractors Co. 100 Arabian Construction Company SAL 82 Aslan Yapi ve Ticaret AS 176 Astaldi47 Atlas Texas Construction and Trading Inc.114 B Michael Baker International219 Balfour Beatty US 248 Barnard Construction Co. Inc. 191 Barton Malow Co. 208 Bauer AG 111 Bayburt Grup AS 196 Bechtel5 Beijing Construction Engineering Group Co. Ltd. 142 Beijing Uni-Construction Group Co. Ltd. 240 Beijing Urban Construction Group Co. Ltd. 180 BESIX61 Black Veatch 157 Bonatti SpA 97 Bouygues6 Burns McDonnell243 C C.M.C. di Ravenna Societe Cooperativa 113 Caba Insaat Enerji Turizm Sanayi Ve Ticaret AS 244 Caddell Construction Co. (DE) LLC 148 Calik Enerji San.Ve Tic.AS 110 CBI LLC 49 Cengiz Construction Industry Trade Co. Inc. 223 Centuri Construction Group 198 CGCOC Group Co. Ltd. 102 China Aluminum International Engineering Corp. Ltd.245 China Communications Construction Group Ltd. 3 China Dalian Int’l Eco. Tech. Coop. Grp. Ltd. 181 China Electric Power Equipment and Technology Co. Ltd. 93 China Energy Engineering Corp. Ltd. 27 China Gansu Int’l Corp. for Eco. Techn. Coop. 193 China General Technology (Group) Holding Co. Ltd. 104 China Geo-Engineering Corp. 126 China Henan International Coop. Group Co. Ltd. 150 China HuanQiu Contracting Engineering Corp. Ltd.133 China International Water Electric Corp. (CWE) 83 China Jiangsu Int’l Econ.-Tech. Coop. Grp. Ltd. 115 China Jiangxi Corp. for Int’l Economic Technical Cooperation 90 China Metallurgical Group Corp. 48 China National Chemical Engineering Group Corp. 50 China National Complete Plant Imp. Exp. Corp. (Group) 163 China National Machinery Industry Corp. 31 China Nonferrous Metal Ind.’s Foreign Eng’g Constr. Co. Ltd. 106 China Nuclear Engineering Corp. Ltd. 171 China Petroleum Engineering Construction Corp. 73 China Petroleum Pipeline Engineering Co. Ltd. (CPP) 88 China Railway Construction Corp. Ltd. 23 China Railway Group Ltd. 21 China Shandong International Eco. Techn. Coop. Grp. Ltd. 139 China State Construction Engineering Corp. Ltd. 11 China Triumph International Engineering Co. Ltd. 230 China Wu Yi Co. Ltd. 131 China Zhongyuan Engineering Corp. 96 Chiyoda Corp. 26 Chongqing Int’l Construction Corp. 203 CIMIC Group Ltd. 17 CITIC Construction Co. Ltd. 56 Combined Group Contracting Co. (K.S.C.) 173 COMSA Corp. 119 Consolidated Contractors Group 19 The Conti Group 232 Contracting and Trading Co.“C.A.T.” 91 CTCI Corp.99 D Daelim Industrial Co. Ltd. 54 Daewoo Engineering Construction Co. Ltd. 46 Danieli C. Officine Meccaniche SpA 57 dck worldwide LLC 205 Jan De Nul Group (Sofidra SA) 44 Dekinsan Grup Insaat AS 225 Dia Holding FZCO 120 Dogus Insaat ve Ticaret AS 128 Dongfang Electric Corp.132 E ECC227 Electra Ltd.247 Energoprojekt Holding plc222 Engineering for the Petroleum Process Industries “Enppi”231 Enka Insaat ve Sanayi AS72 Eser Contracting158 Esta Insaat Sanayi Lojistik ve Dis Ticaret Anonim Sirketi168 F FCC SA41 Ferrovial13 Fluor Corp.16 G GAMA162 Gap Insaat Yatirim ve Dis Ticaret AS 92 Ghella SpA 136 Gilbane Building Co. 161 Graham209 Great Lakes Dredge Dock 249 Grupo Empresarial San Jose SA 155 GS Engineering Construction 28 Gulsan Construction 154 Gurbag Group 216 GyM (Grana y Montero)182 H Hanwha Engineering Construction Corp. 80 BL Harbert International 101 Harbin Electric International Co. Ltd. 67 Haskell242 Hazama Ando Corp. 184 Hensel Phelps 218 HOCHTIEF Aktiengesellschaft 2 Hyundai Engineering Construction Co. Ltd.14 I IC Ictas Insaat Sanayi Ve Ticaret AS 175 ICM SpA Impresa Costruzioni Maltauro 197 Ilk Construction 156 Impresa Pizzarotti C. SpA 121 Grupo Isolux Corsan SA122 J Jacobs65 JGC Corp. 25 Jiangsu Nantong Liujian Constr. Group Co. Ltd. 185 Jiangsu Nantong Sanjian Constr. Group Co. Ltd. 143 Jiangsu Zhongnan Constr. Industry Group Co. Ltd. 228 Joannou Paraskevaides Group of Cos.60 K Kajima Corp.40 Kayi Insaat Sanayi ve Ticaret AS 167 Kayson235 KBR77 Kiewit Corp. 70 Kinden Corp. 183 Kolin Insaat Turizm Sanayi ve Ticaret AS 224 Kuzu Group130 L Larsen Toubro Ltd.33 Limak Insaat Sanayi Ve Ticaret AS85 Lotte Engineering Construction Co. Ltd.172 M Maire Tecnimont Group 59 Makyol Insaat Sanayi Turizm ve Ticaret AS 226 Mapa Insaat ve Ticaret AS 109 Matrix Service Co. 192 MBD Insaat Sanayi Turizm Muhendislik ve Tic. Ltd. Sirketi 250 McConnell Dowell 107 MCM246 Metag Insaat Ticaret AS 186 Metka164 Michels Corp. 215 Mohammed Abdulmohsin Al-Kharafi for Gen. Trading Contracting Ind’l Structures WLL 178 Mortenson Construction 204 Mota-Engil58 N Nantong Construction Group Co. Ltd. 179 Nata Construction Tourism Trade and Industry Co. 105 NCC AB 45 Norinco International Cooperation Ltd. 103 Nurol Construction and Trading Co. Inc.151 O Obayashi Corp. 30 Odebrecht Engenharia e Construcao SA 29 OHL SA (Obrascon Huarte Lain SA) 37 Onur Taahhut Tasimacilik Insaat Ticaret Ve Sanayi AS 140 Orascom Construction Ltd.32 P Parsons211 PCL Construction Enterprises Inc. 36 Penta-Ocean Construction Co. Ltd. 66 Per Aarsleff A/S 145 Pernix Group Inc. 236 Petrofac Ltd. 15 The Petroleum Projects and Technical Consultations Co. (PETROJET) 201 Pinggao Group Co. Ltd. 220 Polat Yol Yapi Sanayi Ve Ticaret AS 239 Polimeks Insaat Taahhut ve San.Tic.AS 42 Porr AG 55 POSCO Engineering Construction 68 Power Construction Corp. of China 10 Punj Lloyd Ltd.144 Q Qingjian Group Co. Ltd.64 R RailWorks Corp. 221 Renaissance Construction 38 Rizzani de Eccher 89 Royal BAM Group NV 24 Royal Boskalis Westminster NV52 S Sacyr62 Saipem SpA 12 Salfacorp SA 234 Salini Impregilo SpA 18 Samsung CT 20 Samsung Engineering Co. Ltd. 34 Sembol Uluslararasi Yatirim Tarim Peysaj Insaat Turizm Sanayi Ve Tic.AS 125 Sener IngenierÌa y Sistemas SA 152 Shandong Zijian Construction Group Co. Ltd. 229 Shangdong Dejian Group Co. Ltd. 177 Shanghai Construction Group 117 Shanghai Electric Group Co. Ltd. 141 Shanghai Urban Construction (Group) Corp. 153 Shapoorji Pallonji and Co. Pvt. Ltd. - Engineering Construction 63 Shenyang Yuanda Aluminum Industry Engineering Co. Ltd. 149 Shimizu Corp. 74 SICIM SpA 123 Sinopec Engineering (Group) Co. Ltd. 53 Sinopec Oilfield Service Shengli Corp. 160 Sinopec Zhongyuan Petroleum Engineering Ltd. 124 Sinosteel Equipment Engineering Co. Ltd. 129 SK EC 35 Skanska AB 8 SMK Group 187 SNC-Lavalin Inc. 43 Societa’ Italiana Per Condotte SpA 87 Southland/Renda/JBros238 Ssangyong Engineering Construction Co. Ltd. 189 Stantec Inc. 118 STFA Construction Group 165 Strabag9 Structure Tone 188 Sumitomo Mitsui Construction Co. Ltd. 199 Summa Turizm Yatirimciligi AS194 T Taisei Corp. 135 Takenaka Corp. 75 TAV Construction 76 TBEA Co. Ltd. 84 Technip7 Tecnicas Reunidas 22 Tekfen Construction and Installation Co. Inc. 112 Tepe Insaat Sanayi AS 166 Toda Corp. 241 Toyo Engineering Corp. 39 TTCL Public Co. Ltd. 170 Tutor Perini Corp.207 U Universal Acarsan Healthcare and Hospital Construction Ltd. Co.98 V Van Oord Dredging Marine Contractors BV71 VINCI4 W Walbridge137 The Walsh Group Ltd.174 Weeks Marine Inc.237 Wood Group169 WorleyParsons69 X XPCC Construction Engineering (Group) Co. Ltd.108 Y Yanjian Group Co. Ltd. 146 Yantai International Eco. Techn. Cooperation Grp. Co. Ltd. 202 Yapi Merkezi Insaat ve Sanayi AS 78 Yenigun Construction Industry and Commerce Inc. 206 Yuksel Insaat Co. Inc. 134 Yunnan Construction and Investment Holding Group Co. Ltd.159 Z Zafer Taahhut Insaat Ve Ticaret AS 233 Zhejiang Communications Construction Group Co. Ltd. 210 Zhejiang Construction Investment Grp. Co. Ltd. 94 ZhongDing International Engineering Co. Ltd. 127 Zhongmei Engineering Group Ltd. 95 0821_Top250_IC_WTF.indd 46 8/15/17 11:47 AM
- 15. GENERALBUILDING WATERSUPPLY TRANSPORTATION MANUFACTURING SEWER/WASTE HAZARDOUSWASTE POWER INDUS./PETROLEUM TELECOM INT'L 2016 NEW CONTRACTS $ MILTOTALFIRM RANK 2017 2016 2016 REVENUE $ MIL. THE TOP 250 GLOBAL CONTRACTORS 1 1 CHINA STATE CONSTRUCTION ENGINEERING CORP. LTD., Beijing, China 124,656.7 10,358.8 289,048.0 76 2 1 1 1 1 17 0 0 2 2 CHINA RAILWAY GROUP LTD., Beijing, China 114,226.0 5,565.6 184,328.4 19 3 0 0 0 0 63 0 0 3 3 CHINA RAILWAY CONSTRUCTION CORP. LTD., Beijing, China 94,748.0 4,945.0 181,335.0 19 2 0 2 0 0 75 0 0 4 4 CHINA COMMUNICATIONS CONSTRUCTION GROUP LTD., Beijing, China 70,780.0 21,201.0 143,192.2 13 4 2 4 1 0 75 0 0 5 6 POWER CONSTRUCTION CORP. OF CHINA, Beijing, China 43,324.7 11,595.9 77,727.6 8 0 42 9 0 1 28 0 0 6 5 VINCI, Rueil Malmaison, France 42,667.9 17,367.3 35,267.2 12 0 13 2 0 4 37 1 8 7 7 ACS, ACTIVIDADES DE CONSTRUCCION Y SERVICIOS SA, Madrid, Spain 37,333.9 32,598.2 37,333.9 31 1 8 3 0 9 30 0 4 8 8 CHINA METALLURGICAL GROUP CORP., Beijing, China 29,402.0 2,519.0 70,124.5 51 3 2 0 1 25 13 1 0 9 10 SHANGHAI CONSTRUCTION GROUP, Shanghai, China 27,853.4 600.5 25,072.2 79 5 0 0 3 0 11 0 0 10 9 BOUYGUES, Paris, France 26,354.0 12,257.0 28,245.0 38 0 6 1 0 1 47 2 1 11 ** CHINA ENERGY ENGINEERING CORP. LTD., Beijing, China 24,973.1 4,297.0 61,494.5 6 0 62 7 9 6 8 0 0 12 12 BECHTEL, San Francisco, Calif., U.S.A. 24,251.0 16,406.0 12,502.0 0 0 8 1 0 47 40 4 1 13 11 HOCHTIEF AKTIENGESELLSCHAFT, Essen, NRW, Germany 24,022.0 22,927.0 27,281.0 46 1 0 1 0 5 25 0 5 14 26 CIMIC GROUP LTD., North Sydney, NSW, Australia 18,180.6 6,730.6 25,752.8 17 0 0 2 0 8 35 0 1 15 14 HYUNDAI ENGINEERING CONSTRUCTION CO. LTD., Seoul, S. Korea 17,694.5 8,664.0 18,279.3 35 5 17 0 1 29 13 0 0 16 15 OBAYASHI CORP., Tokyo, Japan 16,270.0 4,009.0 18,295.0 46 5 6 7 3 6 25 1 1 17 16 SKANSKA AB, Stockholm, Sweden 15,414.0 12,110.0 19,891.0 55 2 4 1 2 4 30 0 1 18 18 FLUOR CORP., Irving, Texas, U.S.A. 15,185.9 6,952.0 21,000.0 7 2 18 0 0 57 6 9 2 19 19 KAJIMA CORP., Tokyo, Japan 14,301.8 3,202.2 15,431.3 59 10 6 2 1 1 9 0 1 20 17 STRABAG, Vienna, Austria 14,220.9 12,008.7 15,466.4 38 0 0 4 2 6 48 0 0 21 25 LARSEN TOUBRO LTD., Mumbai, Maharashtra, India 12,707.6 3,974.8 17,489.3 11 4 30 7 2 18 26 0 2 22 21 SHIMIZU CORP., Tokyo, Japan 12,567.5 1,259.4 13,869.1 53 10 3 1 1 7 11 3 1 23 20 TECHNIP, Paris, France 12,230.0 12,113.0 5,562.0 0 0 0 0 0 100 0 0 0 24 24 TAISEI CORP., Tokyo, Japan 12,135.0 454.0 13,629.0 55 10 2 1 2 0 17 0 0 25 27 FERROVIAL, Madrid, Spain 11,834.9 8,943.0 17,419.6 17 0 7 3 18 0 46 0 0 26 ** SHAANXI CONSTRUCTION ENG’G GROUP CO. LTD., Xi’an, Shaanxi, China 11,457.2 0.0 21,791.5 75 3 1 1 5 10 3 0 2 27 22 SAMSUNG CT, Seongnam-si, S. Korea 11,062.0 5,900.0 8,505.0 25 27 21 0 0 6 17 0 0 28 30 ZHEJIANG CONSTRUCTION INVEST. GRP. CO. LTD., Hangzhou, Zhejiang, China 10,808.3 799.6 12,821.0 59 2 16 1 0 8 12 0 1 29 37 BEIJING URBAN CONSTRUCTION GROUP CO. LTD., Beijing, China 9,653.0 263.6 19,661.9 66 1 0 0 3 1 25 0 0 30 33 TAKENAKA CORP., Osaka, Japan 9,486.0 1,255.0 10,177.0 69 17 0 0 0 0 12 0 0 31 34 GS ENGINEERING CONSTRUCTION, Seoul, S. Korea 9,468.6 4,295.0 9,935.3 37 6 6 0 3 35 12 0 0 32 29 SAIPEM SPA, San Donato Milanese, Italy 9,121.0 8,949.0 330.0 0 0 0 0 0 98 2 0 0 33 38 DAEWOO ENGINEERING CONSTRUCTION CO. LTD., Seoul, S. Korea 9,072.9 2,764.4 6,826.1 55 0 11 1 1 14 17 0 0 34 28 CBI LLC, The Woodlands, Texas, U.S.A. 8,462.5 2,506.3 7,064.2 1 0 17 1 1 72 0 7 0 35 47 JIANGSU NANTONG SANJIAN CONSTR. GROUP CO., Haimen, Jiangsu, China 8,370.0 428.8 NA 100 0 0 0 0 0 0 0 0 36 49 AECOM, Los Angeles, Calif., U.S.A. 8,322.2 982.7 11,211.4 64 1 10 2 0 11 9 0 3 37 35 KIEWIT CORP., Omaha, Neb., U.S.A. 7,861.9 1,362.2 6,710.8 10 1 17 4 2 23 39 1 0 38 32 CHINA NATIONAL CHEMICAL ENGINEERING GROUP CORP., Beijing, China 7,759.8 2,472.3 10,595.9 1 0 15 1 0 81 0 0 0 39 43 ROYAL BAM GROUP NV, Bunnik, Utrecht, The Netherlands 7,696.0 4,907.0 NA 59 0 0 0 0 0 41 0 0 40 40 ANHUI CONSTRUCTION ENGINEERING GROUP CO. LTD., Hefei, Anhui, China 7,680.0 416.4 8,828.6 54 1 0 15 3 1 27 0 0 41 41 QINGJIAN GROUP CO. LTD., Qingdao, Shandong, China 7,636.2 1,640.4 6,484.6 90 0 0 2 0 7 2 0 0 42 ** BEIJING UNI-CONSTRUCTION GROUP CO. LTD., Beijing, China 7,243.7 79.4 3,115.2 76 0 0 1 1 5 18 0 0 43 48 BEIJING CONSTRUCTION ENGINEERING GROUP CO. LTD., Beijing, China 7,178.9 429.9 15,878.8 78 3 1 2 1 2 12 0 0 44 52 DAELIM INDUSTRIAL CO. LTD., Seoul, S. Korea 7,094.9 2,161.4 7,429.3 51 2 11 2 0 20 13 0 1 45 56 PETROFAC LTD., Jersey, Channel Islands, U.K. 7,070.0 7,070.0 1,265.0 0 0 0 0 0 100 0 0 0 46 63 SALINI IMPREGILO SPA, Milan, Italy 6,779.3 6,249.3 8,727.3 4 0 0 19 2 0 64 0 0 47 39 JIANGSU ZHONGNAN CONSTR. INDUSTRY GROUP CO., Haimen, Jiangsu, China 6,630.4 113.8 16,813.5 100 0 0 0 0 0 0 0 0 48 122 FCC SA, Madrid, Spain 6,595.9 3,190.8 3,857.5 3 0 0 18 44 0 24 2 0 49 45 SK EC, Seoul, S. Korea 6,453.9 3,557.7 4,152.9 14 0 15 4 1 51 12 0 3 50 44 NCC AB, Solna, Sweden 6,184.0 2,775.0 6,601.0 0 0 0 0 0 0 0 0 0 enr.com August 21/28, 2017 ENR 47 The Top 250 List 0821_Top250_GC_List.indd 47 8/15/17 11:48 AM
- 16. THE TOP 250 GLOBAL CONTRACTORS GENERALBUILDING WATERSUPPLY TRANSPORTATION MANUFACTURING SEWER/WASTE HAZARDOUSWASTE POWER INDUS./PETROLEUM TELECOM INT'L 2016 NEW CONTRACTS $ MILTOTALFIRM RANK 2017 2016 2016 REVENUE $ MIL. 51 57 CONSOLIDATED CONTRACTORS GROUP, Athens, Attica, Greece 6,124.7 6,124.7 3,499.0 19 0 1 0 0 49 30 0 0 52 51 PCL CONSTRUCTION ENTERPRISES INC., Denver, Colo., U.S.A. 6,012.3 3,533.6 6,202.4 60 1 4 2 2 22 8 0 0 53 46 SINOPEC ENGINEERING (GROUP) CO. LTD., Beijing, China 5,928.0 2,180.5 4,149.7 0 0 0 0 0 100 0 0 0 54 50 POSCO ENGINEERING CONSTRUCTION, Incheon, S. Korea 5,822.9 1,483.6 NA 50 4 13 0 2 18 11 0 0 55 60 SAMSUNG ENGINEERING CO. LTD., Seoul, S. Korea 5,802.5 3,565.8 4,135.1 0 31 2 5 10 51 0 0 0 56 53 CHINA NATIONAL MACHINERY INDUSTRY CORP., Beijing, China 5,760.2 3,992.2 15,413.3 17 9 45 8 0 8 12 0 0 57 59 TUTOR PERINI CORP., Sylmar, Calif., U.S.A. 5,711.9 170.7 3,735.1 57 0 0 0 0 0 43 0 0 58 58 THE WHITING-TURNER CONTRACTING CO., Baltimore, Md., U.S.A. 5,504.7 0.0 7,700.0 80 2 1 0 1 5 3 0 8 59 62 SHANGHAI URBAN CONSTRUCTION (GROUP) CORP., Shanghai, China 5,420.1 388.4 8,546.0 15 2 0 4 2 0 77 0 0 60 13 ODEBRECHT ENGENHARIA E CONSTRUCAO SA, Sao Paulo, SP, Brazil 5,397.6 4,167.8 1,349.5 5 0 25 10 1 12 46 0 0 61 55 DONGFANG ELECTRIC CORP., Chengdu, Sichuan, China 5,291.8 464.7 5,507.6 0 0 100 0 0 0 0 0 0 62 64 CHIYODA CORP., Yokohama, Kanagawa, Japan 5,192.4 4,325.6 3,135.6 0 1 3 0 0 92 2 0 0 63 70 TECNICAS REUNIDAS, Madrid, Spain 5,128.1 5,024.3 1,039.9 0 0 8 1 0 90 1 0 0 64 67 THE WALSH GROUP LTD., Chicago, Ill., U.S.A. 5,052.2 298.6 3,815.1 28 0 1 6 8 0 57 0 0 65 54 JGC CORP., Yokohama, Japan 5,020.0 4,395.0 3,568.0 1 0 1 0 0 94 0 4 0 66 75 CLARK GROUP, Bethesda, Md., U.S.A. 4,970.5 0.5 6,416.8 82 0 1 0 0 0 16 0 0 67 ** CHINA NUCLEAR ENGINEERING CORP. LTD., Beijing, China 4,923.8 316.0 7,522.8 44 0 36 0 1 13 2 0 0 68 72 GILBANE BUILDING CO., Providence, R.I., U.S.A. 4,677.1 343.2 7,218.7 86 0 0 0 0 7 1 1 4 69 68 BALFOUR BEATTY US, Dallas, Texas, U.S.A. 4,640.5 59.8 4,690.8 83 0 0 0 2 0 14 0 0 70 65 JIANGSU NANTONG LIUJIAN CONSTR. GROUP CO. LTD., Rugao, Jiangsu, China 4,576.4 241.5 5,448.8 54 17 5 4 1 11 2 0 7 71 ** TBEA CO. LTD., Changji, Xinjiang, China 4,565.5 912.7 7,742.6 0 49 51 0 0 0 0 0 0 72 66 SNC-LAVALIN INC., Montreal, Quebec, Canada 4,371.7 2,865.2 5,203.7 13 0 21 0 0 52 15 0 0 73 69 KINDEN CORP., Tokyo, Japan 4,296.0 253.0 NA 57 5 18 1 3 2 2 0 12 74 74 XPCC CONSTRUCTION ENG’G (GROUP) CO. LTD., Urumqi, Xinjiang, China 4,268.5 664.8 NA 54 0 5 3 0 1 38 0 0 75 61 OHL SA (OBRASCON HUARTE LAIN SA), Madrid, Spain 4,248.9 3,375.7 3,997.0 17 0 0 2 0 6 74 0 0 76 80 PORR AG, Vienna, Austria 4,131.0 2,104.0 4,368.0 38 0 0 0 0 0 62 0 0 77 84 LOTTE ENGINEERING CONSTRUCTION CO. LTD., Seoul, S. Korea 4,039.6 302.6 6,093.8 69 5 4 0 1 8 12 0 1 78 82 ORASCOM CONSTRUCTION LTD., Dubai, U.A.E. 4,033.0 3,975.0 3,751.5 33 0 18 1 0 26 15 0 0 79 78 STRUCTURE TONE, New York, N.Y., U.S.A. 4,010.6 227.1 4,215.3 87 0 0 0 0 6 0 0 7 80 81 PENTA-OCEAN CONSTRUCTION CO. LTD., Tokyo, Japan 4,002.1 1,527.7 3,971.8 40 2 0 2 10 4 42 0 0 81 98 DPR CONSTRUCTION, Redwood City, Calif., U.S.A. 3,997.5 5.0 4,243.0 65 0 0 0 0 18 0 0 17 82 92 RENAISSANCE CONSTRUCTION, Ankara, Turkey 3,932.7 3,257.3 2,862.5 49 2 10 1 0 19 14 0 0 83 109 TOYO ENGINEERING CORP., Chiba, Japan 3,849.7 3,216.9 1,040.2 0 0 24 0 0 74 0 0 0 84 103 SWINERTON INC., San Francisco, Calif., U.S.A. 3,829.7 0.0 5,975.0 67 0 33 0 0 0 0 0 0 85 85 MORTENSON CONSTRUCTION, Minneapolis, Minn., U.S.A. 3,816.6 179.5 4,134.3 53 4 31 0 1 0 4 0 7 86 90 SHAPOORJI PALLONJI AND CO. PVT. LTD., Mumbai, Maharashtra, India 3,812.2 1,654.5 2,100.0 80 0 0 0 0 0 20 0 0 87 86 ACCIONA INFRAESTRUCTURAS, Madrid, Spain 3,785.5 2,287.6 5,025.9 14 7 11 23 3 2 39 0 0 88 73 TODA CORP., Tokyo, Japan 3,648.0 77.0 4,286.0 61 8 1 3 3 3 16 3 0 89 89 STROYGAZMONTAZH LLC, Moscow, Russia 3,641.0 0.0 1,335.1 6 0 0 0 0 79 14 0 0 90 97 HENSEL PHELPS, Greeley, Colo., U.S.A. 3,547.1 135.3 2,867.2 61 6 0 0 2 0 23 0 8 91 105 MCCARTHY HOLDINGS INC., St. Louis, Mo., U.S.A. 3,454.0 0.0 3,786.0 64 3 15 0 2 6 10 0 0 92 71 JACOBS, Dallas, Texas, U.S.A. 3,377.7 1,610.1 3,800.5 1 3 3 0 0 72 2 16 2 93 100 ZACHRY GROUP, San Antonio, Texas, U.S.A. 3,367.3 0.0 1,990.3 0 0 21 0 0 79 0 0 0 94 95 HAZAMA ANDO CORP., Tokyo, Japan 3,351.0 249.0 NA 46 11 5 6 1 4 10 18 0 95 93 SACYR, Madrid, Spain 3,264.0 1,679.0 2,245.0 12 0 6 5 13 8 48 0 0 96 107 JE DUNN CONSTRUCTION GROUP, Kansas City, Mo., U.S.A. 3,208.3 0.0 NA 84 7 0 0 0 0 1 0 8 97 102 ASTALDI, Rome, Italy 3,139.4 2,656.9 4,987.7 11 0 14 0 0 0 72 0 0 98 96 MAEDA CORP., Tokyo, Japan 3,014.0 46.0 4,013.0 51 9 11 3 3 0 19 0 0 99 ** LENDLEASE, New York, N.Y., U.S.A. 2,985.4 0.0 4,351.1 93 0 1 0 0 6 0 0 0 100 126 HOLDER CONSTRUCTION CO., Atlanta, Ga., U.S.A. 2,939.0 0.0 2,118.0 68 0 0 0 0 0 2 0 30 48 ENR August 21/28, 2017 enr.com 0821_Top250_GC_List.indd 48 8/15/17 11:48 AM
- 17. GENERALBUILDING WATERSUPPLY TRANSPORTATION MANUFACTURING SEWER/WASTE HAZARDOUSWASTE POWER INDUS./PETROLEUM TELECOM INT'L 2016 NEW CONTRACTS $ MILTOTALFIRM RANK 2017 2016 2016 REVENUE $ MIL. 101 128 CHINA PETROLEUM ENGINEERING CONSTRUCTION CORP., Beijing, China 2,931.4 1,262.7 4,231.4 0 0 0 0 0 100 0 0 0 102 94 POLIMEKS INSAAT TAAHHUT VE SAN. TIC. AS, Istanbul, Turkey 2,921.5 2,921.5 NA 51 0 0 0 0 0 38 0 0 103 114 SUFFOLK CONSTRUCTION CO., Boston, Mass., U.S.A. 2,905.1 0.0 5,014.0 100 0 0 0 0 0 0 0 0 104 91 ELLISDON CORP., Mississauga, Ontario, Canada 2,896.8 10.1 NA 58 1 6 4 0 2 27 0 3 105 88 ROYAL BOSKALIS WESTMINSTER NV, Papendrecht, The Netherlands 2,861.0 2,253.0 2,802.0 0 0 18 0 0 32 33 0 0 106 115 JAN DE NUL GROUP (SOFIDRA SA), Capellen, Luxemburg 2,809.0 2,797.0 2,820.0 7 0 0 0 3 11 33 0 0 107 79 CHINA GENERAL TECHNOLOGY (GROUP) HOLDING CO. LTD., Beijing, China 2,799.1 727.1 5,976.8 74 4 18 0 0 0 4 0 0 108 217 ALARKO CONTRACTING GROUP, Istanbul, Turkey 2,730.9 1,071.9 1,037.0 0 0 58 0 1 0 40 0 0 109 104 SUMITOMO MITSUI CONSTRUCTION CO. LTD., Tokyo, Japan 2,724.9 201.4 2,946.4 55 5 0 4 1 3 32 0 0 110 110 HANWHA ENGINEERING CONSTRUCTION CORP., Seoul, S. Korea 2,697.4 1,017.0 3,030.0 45 4 8 0 1 23 19 0 0 111 101 TURNER INDUSTRIES GROUP LLC, Baton Rouge, La., U.S.A. 2,641.4 0.0 63.5 0 0 1 0 0 98 0 1 0 112 116 BESIX, Brussels, Belgium 2,611.3 1,732.5 2,325.2 63 0 0 8 1 0 28 0 0 113 108 MOTA-ENGIL, Porto, Portugal 2,554.0 1,901.0 2,644.0 20 0 2 8 18 0 52 0 0 114 118 GRANITE CONSTRUCTION INC., Watsonville, Calif., U.S.A. 2,514.6 4.3 670.6 3 1 10 4 6 1 76 0 0 115 137 BARTON MALOW CO., Southfield, Mich., U.S.A. 2,425.5 170.0 1,823.8 61 29 9 0 0 1 0 0 0 116 123 NANTONG CONSTRUCTION GROUP CO. LTD., Nantong, Jiangsu, China 2,414.3 264.2 1,987.2 86 4 3 1 0 6 0 0 0 117 120 BRASFIELD GORRIE LLC, Birmingham, Ala., U.S.A. 2,406.1 0.0 3,068.2 91 1 1 2 0 2 1 0 2 118 77 KBR, Houston, Texas, U.S.A. 2,352.0 1,200.0 NA 0 0 0 0 0 100 0 0 0 119 76 CHINA PETROLEUM PIPELINE ENGINEERING CO. LTD., Landfang, Hebei, China 2,344.0 881.0 3,588.6 0 0 0 0 0 99 0 0 1 120 112 THE ARAB CONTRACTORS CO., Cairo, Egypt 2,286.0 765.0 4,058.0 29 0 1 10 18 1 42 0 0 121 ** CHINA ALUMINUM INTERNATIONAL ENGINEERING CORP. LTD., Beijing, China 2,233.3 67.1 6,755.1 33 0 0 10 2 40 0 0 0 122 163 MAIRE TECNIMONT GROUP, Milan, Italy 2,177.2 1,766.7 1,593.3 1 1 8 0 0 87 3 0 0 123 136 ZHEJIANG COMMUNICATIONS CONSTRUCTION GROUP CO., Hangzhou, China 2,145.5 161.6 4,734.6 0 0 0 0 0 0 100 0 0 124 111 DANIELI C. OFFICINE MECCANICHE SPA, Friuli Venezia Giulia, Italy 2,135.0 1,989.0 1,850.0 0 0 0 0 0 100 0 0 0 125 139 CTCI CORP., Taipei, Taiwan 2,104.1 787.0 2,537.8 3 4 35 0 8 45 5 0 0 126 144 AUSTIN INDUSTRIES, Dallas, Texas, U.S.A. 2,094.7 0.0 3,920.2 47 0 0 0 0 1 34 0 0 127 124 CITIC CONSTRUCTION CO. LTD., Beijing, China 2,062.1 2,005.2 1,814.9 72 10 0 5 0 2 7 0 0 128 127 ALBERICI-FLINTCO, St. Louis, Mo., U.S.A. 2,003.8 210.3 2,312.7 60 4 5 8 3 18 2 0 0 129 131 PRIMORIS SERVICES CORP., Dallas, Texas, U.S.A. 1,996.9 11.2 2,800.0 3 1 5 0 3 62 25 0 1 130 135 MICHELS CORP., Brownsville, Wis., U.S.A. 1,979.0 148.0 3,015.6 2 0 20 0 4 54 16 0 3 131 125 CHINA JIANGSU INT’L ECON.-TECH. COOP. GRP. LTD., Nanjing, Jiangsu, China 1,875.6 621.5 2,373.8 92 0 0 2 1 0 3 0 0 132 140 CHINA WU YI CO. LTD., Fuzhou, Fujian, China 1,862.0 470.0 3,198.0 67 1 2 1 0 7 22 0 0 133 106 VAN OORD DREDGING MARINE CONTRACTOR, Rotterdam,The Netherlands 1,798.6 1,362.0 2,766.5 0 0 23 0 0 8 69 0 0 134 141 JOANNOU PARASKEVAIDES GROUP OF COS., Guernsey, Channel Islands, U.K. 1,747.3 1,747.3 2,351.0 41 0 5 0 1 2 52 0 0 135 146 YANJIAN GROUP CO. LTD., Yantai, Shandong, China 1,717.0 419.7 1,890.9 73 5 2 0 0 6 13 0 0 136 164 CLAYCO INC., Chicago, Ill., U.S.A. 1,691.0 0.0 1,848.1 90 10 0 0 0 0 0 0 0 137 142 THE YATES COS. INC., Philadelphia, Miss., U.S.A. 1,683.9 0.4 1,907.0 23 41 3 0 0 25 7 0 0 138 ** JSC MOSINZHPROEKT, Moscow, Russia 1,674.0 0.0 204.0 11 0 0 0 0 0 89 0 0 139 178 DEVCON CONSTRUCTION INC., Milpitas, Calif., U.S.A. 1,660.0 0.0 1,000.0 100 0 0 0 0 0 0 0 0 140 ** GRAHAM, Calgary, Alberta, Canada 1,655.0 163.0 1,693.0 51 3 2 2 9 9 23 0 0 141 154 BLACK VEATCH, Overland Park, Kan., U.S.A. 1,637.1 363.3 552.7 0 0 59 2 9 6 0 0 24 142 156 LIMAK INSAAT SANAYI VE TICARET AS, Ankara, Turkey 1,624.0 908.0 550.0 3 0 15 3 0 2 78 0 0 143 121 CHINA HUANQIU CONTRACTING ENGINEERING CORP. LTD., Beijing, China 1,596.6 461.9 4,372.9 0 0 0 0 0 100 0 0 0 144 147 PER AARSLEFF A/S, Viby J, Denmark 1,560.7 425.9 1,880.5 17 16 8 1 15 5 39 0 0 145 199 AMEC FOSTER WHEELER, Atlanta, Ga., U.S.A. 1,540.0 159.0 916.2 3 1 81 0 0 12 0 0 0 146 148 PERFORMANCE CONTRACTORS INC., Baton Rouge, La., U.S.A. 1,522.3 0.0 1,250.0 0 0 4 0 0 96 0 0 0 147 ** LLC VELESSTROY, Moscow, Russia 1,521.0 0.0 1,100.0 12 0 7 0 0 81 0 0 0 148 134 WORLEYPARSONS, North Sydney, NSW, Australia 1,507.0 1,383.0 299.0 0 0 0 0 0 98 0 1 0 149 198 HARBIN ELECTRIC INTERNATIONAL CO. LTD., Harbin, Heilongjiang, China 1,502.4 1,502.4 2,388.7 0 0 100 0 0 0 0 0 0 150 ** WOOD GROUP, Houston, Texas, U.S.A. 1,499.6 317.4 968.4 3 1 2 0 0 92 0 1 0 enr.com August 21/28, 2017 ENR 49 #02 CHINA RAILWAY GROUP LTD. reports that it employs 283,475 people worldwide, the largest payroll of any company on the Top 250. 0821_Top250_GC_List.indd 49 8/15/17 11:48 AM
- 18. GENERALBUILDING WATERSUPPLY TRANSPORTATION MANUFACTURING SEWER/WASTE HAZARDOUSWASTE POWER INDUS./PETROLEUM TELECOM INT'L 2016 NEW CONTRACTS $ MILTOTALFIRM RANK 2017 2016 2016 REVENUE $ MIL. 151 157 TAV CONSTRUCTION, Istanbul, Turkey 1,481.7 1,253.0 1,015.6 26 0 0 0 0 0 74 0 0 152 161 MANHATTAN CONSTRUCTION GROUP, Naples, Fla., U.S.A. 1,476.0 0.9 1,235.0 73 0 0 0 0 1 25 0 0 153 187 HATHAWAY DINWIDDIE CONSTRUCTION CO., San Francisco, Calif., U.S.A. 1,473.0 0.0 457.0 99 0 0 0 0 0 0 0 1 154 167 HOFFMAN CORP., Portland, Ore., U.S.A. 1,458.0 0.0 NA 39 26 0 2 1 0 14 0 17 155 152 SOCIETA ITALIANA PER CONDOTTE SPA, Rome, Italy 1,455.7 889.3 783.7 18 0 0 1 0 0 77 0 0 156 151 ENKA INSAAT VE SANAYI AS, Istanbul, Turkey 1,452.7 1,337.4 934.1 18 0 30 0 0 38 13 0 0 157 155 WALBRIDGE, Detroit, Mich., U.S.A. 1,450.6 451.0 1,440.0 16 76 1 0 1 5 1 0 0 158 166 ELECTRA LTD., Ramat Gan, Israel 1,444.2 62.2 1,545.0 83 0 5 0 1 1 11 0 0 159 170 RYAN COS. US INC., Minneapolis, Minn., U.S.A. 1,426.0 0.0 1,247.0 96 2 1 0 0 1 0 0 1 160 223 CENGIZ CONSTRUCTION INDUSTRY TRADE CO. INC., Istanbul, Turkey 1,368.0 124.5 1,060.6 5 0 0 7 0 0 55 0 0 161 181 LAYTON CONSTRUCTION CO. LLC, Sandy, Utah, U.S.A. 1,347.5 0.0 1,623.4 99 1 0 0 0 0 0 0 0 162 160 SHANDONG ZIJIAN CONSTRUCTION GROUP CO. LTD., Zibo, Shandong, China 1,333.0 110.3 974.3 17 8 36 1 24 12 0 1 1 163 195 HITT CONTRACTING INC., Falls Church, Va., U.S.A. 1,324.4 0.3 1,151.2 79 0 0 0 0 0 0 0 21 164 169 MATRIX SERVICE CO., Tulsa, Okla., U.S.A. 1,323.5 217.8 NA 0 0 29 0 0 70 0 0 0 165 183 SHAWMUT DESIGN AND CONSTRUCTION, Boston, Mass., U.S.A. 1,316.4 0.2 1,582.6 100 0 0 0 0 0 0 0 0 166 172 POMERLEAU INC., Saint-Georges-de-Beauce, Quebec, Canada 1,302.0 25.0 1,018.9 61 0 17 1 0 0 21 0 0 167 ** MCCONNELL DOWELL, Hawthorn, Victoria, Australia 1,262.0 694.0 1,247.0 8 0 1 9 0 21 47 0 0 168 205 BL HARBERT INTERNATIONAL, Birmingham, Ala., U.S.A. 1,253.9 763.2 1,375.3 75 23 0 0 0 2 0 0 0 169 133 ANDRADE GUTIERREZ ENGENHARIA, Belo Horizonte, Minas Gerais, Brazil 1,253.0 448.0 687.0 5 0 16 17 0 13 49 0 0 170 184 MESSER CONSTRUCTION CO., Cincinnati, Ohio, U.S.A. 1,251.0 0.0 1,489.0 89 2 0 0 0 5 4 0 0 171 153 DAY ZIMMERMANN, Philadelphia, Pa., U.S.A. 1,243.6 11.2 914.6 0 0 98 0 0 2 0 0 0 172 204 YAPI MERKEZI INSAAT VE SANAYI AS, Istanbul, Turkey 1,237.3 1,170.1 310.0 0 1 0 0 3 0 96 0 0 173 ** MOSS ASSOCIATES LLC, Fort Lauderdale, Fla., U.S.A. 1,221.2 37.3 1,137.3 89 1 2 0 0 0 8 0 0 174 132 SINOPEC OILFIELD SERVICE SHENGLI CORP., Dongying, Shandong, China 1,221.1 344.3 1,048.2 0 0 0 0 0 100 0 0 0 175 129 DAVID E. HARVEY BUILDERS INC., Houston, Texas, U.S.A. 1,210.6 0.0 804.0 85 15 0 0 0 0 0 0 0 176 230 KOLIN INSAAT TURIZM SANAYI VE TICARET AS, Ankara, Turkey 1,197.2 120.3 2,927.7 4 0 16 4 0 3 53 0 8 177 145 GYM (GRANA Y MONTERO), Lima, Peru 1,185.0 254.0 691.0 11 0 4 0 3 39 4 0 0 178 192 PEPPER CONSTRUCTION GROUP, Chicago, Ill., U.S.A. 1,179.0 0.0 1,254.2 94 2 0 1 2 0 0 1 0 179 211 PETRO. PROJECTS TECH. CONSULTATIONS CO. (PETROJET), Cairo, Egypt 1,154.3 192.7 1,154.3 6 10 0 0 0 61 18 0 0 180 189 HUNTER ROBERTS CONSTRUCTION GROUP LLC, New York, N.Y., U.S.A. 1,143.0 0.0 1,075.0 100 0 0 0 0 0 0 0 0 181 ** CENTURI CONSTRUCTION GROUP, Phoenix, Ariz., U.S.A. 1,139.1 203.9 876.4 0 0 2 1 1 94 3 0 0 182 158 COMSA CORP., Barcelona, Catalonia, Spain 1,137.0 563.0 NA 0 0 0 0 0 0 65 0 0 183 175 C.M.C. DI RAVENNA SOCIETE COOPERATIVA, Ravenna, Italy 1,136.5 622.9 1,244.5 5 0 10 17 0 0 64 0 0 184 212 CONSIGLI BUILDING GROUP INC., Milford, Mass., U.S.A. 1,130.0 0.0 1,092.0 100 0 0 0 0 0 0 0 0 185 ** SHANGHAI ELECTRIC GROUP CO. LTD., Shanghai, China 1,129.6 432.2 3,226.0 0 0 100 0 0 0 0 0 0 186 179 NUROL CONSTRUCTION AND TRADING CO. INC., Istanbul, Turkey 1,128.4 392.9 178.9 41 0 4 1 0 0 54 0 0 187 222 MAPA INSAAT VE TICARET AS, Ankara, Turkey 1,124.6 662.6 120.7 24 0 0 12 0 0 64 0 0 188 173 NATA CONSTRUCTION TOURISM TRADE AND INDUSTRY CO., Ankara, Turkey 1,124.0 718.0 363.0 34 0 0 0 0 0 60 0 4 189 191 GRAY CONSTRUCTION, Lexington, Ky., U.S.A. 1,123.1 19.9 952.9 35 39 0 0 0 26 0 0 0 190 194 ARABIAN CONSTRUCTION COMPANY SAL, Beirut, Lebanon 1,121.5 970.5 1,324.8 84 0 3 2 0 7 0 0 0 191 219 EMJ CORP., Chattanooga, Tenn., U.S.A. 1,115.9 4.7 805.8 53 9 37 0 0 0 0 0 0 192 197 KOKOSING INC., Westerville, Ohio, U.S.A. 1,110.8 0.0 1,069.2 20 0 10 11 9 4 41 0 0 193 165 SHENYANG YUANDA ALUMINUM INDUSTRY ENG’G CO., Shenyang, China 1,102.7 412.8 967.9 99 0 0 0 0 0 1 0 0 194 241 ARCO CONSTRUCTION COS., St. Louis, Mo., U.S.A. 1,097.0 6.9 1,318.7 100 0 0 0 0 0 0 0 0 195 177 BURNS MCDONNELL, Kansas City, Mo., U.S.A. 1,090.1 73.4 1,400.0 9 9 36 0 0 40 2 3 0 196 186 THE BECK GROUP, Dallas, Texas, U.S.A. 1,089.2 48.5 1,263.1 91 0 0 0 0 0 0 0 8 197 238 CHOATE CONSTRUCTION CO., Atlanta, Ga., U.S.A. 1,075.1 0.0 1,118.1 82 4 0 0 0 13 0 0 0 198 234 BIG-D CONSTRUCTION CORP., Salt Lake City, Utah, U.S.A. 1,072.0 0.0 NA 79 5 0 0 0 7 5 0 0 199 210 ROBINS MORTON, Birmingham, Ala., U.S.A. 1,055.0 0.0 1,200.0 99 1 0 0 0 0 0 0 0 200 203 POWER CONSTRUCTION CO. LLC, Chicago, Ill., U.S.A. 1,045.0 0.0 925.0 100 0 0 0 0 0 0 0 0 THE TOP 250 GLOBAL CONTRACTORS 50 ENR August 21/28, 2017 enr.com 0821_Top250_GC_List.indd 50 8/15/17 11:48 AM
- 19. GENERALBUILDING WATERSUPPLY TRANSPORTATION MANUFACTURING SEWER/WASTE HAZARDOUSWASTE POWER INDUS./PETROLEUM TELECOM INT'L 2016 NEW CONTRACTS $ MILTOTALFIRM RANK 2017 2016 2016 REVENUE $ MIL. 201 224 CROSSLAND CONSTRUCTION CO. INC., Columbus, Kan., U.S.A. 1,029.6 0.0 1,084.0 76 7 0 5 2 0 11 0 0 202 193 CHINA ELECTRIC POWER EQUIPMENT TECHNOLOGY CO., Beijing, China 1,028.8 810.1 115.4 0 0 100 0 0 0 0 0 0 203 ** RIZZANI DE ECCHER, Pozzuolo del Friuli, Italy 1,026.1 869.9 496.6 40 0 0 1 0 0 46 0 5 204 207 BAUER AG, Schrobenhausen, Bavaria, Germany 1,022.3 633.8 1,016.1 29 5 16 6 3 13 24 0 4 205 201 THE BOLDT CO., Appleton, Wis., U.S.A. 1,017.2 0.0 866.7 64 5 24 0 0 7 0 0 0 206 190 SINOSTEEL EQUIPMENT ENGINEERING CO. LTD., Beijing, China 1,006.0 492.3 1,649.0 0 0 0 0 0 100 0 0 0 207 200 MAKYOL INSAAT SANAYI TURIZM VE TICARET AS, Istanbul, Turkey 1,003.0 118.0 469.0 0 0 0 0 0 0 100 0 0 208 215 SALFACORP SA, Santiago, Region Metropolitana, Chile 996.0 91.0 894.0 18 0 12 0 0 0 6 0 0 209 174 ANT YAPI SANAYI VE TICARET CJSC, Istanbul, Turkey 990.2 889.4 439.0 100 0 0 0 0 0 0 0 0 210 159 SINOPEC ZHONGYUAN PETROLEUM ENGINEERING LTD., Puyang City, China 982.2 535.9 798.3 0 0 0 0 0 100 0 0 0 211 206 CHINA JIANGXI CORP. FOR INT’L ECON. TECH. COOP., Nanchang, China 935.7 830.3 1,524.2 45 0 9 10 1 0 35 0 0 212 150 CHINA INTERNATIONAL WATER ELECTRIC CORP. (CWE), Beijing, China 935.3 935.3 1,820.5 4 0 42 30 0 3 21 0 0 213 226 TEKFEN CONSTRUCTION AND INSTALLATION CO. INC., Istanbul, Turkey 935.0 623.0 3,888.0 5 0 0 0 0 6 21 68 0 214 185 BI GROUP, Astana, Akmola, Kazakhstan 933.6 0.1 594.4 74 0 1 2 0 0 23 0 0 215 ** CLUNE CONSTRUCTION CO., Chicago, Ill., U.S.A. 922.0 0.0 922.0 100 0 0 0 0 0 0 0 0 216 227 SELLEN CONSTRUCTION CO., Seattle, Wash., U.S.A. 921.0 0.0 59.0 100 0 0 0 0 0 0 0 0 217 176 IC ICTAS INSAAT SANAYI VE TICARET AS, Istanbul, Turkey 917.5 285.7 NA 0 0 0 0 0 0 100 0 0 218 231 AVALONBAY COMMUNITIES INC., Arlington, Va., U.S.A. 915.2 0.0 659.2 100 0 0 0 0 0 0 0 0 219 ** OKLAND CONSTRUCTION CO. INC., Salt Lake City, Utah, U.S.A. 914.4 0.0 982.8 94 5 0 0 0 0 0 0 1 220 ** CORE CONSTRUCTION GROUP, Phoenix, Ariz., U.S.A. 898.5 0.0 982.1 99 0 1 0 0 0 0 0 0 221 ** MIRON CONSTRUCTION CO. INC., Neenah, Wis., U.S.A. 898.4 0.0 NA 66 2 5 0 4 24 0 0 0 222 220 JAMES G. DAVIS CONSTRUCTION CORP., Rockville, Md., U.S.A. 896.0 0.0 NA 100 0 0 0 0 0 0 0 0 223 248 THE MCSHANE COS., Rosemont, Ill., U.S.A. 867.1 0.0 689.0 100 0 0 0 0 0 0 0 0 224 213 IMPRESA PIZZAROTTI C. SPA, Parma, Italy 863.8 554.2 1,304.1 54 0 0 1 0 0 45 0 0 225 216 PJ DICK - TRUMBULL - LINDY PAVING, Pittsburgh, Pa., U.S.A. 863.0 0.0 1,015.0 38 0 4 0 0 12 46 0 0 226 ** ALSTON CONSTRUCTION, Atlanta, Ga., U.S.A. 860.0 0.0 712.0 100 0 0 0 0 0 0 0 0 227 ** GULSAN CONSTRUCTION, Ankara, Turkey 849.5 380.8 145.5 7 0 18 0 0 0 75 0 0 228 202 AEGION CORP., Chesterfield, Mo., U.S.A. 849.0 159.0 NA 2 0 1 1 47 49 2 0 0 229 ** GAP INSAAT YATIRIM VE DIS TICARET AS, Istanbul, Turkey 847.2 822.6 21.9 30 0 0 0 0 18 52 0 0 230 218 BONATTI SPA, Parma, Emilia Romagna, Italy 846.0 796.0 701.0 0 0 0 0 0 100 0 0 0 231 196 AMES CONSTRUCTION INC., Burnsville, Minn., U.S.A. 845.0 37.0 999.0 2 0 9 4 0 1 72 0 0 232 ** M+W GROUP, Albany, N.Y., U.S.A. 844.7 22.3 900.0 0 100 0 0 0 0 0 0 0 233 182 SB ENGINEERS AND CONSTRUCTORS LTD., Houston, Texas, U.S.A. 834.2 0.0 139.0 0 0 0 0 0 100 0 0 0 234 ** E.E. REED CONSTRUCTION LP, Sugar Land, Texas, U.S.A. 834.0 0.0 672.0 100 0 0 0 0 0 0 0 0 235 ** CONTRACTING AND TRADING CO. ÌC.A.T.Î, Beirut, Lebanon 825.5 824.8 520.0 1 0 0 6 0 87 6 0 0 236 209 SUNDT CONSTRUCTION INC., Tempe, Ariz., U.S.A. 813.2 0.0 1,569.0 62 1 8 5 0 1 23 0 0 237 229 HANJIN HEAVY INDUSTRIES CONSTRUCTION CO. LTD., Seoul, S. Korea 803.0 29.0 1,006.0 45 0 21 0 0 0 34 0 0 238 233 GAMA, Ankara, Turkey 803.0 337.9 385.2 2 0 88 1 0 9 1 0 0 239 117 GRUPO ISOLUX CORSAN SA, Madrid, Spain 797.8 553.9 803.35 11 1 9 1 2 25 50 0 1 240 ** ZHONGMEI ENGINEERING GROUP LTD., Nanchang, Jiangxi, China 797.4 797.4 691.2 22 0 1 19 0 0 58 0 0 241 ** CHINA ZHONGYUAN ENGINEERING CORP., Beijing, China 797.3 797.3 NA 0 0 100 0 0 0 0 0 0 242 237 LEVEL 10 CONSTRUCTION, Sunnyvale, Calif., U.S.A. 792.3 0.0 419.5 100 0 0 0 0 0 0 0 0 243 ** BAYBURT GRUP AS, Ankara, Turkey 790.9 206.3 2,598.4 2 0 0 1 0 0 98 0 0 244 ** UNIVERSAL ACARSAN HEALTHCARE HOSPITAL CONSTR., Gaziantep,Turkey 790.0 790.0 NA 100 0 0 0 0 0 0 0 0 245 ** FORTIS CONSTRUCTION INC., Portland, Ore., U.S.A. 783.0 0.0 1,140.0 23 0 0 0 0 0 0 0 76 246 245 WEEKS MARINE INC., Cranford, N.J., U.S.A. 780.0 85.1 638.8 0 0 0 10 0 11 74 2 0 247 242 VCC CONSTRUCTION, Irving, Texas, U.S.A. 780.0 0.0 850.0 100 0 0 0 0 0 0 0 0 248 ** THE CONLAN CO., Marietta, Ga., U.S.A. 772.5 0.0 703.7 99 1 0 0 0 0 0 0 0 249 ** THE CIANBRO COS., Pittsfield, Maine, U.S.A. 771.8 0.0 777.4 9 0 12 0 0 60 14 0 0 250 221 GREAT LAKES DREDGE DOCK, Oak Brook, Ill., U.S.A. 767.6 59.4 306.7 0 0 0 0 0 0 83 17 0 enr.com August 21/28, 2017 ENR 51 #82 RENAISSANCE CONSTRUCTION is working on Russia’s Yamal LNG project, consisting of 200 wells and three LNG trains, well above the Arctic Circle. 0821_Top250_GC_List.indd 51 8/15/17 11:49 AM