1. Overview p. 64 // 2015-2016 at a Glance p. 64 // Profitability Analysis p. 64 // Revenue Volume p. 64 // Backlog Analysis p. 64
A Decade of Contracting Revenue p. 64 // Markets’ Share of Total Revenue p. 65 // Domestic Staff Hiring p. 65 // International Staff
Hiring p. 65 // International Market Analysis p. 66 // Messer Construction’s Diverse Supply Chain p. 66 // Top 400 Dialogue p. 69
Top 20 by Sector pp. 70-73 // James G. Davis Construction Rehabs a Landmark p. 73 // Top 100 by New Contracts p. 74
Top 50 Contractors Working Abroad p. 77 // Top 50 Domestic Heavy Contractors p. 78 // Top 50 Domestic General Building Revenue p. 81
How To Read the Tables p. 81 // Top 400 List p. 83 // Top 400 Index p. 100
enr.com May 23, 2016 ENR 63
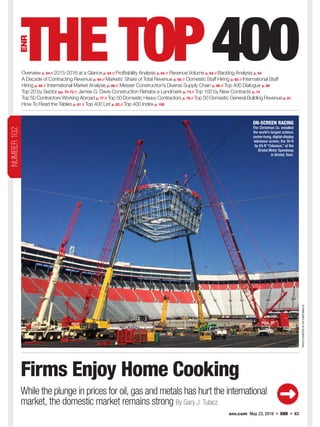
Firms Enjoy Home Cooking
While the plunge in prices for oil, gas and metals has hurt the international
market, the domestic market remains strong By Gary J. Tulacz
NUMBER102
TPHOTOCOURTESYOFTHECHRISTMANCO.
ON-SCREEN RACING
The Christman Co. installed
the world’s largest outdoor,
center-hung, digital-display
television screen, the 30-ft
by 63-ft “Colossus,” at the
Bristol Motor Speedway
in Bristol, Tenn.
ENR05232016_TL_Opener.indd 63 5/16/16 5:09 PM
2. NUMBER OF FIRMS
REPORTING PROFITABILITY
DOMESTIC
PROFITS
323
DOMESTIC
LOSSES
26
INTERNATIONAL
PROFITS
47
INTERNATIONAL
LOSSES
38
VOLUME
DOMESTIC
REVENUE
$294.4
DOMESTIC
NEW
CONTRACTS
$293.8
INTERNATIONAL
REVENUE
$49.8
INTERNATIONAL
NEW
CONTRACTS
$43.8
$ BILLIONS
NUMBER OF FIRMS
REPORTING
SIZE OF
BACKLOG
HIGHER
238
LOWER
67
SAME
56
COMPARING THE
PAST DECADE’S
CONTRACTOR
REVENUE
$331.9
2014
$324.2
2013
$262.8
2006
$304.4
2007
$338.4
2008
$290.6
2009
$259.4
2010
SOURCE: DODGE DATA & ANALYTICS/ENR
$282.1
2011
$309.4
2012
$ BILLIONS
$344.1
2015
The market finally has come all the way back to pre-
recession levels for U.S. general contractors and
construction managers. The market is strong without
overheating and without the crippling worker short-
ages that were predicted. However, large contractors
in the big-ticket international oil-and-gas and mining
markets did take a hit in 2015, although most are
poised to weather that storm.
For ENR’s Top 400 Contractors, 2015 was a pretty
good year. The Top 400 generated $344.14 billion in
contracting revenue in 2015, an increase of 3.7% from
2014’s $331.94 billion. The figure marks a record high
for the Top 400, eclipsing the previous record of
$338.38 billion in 2008, reported in our 2009 Top 400.
However, the real story is on the domestic side. Con-
tracting revenue from U.S. projects rose a healthy 9.5%,
to $294.35 billion, and international contracting reve-
nue plunged 21.1%, to $49.79 billion, in 2015. The
international market saw major declines in projects in
the minerals-and-mining, petroleum and power sectors.
Bechtel continued its dominance on the Top 400,
ranking No. 1 for the 18th consecutive year. However,
low oil prices and a decline in the minerals-and-mining
sector have had a significant impact on its markets. The
slowdown in the Chinese economy has hurt commodity
prices in many sectors, says Brendan Bechtel, president
and COO. “I expect the international market for com-
modities [such as oil and gas and minerals and metals]
to be on a down cycle for the next couple of years.”
Fluor reported a record backlog in the first quarter
of 2016. At the quarterly analyst briefing on earnings,
CEO David Seaton said he has not seen any major
project cancellations. However, he noted that sched-
ules on some of Fluor’s oil-and-gas projects have been
stretched out.
Bechtel is much more optimistic about the domestic
market. “Here in the U.S., we still have the most robust
economy in the world.” He says there are opportunities
in the market for liquefied-natural-gas export terminals,
and he expects a significant spike in gas-fired combined-
cycle power plants as coal plants are closed and a few
nuclear plants are retired.
Overall, Bechtel believes that, while the interna-
tional market has softened, there continues to be a lot
of work available. “There are plenty of good oppor-
tunities for firms that are smart and disciplined,” he
says. For example, Bechtel just broke ground on the
Edmonton Valley Line Light Rail Transit-Stage 1
project in Alberta, Canada.
Near-Term Optimism
For most firms, the current market is strong and
poised to be healthy for the near term. “We are very
optimistic for the not-too-distant future,” says Pat Di
“I expect the
international
market for
commodities
[such as oil and
gas and
minerals and
metals] to be
on a down
cycle for the
next couple of
years. … [But]
there are
plenty of good
opportunities
for firms that
are smart and
disciplined.”
Brendan Bechtel,
President and
COO, Bechtel
2015-2016 at a Glance
THE TOP 400 CONTRACTORS
64 Ⅲ ENR Ⅲ May 23, 2016 enr.com
ENR05232016TL_Overview.indd 64 5/18/16 1:43 PM
3. GENERAL
BUILDING
$166,795.39
TRANSPORTATION
$46,25910
POWER
$23,521.96
INDUSTRIAL
$18,235.93
WATER
$5,032.01
SEWER
AND WASTE
$5,035.88
OTHER
$4,653.16
MANUFACTURING
$10,958.74
TELECOM
$6,640.33
PETROLEUM
$53,217.47
HAZARDOUS
WASTE
$3,789.74
$ MILLIONS
1.9%
1.4%
1.5%
5.3%
13.4%
1.1%
3.2%
1.5%
6.8%
15.5%
48.5%
PROFESSIONAL
DOMESTIC
STAFF HIRING
SOURCE: DODGE DATA &
ANALYTICS/ENR
(MEASURED IN
FIRMS REPORTING)
25
260
86
PROFESSIONAL
INTERNATIONAL
STAFF HIRING 12
26
37
INCREASE
DECREASE
STAYED THE SAME
Filippo, executive vice president of Turner Construc-
tion. He is not seeing signs that any sectors are getting
overbuilt. Di Filippo notes that there are some huge
projects on the horizon, including the proposed James
A. Farley Post Office-Penn Station renovation.
For many firms, the robust U.S. market has meant
an easing of competition. But the U.S. market increas-
ingly is gaining notice abroad. “U.S. competition con-
tinues to diminish. However, those voids have been
filled by the European construction companies as they
try to learn to compete in our marketplace,” says
Ronald N. Tutor, CEO of Tutor Perini.
It is not just European firms that are interested in
the U.S. For example, China Construction America
acquired Plaza Construction in 2014 and has helped
Plaza to grow. “CCA has been unequivocally support-
ive of our efforts, providing us with direct global con-
tact to their suppliers and manufacturers and giving us
direct access to building materials we wouldn’t nor-
mally have the ability to reach,” says Richard Wood,
Plaza’s CEO.
Wood believes the market will continue to grow in
the near term. “Construction activity towards the end
of 2015 and beginning of 2016 has remained very busy
due to low interest rates, consumer health and a grow-
ing population. We believe this trend will continue in
the near future, and construction growth will remain
on a better-than-moderate growth track,” he says.
For many firms, the current market is hot enough
that some community groups want to douse it. Because
of a scarcity of land, “Los Angeles is going vertical,”
says Jocelyn Topolski, executive director, project
development, at Bernards.
However, “with the robust market has come push-
back from the local communities, including an anti-
developmentballotmeasurethathasgainedmomentum,”
says Topolski. The so-called Neighborhood Integrity
Initiative is being pushed by a group called the Coalition
to Preserve LA. It seeks to slow new developments in
Los Angeles by requiring city planners and developers
to stick to the city’s General Plan, a set of city planning
guidelines, including building height and use restric-
tions, that are now more than two decades old.
No one is certain that the domestic market will
continue at this pace. “There is still significant pres-
sure on margins in the construction industry and a
lack in confidence that the work hitting the market is
sustainable,” says Kevin McCarthy, president and
CEO of PC Construction.
As construction tends to lag other economic indica-
tors, most contractors anticipate no rapid change in
the market. “I think we are in the late innings of a
vertical construction boom in U.S. gateway cities,” says
Dan McQuade, group president, construction, at
Firms on the list
that sent in
surveys in 2015.
362
Firms that
increased
revenue in 2015
over 2014.
72.1%
Firms that had
lower revenue
in 2015 than in
2014.
27.3%
Markets’ Share of
Total Revenue
OVERVIEW
enr.com May 23, 2016 ENR 65
ENR05232016TL_Overview.indd 65 5/16/16 5:29 PM
4. International Market Analysis
AECOM. McQuade thinks the market will slow
down, not bottom out, but he is not too concerned.
“We have built such a robust backlog in vertical
construction that it will carry us through the next few
years. Companies that have significant backlogs of
work and are well capitalized, like we are, will have
no problems,” he suggests.
Diversify, Diversify, Diversify
As contractors continue to expand and build their
backlogs, many are looking to the future. The keyword
is “diversify.” For example, JE Dunn Construction is
moving into growing markets, including aviation and
advanced manufacturing, says Gordon Lansford,
CEO. “We have found that these market sectors re-
quire the same high level of advanced and emerging
construction technology and processes that we have
been successfully applying to highly complex health-
care, science and mission-critical facilities.”
Oltmans Construction Co. is another firm that is
looking to widen its reach. “We are looking ahead to
future markets. We are passing on some of our core
business opportunities in order to diversify into new
areas,” says John Gormly, Oltmans president.
For some firms, diversification has helped out in
lean times. For example, Ferreira Construction Co.
has been forced to seek new markets due to the slow-
down in highway construction over the past few
years, caused by an uncertain highway construction
market, the low gas tax and the dwindling Highway
Trust Fund. “Our strategy is to perform work in other
regions of the country and perform different types of
work, such as solar installation, all types of utility
work, dredging, pile-driving, electrical and specialty
PHOTOCOURTESYOFMESSERCONSTRUCTIONCO.
THE TOP 400 CONTRACTORS OVERVIEW
Diversity | By Gary J. Tulacz
In the current team-oriented
environment, relations with subs and
suppliers have never been more
important, and Messer Construction
Co. (No. 60) has taken this message
to heart. “Because we live where we
work, we have a significant
advantage over other national
contractors when it comes to
building strong relationships with
subs and suppliers,” says Tim
Steigerwald, senior vice president.
For example, in nearby Columbus,
the Cincinnati-based fi m is
completing Ohio State University’s
North Residential District Transforma-
tion (above), which consists of eight
dormitories that will house more than
3,500 students.
Including subs and suppliers in the
planning process is a key to success,
Steigerwald says, adding, “We involve
them in the planning of the work and
treat them as our partners, and that
really makes the difference.”
Steigerwald says Messer goes
beyond just partnering, reaching out
to improve the industry. “We remain
steadfast in our commitment to
create opportunities for certifi d
small [and] minority- and women-
owned businesses,” he says.
Messer’s efforts are paying off. In
April, DiversityInc. magazine ranked
the firm No. 8 out of all U.S. firms for
its commitment to supplier diversity.
Messer was the only construction
firm on the list. n
Messer’s Diverse Supply Chain
ASIA AND
AUSTRALIA
$13,917.97
CANADA
$15,517.77
MIDDLE
EAST
$4,600.22
CARIBBEAN
ISLANDS
$325.81
AFRICA
$904.21
LATIN
AMERICA
$6,529.01
EUROPE
$7,992.18
1.8%
31.2%
16.1%
0.7%
9.2%
13.1%
28.0%
$ MILLIONS NUMBER OF FIRMS IN
EACH REGION
CARIBBEAN
ISLANDS
19
MIDDLE EAST
27
ASIA/
AUSTRALIA
29
LATIN
AMERICA
33
CANADA
53
AFRICA
18
EUROPE
26
66 ENR May 23, 2016 enr.com
ENR05232016TL_Overview.indd 66 5/16/16 5:29 PM
5. How are your company’s relations with
subcontractors and suppliers?
What are your company’s strategies for succeeding
in a growing but uncertain market?
DAN JOHNSON, PRESIDENT
MORTENSON CONSTRUCTION
Minneapolis
It can be hard sometimes for businesses to
adapt to rapid economic change, but, by and
large, we have witnessed more discipline in the
subcontractor and supplier market to acquire
the right amount of work.
JOHN CANNITO, COO
THE PENTA BUILDING GROUP
Las Vegas
We focus on good communication and setting
up the job to run efficiently. When subcontrac-
tors can get a good flow and be efficient, they
can perform well, make schedule, cut costs and
make a fair profit.
SHAUN YANCEY, PRESIDENT
PCL CONSTRUCTION ENTERPRISES
Denver
There is pressure to build more efficiently and a
need by owners to see increased efficiency.
PCL is continuously looking for ways to
increase productivity while reducing our costs
through lean construction processes.
JIM KARAMBELAS, CEO
GLY CONSTRUCTION
Bellevue, Wash.
Being disciplined about the amount of work we
commit to and realistic about the number of
quality people we can hire is the key to success.
Competition in this market means finding the
best fit—it’s a good place to be.
STEVEN F. ROZNOWSKI, CEO
THE CHRISTMAN CO.
Lansing
Subcontractors are being more selective on the
jobs they pursue—therefore, achieving coverage
by multiple bidders can be a challenge. It’s not
unusual to receive increased pushback on
traditional subcontract terms and conditions.
RICHARD CAVALLARO, CEO
SKANSKA USA
New York City
We are seeing some subs under pressure.
Programs like our Construction Management
Building Blocks and BOOST are designed to
provide small businesses with training on how
to be successful in partnerships.
STEPHEN GRAY, CEO
GRAY CONSTRUCTION
Lexington, Ky.
We have not historically required performance
and payment bonds from our subs. However,
with the current financial fragility being seen in
the marketplace, customers are willing to pay a
premium for additional default protection.
KEVIN MCCARTHY, CEO
PC CONSTRUCTION CO.
South Burlington, Vt.
It is critical for contractors to focus on projects
that fit with their qualifications. When you see a
building contractor going after industrial or
water-treatment work and they get the job, it
doesn’t usually end well for anyone.
PAT A. DI FILIPPO, EXEC. VP
TURNER CONSTRUCTION CO.
New York City
The industry generally does think of Turner as
an industrial contractor, but we are growing in
that market. For example, we are building the
355,000-sq-ft TKS-Honda of America
Marysville L2 Paint Shop in Marysville, Ohio.
JAMES L.O’LEARY, COO
HASKELL
Jacksonville. Fla.
The acquisition of Leidos Constructors … adds
scale to our business, strengthens our industrial
business, expands our design capabilities,
grows our public practice and lets us enter the
oil, gas and chemical production space.
It can be hard sometimes for businesses to
adapt to rapid economic change, but, by and
large, we have witnessed more discipline in the
subcontractor and supplier market to acquire
SHAUN YANCEY, PRESIDENT
PCL CONSTRUCTION ENTERPRISES
There is pressure to build more efficiently and a
need by owners to see increased efficiency.
PCL is continuously looking for ways to
increase productivity while reducing our costs
STEVEN F. ROZNOWSKI, CEO
Subcontractors are being more selective on the
jobs they pursue—therefore, achieving coverage
by multiple bidders can be a challenge. It’s not
unusual to receive increased pushback on
traditional subcontract terms and conditions.
It is critical for contractors to focus on projects
that fit with their qualifications. When you see a
building contractor going after industrial or
water-treatment work and they get the job, it
THE PENTA BUILDING GROUP
We focus on good communication and setting
up the job to run efficiently. When subcontrac-
tors can get a good flow and be efficient, they
can perform well, make schedule, cut costs and
Being disciplined about the amount of work we
commit to and realistic about the number of
quality people we can hire is the key to success.
Competition in this market means finding the
Programs like our Construction Management
Building Blocks and BOOST are designed to
provide small businesses with training on how
PAT A. DI FILIPPO, EXEC. VP
TURNER CONSTRUCTION CO.
The industry generally does think of Turner as
an industrial contractor, but we are growing in
that market. For example, we are building the
Marysville L2 Paint Shop in Marysville, Ohio.
We have not historically required performance
and payment bonds from our subs. However,
with the current financial fragility being seen in
the marketplace, customers are willing to pay a
premium for additional default protection.
The Top 400 Dialogue
THE TOP 400 CONTRACTORS OVERVIEW
enr.com May 23, 2016 Ⅲ ENR Ⅲ 69
ENR05232016TL_Overview.indd 69 5/16/16 5:29 PM
6. The Top 20 Contractors by Sector
1 PETROLEUM
RANK
Top 20 Revenue: $49.2 Billion
Top 20 Market Share: 92.5%
2016 2015
1 1 BECHTEL
2 2 FLUOR CORP.
3 3 CB&I INC.
4 5 JACOBS
5 8 TURNER INDUSTRIES GROUP LLC
6 6 KBR
7 4 KIEWIT CORP.
8 10 ZACHRY GROUP
9 13 PERFORMANCE CONTRACTORS INC.
10 7 AECOM
11 9 PCL CONSTRUCTION ENTERPRISES INC.
12 15 S&B ENGINEERS AND CONSTRUCTORS LTD.
13 12 MICHELS CORP.
14 14 MATRIX SERVICE CO.
15 ** STRIKE
16 ** WILLBROS GROUP INC.
17 18 AEGION CORP.
18 23 LAUREN ENGINEERS & CONSTRUCTORS INC.
19 16 BILFINGER INDUSTRIAL SERVICES
20 17 SAULSBURY INDUSTRIES INC.
3 POWER
RANK
Top 20 Revenue: $17.5 Billion
Top 20 Market Share: 74.4%
2016 2015
1 2 CB&I INC.
2 1 BECHTEL
3 3 KIEWIT CORP.
4 4 DAY & ZIMMERMANN
5 6 BABCOCK & WILCOX ENTERPRISES INC.
6 5 FLUOR CORP.
7 9 ZACHRY GROUP
8 11 MORTENSON CONSTRUCTION
9 8 BLACK & VEATCH
10 ** SWINERTON INC.
11 7 AECOM
12 10 AMEC FOSTER WHEELER
13 16 KBR
14 ** ENERFAB
15 13 BURNS & MCDONNELL
16 14 MICHELS CORP.
17 15 GEMMA POWER SYSTEMS
18 ** EMJ CORP.
19 ** JINGOLI - DCO
20 17 SKANSKA USA
2 TRANSPORTATION
RANK
Top 20 Revenue: $28.2 Billion
Top 20 Market Share: 61.1%
2016 2015
1 1 BECHTEL
2 2 KIEWIT CORP.
3 3 THE WALSH GROUP LTD.
4 4 TUTOR PERINI CORP.
5 5 SKANSKA USA
6 8 GRANITE CONSTRUCTION INC.
7 9 LANE INDUSTRIES INC.
8 13 FLATIRON CONSTRUCTION CORP.
9 10 COLAS USA
10 7 FERROVIAL US CONSTRUCTION CORP.
11 11 CLARK GROUP
12 6 FLUOR CORP.
13 ** OHL USA INC.
14 14 BALFOUR BEATTY US
15 15 AMES CONSTRUCTION INC.
16 16 RAILWORKS CORP.
17 17 GREAT LAKES DREDGE & DOCK
18 ** HENSEL PHELPS
19 20 AUSTIN INDUSTRIES
20 ** HERZOG FAMILY OF COS.
THE TOP 400 CONTRACTORS OVERVIEW#66
GRAY CONSTRUCTION and BL
Harbert International are designing
and building the Mercedes Benz SUV
Body Shop Center in Vance, Ala.
foundations,” says Nelson Ferreira, president.
Urban Jungle
Urbanization, shifting demographics, integration of
technology and the rise of new styles of workplaces
are already making a huge impact on contractors
across the building, commercial development and
infrastructure markets. “With more people than ever
living in cities, we need housing, workplaces and
infrastructure to meet their needs. People are also
living longer, so we’re seeing a need for improved
health-care facilities and more of them, as well as
more schools, that keep pace with evolving technol-
ogy,” says Richard Cavallaro, CEO of Skanska USA.
Demographic shifts have many contractors watch-
ing carefully to discern where to focus their efforts.
“We are definitely strategizing to skate to where the
puck is going next,” says Steven F. Roznowski, CEO
of The Christman Co. There has been strong revital-
ization of historic urban centers, such as Nashville,
Richmond, Detroit and Charlotte, N.C., he notes.
Christman reacted to these changes when it relocated
its southeastern Michigan offices back to inner-city
Detroit, which the firm left in the 1950s, he says, add-
ing, “It’s a move that’s already paying off, with multiple
large modernization projects underway, including the
$140-million GSA Levin Federal Courthouse
improvement project.”
Demographic shifts are not just about where firms
are building but what they are building. “Millennials,
who have now taken over as the largest population
since the baby boomers, are the drivers of these trends
and are choosing to live smaller, own less, and walk or
bike more,” says Mike VanGessel, CEO of Rockford
Construction. He says millennials and Generation Z,
who are coming next, will transform market require-
ments in new ways for decades to come.
For hotels, retail and multifamily projects, how-
ever, developers are under increasing pressure from
lenders that are demanding stronger past experience,
more liquidity and highly experienced general-
contractor partners, says Chris Barbe, senior vice
president of dck worldwide.
Barbe says these changes in lending have opened
up opportunities for dck worldwide. “Through the dck
capital-solutions group within our company, we part-
ner with owners and developers to add value through
not only our construction expertise but also our ability
to bring financing opportunities to their projects.”
Some contractors are stepping into a new role. “More
construction firms are getting involved on the develop-
ment side, which enables them to move upstream in the
“U.S.
competition
continues to
diminish.
However, those
voids have
been filled by
the European
construction
companies as
they try to
learn to
compete in our
marketplace.”
Ronald N. Tutor,
CEO, Tutor Perini
Corp.
70 Ⅲ ENR Ⅲ May 23, 2016 enr.com
ENR05232016TL_Overview.indd 70 5/16/16 5:30 PM
7. JAMESG.DAVISCONSTRUCTIONCORP.
James G. Davis Construction Corp. (No. 83) is renovating Uline Arena, also known as the Washington
Coliseum, in Washington, D.C. Built in 1941 and the site of the first Beatles concert in the U.S. in 1964, the
facility will be the home to an REI flagship store as well as 174,000 sq ft of prime office space. n
4 INDUSTRIAL
RANK
Top 20 Revenue: $13.4 Billion
Top 20 Market Share: 73.2%
2016 2015
1 1 BECHTEL
2 2 FLUOR CORP.
3 3 JACOBS
4 5 AECOM
5 7 THE TURNER CORP.
6 12 THE WEITZ CO.
7 11 ALBERICI-FLINTCO
8 17 DPR CONSTRUCTION
9 8 SKANSKA USA
10 9 THE YATES COS. INC.
11 4 KBR
12 10 GILBANE BUILDING CO.
13 15 CCC GROUP INC.
14 ** PCL CONSTRUCTION ENTERPRISES INC.
15 ** AMEC FOSTER WHEELER
16 16 CR MEYER
17 18 THE WHITING-TURNER CONTRACTING CO.
18 13 STELLAR
19 ** LEIDOS
20 ** KLINGER COS. INC.
6 HAZARDOUS WASTE
RANK
Top 20 Revenue: $4.0 Billion
Top 20 Market Share: 105.2%
2016 2015
1 2 FLUOR CORP.
2 1 BECHTEL
3 3 CB&I INC.
4 4 JACOBS
5 8 GREAT LAKES DREDGE & DOCK
6 6 PARSONS
7 7 ENTACT
8 5 SEVENSON ENVIRONMENTAL SERVICES INC.
9 13 POSILLICO
10 11 ECC
11 ** KIEWIT CORP.
12 10 J.F. BRENNAN CO. INC.
13 15 J. FLETCHER CREAMER & SON INC.
14 14 TURNER INDUSTRIES GROUP LLC
15 12 BURNS & MCDONNELL
16 18 HALEY & ALDRICH INC.
17 17 OBG
18 ** CDM SMITH
19 19 THE WINTER CONSTRUCTION CO.
20 ** EA ENGINEERING, SCIENCE, AND
5 TELECOMMUNICATIONS
RANK
Top 20 Revenue: $6.3 Billion
Top 20 Market Share: 94.4%
2016 2015
1 2 THE WHITING-TURNER CONTRACTING CO.
2 1 HOLDER CONSTRUCTION CO.
3 3 THE TURNER CORP.
4 8 DPR CONSTRUCTION
5 12 STRUCTURE TONE
6 7 JE DUNN CONSTRUCTION
7 4 BLACK & VEATCH
8 6 FLUOR CORP.
9 ** AECOM
10 15 FORTIS CONSTRUCTION INC.
11 9 BECHTEL
12 13 GILBANE BUILDING CO.
13 14 HITT CONTRACTING INC.
14 10 HOFFMAN CORP.
15 5 HENSEL PHELPS
16 17 THE BECK GROUP
17 11 MORTENSON CONSTRUCTION
18 16 SKANSKA USA
19 18 MICHELS CORP.
20 19 NABHOLZ CONSTRUCTION CORP.
THE TOP 400 CONTRACTORS OVERVIEW#46
CLAYCO is building a new 12-story,
517,000-sq-ft office building for
Washington University School of Medi-
cine and BJC HealthCare in St. Louis.
project and reduce or eliminate
competition for the construction,”
says Lansford of JE Dunn.
Lack of Energy
Falling oil prices have taken a defi-
nite toll on domestic and interna-
tional markets, particularly in the
upstream oil-and-gas sector.
“Exploration and production com-
panies have reduced or halted
expansions of surface production
facilities. In response to this market
cycle, we shifted our attention to
downstream opportunities in the
chemical market that focus on feed-
stock value-added products, includ-
ing ammonia production,” says
James L. O’Leary, COO of Haskell.
Bechtel sees a coming renais-
sance in the U.S. petrochemical
market because of lower feedstock
prices. But some of the projects on
the boards have been slow to get
started due to owners’ “crisis in
expectations” over the higher-than-
The Top 20 Contractors by Sector
enr.com May 23, 2016 ENR 73
ENR05232016TL_Overview.indd 73 5/16/16 5:30 PM
8. The Top 100 Contractors by New Contracts*
expected costs of such plants, Bechtel says.
While the upstream oil-and-gas sectors have
faltered, many firms on the downstream side have found
continued success. “Approximately half of our business
has exposure to the energy markets, so we have felt the
negative impacts of depressed oil prices,” says Robert
Bryan, director of corporate development and strategy
at Aegion. He says Aegion’s midstream and downstream
oil-and-gas sectors have remained fairly stable.
For many contractors, particularly in the heavy and
civil arena, lower oil prices have been a blessing. “The
drop in prices has helped our asphalt paving and tra-
ditional highway construction. When you purchase
over 40 million gallons of fuel a year, the drop in prices
can only be good,” says Bob Alger, CEO of The Lane
Construction Corp.
Further, the drop in oil prices has spurred some
construction growth due to the reduced cost of
materials and transportation. “While it is difficult
to ascertain or quantify how much this has changed
over markets, it is definitely a contributing factor to
making more funds available for construction,” says
Robin Savage, COO of Robins & Morton.
Competing
Despite the healthy market, many contractors
complain that competition remains intense. “Compe-
tition remains strong in most sectors, although most
For expanded
content on the
ENR Top Lists,
see ENR.com/
toplists.
Onthe
Web
RANK
2016
REVENUE
IN $ MIL.
1 FLUOR CORP. 21,800.0
2 BECHTEL 17,371.0
3 CB&I INC. 13,138.5
4 THE TURNER CORP. 9,961.4
5 PCL CONSTRUCTION ENTERPRISES INC. 7,012.9
6 GILBANE BUILDING CO. 6,909.1
7 KIEWIT CORP. 6,828.2
8 AECOM 6,550.6
9 SWINERTON INC. 6,122.0
10 THE WHITING-TURNER CONTRACTING 6,006.0
11 TUTOR PERINI CORP. 5,753.9
12 JACOBS 5,520.0
13 CLARK GROUP 5,032.0
14 STRUCTURE TONE 4,333.0
15 BALFOUR BEATTY US 4,246.5
16 DPR CONSTRUCTION 4,178.5
17 MCCARTHY HOLDINGS INC. 4,120.0
18 SKANSKA USA 4,080.4
19 HOLDER CONSTRUCTION CO. 3,689.0
20 MORTENSON CONSTRUCTION 3,639.5
21 JE DUNN CONSTRUCTION 3,609.6
22 SUFFOLK CONSTRUCTION CO. 3,246.0
23 HENSEL PHELPS 3,223.9
24 THE WALSH GROUP LTD. 3,094.0
25 BRASFIELD & GORRIE LLC 3,001.3
26 LENDLEASE 2,943.0
27 ALBERICI-FLINTCO 2,324.9
28 ZACHRY GROUP 2,207.0
29 PRIMORIS SERVICES CORP. 2,023.0
30 LEVEL 10 CONSTRUCTION 1,998.0
31 GRANITE CONSTRUCTION INC. 1,954.9
32 FLATIRON CONSTRUCTION CORP. 1,903.0
33 BARTON MALOW CO. 1,882.2
34 MICHELS CORP. 1,802.7
35 PERFORMANCE CONTRACTORS INC. 1,800.0
RANK
2016
REVENUE
IN $ MIL.
36 THE YATES COS. INC. 1,682.8
37 THE BECK GROUP 1,625.9
38 CHINA CONSTR. AMER./PLAZA CONSTR. 1,603.0
39 MWH GLOBAL 1,532.0
40 SATTERFIELD & PONTIKES CONSTR. 1,487.0
41 BABCOCK & WILCOX ENTERPRISES INC. 1,426.1
42 CLAYCO INC. 1,400.7
43 SUNDT CONSTRUCTION INC. 1,378.0
44 WEBCOR CONSTRUCTION LP 1,371.0
45 PEPPER CONSTRUCTION GROUP 1,367.6
46 WALBRIDGE 1,366.0
47 DEVCON CONSTRUCTION INC. 1,330.0
48 MESSER CONSTRUCTION CO. 1,299.7
49 COLAS USA 1,297.0
50 HOAR CONSTRUCTION 1,281.0
51 HERZOG FAMILY OF COS. 1,261.5
52 CONSIGLI BUILDING GROUP INC. 1,249.6
53 AMEC FOSTER WHEELER 1,189.1
54 OHL USA INC. 1,177.8
55 PJ DICK - TRUMBULL - LINDY PAVING 1,176.0
56 MANHATTAN CONSTRUCTION GROUP 1,169.1
57 CROSSLAND CONSTRUCTION CO. INC. 1,161.5
58 KRAUS-ANDERSON CONSTRUCTION CO. 1,141.0
59 BIG-D CONSTRUCTION CORP. 1,138.2
60 DAY & ZIMMERMANN 1,127.9
61 GRAY CONSTRUCTION 1,111.5
62 HAWAIIAN DREDGING CONSTRUCTION 1,100.0
63 GEMMA POWER SYSTEMS 1,098.6
64 THE WEITZ CO. 1,064.0
65 FERROVIAL US CONSTRUCTION CORP. 1,048.0
66 RYAN COS. US INC. 1,048.0
67 SHAWMUT DESIGN AND CONSTRUCTION 1,043.1
68 AUSTIN INDUSTRIES 1,042.4
69 ROBINS & MORTON 1,030.0
70 BL HARBERT INTERNATIONAL 1,020.9
RANK
2016
REVENUE
IN $ MIL.
71 HATHAWAY DINWIDDIE CONSTRUCTION 1,012.0
72 GE JOHNSON CONSTRUCTION CO. 1,006.3
73 HUNTER ROBERTS CONSTRUCTION 995.0
74 HITT CONTRACTING INC. 992.1
75 BLACK & VEATCH 987.6
76 VCC LLC 950.0
77 OKLAND CONSTRUCTION CO. INC. 943.3
78 CHOATE CONSTRUCTION CO. 934.0
79 LANE INDUSTRIES INC. 933.8
80 XL CONSTRUCTION CORP. 922.0
81 KOKOSING INC. 909.5
82 GREAT LAKES DREDGE & DOCK 904.2
83 BARNARD CONSTRUCTION CO. INC. 884.2
84 ARCO CONSTRUCTION COS. 871.0
85 M+W GROUP 865.3
86 LECHASE CONSTRUCTION SERVICES LLC 845.3
87 THE CHRISTMAN CO. 844.8
88 FORTIS CONSTRUCTION INC. 830.0
89 THE BOLDT CO. 791.4
90 JACOBSEN CONSTRUCTION CO. INC. 771.0
91 F.H. PASCHEN, S.N. NIELSEN & ASSOCS. 771.0
92 W. M. JORDAN CO. 767.2
93 LEASE CRUTCHER LEWIS 756.6
94 THE MCSHANE COS. 740.5
95 E.E. REED CONSTRUCTION LP 724.0
96 STRIKE 720.4
97 AVALONBAY COMMUNITIES INC. 720.3
98 BNBT BUILDERS INC. 720.0
99 EMJ CORP. 715.0
100 THE CONLAN CO. 707.5
* AMONG TOP 400 FIRMS PROVIDING DATA
THE TOP 400 CONTRACTORS OVERVIEW#10
TUTOR PERINI CORP. won the MTA
East Side Access CM007 contract,
the New York City subway’s latest big
contract, worth $663 million.
74 ENR May 23, 2016 enr.com
ENR05232016TL_Overview.indd 74 5/16/16 5:30 PM
9. The Top 50 Contractors Working Abroad
This selectivity makes maintaining strong relation-
ships with subcontractors and suppliers critical. “Like
relationship with an owner, a subcontractor who gets
to choose will go with the CM-GC that is more knowl-
edgeable and more stable,” says George A. Pontikes
Jr., CEO of Satterfield & Pontikes Construction.
Bechtel is one company that is making a big invest-
ment in competitiveness. Brendan Bechtel notes that
competition in the international market is becoming
heated, and owner demands for greater process
efficiencies are becoming stronger. “It is embarrassing
that productivity in our industry has not improved over
the past 20 years,” he says.
So, over the next three years, Bechtel plans to invest
$60 million to explore process and project delivery
improvements. “Two-thirds of our ‘Future Fund’ in-
vestment will focus on internal entrepreneurship to
communicate best practices and innovations across
company segments,” says Brendan Bechtel. The rest
of the fund will go to partnerships with third parties.
“Our goal is to build a better Bechtel,” he says.
Find Me Workers!
For contractors, a chronic problem is having enough staff
and craftworkers to do the job—a problem that has not
gotten as bad as quickly as many feared. The shortages
in construction are not as severe as expected because
many craftworkers now have returned to construction
after the downturn in the previously red-hot oil-and-gas
market. Most contractors are concerned this easing of
pressure on the current workforce crisis will not last.
contractors are beginning to see an increase in their
market backlogs. Owners are still very price-conscious
but are also driven by getting the right match of talent
for their projects,” says Savage.
Because it is a healthy market, many contractors
are taking a strategic approach to competing. “If op-
portunities do not align with our strategy, we are quick
to decline and remain focused on our key clients and
markets,” says Scott Skidelsky, senior vice president at
Balfour Beatty Construction. “We are being very
thoughtful about the opportunities we pursue so that
we can maintain the focus and discipline to provide
our clients outstanding construction services.”
In the beleaguered energy markets, many large
firms are now looking at projects they may have previ-
ously ignored as too small. “Because of the lack of
large-scale capital projects, many of the major players
in the space are taking on smaller projects to fill their
pipeline,” says Rick Domyslawski, executive vice pres-
ident at Day & Zimmermann.
This movement by large firms into smaller jobs is
creating a lot of downward pressure on prices and
could lead to more contractor consolidation in the
coming years, Domyslawski says. “We believe we can
compete successfully because we have a long history
of delivering successful projects and have been a reli-
able partner for our clients,” he suggests.
The willingness to be selective is not just affecting
contractors: Subcontractors and suppliers also are very
busy and being more selective with projects they
choose, favoring more reliable general contractors.
“Los Angeles is
going vertical.
[However] with
the robust
market has
come
pushback from
the local
communities,
including an
anti-
development
ballot measure
that has gained
momentum.”
Jocelyn Topolski,
Executive
Director, Project
Development,
Bernards.
RANK
2016
REVENUE
IN $ MIL.
1 BECHTEL 16,881.0
2 FLUOR CORP. 8,045.3
3 PCL CONSTRUCTION ENTERPRISES INC. 4,069.0
4 CB&I INC. 3,538.8
5 JACOBS 2,420.0
6 KBR 1,989.3
7 KIEWIT CORP. 1,961.5
8 AECOM 1,229.6
9 THE TURNER CORP. 731.9
10 BL HARBERT INTERNATIONAL 661.1
11 BABCOCK & WILCOX ENTERPRISES INC. 609.9
12 ALBERICI-FLINTCO 565.2
13 GILBANE BUILDING CO. 477.0
14 WALBRIDGE 457.0
15 BLACK & VEATCH 430.9
16 MICHELS CORP. 360.3
17 CADDELL CONSTRUCTION CO. (DE) LLC 297.3
RANK
2016
REVENUE
IN $ MIL.
18 FLATIRON CONSTRUCTION CORP. 293.8
19 STRUCTURE TONE 290.0
20 OHL USA INC. 283.7
21 MWH GLOBAL 235.5
22 WILLBROS GROUP INC. 232.5
23 AEGION CORP. 216.0
24 HENSEL PHELPS 202.0
25 ECC 194.9
26 AMEC FOSTER WHEELER 186.0
27 THE WALSH GROUP LTD. 161.7
28 RAILWORKS CORP. 155.0
29 BURNS & MCDONNELL 149.4
30 CHINA CONSTR. AMER./PLAZA CONSTR. 148.0
31 MATRIX SERVICE CO. 145.8
32 TUTOR PERINI CORP. 141.9
33 GREAT LAKES DREDGE & DOCK 140.0
34 AMERICAN BRIDGE CO. 124.0
RANK
2016
REVENUE
IN $ MIL.
35 BARNARD CONSTRUCTION CO. INC. 113.8
36 SHIMIZU NORTH AMERICA LLC 102.0
37 HASKELL 101.6
38 PARSONS 100.9
39 WEEKS MARINE INC. 90.8
40 DCK WORLDWIDE LLC 89.9
41 SOUTHLAND/RENDA/JBROS 88.5
42 MICHAEL BAKER INTERNATIONAL 84.4
43 STELLAR 81.6
44 RICE LAKE CONSTRUCTION GROUP 60.1
45 MORGANTI GROUP INC. 60.0
46 THE YATES COS. INC. 55.0
47 THE CONTI GROUP 53.7
48 AMES CONSTRUCTION INC. 53.0
49 LENDLEASE 51.9
50 PERNIX GROUP INC. 50.3
THE TOP 400 CONTRACTORS OVERVIEW#12
BALFOUR BEATTY US broke ground
in January on the Park District in
Dallas, a 916,000-square-foot,
mixed-used development.
enr.com May 23, 2016 Ⅲ ENR Ⅲ 77
ENR05232016TL_Overview.indd 77 5/16/16 5:45 PM
10. The great recession has left construction with a
depleted skilled labor force as many younger employees
gave up on the industry and found other careers.
“To the extent that contractors can staff construction
projects with adequate manpower, those that have the
best trained and most experienced skilled labor force
will have the most opportunity to provide added value
and increase their margins, as compared to the compe-
tition,” says Roznowski.
Many contractors are working hard to recruit young
talent. For example, Turner Construction has increased
its intake of new graduates this year. “We have been
hiring 200 to 300 young people a year, even during the
recession. This year, it will be 400,” says Di Filippo.
Some contractors think the energy downturn will
help the construction industry’s staffing problems. “We
lost a number of our skilled workers to the energy in-
dustry, and now that those job opportunities are de-
creasing, we believe we’re going to see a portion of
those folks return to construction,” says Tim Steiger-
wald, senior vice president of Messer Construction Co.
Steigerwald says that, through job fairs and out-
reach to military bases, Messer is recruiting veterans
as another source of talent. “These individuals have
the focus and discipline we look for in our field opera-
tions, particularly as crane operators,” he says.
Other firms are actively recruiting by promoting
their home markets’ quality of life. “Midsize markets
such as Toledo are great places to live and grow profes-
sionally, and we work at promoting the benefits of
building a career in this community,” says Bill Ru-
dolph, chairman of Rudolph Libbe Group.
The Christman Co. is using its safety program as a
means to attract young people who may be hesitant to
get into construction. “Smart contractors who want to
excel in the industry must get on board and set the
safety bar higher on their projects. In the long term, a
safer work environment will be more inviting to the
younger workforce we are all in desperate need of at-
tracting and developing,” says Roznowski. “Our safety
slogan—‘Safety: It’s How We Live’—helps to remind
us daily of the significant, positive impact safety has on
our overall industry.”
Employee training and development is another tool
being used to attract and retain workers. “As president
and CEO, I’ve made a concerted effort to focus on
existing employee development as well as making key
hires from outside the company to help Plant grow,”
says Chris Rivielle, CEO of Plant Construction Co.
“We believe the balance between the existing culture
and new ideas from the outside make for an innovative
and, at the same time, stable environment.”
Some contractors worry that some proven re-
RANK REVENUE % OF TOTAL REVENUE
2016 IN $ MIL. TRANS- SEWER HAZ- WATER
1 THE WALSH GROUP LTD. 3,484.5 57 5 0 11
2 KIEWIT CORP. 3,143.9 37 2 1 6
3 SKANSKA USA 2,312.0 31 2 0 1
4 TUTOR PERINI CORP. 2,116.5 38 0 0 0
5 GRANITE CONSTRUCTION INC. 1,815.6 70 2 0 5
6 FLUOR CORP. 1,682.2 12 0 15 0
7 COLAS USA 1,205.0 92 4 0 1
8 LANE INDUSTRIES INC. 1,202.6 92 0 0 0
9 FERROVIAL US CONSTRUCTION CORP. 1,140.0 100 0 0 0
10 CLARK GROUP 1,110.0 27 0 0 0
11 FLATIRON CONSTRUCTION CORP. 989.6 97 0 0 3
12 OHL USA INC. 928.4 66 8 0 9
13 BECHTEL 904.0 0 0 14 0
14 BALFOUR BEATTY US 894.3 17 2 0 0
15 AMES CONSTRUCTION INC. 786.0 77 0 0 1
16 GREAT LAKES DREDGE & DOCK 716.9 76 0 24 0
17 HENSEL PHELPS 664.4 23 0 0 0
18 AUSTIN INDUSTRIES 643.1 39 0 0 0
19 ALLAN MYERS INC. 629.8 88 8 0 4
20 KOKOSING INC. 615.4 38 12 0 9
21 GARNEY HOLDING CO. 610.7 0 35 0 65
22 HERZOG FAMILY OF COS. 607.1 100 0 0 0
23 LAYNE CHRISTENSEN CO. 591.3 0 39 1 52
24 PCL CONSTRUCTION ENTERPRISES INC. 585.2 13 1 0 7
25 WEEKS MARINE INC. 549.2 83 0 1 2
26 RAILWORKS CORP. 532.0 100 0 0 0
27 AECOM 512.5 5 0 0 4
28 CB&I INC. 510.3 0 1 6 1
29 LAS VEGAS PAVING CORP. 510.0 100 0 0 0
30 THE TURNER CORP. 479.2 5 0 0 0
31 PJ DICK - TRUMBULL - LINDY PAVING 478.0 53 1 0 0
32 SHIMMICK CONSTRUCTION CO. INC. 470.7 93 7 0 0
33 SOUTHLAND/RENDA/JBROS 469.5 40 24 0 33
34 WILLIAMS BROTHERS CONSTRUCTION CO. INC. 395.9 100 0 0 0
35 THE HUBBARD GROUP INC. 393.6 100 0 0 0
36 F.H. PASCHEN, S.N. NIELSEN & ASSOCIATES LLC 389.2 63 7 0 2
37 MCCARTHY HOLDINGS INC. 388.0 11 1 0 3
38 PARSONS 381.9 40 1 32 0
39 MANSON CONSTRUCTION CO. 377.8 93 0 0 0
40 MICHELS CORP. 368.4 22 3 0 0
41 STACY AND WITBECK INC. 353.1 100 0 0 0
42 ANDERSON COLUMBIA CO. INC. 344.0 70 0 0 0
43 AMERICAN BRIDGE CO. 342.4 100 0 0 0
44 BARNHILL CONTRACTING CO. 337.7 67 0 0 0
45 ZACHRY CONSTRUCTION CORP. 324.0 71 0 0 10
46 VECELLIO GROUP INC. 323.2 99 0 0 0
47 TRAYLOR BROS. INC. 323.2 79 6 0 15
48 WEBCOR CONSTRUCTION LP DBA WEBCOR BUILDERS 318.9 25 0 0 1
49 AEGION CORP. 310.0 2 39 0 0
50 JACOBS 290.0 2 0 11 0
The Top 50 Domestic
Heavy Contractors
WATER
TRANSPORTATION
SEWER
HAZARDOUSWASTE
% OF TOTAL REVENUE
THE TOP 400 CONTRACTORS OVERVIEW
78 ENR May 23, 2016 enr.com
ENR05232016TL_Overview.indd 78 5/16/16 5:30 PM
11. The Top 50 in Domestic Building/Mfg. Revenue
for people that are willing to make a five- to 10-
year commitment to the program. “Participants in
the program are going to rotate through every
department and really gain an understanding of
how the business works and where everyone fits,”
he notes.
Most contractors agree that it is critical to keep
institutional knowledge alive in the face of baby-
boomer retirements.
“We are seeing a generation of senior-level
superintendents and foremen that are soon to retire.
We need to replace them, industry-wide, and make
sure we’re training the next generation on more than
processes. We have to make sure the years of knowl-
edge that we possess stays with the folks who will
take the reins on sites in the next five to 10 years,”
says Cavallaro of Skanska USA. n
cruiting methods may be taking a back seat to com-
petitive pressures. “Internships used to be the way
many young engineers became acquainted with a
company and found a place to make a career. Many
companies have scaled these [internships] back due
to pressures to maximize billability,” says Domys-
lawski of Day & Zimmermann. Failure to provide
basic skills training on pre-entry-level positions may
backfire. “We see younger talent with high expecta-
tions for rapid career advancement without first
mastering the fundamentals,” he says.
Day & Zimmermann has developed a long-term
training-and-career advancement program to keep
staff interested and motivated. “The Field Leader-
ship Development Program initially will focus on
roles that would prepare individuals for field as-
signments,” says Domyslawski. The firm is looking
RANK
2016
REVENUE
IN $ MIL.
1 THE TURNER CORP. 8,388.3
2 THE WHITING-TURNER CONTRACTING CO. 4,020.3
3 BALFOUR BEATTY US 3,806.2
4 GILBANE BUILDING CO. 3,596.9
5 SKANSKA USA 3,497.9
6 TUTOR PERINI CORP. 3,403.5
7 AECOM 3,216.8
8 STRUCTURE TONE 3,002.6
9 CLARK GROUP 2,882.0
10 LENDLEASE 2,789.8
11 MORTENSON CONSTRUCTION 2,514.6
12 SUFFOLK CONSTRUCTION CO. 2,502.0
13 JE DUNN CONSTRUCTION 2,384.2
14 SWINERTON INC. 2,198.6
15 DPR CONSTRUCTION 2,133.2
16 MCCARTHY HOLDINGS INC. 2,123.0
17 BRASFIELD & GORRIE LLC 2,090.0
RANK
2016
REVENUE
IN $ MIL.
18 HENSEL PHELPS 2,069.6
19 DAVID E. HARVEY BUILDERS 1,991.0
20 BARTON MALOW CO. 1,546.2
21 PCL CONSTRUCTION ENTERPRISES INC. 1,451.7
22 CLAYCO INC. 1,350.0
23 HOLDER CONSTRUCTION CO. 1,344.0
24 THE WALSH GROUP LTD. 1,285.8
25 RYAN COS. US INC. 1,282.0
26 M+W GROUP 1,230.9
27 DEVCON CONSTRUCTION INC. 1,223.0
28 SHAWMUT DESIGN AND CONSTRUCTION 1,173.7
29 LAYTON CONSTRUCTION CO. LLC 1,161.4
30 HATHAWAY DINWIDDIE CONSTRUCTION 1,142.0
31 KIEWIT CORP. 1,141.3
32 HUNTER ROBERTS CONSTRUCTION 1,139.0
33 ALBERICI-FLINTCO 1,138.6
34 CHINA CONSTR. AMER./PLAZA CONSTR. 1,112.0
RANK
2016
REVENUE
IN $ MIL.
35 HOFFMAN CORP. 1,083.0
36 MANHATTAN CONSTRUCTION GROUP 1,075.8
37 THE YATES COS. INC. 1,030.8
38 MESSER CONSTRUCTION CO. 1,030.1
39 PEPPER CONSTRUCTION GROUP 987.0
40 THE BECK GROUP 983.1
41 POWER CONSTRUCTION CO. LLC 969.0
42 COASTAL CONSTRUCTION GROUP 936.0
43 WEBCOR CONSTRUCTION LP 917.5
44 CONSIGLI BUILDING GROUP INC. 914.7
45 JAMES G. DAVIS CONSTRUCTION CORP. 869.3
46 GRAY CONSTRUCTION 860.7
47 HITT CONTRACTING INC. 853.9
48 SELLEN CONSTRUCTION CO. INC. 826.0
49 AVALONBAY COMMUNITIES INC. 815.6
50 C.W. DRIVER COS. 814.3
THE TOP 400 CONTRACTORS OVERVIEW
Companies are ranked by construction revenue in
2015 in ($) millions. Those with subsidiaries (†) are listed
by company rank, which may be found on the ENR
website at www.ENR.com. Firms not ranked last year
are designated as **. Some markets may not add up to
100% due to omission of the “other” miscellaneous
market category. NA= “not available.”
Figures include prime construction contracts, shares
of joint ventures, subcontracts, the construction portion
of design-construct contracts and construction
management-at-risk contracts when the firm s risks
are similar to those of a general contractor. Figures also
include the value of installed equipment when a firm has
prime responsibility for specifying and procuring it within
the scope of its construction contract.
General Building includes commercial buildings,
offices, stores, educational facilities, government
buildings, hospitals, medical facilities, hotels, apartments,
housing, etc.
Manufacturing includes auto assembly, electronic
assembly, textile plants, etc.
Power includes thermal and hydroelectric power plants,
waste-to-energy plants, transmission lines, substations,
cogeneration plants, etc.
Water Supply includes dams, reservoirs, transmis-
sion pipelines, distribution mains, irrigation canals,
desalination and potability treatment plants, pumping
stations, etc.
Sewerage / Solid Waste includes sanitary and storm
sewers, treatment plants, pumping plants, incinerators,
industrial waste facilities, etc.
Industrial Process includes pulp and paper mills, steel
mills, non-ferrous metal refineries, pharmaceutical plants,
chemical plants, food and other processing plants, etc.
Petroleum includes refineries, petrochemical plants,
offshore facilities, pipelines, etc.
Transportation includes airports, bridges, roads,
canals, locks, dredging, marine facilities, piers, railroads,
tunnels, etc.
Hazardous Waste includes chemical and nuclear waste
treatment, asbestos and lead abatement, etc.
Telecommunications includes transmission lines and
cabling, towers and antennae, data centers and web
hotels, etc.
How To Read the Tables
enr.com May 23, 2016 ENR 81
ENR05232016TL_Overview.indd 81 5/16/16 5:31 PM
20. RANK RANK RANK RANKFIRM FIRM FIRM FIRM
A
A/Z Corp. 301
Absher Construction Co. 363
Adolfson Peterson Construction 92
AECOM6
Aegion Corp. 73
Alberici-Flintco31
Alston Construction Co. Inc. 112
Amec Foster Wheeler 71
American Bridge Co. 161
Americon Construction Inc. 372
Ames Construction Inc. 69
Andersen Construction 118
Anderson Columbia Co. Inc. 152
Andres Construction Services LLC 269
Arch-Con Construction 380
ARCO Construction Cos. 93
Aristeo Construction Co. 173
Austin Industries 37
AvalonBay Communities Inc. 88
B
Babcock Wilcox Enterprises Inc. 48
Balfour Beatty US 12
Barnard Construction Co. Inc. 143
Barnhill Contracting Co. 148
Barr Barr Inc. 254
Bartlett Cocke General Contractors 140
Barton Malow Co. 35
W.H. Bass Inc. 373
Batson-Cook Co. 123
Bayley Construction 352
BBL Construction Services LLC 183
BCCI Construction Co. Inc. 286
Bechtel1
The Beck Group 61
Bernards149
The Bette Cos. 263
Big-D Construction Corp. 89
Bilfinger Industrial Services 95
Black Veatch 40
BlueScope Construction Inc. 392
Blythe Development Co. 371
BMWC Constructors Inc. 296
BNBT Builders Inc. 201
BNBuilders Inc. 288
Boh Bros. Construction Co. LLC 245
The Boldt Co. 72
Bo-Mac Contractors Ltd. 331
Bowen Engineering Corp. 311
Bozzuto Construction Co. 277
Bradbury Stamm Construction Inc. 370
Brahma Group Inc. 348
The Branch Group Inc. 182
Brasfield Gorrie LLC 29
Brinkmann Constructors 203
Brown Construction Inc. 338
Build Group Inc. 171
Bulley Andrews 189
Burns McDonnell 55
Butz Enterprises Inc. 329
Byrne Construction Services 381
C
Caddell Construction Co. (DE) LLC 157
Cahill Contractors Inc. 248
Cajun Industries LLC 131
Callahan Construction Managers 291
Cardi Corp. 282
Jay Cashman Inc. 367
Catamount Constructors Inc. 313
CBI Inc. 4
CCC Group Inc. 147
CDI Contractors LLC 266
CDM Smith 167
Centerplan Construction Co. 393
Chanen Construction Co. Inc. 316
William Charles Construction LLC 232
D.F. Chase Inc. 378
Chasse Building Team 394
China Construction America/Plaza Construction 42
Choate Construction Co. 91
The Christman Co. 102
The Cianbro Cos. 114
LPCiminelli Inc. 120
Cives Corp. 226
Clancy Theys Construction Co. 204
Clark Construction Co. Inc. 333
Clark Group 15
Clayco Inc. 46
Clune Construction Co. 134
CNY Group 387
Coastal Construction Group 76
Colas USA 53
Columbia Construction Co. 267
Commercial Contracting Group 242
Commodore Builders 264
Consigli Building Group Inc. 79
The Conti Group 239
Continental Building Systems 308
Corval Group Inc. 284
CR Meyer 194
CRB335
J. Fletcher Creamer Son Inc. 156
Crossland Construction Co. Inc. 85
Crowder Constructors Inc. 295
E.E. Cruz Co. Inc. 355
J.P. Cullen Sons Inc. 185
D
Danis Building Construction Co. 250
James G. Davis Construction Corp. 83
Day Zimmermann 39
dck worldwide LLC 139
Deacon Corp. 178
DeAngelis Diamond Construction | Healthcare
Group 306
Dellbrook/JK Scanlan 268
The Dennis Engineering Group LLC 321
Devcon Construction Inc. 56
Dick Anderson Construction Inc. 359
PJ Dick - Trumbull - Lindy Paving 81
Dimeo Construction Co. 177
Dome Construction Corp. 280
Donley’s Inc. 258
Donohoe Construction Co. 298
Doster Construction Co. Inc. 344
DPR Construction 20
C.W. Driver Cos. 87
Drymalla Construction Co. Inc. 307
Duke Construction 130
JE Dunn Construction 26
E
ECC238
Electrical Consultants Inc. 395
Elford Inc. 294
Embree Construction Group Inc. 357
EMJ Corp. 82
Enerfab103
Engineered Structures Inc. (ESI) 241
ENTACT390
EW Howell Construction Group 231
Executive Construction Inc. 353
Exxel Pacific Inc. 265
F
Fagen Inc. 202
FCI Constructors Inc. 199
Ferreira Construction Co. Inc. 233
Ferrovial US Construction Corp. 63
J. H. Findorff Son Inc. 166
Flatiron Construction Corp. 50
Fluor Corp. 2
FNF Construction Inc. 376
Forrester Construction 374
Fort Myer Construction Corp. 318
Fortis Construction Inc. 160
Jordan Foster Construction LLC 213
Frana Cos. Inc. 358
G
Gamma Construction Co. 347
Garney Holding Co. 121
Gemma Power Systems 192
Ghilotti Construction Co. 334
Gilbane Building Co. 14
GLY Construction 126
Granger Construction Co. 255
Granite Construction Inc. 28
Gray Construction 66
Graycor97
The Great Lakes Construction Co. 399
Great Lakes Dredge Dock 84
Grunley Construction Co. Inc. 176
Gulf Interstate Engineering 210
H
HM Co. Inc. 273
The Hagerman Group 379
Hanover RS Construction 119
BL Harbert International 75
Harkins Builders Inc. 300
Martin Harris Construction LLC 391
David E. Harvey Builders 32
Haselden Construction 274
Haskell124
Hathaway Dinwiddie Construction Co. 62
Hawaiian Dredging Construction Co. Inc. 110
Hawkins Construction Co. 365
Haydon Building Corp. 309
Hensel Phelps 19
Herzog Family of Cos. 116
Hill Wilkinson General Contractors 187
HITT Contracting Inc. 68
Hoar Construction 111
Hoffman Corp. 47
Holder Construction Co. 30
Holland Construction Inc. 251
Holt Construction Corp. 275
The Hubbard Group Inc. 181
Hunter Roberts Construction Group LLC 64
Hunzinger Construction Co. 364
I
i+icon USA 293
IHC Construction Cos. LLC 324
IMC Construction 227
INTECH Construction LLC 168
IPS-Integrated Project Services LLC 354
J
Jacobs13
Jacobsen Construction Co. Inc. 151
Jingoli - DCO 154
Joeris General Contractors Ltd. 137
GE Johnson Construction Co. 186
W.M. Jordan Co. 159
Juneau Construction Co. LLC 303
K
M.B. Kahn Construction Co. Inc. 218
Kaiser Foundation Health Plan Inc. 155
Kajima Building Design Group Inc. 222
KAST Construction Co. LLC 252
Where To Find the Top 400
THE TOP 400 CONTRACTORS DIRECTORY
100 ENR May 23, 2016 enr.com
ENR05232016TL_WTF2.indd 100 5/17/16 3:47 PM
21. RANK RANK RANK RANKFIRM FIRM FIRM FIRM
Kaufman Lynn Construction 345
KBE Building Corp. 247
KBR16
KBS Inc. 366
Lee Kennedy Co. Inc. 235
Key Construction Inc. 262
Kiewit Corp. 5
Kinsley Construction Inc. 172
Kitchell Corp. 169
Klinger Cos. Inc. 205
Knutson Construction 209
Albert C. Kobayashi Inc. 195
Kokosing Inc. 70
KPRS Construction Services Inc. 208
Kraemer Brothers LLC 396
Kraemer North America LLC 325
Kraus-Anderson Construction Co. 108
L
Lane Industries Inc. 45
Las Vegas Paving Corp. 144
Lauren Engineers Constructors Inc. 127
Layne Christensen Co. 106
Layton Construction Co. LLC 57
Lease Crutcher Lewis 145
LeChase Construction Services LLC 113
Ledcor Group 214
Lee Lewis Construction 146
Leidos198
The Lemoine Co. 360
Lendlease21
Leopardo Construction 207
Level 10 Construction 90
Linbeck Group LLC 162
Lobar Inc. 377
Loenbro Inc. 386
Lusardi Construction Co. 327
Lydig Construction 287
Lyles Construction Group 259
M
M+W Group 54
Manhattan Construction Group 44
Manson Construction Co. 175
March Associates Construction Inc. 369
Market Johnson Inc. 278
Mascaro Construction Co. LP 228
Matrix Service Co. 49
MATT Construction 224
McCarthy Holdings Inc. 25
McCarthy Improvement Co. 332
McCormick Inc. Subsidiaries 330
McGough125
James McHugh Construction Co. 165
MCM281
The McShane Cos. 98
Messer Construction Co. 60
Meyer Najem Construction 343
Michels Corp. 34
The Middlesex Cos. 243
Millie and Severson General Contractors 289
Miron Construction Co. Inc. 104
Monadnock Construction Inc. 249
Morganti Group Inc. 336
Morley Builders Inc. 230
Mortenson Construction 18
MW Builders 315
MWH Global 153
MYCON General Contractors 398
Allan Myers Inc. 115
N
Nabholz Construction Corp. 133
Nan Inc. 342
New Enterprise Stone Lime Co. Inc. 270
New South Construction Co. Inc. 244
Nibbi Brothers General Contractors 328
T.G. Nickel Associates LLC 216
Novak Construction Co. 351
O
OG Industries Inc. 219
Odebrecht Construction Inc. 279
OHL USA Inc. 43
Okland Construction Co. Inc. 101
R.D. Olson Construction 302
Oltmans Construction Co. 221
Omnibuild382
O’Neil Industries Inc. 107
C. Overaa Co. 283
P
PARIC Corp. 196
Parkway322
Parsons117
F.H. Paschen, S.N. Nielsen Associates LLC 135
PC Construction Co. 150
PCL Construction Enterprises Inc. 8
T.B. Penick Sons Inc. 305
The PENTA Building Group 190
Pepper Construction Group 67
Performance Contractors Inc. 38
Pernix Group Inc. 341
GH Phipps Construction Cos. 361
The Pike Cos. Ltd. 141
Pioneer General Contractors Inc. 323
Plant Construction Co. LP 225
Pogue Construction Co. LP 276
Posillico253
Power Construction Co. LLC 74
Primoris Services Corp. 33
Primus Builders Inc. 349
Pro Con Inc. 337
Q
QD Construction Inc. 320
Quandel Enterprises Inc. 257
R
RO Construction 260
RailWorks Corp. 105
RC Andersen LLC 368
E.E. Reed Construction LP 129
Rice Lake Construction Group 314
Riley Construction Co. Inc. 388
River City Construction LLC 299
James E. Roberts - Obayashi Corp. 234
Robins Morton 78
Rockford Construction 138
Rodgers Builders Inc. 211
Roebbelen Contracting Inc. 356
Rogers-O’Brien Construction 229
Roncelli Inc. 292
Ross Group 397
Rudolph/Libbe Cos. Inc. 163
The Ruhlin Co. 375
Ryan Cos. US Inc. 51
Rycon Construction Inc. 290
S
SB Engineers and Constructors Ltd. Affiliates 58
Samet Corp. 261
Satterfield Pontikes Construction 136
Saulsbury Industries Inc. 109
Saunders Construction Inc. 170
Schimenti Construction Co. 317
CG Schmidt 285
Sellen Construction Co. Inc. 86
SEMA Construction Inc. 272
Shaw Construction 340
Shawmut Design and Construction 59
Shelco LLC 237
Shiel Sexton Co. Inc. 256
Shimizu North America LLC 191
Shimmick Construction Co. Inc. 158
Shook Construction Co. 312
Skanska USA 7
Skender Construction 240
Sletten Cos. 297
C D Smith Construction 197
Southland/Renda/JBros128
SpawGlass Holding LP 164
Stacy and Witbeck Inc. 200
Stellar132
Strike99
Structure Tone 17
Suffolk Construction Co. 27
Sukut Construction LLC 362
Summit Contracting Group Inc. 304
Sundt Construction Inc. 77
Superior Construction Holding Co. Inc. 319
Swinerton Inc. 24
T
Teichert Construction 188
Tellepsen100
Terminal Construction Corp. 384
The Conlan Co. 122
The Jaynes Cos. 350
Torcon Inc. 184
Traylor Bros. Inc. 217
Triangle Associates 383
Tri-North Builders Inc. 339
The Turner Corp. 3
Turner Industries Group LLC 23
Tutor Perini Corp. 10
V
Vance Brown Inc. 212
James R.Vannoy Sons Construction Co. Inc. 206
VCC LLC 94
Vecellio Group Inc. 215
W
Walbridge41
The Walsh Group Ltd. 11
The Walsh Group/Walsh Construction Co. 271
T.N.Ward Co. 326
Webcor Construction LP dba Webcor Builders 52
Weeks Marine Inc. 96
Weis Builders Inc. 174
The Weitz Co. 65
Wharton-Smith Inc. 310
The Whiting-Turner Contracting Co. 9
Wieland246
F.A.Wilhelm Construction Co. Inc. 142
Willbros Group Inc. 80
Williams Brothers Construction Co. Inc. 180
Williams Industrial Services Group LLC 236
S.M.Wilson Co. 220
The Winter Construction Co. 385
Winter Park Construction (WPC) 389
Wohlsen Construction Co. 223
Woodward Design+Build 400
S.T.Wooten Corp. 346
X
XL Construction Corp. 193
Y
The Yates Cos. Inc. 36
Z
Zachry Construction Corp. 179
Zachry Group 22
Where To Find the Top 400
THE TOP 400 CONTRACTORS DIRECTORY
102 ENR May 23, 2016 enr.com
ENR05232016TL_WTF2.indd 102 5/17/16 3:45 PM
22. 1
2016 Top 400 Contractors – Subsidiaries by Rank
RankCompany Subsidiary Rank Company Subsidiary
1 Bechtel
Bantrel Co.
Bechtel Construction Operations Inc.
Bechtel Corp.
Bechtel Infrastructure and Power Corp.
Bechtel Ltd.
Bechtel Nuclear, Security Environmental Inc.
Bechtel Oil, Gas Chemicals
2 Fluor Corp.
Fluor Constructors International Inc.
Fluor Enterprises Inc.
4 CBI Inc.
Arabian CBI Ltd.
CBI Inc.
CBI Lummus BV
CBI UK Ltd.
CBI Co. Ltd.
CBI Constructors Pty Ltd.
CBI Constructors SA (Pty) Ltd.
CBI Eastern Anstalt
CBI Overseas LLC
CBI Services Inc.
CBI Venezolana SA
Horton CBI Ltd.
Lummus Technology
7 Skanska USA
Skanska USA Building
Skanska USA Civil
8 PCL Construction Enterprises Inc.
Melloy Industrial Services Inc.
Nordic PCL Construction Inc.
PCL Civil Constructors Inc.
PCL Construction Management Inc.
PCL Construction Resources Inc.
PCL Construction Services Inc.
PCL Constructors Canada Inc.
PCL Constructors Northern Inc.
PCL Constructors Westcoast Inc.
PCL Energy Inc.
PCL Industrial Construction Co.
PCL Industrial Constructors Inc.
PCL Industrial Management Inc.
PCL Industrial Services Inc.
PCL Intracon Power Inc.
PCL Pacific Rim PTY Ltd.
10 Tutor Perini Corp.
Becho Inc.
Black Construction Corp.
Frontier-Kemper Constructors
Lunda Construction Co.
Perini Management Services
Roy Anderson Corp.
Rudolph Sletten
Tutor Perini Building Corp.
Tutor Perini Civil Construction
Tutor-Saliba Corp.
11 The Walsh Group Ltd.
Archer Western
Walsh Construction
12 Balfour Beatty US
Balfour Beatty Communities
Balfour Beatty Construction
Balfour Beatty Infrastructure
Balfour Beatty Rail
Balfour Resource Group
Fru-Con
Heery International
13 Jacobs
All subsidiaries listed in Form 10-K, published in
October of each year
15 Clark Group
Atkinson Construction
C3M Power Systems
Clark Realty CBG Building Co.
Shirley Contracting
17 Structure Tone
LF Driscoll Co. LLC
Pavarini Construction
Pavarini McGovern LLC
Structure Tone Inc.
Structure Tone Southwest Inc.
Structure Tone UK Inc.
18 Mortenson Construction
Mortenson Construction
Mortenson International Inc.
19 Hensel Phelps
Hensel Phelps Development
Hensel Phelps Services
21 Lendlease
Lend Lease (US) Construction Inc., Chicago
Lend Lease (US) Construction Inc., Columbus
Lend Lease (US) Construction Inc., Los Angeles
![NUMBER OF FIRMS
REPORTING PROFITABILITY
DOMESTIC
PROFITS
323
DOMESTIC
LOSSES
26
INTERNATIONAL
PROFITS
47
INTERNATIONAL
LOSSES
38
VOLUME
DOMESTIC
REVENUE
$294.4
DOMESTIC
NEW
CONTRACTS
$293.8
INTERNATIONAL
REVENUE
$49.8
INTERNATIONAL
NEW
CONTRACTS
$43.8
$ BILLIONS
NUMBER OF FIRMS
REPORTING
SIZE OF
BACKLOG
HIGHER
238
LOWER
67
SAME
56
COMPARING THE
PAST DECADE’S
CONTRACTOR
REVENUE
$331.9
2014
$324.2
2013
$262.8
2006
$304.4
2007
$338.4
2008
$290.6
2009
$259.4
2010
SOURCE: DODGE DATA & ANALYTICS/ENR
$282.1
2011
$309.4
2012
$ BILLIONS
$344.1
2015
The market finally has come all the way back to pre-
recession levels for U.S. general contractors and
construction managers. The market is strong without
overheating and without the crippling worker short-
ages that were predicted. However, large contractors
in the big-ticket international oil-and-gas and mining
markets did take a hit in 2015, although most are
poised to weather that storm.
For ENR’s Top 400 Contractors, 2015 was a pretty
good year. The Top 400 generated $344.14 billion in
contracting revenue in 2015, an increase of 3.7% from
2014’s $331.94 billion. The figure marks a record high
for the Top 400, eclipsing the previous record of
$338.38 billion in 2008, reported in our 2009 Top 400.
However, the real story is on the domestic side. Con-
tracting revenue from U.S. projects rose a healthy 9.5%,
to $294.35 billion, and international contracting reve-
nue plunged 21.1%, to $49.79 billion, in 2015. The
international market saw major declines in projects in
the minerals-and-mining, petroleum and power sectors.
Bechtel continued its dominance on the Top 400,
ranking No. 1 for the 18th consecutive year. However,
low oil prices and a decline in the minerals-and-mining
sector have had a significant impact on its markets. The
slowdown in the Chinese economy has hurt commodity
prices in many sectors, says Brendan Bechtel, president
and COO. “I expect the international market for com-
modities [such as oil and gas and minerals and metals]
to be on a down cycle for the next couple of years.”
Fluor reported a record backlog in the first quarter
of 2016. At the quarterly analyst briefing on earnings,
CEO David Seaton said he has not seen any major
project cancellations. However, he noted that sched-
ules on some of Fluor’s oil-and-gas projects have been
stretched out.
Bechtel is much more optimistic about the domestic
market. “Here in the U.S., we still have the most robust
economy in the world.” He says there are opportunities
in the market for liquefied-natural-gas export terminals,
and he expects a significant spike in gas-fired combined-
cycle power plants as coal plants are closed and a few
nuclear plants are retired.
Overall, Bechtel believes that, while the interna-
tional market has softened, there continues to be a lot
of work available. “There are plenty of good oppor-
tunities for firms that are smart and disciplined,” he
says. For example, Bechtel just broke ground on the
Edmonton Valley Line Light Rail Transit-Stage 1
project in Alberta, Canada.
Near-Term Optimism
For most firms, the current market is strong and
poised to be healthy for the near term. “We are very
optimistic for the not-too-distant future,” says Pat Di
“I expect the
international
market for
commodities
[such as oil and
gas and
minerals and
metals] to be
on a down
cycle for the
next couple of
years. … [But]
there are
plenty of good
opportunities
for firms that
are smart and
disciplined.”
Brendan Bechtel,
President and
COO, Bechtel
2015-2016 at a Glance
THE TOP 400 CONTRACTORS
64 Ⅲ ENR Ⅲ May 23, 2016 enr.com
ENR05232016TL_Overview.indd 64 5/18/16 1:43 PM](data:image/gif;base64,R0lGODlhAQABAIAAAAAAAP///yH5BAEAAAAALAAAAAABAAEAAAIBRAA7)