SlideShare a Scribd company logo
SECTORAL COGNITIVE SKILLS,
R&D AND PRODUCTIVITY
A cross-country analysis
SIMONE SASSO, JO RITZEN
MODEL 1 MODEL 2 MODEL 3 MODEL 4 MODEL 5 MODEL 6 MODEL 7
log (labour) 0.058*** -0.077*** 0.0655** 0.044* 0.053** 0.058*** 0.062**
log (capital per worker) 0.418*** 0.324*** 0.546*** 0.441*** 0.431*** 0.417*** 0.535***
log (R&D per worker) 0.123*** 0.030 0.163*** 0.126*** 0.123*** 0.383 0.158***
log PIAAC numeracy 1.240** 2.879*** 0.203 1.059* 1.237** -1.619
log (avg years school) 0.499 0.076
log (R&D) x log (PIAAC) -0.0462
% PIAAC num. lev. 3 0.004
% PIAAC num. lev. 4 0.015*
industry dummies YES YES
Country dummies YES
Constant -5.054* -13.050*** -0.042 0.599 -4.273 -5.031 9.926
N. Obs. 204 204 204 187 187 204 204
R2 0.690 0.849 0.836 0.687 0.691 0.690 0.839
CONCEPTUAL FRAMEWORK
• Productivity growth is ultimately determined by technological progress (Solow, 1957)
• Education, by equipping individuals with knowledge and skills, enables them to generate new
ideas, to stimulate innovation and to increase the economic output (e.g. Lucas, 1988; Romer, 1986).
• R&D, by aiming at increasing the stock of knowledge and finding new innovative solutions, boosts
the economic output (e.g. Romer, 1990; Grossman and Helpman, 1991)
• Complementarities between skills and R&D
· R&D ➝ Innovation ➝ Skills : Skilled-biased technological change (e.g. Accemoglu, 2002)
· Skills ➝ R&D ➝ Innovation : Induced skilled-biased technological change (e.g. Piva and Vivarelli, 2015)
STATE OF THE ART
• Returns to education: most studies based on input-variables (i.e. school attainment e.g. Barro and Lee,
2010) with contrasting results (e.g. Mankiw, Romer and Weil, 1992 vs. Prichett, 2001)
• Returns to R&D: fewer studies at the sectoral level (e.g. Bartelsman , 1990; Ortega-Argilés et al., 2015), mainly
focusing on manufacturing and not on services (e.g. Verspagen, 1995)
We analyse the skills - R&D - productivity relationship and
the possible complementarities across countries and sectors. Low-tech sector (Textiles) High-tech sector (Chemicals and pharmaceuticals)
METHOD
• We compute a measure of average sectoral cognitive skills across 12 countries and 17 industries
both in manufacturing and services
• We use econometrics in order to investigate the relationship between cognitive skills, R&D and
productivity and their possible complementarities
Table 1. Log-log regressions of labour productivity on skills and R&D investments across sector-country combinations.
***, ** and * indicate significance at the 1, 5 and 10 percent levels respectively.
COGNITIVE SKILLS BY SECTOR
Cognitive skills by sector
294.5
287.7
283.4
279.6 279.5 279.4
275.1 274.6
269.1 268.5 267.3 266.7 266.4
262.7 261.5 259.4 259.0
260
280
300
320
220
240
Average numeracy skills by sector (with sectoral min and max values). Source: own calculations based on OECD PIAAC database
COGNITIVE SKILLS BY COUNTRY
Cognitive skills by country
293.4
289.8
287.2
277.3 277.3
271.7
267.9
265.2 263.6 261.7 259.9
280
300
320
263.6 261.7 259.9
256.4
220
240
260
JPN BEL NLD CZE DEU UK POL FRA KOR USA ESP ITA
Average numeracy skills by country (with sectoral min and max values). Source: own calculations based on OECD PIAAC database
COGNITIVE SKILLS & PRODUCTIVITY :
HIGH-TECH VS. LOW-TECH SECTORS
Skills and productivity: hi-tech vs. low tech
France
NetherlandsJapan
Belgium
Germany
United States
Korea
200300
Labourproductivity
France
United Kingdom
BelgiumNetherlands
Japan
Czech Republic
Czech Republic
Poland
Poland
Italy
Spain
United Kingdom
Italy
Germany
United States
Korea
Spain
0100
Labourproductivity
220 240 260 280 300 320
Cognitive skills (numeracy)
FINDINGS
• High heterogeneity of cognitive skills across sectors and countries
• Strong positive relationship between skills and productivity and not between schooling and
productivity
• Complementarity between R&D and skills remains an open question
• Longitudinal data on cognitive skills are necessary to investigate the causality of the
skills-R&D-productivity relationship
Are you interested in this research?
Contact the authors!
Simone Sasso
sasso@merit.unu.edu
Jo Ritzen
j.ritzen@maastrichtuniversity.nl
ln = ln A+ +
Q C RD
L ij
ij
L Lij
ij
ij
ij ij
ij
ln ln ln SKILLS ln +εα2
+ α4
+ −1)(α1
+ α2
+ α3
α3
Lij
WIOD
• Gross value added, capital stocks
and labour stocks
1995-2011, 2 digit ISIC Rev. 3.1 (35 sectors)
OECD ANBERD
• R&D expenditures
1995-2013, 1 and 2 digit ISIC Rev. 3 or ISIC Rev. 4
OECD PIAAC
• Test scores measuring adult
cognitive skills
(numeracy, literacy,
problem solving)
2011-2012, 2 digit ISIC Rev. 4
DATA
• We match data coming from 3 databases:
Average numeracy skills by country (mean, min and max values on a scale 0-500). Source: own calculations based on OECD PIAAC data.
Average numeracy skills by sector (mean, min and max values on a scale 0-500). Source: own calculations based on OECD PIAAC data.
Average sectoral numeracy skills (on a scale 0-500) and average sectoral labour productivity (in thousand USD at constant 1995 prices).
Source: own calculations based on WIOD and OECD PIAAC data.
RANKING OF LABOUR PRODUCTIVITYRANKING OF LABOUR PRODUCTIVITY
0 20 40 60 80 100 120 140 160
Japan
Belgium
United States
Netherlands
France
Germany
KoreaKorea
United Kindgom
Italy
Spain
Czech Republic
Poland
Explained by Labour
Explained by Capital
Explained by R&D
Explained by Skills
Constant and residual

More Related Content

Viewers also liked (6)

Poland's Digital Future
Poland's Digital FuturePoland's Digital Future
Poland's Digital Future
 
Politics of Poland
Politics of PolandPolitics of Poland
Politics of Poland
 
Lavrans Løvlie_Nordic Health and Welfare Innovation Arena
Lavrans Løvlie_Nordic Health and Welfare Innovation ArenaLavrans Løvlie_Nordic Health and Welfare Innovation Arena
Lavrans Løvlie_Nordic Health and Welfare Innovation Arena
 
082-NIFU Measuring Educational R&D
082-NIFU Measuring Educational R&D082-NIFU Measuring Educational R&D
082-NIFU Measuring Educational R&D
 
KMD Poland at a glace…
KMD Poland at a glace…KMD Poland at a glace…
KMD Poland at a glace…
 
#Inttisome kokeilukulttuuri kalle_nieminen_sitra
#Inttisome kokeilukulttuuri kalle_nieminen_sitra#Inttisome kokeilukulttuuri kalle_nieminen_sitra
#Inttisome kokeilukulttuuri kalle_nieminen_sitra
 

Similar to 149-Sasso Sectoral cognitive skills R&D and productivity

Doran and Jordan 23 3-2011
Doran and Jordan 23 3-2011Doran and Jordan 23 3-2011
Doran and Jordan 23 3-2011
doran_justin
 
Session 4 c discussion of timmer and xianjia ye paper in session 4a 26 august
Session 4 c discussion of timmer and xianjia ye paper in session 4a 26 augustSession 4 c discussion of timmer and xianjia ye paper in session 4a 26 august
Session 4 c discussion of timmer and xianjia ye paper in session 4a 26 august
IARIW 2014
 

Similar to 149-Sasso Sectoral cognitive skills R&D and productivity (20)

Labor market regulation, capital intensity and productivity
Labor market regulation, capital intensity and productivityLabor market regulation, capital intensity and productivity
Labor market regulation, capital intensity and productivity
 
Session 4 a i alriw 2014 session 4a squicciarini and lemouel
Session 4 a i alriw 2014 session 4a squicciarini and lemouelSession 4 a i alriw 2014 session 4a squicciarini and lemouel
Session 4 a i alriw 2014 session 4a squicciarini and lemouel
 
The digital transformation: Measurement and implications for competition and ...
The digital transformation: Measurement and implications for competition and ...The digital transformation: Measurement and implications for competition and ...
The digital transformation: Measurement and implications for competition and ...
 
Driving Productivity Growth: The Importance of Firm-Specific Knowledge Assets
Driving Productivity Growth: The Importance of Firm-Specific Knowledge AssetsDriving Productivity Growth: The Importance of Firm-Specific Knowledge Assets
Driving Productivity Growth: The Importance of Firm-Specific Knowledge Assets
 
[Econ4354] MNC RnD Impacts
[Econ4354] MNC RnD Impacts[Econ4354] MNC RnD Impacts
[Econ4354] MNC RnD Impacts
 
Session 4 a chen et al discussion
Session 4 a chen et al   discussionSession 4 a chen et al   discussion
Session 4 a chen et al discussion
 
Doran and Jordan 23 3-2011
Doran and Jordan 23 3-2011Doran and Jordan 23 3-2011
Doran and Jordan 23 3-2011
 
Job Dynamics: New International Evidence. Carlo Menon. ERC Understanding Smal...
Job Dynamics: New International Evidence. Carlo Menon. ERC Understanding Smal...Job Dynamics: New International Evidence. Carlo Menon. ERC Understanding Smal...
Job Dynamics: New International Evidence. Carlo Menon. ERC Understanding Smal...
 
Presentation Af Gb 2008
Presentation Af Gb 2008Presentation Af Gb 2008
Presentation Af Gb 2008
 
Tecnical Efficiency of Manufacturing SME's in Malaysia
Tecnical Efficiency of Manufacturing SME's in MalaysiaTecnical Efficiency of Manufacturing SME's in Malaysia
Tecnical Efficiency of Manufacturing SME's in Malaysia
 
The future of remote work in Trentino - Wessel Vermeulen
The future of remote work in Trentino - Wessel Vermeulen The future of remote work in Trentino - Wessel Vermeulen
The future of remote work in Trentino - Wessel Vermeulen
 
Introduction to statistics
Introduction to statisticsIntroduction to statistics
Introduction to statistics
 
Low Incidences of High Growth Firms in Scotland: Why is Scotland lagging behind?
Low Incidences of High Growth Firms in Scotland: Why is Scotland lagging behind?Low Incidences of High Growth Firms in Scotland: Why is Scotland lagging behind?
Low Incidences of High Growth Firms in Scotland: Why is Scotland lagging behind?
 
The TeamLease Employment Outlook Report: Quarter-3, 2011-12
The TeamLease Employment Outlook Report: Quarter-3, 2011-12The TeamLease Employment Outlook Report: Quarter-3, 2011-12
The TeamLease Employment Outlook Report: Quarter-3, 2011-12
 
R&Dによる知識資産の資本化と産業連関表の改訂および 全要素生産性測定
R&Dによる知識資産の資本化と産業連関表の改訂および全要素生産性測定R&Dによる知識資産の資本化と産業連関表の改訂および全要素生産性測定
R&Dによる知識資産の資本化と産業連関表の改訂および 全要素生産性測定
 
IRJET- Impact of Demonetisation and Gst on Construction Industry
IRJET- Impact of Demonetisation and Gst on Construction IndustryIRJET- Impact of Demonetisation and Gst on Construction Industry
IRJET- Impact of Demonetisation and Gst on Construction Industry
 
Regional 4
Regional 4Regional 4
Regional 4
 
Session 4 c discussion of timmer and xianjia ye paper in session 4a 26 august
Session 4 c discussion of timmer and xianjia ye paper in session 4a 26 augustSession 4 c discussion of timmer and xianjia ye paper in session 4a 26 august
Session 4 c discussion of timmer and xianjia ye paper in session 4a 26 august
 
Fast-Growth SMEs in the Scottish Economy: Developing an Econometric Model of...
Fast-Growth SMEs in the Scottish Economy:  Developing an Econometric Model of...Fast-Growth SMEs in the Scottish Economy:  Developing an Econometric Model of...
Fast-Growth SMEs in the Scottish Economy: Developing an Econometric Model of...
 
Session 4 c discussion of xianjia ye paper in session 4a 26 august
Session 4 c discussion of xianjia ye paper in session 4a 26 augustSession 4 c discussion of xianjia ye paper in session 4a 26 august
Session 4 c discussion of xianjia ye paper in session 4a 26 august
 

More from innovationoecd

Global Forum on Digital Security for Prosperity December 2018 event photo book
Global Forum on Digital Security for Prosperity December 2018 event photo bookGlobal Forum on Digital Security for Prosperity December 2018 event photo book
Global Forum on Digital Security for Prosperity December 2018 event photo book
innovationoecd
 

More from innovationoecd (20)

OECD bibliometric indicators: Selected highlights, April 2024
OECD bibliometric indicators: Selected highlights, April 2024OECD bibliometric indicators: Selected highlights, April 2024
OECD bibliometric indicators: Selected highlights, April 2024
 
Presentation of the OECD Science, Technology and Innovation Outlook 2023
Presentation of the OECD Science, Technology and Innovation Outlook 2023Presentation of the OECD Science, Technology and Innovation Outlook 2023
Presentation of the OECD Science, Technology and Innovation Outlook 2023
 
OECD bibliometric indicators: Selected highlights, March 2023 edition
OECD bibliometric indicators: Selected highlights, March 2023 editionOECD bibliometric indicators: Selected highlights, March 2023 edition
OECD bibliometric indicators: Selected highlights, March 2023 edition
 
OECD-Vinnova workshop, 7-8 February 2022
OECD-Vinnova workshop, 7-8 February 2022OECD-Vinnova workshop, 7-8 February 2022
OECD-Vinnova workshop, 7-8 February 2022
 
OECD-Vinnova workshop, 7-8 February 2022
OECD-Vinnova workshop, 7-8 February 2022OECD-Vinnova workshop, 7-8 February 2022
OECD-Vinnova workshop, 7-8 February 2022
 
OECD-VINNOVA Workshop, 7-8 February 2022
OECD-VINNOVA Workshop, 7-8 February 2022OECD-VINNOVA Workshop, 7-8 February 2022
OECD-VINNOVA Workshop, 7-8 February 2022
 
Analysis of scientific publishing activity: Key findings, December 2021
Analysis of scientific publishing activity: Key findings, December 2021Analysis of scientific publishing activity: Key findings, December 2021
Analysis of scientific publishing activity: Key findings, December 2021
 
Recommandation du Conseil de l'OCDE sur l'amélioration de l'accès aux données...
Recommandation du Conseil de l'OCDE sur l'amélioration de l'accès aux données...Recommandation du Conseil de l'OCDE sur l'amélioration de l'accès aux données...
Recommandation du Conseil de l'OCDE sur l'amélioration de l'accès aux données...
 
OECD Council Recommendation on Enhancing Access to and Sharing of Data
OECD Council Recommendation on Enhancing Access to and Sharing of DataOECD Council Recommendation on Enhancing Access to and Sharing of Data
OECD Council Recommendation on Enhancing Access to and Sharing of Data
 
2020.01.12 OECD STI Outlook launch - Impacts of COVID-19: How STI systems res...
2020.01.12 OECD STI Outlook launch - Impacts of COVID-19: How STI systems res...2020.01.12 OECD STI Outlook launch - Impacts of COVID-19: How STI systems res...
2020.01.12 OECD STI Outlook launch - Impacts of COVID-19: How STI systems res...
 
OECD Digital Economy Outlook 2020: Key findings
OECD Digital Economy Outlook 2020: Key findingsOECD Digital Economy Outlook 2020: Key findings
OECD Digital Economy Outlook 2020: Key findings
 
Understanding the world of science and scientists
Understanding the world of science and scientistsUnderstanding the world of science and scientists
Understanding the world of science and scientists
 
Global Forum on Digital Security for Prosperity November 2019 event photo book
Global Forum on Digital Security for Prosperity November 2019 event photo bookGlobal Forum on Digital Security for Prosperity November 2019 event photo book
Global Forum on Digital Security for Prosperity November 2019 event photo book
 
Going Digital: Shaping Policies, Improving Lives
Going Digital: Shaping Policies, Improving LivesGoing Digital: Shaping Policies, Improving Lives
Going Digital: Shaping Policies, Improving Lives
 
Global Forum on Digital Security for Prosperity December 2018 event photo book
Global Forum on Digital Security for Prosperity December 2018 event photo bookGlobal Forum on Digital Security for Prosperity December 2018 event photo book
Global Forum on Digital Security for Prosperity December 2018 event photo book
 
Oslo Manual 2018
Oslo Manual 2018Oslo Manual 2018
Oslo Manual 2018
 
OECD Digital Economy Outlook 2017: Setting the foundations for the digital tr...
OECD Digital Economy Outlook 2017: Setting the foundations for the digital tr...OECD Digital Economy Outlook 2017: Setting the foundations for the digital tr...
OECD Digital Economy Outlook 2017: Setting the foundations for the digital tr...
 
OECD Digital Economy Outlook 2017: Presentation at Global Parliamentary Netwo...
OECD Digital Economy Outlook 2017: Presentation at Global Parliamentary Netwo...OECD Digital Economy Outlook 2017: Presentation at Global Parliamentary Netwo...
OECD Digital Economy Outlook 2017: Presentation at Global Parliamentary Netwo...
 
Making the next production revolution inclusive open and secure
Making the next production revolution inclusive open and secureMaking the next production revolution inclusive open and secure
Making the next production revolution inclusive open and secure
 
Presentation for the OECD Telecommunication and Broadcasting Review of Mexico...
Presentation for the OECD Telecommunication and Broadcasting Review of Mexico...Presentation for the OECD Telecommunication and Broadcasting Review of Mexico...
Presentation for the OECD Telecommunication and Broadcasting Review of Mexico...
 

Recently uploaded

一比一原版(IIT毕业证)伊利诺伊理工大学毕业证成绩单
一比一原版(IIT毕业证)伊利诺伊理工大学毕业证成绩单一比一原版(IIT毕业证)伊利诺伊理工大学毕业证成绩单
一比一原版(IIT毕业证)伊利诺伊理工大学毕业证成绩单
ewymefz
 
一比一原版(UMich毕业证)密歇根大学|安娜堡分校毕业证成绩单
一比一原版(UMich毕业证)密歇根大学|安娜堡分校毕业证成绩单一比一原版(UMich毕业证)密歇根大学|安娜堡分校毕业证成绩单
一比一原版(UMich毕业证)密歇根大学|安娜堡分校毕业证成绩单
ewymefz
 
一比一原版(TWU毕业证)西三一大学毕业证成绩单
一比一原版(TWU毕业证)西三一大学毕业证成绩单一比一原版(TWU毕业证)西三一大学毕业证成绩单
一比一原版(TWU毕业证)西三一大学毕业证成绩单
ocavb
 
一比一原版(ArtEZ毕业证)ArtEZ艺术学院毕业证成绩单
一比一原版(ArtEZ毕业证)ArtEZ艺术学院毕业证成绩单一比一原版(ArtEZ毕业证)ArtEZ艺术学院毕业证成绩单
一比一原版(ArtEZ毕业证)ArtEZ艺术学院毕业证成绩单
vcaxypu
 
一比一原版(CU毕业证)卡尔顿大学毕业证成绩单
一比一原版(CU毕业证)卡尔顿大学毕业证成绩单一比一原版(CU毕业证)卡尔顿大学毕业证成绩单
一比一原版(CU毕业证)卡尔顿大学毕业证成绩单
yhkoc
 
一比一原版(CBU毕业证)卡普顿大学毕业证成绩单
一比一原版(CBU毕业证)卡普顿大学毕业证成绩单一比一原版(CBU毕业证)卡普顿大学毕业证成绩单
一比一原版(CBU毕业证)卡普顿大学毕业证成绩单
nscud
 
一比一原版(RUG毕业证)格罗宁根大学毕业证成绩单
一比一原版(RUG毕业证)格罗宁根大学毕业证成绩单一比一原版(RUG毕业证)格罗宁根大学毕业证成绩单
一比一原版(RUG毕业证)格罗宁根大学毕业证成绩单
vcaxypu
 
一比一原版(UPenn毕业证)宾夕法尼亚大学毕业证成绩单
一比一原版(UPenn毕业证)宾夕法尼亚大学毕业证成绩单一比一原版(UPenn毕业证)宾夕法尼亚大学毕业证成绩单
一比一原版(UPenn毕业证)宾夕法尼亚大学毕业证成绩单
ewymefz
 
一比一原版(UofM毕业证)明尼苏达大学毕业证成绩单
一比一原版(UofM毕业证)明尼苏达大学毕业证成绩单一比一原版(UofM毕业证)明尼苏达大学毕业证成绩单
一比一原版(UofM毕业证)明尼苏达大学毕业证成绩单
ewymefz
 
一比一原版(CBU毕业证)不列颠海角大学毕业证成绩单
一比一原版(CBU毕业证)不列颠海角大学毕业证成绩单一比一原版(CBU毕业证)不列颠海角大学毕业证成绩单
一比一原版(CBU毕业证)不列颠海角大学毕业证成绩单
nscud
 
Opendatabay - Open Data Marketplace.pptx
Opendatabay - Open Data Marketplace.pptxOpendatabay - Open Data Marketplace.pptx
Opendatabay - Open Data Marketplace.pptx
Opendatabay
 

Recently uploaded (20)

一比一原版(IIT毕业证)伊利诺伊理工大学毕业证成绩单
一比一原版(IIT毕业证)伊利诺伊理工大学毕业证成绩单一比一原版(IIT毕业证)伊利诺伊理工大学毕业证成绩单
一比一原版(IIT毕业证)伊利诺伊理工大学毕业证成绩单
 
Uber Ride Supply Demand Gap Analysis Report
Uber Ride Supply Demand Gap Analysis ReportUber Ride Supply Demand Gap Analysis Report
Uber Ride Supply Demand Gap Analysis Report
 
Tabula.io Cheatsheet: automate your data workflows
Tabula.io Cheatsheet: automate your data workflowsTabula.io Cheatsheet: automate your data workflows
Tabula.io Cheatsheet: automate your data workflows
 
Q1’2024 Update: MYCI’s Leap Year Rebound
Q1’2024 Update: MYCI’s Leap Year ReboundQ1’2024 Update: MYCI’s Leap Year Rebound
Q1’2024 Update: MYCI’s Leap Year Rebound
 
一比一原版(UMich毕业证)密歇根大学|安娜堡分校毕业证成绩单
一比一原版(UMich毕业证)密歇根大学|安娜堡分校毕业证成绩单一比一原版(UMich毕业证)密歇根大学|安娜堡分校毕业证成绩单
一比一原版(UMich毕业证)密歇根大学|安娜堡分校毕业证成绩单
 
Webinar One View, Multiple Systems No-Code Integration of Salesforce and ERPs
Webinar One View, Multiple Systems No-Code Integration of Salesforce and ERPsWebinar One View, Multiple Systems No-Code Integration of Salesforce and ERPs
Webinar One View, Multiple Systems No-Code Integration of Salesforce and ERPs
 
Using PDB Relocation to Move a Single PDB to Another Existing CDB
Using PDB Relocation to Move a Single PDB to Another Existing CDBUsing PDB Relocation to Move a Single PDB to Another Existing CDB
Using PDB Relocation to Move a Single PDB to Another Existing CDB
 
Criminal IP - Threat Hunting Webinar.pdf
Criminal IP - Threat Hunting Webinar.pdfCriminal IP - Threat Hunting Webinar.pdf
Criminal IP - Threat Hunting Webinar.pdf
 
一比一原版(TWU毕业证)西三一大学毕业证成绩单
一比一原版(TWU毕业证)西三一大学毕业证成绩单一比一原版(TWU毕业证)西三一大学毕业证成绩单
一比一原版(TWU毕业证)西三一大学毕业证成绩单
 
Business update Q1 2024 Lar España Real Estate SOCIMI
Business update Q1 2024 Lar España Real Estate SOCIMIBusiness update Q1 2024 Lar España Real Estate SOCIMI
Business update Q1 2024 Lar España Real Estate SOCIMI
 
一比一原版(ArtEZ毕业证)ArtEZ艺术学院毕业证成绩单
一比一原版(ArtEZ毕业证)ArtEZ艺术学院毕业证成绩单一比一原版(ArtEZ毕业证)ArtEZ艺术学院毕业证成绩单
一比一原版(ArtEZ毕业证)ArtEZ艺术学院毕业证成绩单
 
一比一原版(CU毕业证)卡尔顿大学毕业证成绩单
一比一原版(CU毕业证)卡尔顿大学毕业证成绩单一比一原版(CU毕业证)卡尔顿大学毕业证成绩单
一比一原版(CU毕业证)卡尔顿大学毕业证成绩单
 
一比一原版(CBU毕业证)卡普顿大学毕业证成绩单
一比一原版(CBU毕业证)卡普顿大学毕业证成绩单一比一原版(CBU毕业证)卡普顿大学毕业证成绩单
一比一原版(CBU毕业证)卡普顿大学毕业证成绩单
 
一比一原版(RUG毕业证)格罗宁根大学毕业证成绩单
一比一原版(RUG毕业证)格罗宁根大学毕业证成绩单一比一原版(RUG毕业证)格罗宁根大学毕业证成绩单
一比一原版(RUG毕业证)格罗宁根大学毕业证成绩单
 
How can I successfully sell my pi coins in Philippines?
How can I successfully sell my pi coins in Philippines?How can I successfully sell my pi coins in Philippines?
How can I successfully sell my pi coins in Philippines?
 
一比一原版(UPenn毕业证)宾夕法尼亚大学毕业证成绩单
一比一原版(UPenn毕业证)宾夕法尼亚大学毕业证成绩单一比一原版(UPenn毕业证)宾夕法尼亚大学毕业证成绩单
一比一原版(UPenn毕业证)宾夕法尼亚大学毕业证成绩单
 
一比一原版(UofM毕业证)明尼苏达大学毕业证成绩单
一比一原版(UofM毕业证)明尼苏达大学毕业证成绩单一比一原版(UofM毕业证)明尼苏达大学毕业证成绩单
一比一原版(UofM毕业证)明尼苏达大学毕业证成绩单
 
一比一原版(CBU毕业证)不列颠海角大学毕业证成绩单
一比一原版(CBU毕业证)不列颠海角大学毕业证成绩单一比一原版(CBU毕业证)不列颠海角大学毕业证成绩单
一比一原版(CBU毕业证)不列颠海角大学毕业证成绩单
 
tapal brand analysis PPT slide for comptetive data
tapal brand analysis PPT slide for comptetive datatapal brand analysis PPT slide for comptetive data
tapal brand analysis PPT slide for comptetive data
 
Opendatabay - Open Data Marketplace.pptx
Opendatabay - Open Data Marketplace.pptxOpendatabay - Open Data Marketplace.pptx
Opendatabay - Open Data Marketplace.pptx
 

149-Sasso Sectoral cognitive skills R&D and productivity

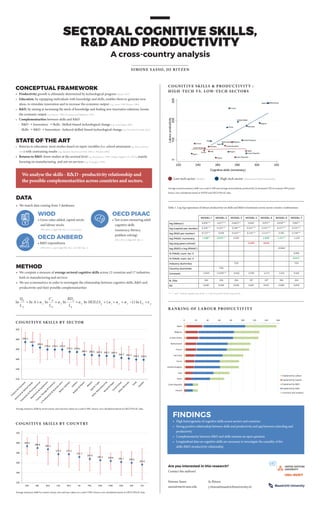
  • 1. SECTORAL COGNITIVE SKILLS, R&D AND PRODUCTIVITY A cross-country analysis SIMONE SASSO, JO RITZEN MODEL 1 MODEL 2 MODEL 3 MODEL 4 MODEL 5 MODEL 6 MODEL 7 log (labour) 0.058*** -0.077*** 0.0655** 0.044* 0.053** 0.058*** 0.062** log (capital per worker) 0.418*** 0.324*** 0.546*** 0.441*** 0.431*** 0.417*** 0.535*** log (R&D per worker) 0.123*** 0.030 0.163*** 0.126*** 0.123*** 0.383 0.158*** log PIAAC numeracy 1.240** 2.879*** 0.203 1.059* 1.237** -1.619 log (avg years school) 0.499 0.076 log (R&D) x log (PIAAC) -0.0462 % PIAAC num. lev. 3 0.004 % PIAAC num. lev. 4 0.015* industry dummies YES YES Country dummies YES Constant -5.054* -13.050*** -0.042 0.599 -4.273 -5.031 9.926 N. Obs. 204 204 204 187 187 204 204 R2 0.690 0.849 0.836 0.687 0.691 0.690 0.839 CONCEPTUAL FRAMEWORK • Productivity growth is ultimately determined by technological progress (Solow, 1957) • Education, by equipping individuals with knowledge and skills, enables them to generate new ideas, to stimulate innovation and to increase the economic output (e.g. Lucas, 1988; Romer, 1986). • R&D, by aiming at increasing the stock of knowledge and finding new innovative solutions, boosts the economic output (e.g. Romer, 1990; Grossman and Helpman, 1991) • Complementarities between skills and R&D · R&D ➝ Innovation ➝ Skills : Skilled-biased technological change (e.g. Accemoglu, 2002) · Skills ➝ R&D ➝ Innovation : Induced skilled-biased technological change (e.g. Piva and Vivarelli, 2015) STATE OF THE ART • Returns to education: most studies based on input-variables (i.e. school attainment e.g. Barro and Lee, 2010) with contrasting results (e.g. Mankiw, Romer and Weil, 1992 vs. Prichett, 2001) • Returns to R&D: fewer studies at the sectoral level (e.g. Bartelsman , 1990; Ortega-Argilés et al., 2015), mainly focusing on manufacturing and not on services (e.g. Verspagen, 1995) We analyse the skills - R&D - productivity relationship and the possible complementarities across countries and sectors. Low-tech sector (Textiles) High-tech sector (Chemicals and pharmaceuticals) METHOD • We compute a measure of average sectoral cognitive skills across 12 countries and 17 industries both in manufacturing and services • We use econometrics in order to investigate the relationship between cognitive skills, R&D and productivity and their possible complementarities Table 1. Log-log regressions of labour productivity on skills and R&D investments across sector-country combinations. ***, ** and * indicate significance at the 1, 5 and 10 percent levels respectively. COGNITIVE SKILLS BY SECTOR Cognitive skills by sector 294.5 287.7 283.4 279.6 279.5 279.4 275.1 274.6 269.1 268.5 267.3 266.7 266.4 262.7 261.5 259.4 259.0 260 280 300 320 220 240 Average numeracy skills by sector (with sectoral min and max values). Source: own calculations based on OECD PIAAC database COGNITIVE SKILLS BY COUNTRY Cognitive skills by country 293.4 289.8 287.2 277.3 277.3 271.7 267.9 265.2 263.6 261.7 259.9 280 300 320 263.6 261.7 259.9 256.4 220 240 260 JPN BEL NLD CZE DEU UK POL FRA KOR USA ESP ITA Average numeracy skills by country (with sectoral min and max values). Source: own calculations based on OECD PIAAC database COGNITIVE SKILLS & PRODUCTIVITY : HIGH-TECH VS. LOW-TECH SECTORS Skills and productivity: hi-tech vs. low tech France NetherlandsJapan Belgium Germany United States Korea 200300 Labourproductivity France United Kingdom BelgiumNetherlands Japan Czech Republic Czech Republic Poland Poland Italy Spain United Kingdom Italy Germany United States Korea Spain 0100 Labourproductivity 220 240 260 280 300 320 Cognitive skills (numeracy) FINDINGS • High heterogeneity of cognitive skills across sectors and countries • Strong positive relationship between skills and productivity and not between schooling and productivity • Complementarity between R&D and skills remains an open question • Longitudinal data on cognitive skills are necessary to investigate the causality of the skills-R&D-productivity relationship Are you interested in this research? Contact the authors! Simone Sasso sasso@merit.unu.edu Jo Ritzen j.ritzen@maastrichtuniversity.nl ln = ln A+ + Q C RD L ij ij L Lij ij ij ij ij ij ln ln ln SKILLS ln +εα2 + α4 + −1)(α1 + α2 + α3 α3 Lij WIOD • Gross value added, capital stocks and labour stocks 1995-2011, 2 digit ISIC Rev. 3.1 (35 sectors) OECD ANBERD • R&D expenditures 1995-2013, 1 and 2 digit ISIC Rev. 3 or ISIC Rev. 4 OECD PIAAC • Test scores measuring adult cognitive skills (numeracy, literacy, problem solving) 2011-2012, 2 digit ISIC Rev. 4 DATA • We match data coming from 3 databases: Average numeracy skills by country (mean, min and max values on a scale 0-500). Source: own calculations based on OECD PIAAC data. Average numeracy skills by sector (mean, min and max values on a scale 0-500). Source: own calculations based on OECD PIAAC data. Average sectoral numeracy skills (on a scale 0-500) and average sectoral labour productivity (in thousand USD at constant 1995 prices). Source: own calculations based on WIOD and OECD PIAAC data. RANKING OF LABOUR PRODUCTIVITYRANKING OF LABOUR PRODUCTIVITY 0 20 40 60 80 100 120 140 160 Japan Belgium United States Netherlands France Germany KoreaKorea United Kindgom Italy Spain Czech Republic Poland Explained by Labour Explained by Capital Explained by R&D Explained by Skills Constant and residual