Download to read offline
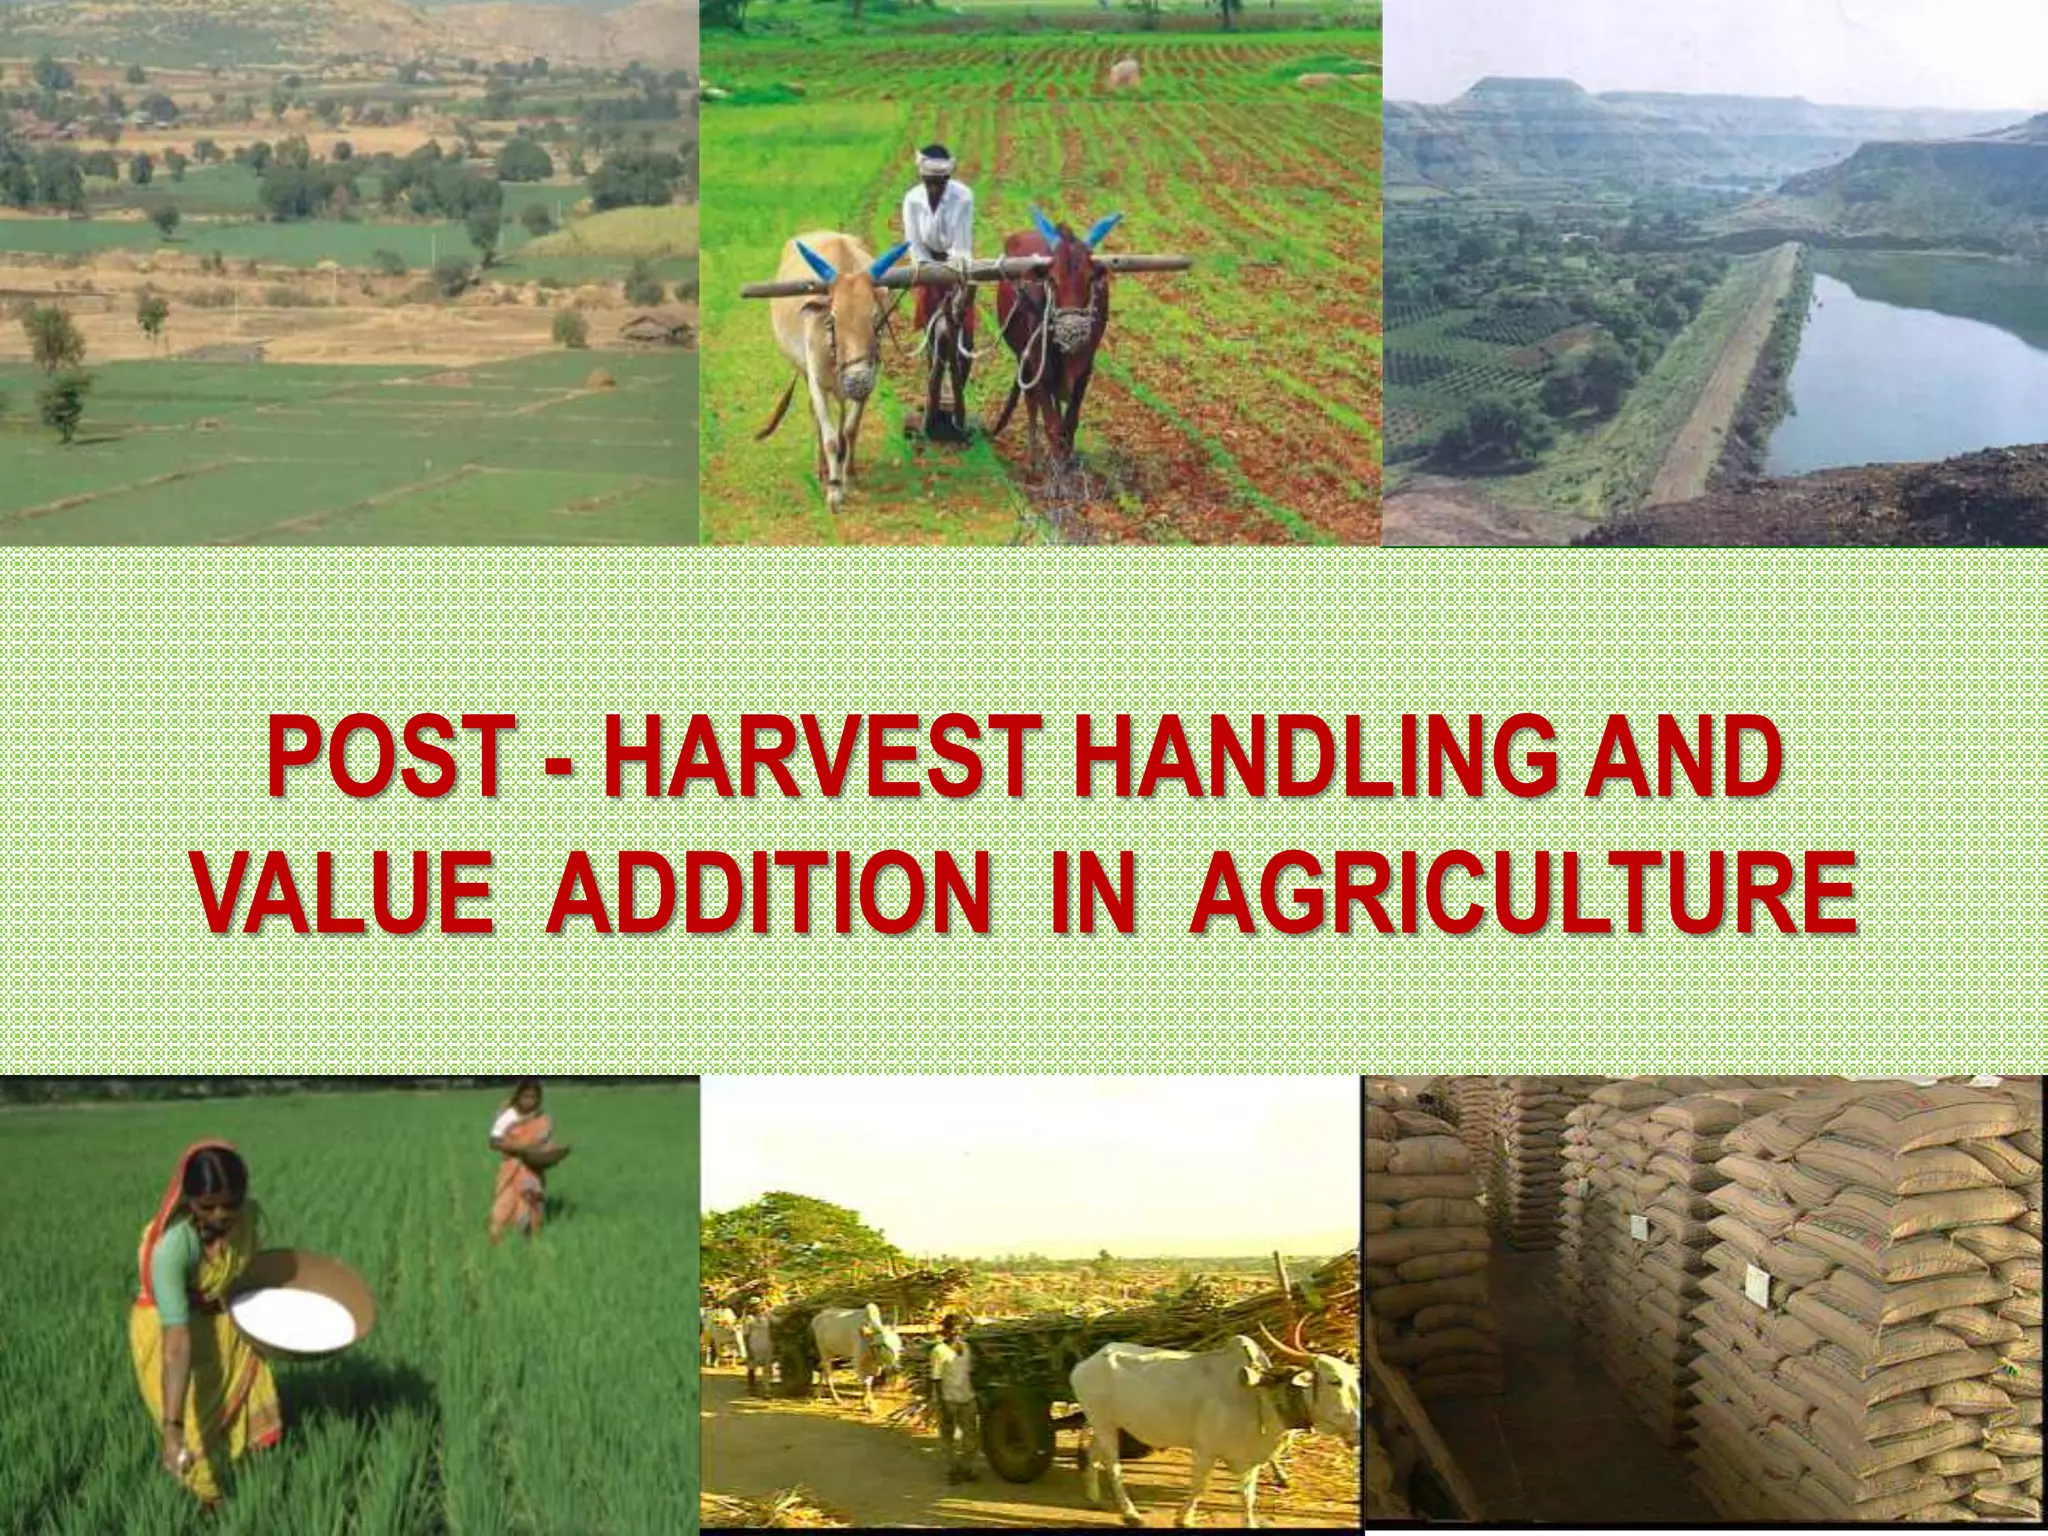
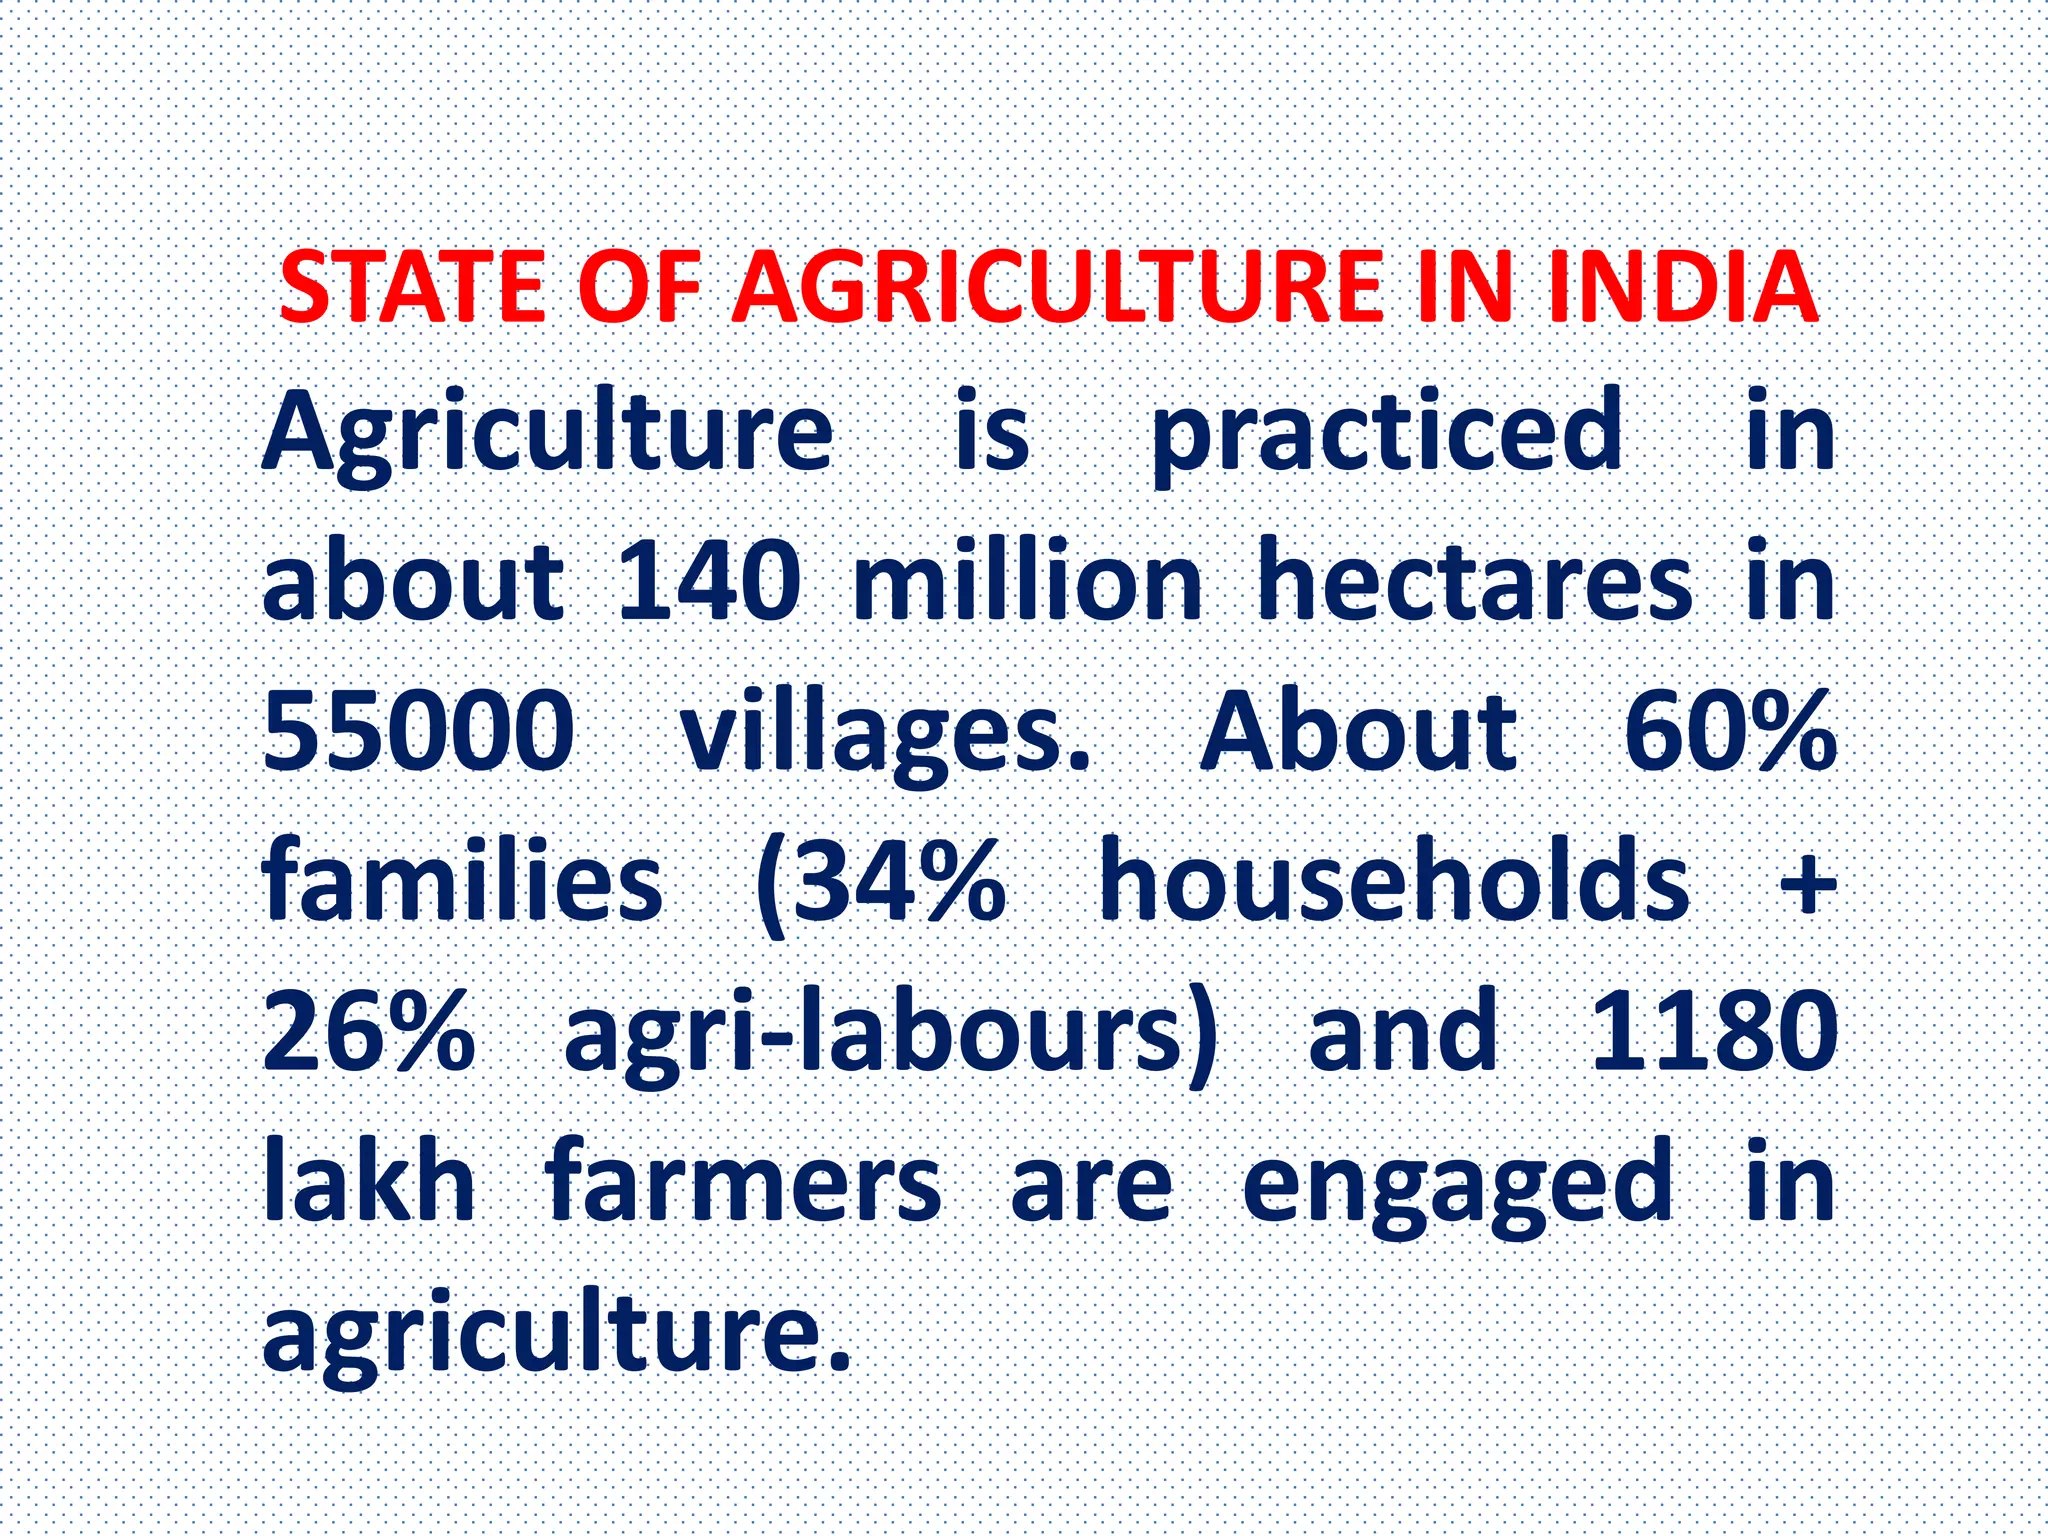

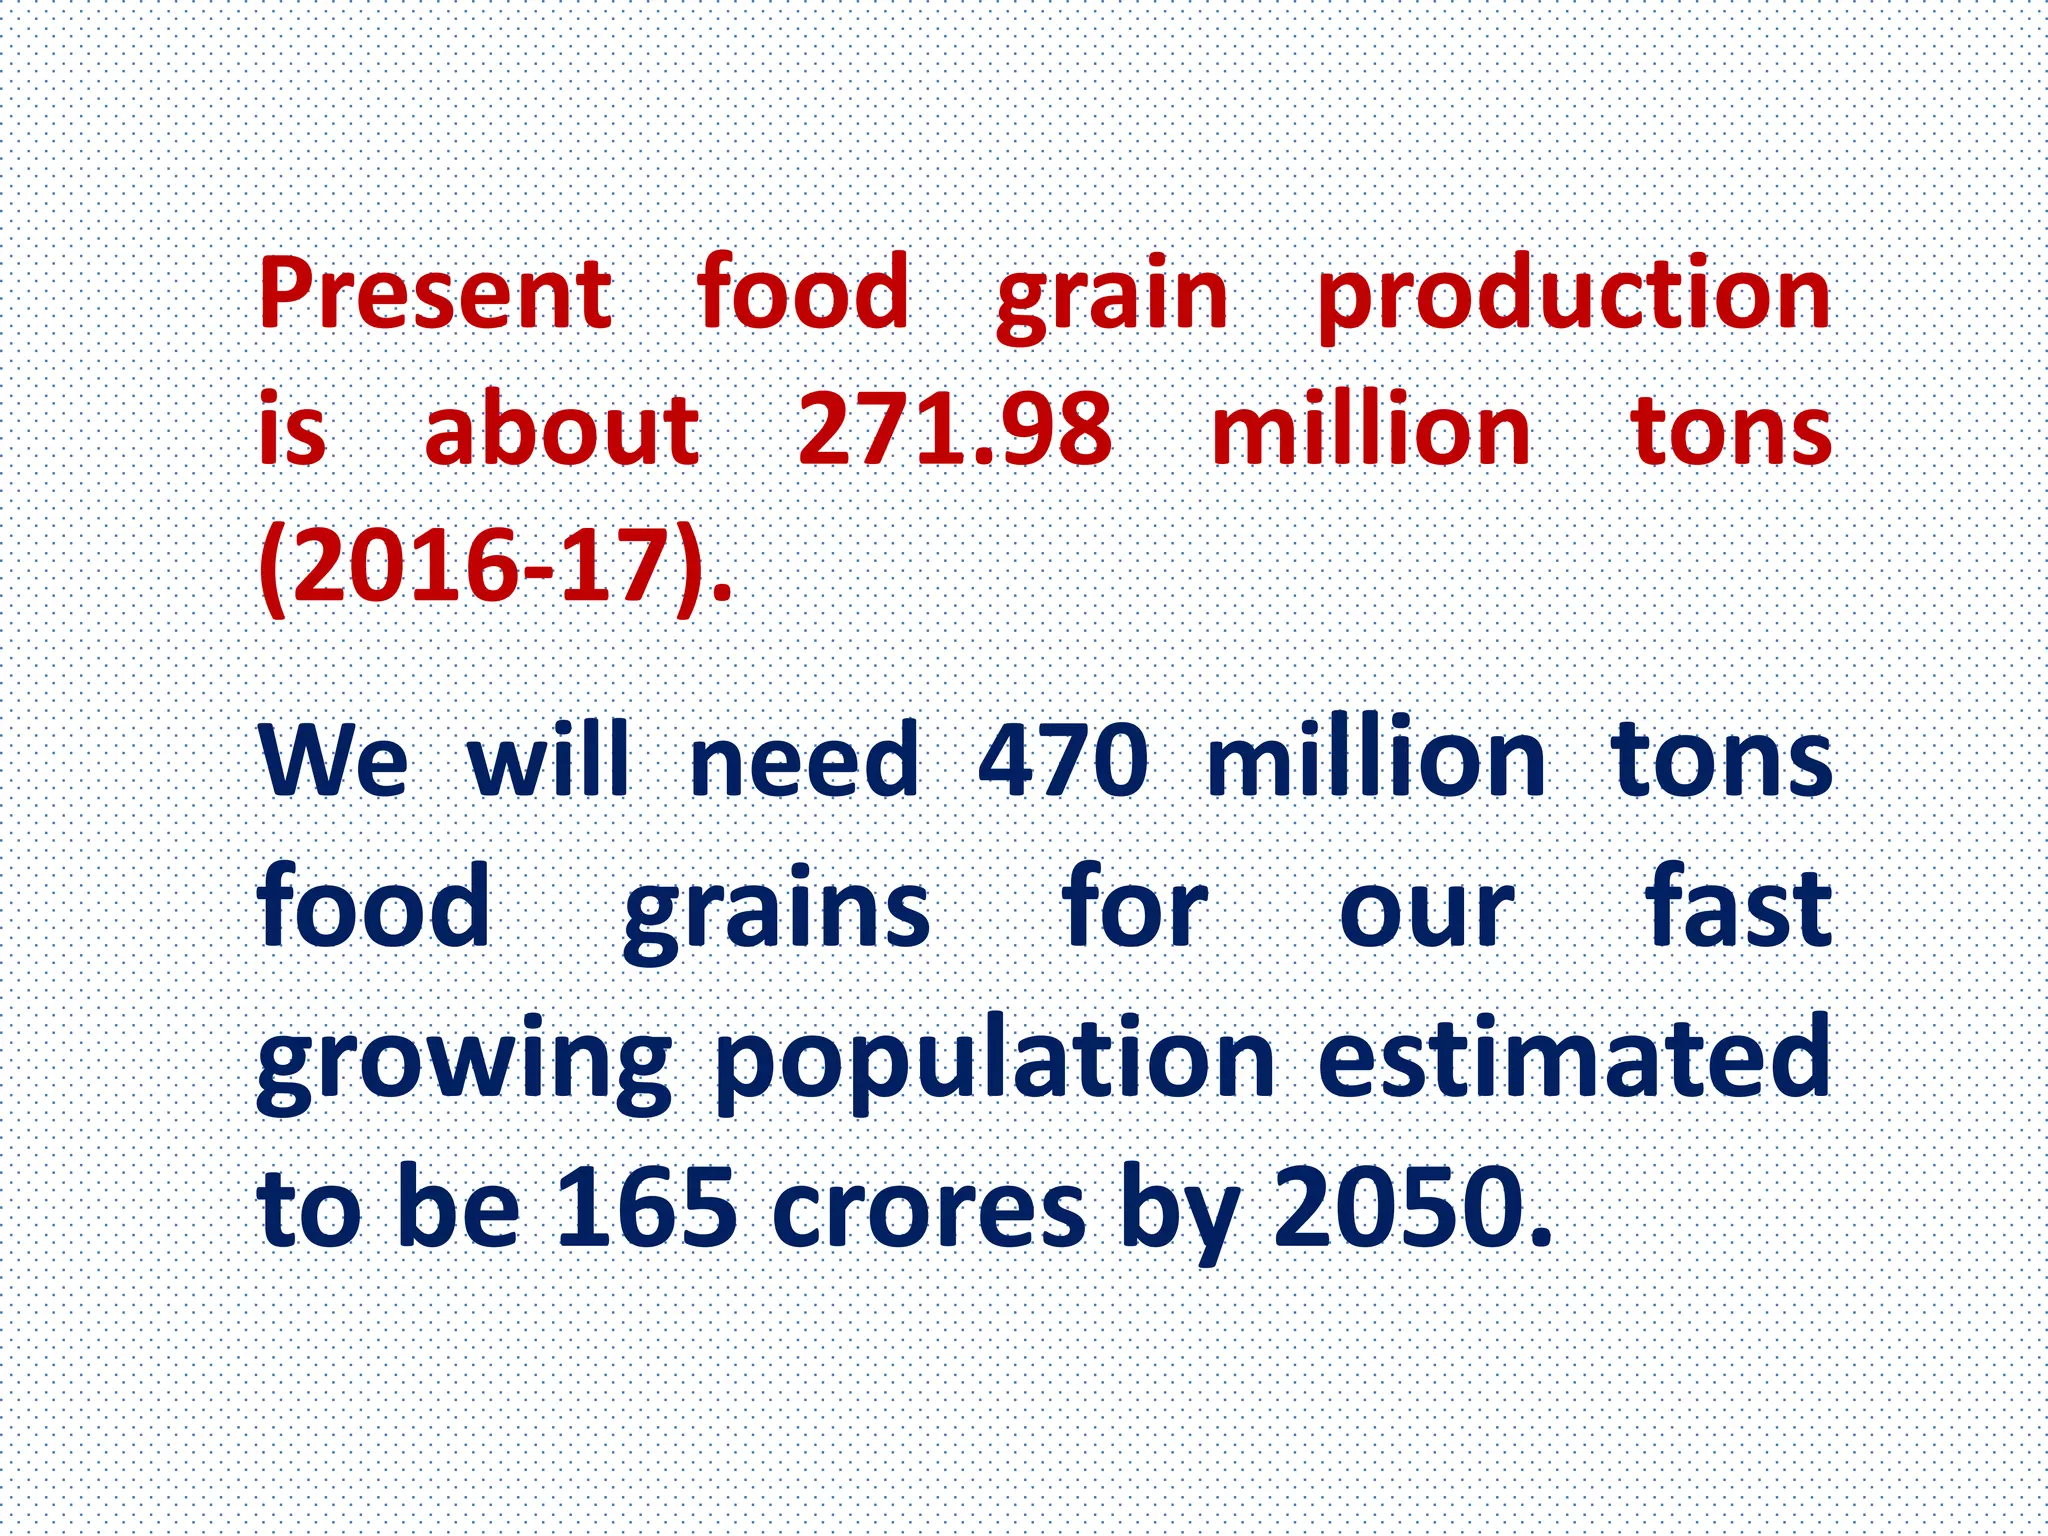


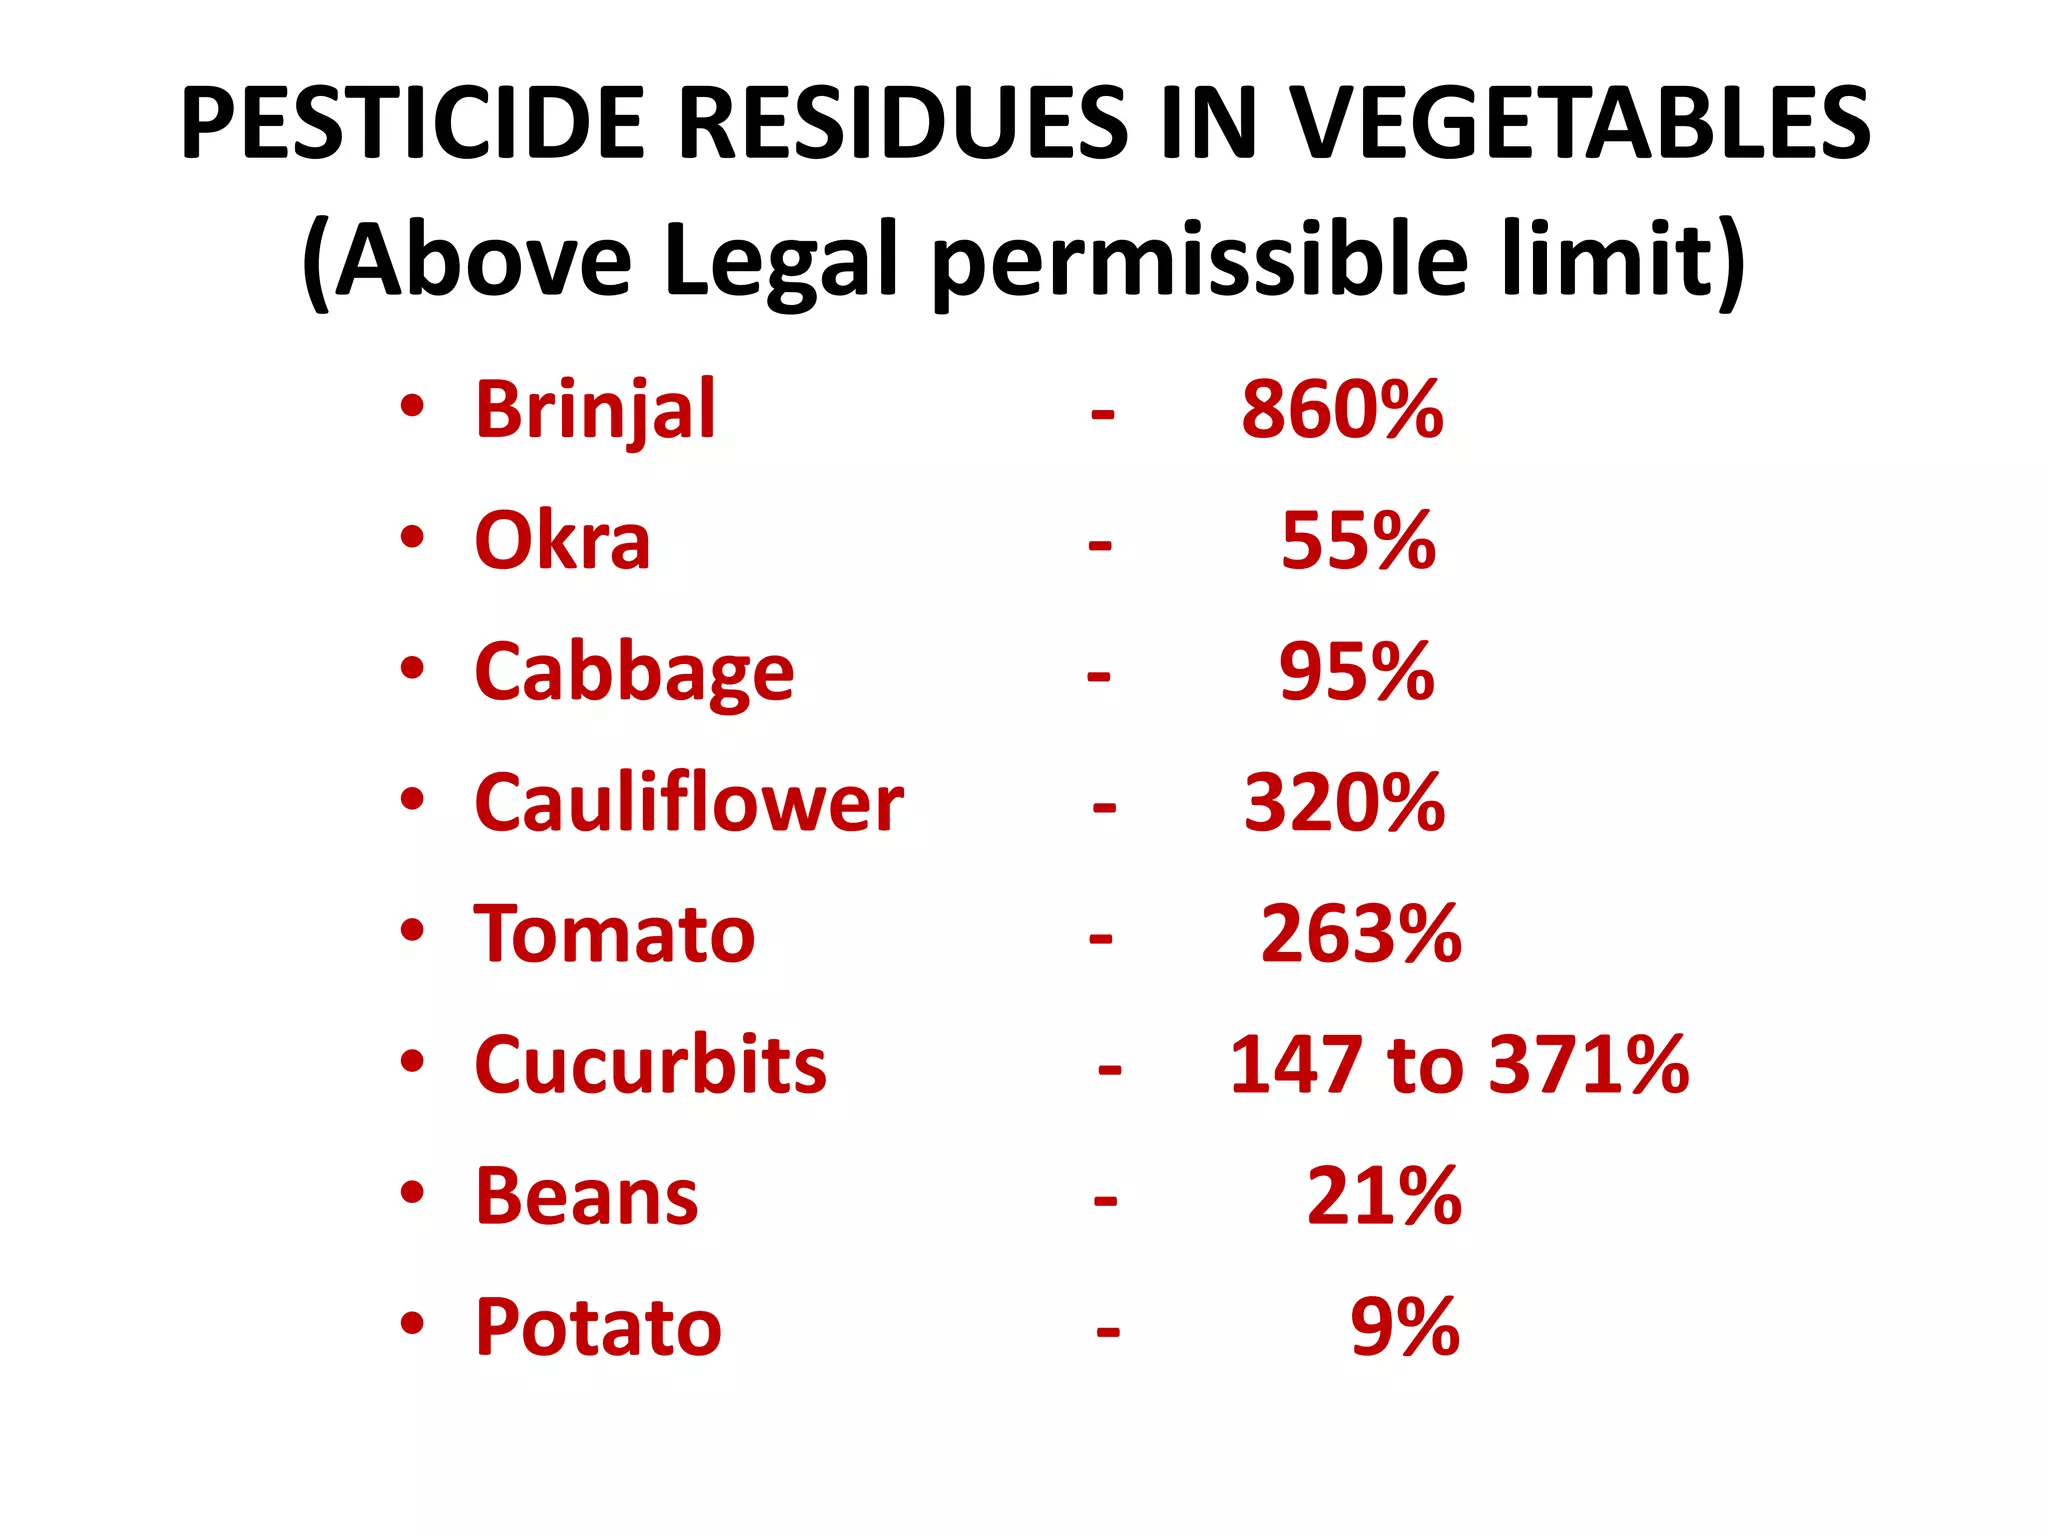


Agriculture is a major source of livelihood in India, engaging over 60% of families, however farmer incomes are low. Current food grain production will need to double by 2050 to meet population demands. However, India wastes a significant amount of its food - over 30% of produce is lost, amounting to economic losses of nearly $100 billion annually. High levels of pesticide residues above legal limits are found in many crops due to overuse and misuse of chemicals in farming. Transitioning to organic farming practices and reducing post-harvest losses through improved storage and processing infrastructure are seen as ways to boost incomes and ensure future food security.


