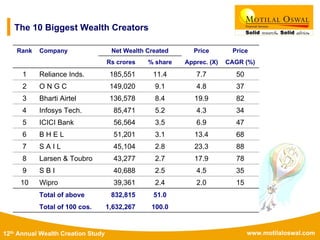
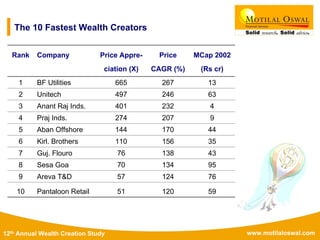
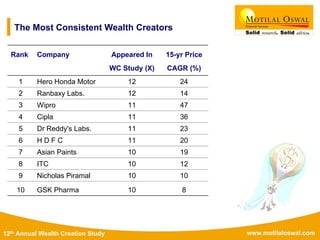
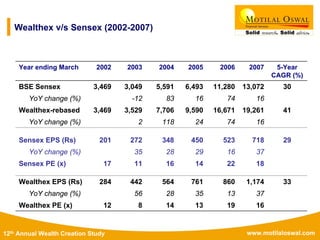
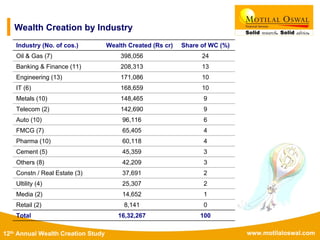
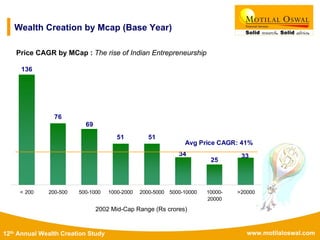
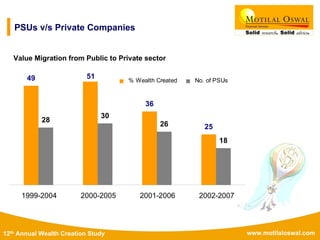
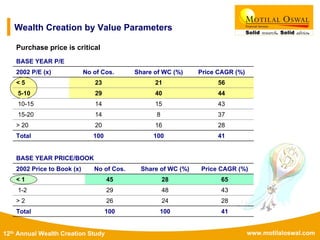
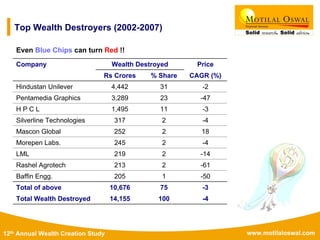
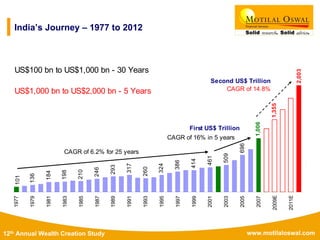
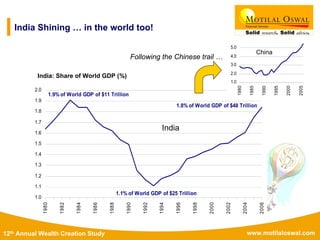
www.motilaloswal.com12th Annual Wealth Creation Study
12th Annual
Wealth Creation Study
2002-2007
By Raamdeo Agrawal
December 14, 2007
www.motilaloswal.com12th Annual Wealth Creation Study
Concept
Wealth Creation:
The process by which a company enhances market
value of the capital entrusted to it by its shareholders
www.motilaloswal.com12th Annual Wealth Creation Study
Wealth Creation Study Methodology
Wealth Creators:
Companies which created at least Rs100 crores
of wealth between 2002 and 2007
(adjusted for corporate events such as mergers,
de-mergers, equity issues, etc)
www.motilaloswal.com12th Annual Wealth Creation Study
The 10 Biggest Wealth Creators
Rank Company Net Wealth Created Price Price
Rs crores % share Apprec. (X)
7.7
4.8
19.9
4.3
6.9
13.4
23.3
17.9
4.5
2.0
CAGR (%)
1 Reliance Inds. 185,551 11.4 50
2 O N G C 149,020 9.1 37
3 Bharti Airtel 136,578 8.4 82
4 Infosys Tech. 85,471 5.2 34
5 ICICI Bank 56,564 3.5 47
6 B H E L 51,201 3.1 68
7 S A I L 45,104 2.8 88
8 Larsen & Toubro 43,277 2.7 78
9 S B I 40,688 2.5 35
10 Wipro 39,361 2.4 15
Total of above 832,815 51.0
Total of 100 cos. 1,632,267 100.0
www.motilaloswal.com12th Annual Wealth Creation Study
The 10 Fastest Wealth Creators
Rank Company Price Appre- Price MCap 2002
ciation (X) CAGR (%) (Rs cr)
1 BF Utilities 665 267 13
2 Unitech 497 246 63
3 Anant Raj Inds. 401 232 4
4 Praj Inds. 274 207 9
5 Aban Offshore 144 170 44
6 Kirl. Brothers 110 156 35
7 Guj. Flouro 76 138 43
8 Sesa Goa 70 134 95
9 Areva T&D 57 124 76
10 Pantaloon Retail 51 120 59
www.motilaloswal.com12th Annual Wealth Creation Study
The Most Consistent Wealth Creators
Rank Company Appeared In 15-yr Price
WC Study (X) CAGR (%)
24
14
47
36
23
20
19
12
10
8
1 Hero Honda Motor 12
2 Ranbaxy Labs. 12
3 Wipro 11
4 Cipla 11
5 Dr Reddy's Labs. 11
6 H D F C 11
7 Asian Paints 10
8 ITC 10
9 Nicholas Piramal 10
10 GSK Pharma 10
www.motilaloswal.com12th Annual Wealth Creation Study
Wealthex v/s Sensex (2002-2007)
Year ending March 2002 2003 2004 2005 2006 2007 5-Year
CAGR (%)
BSE Sensex 3,469 3,049 5,591 6,493 11,280 13,072 30
YoY change (%) -12 83 16 74 16
Wealthex-rebased 3,469 3,529 7,706 9,590 16,671 19,261 41
YoY change (%) 2 118 24 74 16
Sensex EPS (Rs) 201 272 348 450 523 718 29
YoY change (%) 35 28 29 16 37
Sensex PE (x) 17 11 16 14 22 18
Wealthex EPS (Rs) 284 442 564 761 860 1,174 33
YoY change (%) 56 28 35 13 37
Wealthex PE (x) 12 8 14 13 19 16
www.motilaloswal.com12th Annual Wealth Creation Study
Wealth Creation by Industry
Industry (No. of cos.) Wealth Created (Rs cr) Share of WC (%)
Oil & Gas (7) 398,056 24
Banking & Finance (11) 208,313 13
Engineering (13) 171,086 10
IT (6) 168,659 10
Metals (10) 148,465 9
Telecom (2) 142,690 9
Auto (10) 96,116 6
FMCG (7) 65,405 4
Pharma (10) 60,118 4
Cement (5) 45,359 3
Others (8) 42,209 3
Constn / Real Estate (3) 37,691 2
Ultility (4) 25,307 2
Media (2) 14,652 1
Retail (2) 8,141 0
Total 16,32,267 100
www.motilaloswal.com12th Annual Wealth Creation Study
Wealth Creation by Mcap (Base Year)
Price CAGR by MCap : The rise of Indian Entrepreneurship
2002 Mid-Cap Range (Rs crores)
136
76
51 51
33
25
69
34
< 200 200-500 500-1000 1000-2000 2000-5000 5000-10000 10000-
20000
>20000
Avg Price CAGR: 41%
www.motilaloswal.com12th Annual Wealth Creation Study
Wealth Creation by Earnings Growth
Earnings Growth Range (%)
28 28
46
52
70
32
68
0-10 10-20 20-30 30-40 40-50 50-70 >70
Avg Price CAGR: 41%
Price CAGR by Earnings Growth Range : Higher the better
www.motilaloswal.com12th Annual Wealth Creation Study
Wealth Creation based on ROE
?
Price CAGR by ROE in 2002 :
Bargains are found when the markets are blind to change
72 69
45
30
39
27
25
17
<5 5-10 10-15 15-20 20-25 25-30 30-40 >40
Avg Price CAGR:41%
Return-risk balance
Bargains
2002 ROE Range (%)
www.motilaloswal.com12th Annual Wealth Creation Study
Wealth Creation by Age Group
Price CAGR by Age Range : Young companies have speed
Age range in years
100
49
106
39
45
35
313134
0-10 11-20 21-30 31-40 41-50 51-60 61-70 71-80 81-90 >90
Avg Price CAGR : 41%
www.motilaloswal.com12th Annual Wealth Creation Study
PSUs v/s Private Companies
Value Migration from Public to Private sector
49
25
28
30
26
18
36
51
1999-2004 2000-2005 2001-2006 2002-2007
% Wealth Created No. of PSUs
www.motilaloswal.com12th Annual Wealth Creation Study
“There is absolutely no substitute for paying right price.
In the Bible, it says that love covers a multitude of sins.
Well, in the investing field, price covers a multitude of mistakes.
For human beings, there is no substitute for love. For investing
there is no substitute for paying right price – absolutely none.”
— Van Dan Berg, OID, April 2004
Wealth Creation by Value Parameters
www.motilaloswal.com12th Annual Wealth Creation Study
Wealth Creation by Value Parameters
Purchase price is critical
BASE YEAR P/E
2002 P/E (x) No of Cos. Share of WC (%) Price CAGR (%)
< 5 23 21 56
5-10 29 40 44
10-15 14 15 43
15-20 14 8 37
> 20 20 16 28
Total 100 100 41
BASE YEAR PRICE/BOOK
2002 Price to Book (x) No of Cos. Share of WC (%) Price CAGR (%)
< 1 45 28 65
1-2 29 48 43
> 2 26 24 28
Total 100 100 41
www.motilaloswal.com12th Annual Wealth Creation Study
Top Wealth Destroyers (2002-2007)
Even Blue Chips can turn Red !!
Company Wealth Destroyed Price
Rs Crores % Share CAGR (%)
Hindustan Unilever 4,442 31 -2
Pentamedia Graphics 3,289 23 -47
H P C L 1,495 11 -3
Silverline Technologies 317 2 -4
Mascon Global 252 2 18
Morepen Labs. 245 2 -4
LML 219 2 -14
Rashel Agrotech 213 2 -61
Baffin Engg. 205 1 -50
Total of above 10,676 75 -3
Total Wealth Destroyed 14,155 100 -4
www.motilaloswal.com12th Annual Wealth Creation Study
Theme 2008
India :
The Next Trillion $$$ Opportunity !!
www.motilaloswal.com12th Annual Wealth Creation Study
101
136
184
198
210
246
293
317
260
324
386
414
461
509
696
1,006
2,003
1,355
1977
1979
1981
1983
1985
1987
1989
1991
1993
1995
1997
1999
2001
2003
2005
2007
2009E
2011E
First US$ Trillion
Second US$ Trillion
CAGR of 14.8%
CAGR of 6.2% for 25 years
CAGR of 16% in 5 years
US$100 bn to US$1,000 bn - 30 Years
US$1,000 bn to US$2,000 bn - 5 Years
India’s Journey – 1977 to 2012
www.motilaloswal.com12th Annual Wealth Creation Study
India Shining … in the world too!
1.0
1.1
1.2
1.3
1.4
1.5
1.6
1.7
1.8
1.9
2.0
1980
1982
1984
1986
1988
1990
1992
1994
1996
1998
2000
2002
2004
2006
1.9% of World GDP of $11 Trillion
1.1% of World GDP of $25 Trillion
1.8% of World GDP of $48 Trillion
1.0
2.0
3.0
4.0
5.0
1980
1985
1990
1995
2000
2005
Following the Chinese trail …
India
China
India: Share of World GDP (%)
www.motilaloswal.com12th Annual Wealth Creation Study
Exponentiality in the NTD Era
• Macro-economic exponentiality
• Exponentiality in key industries
• Corporate profit exponentiality
• Valuation exponentiality
www.motilaloswal.com12th Annual Wealth Creation Study
Macro economic exponentiality
— Consumption
— Government
— Investment
— External Sector
www.motilaloswal.com12th Annual Wealth Creation Study
73.9 75.1 71.0 67.3 66.2 65.2
56.4 56.4
18.8 19.0 22.6
20.4 18.3 19.5
18.7 22.6
6.7 8.4 8.2
12.3 16.6 16.2
27.7 23.8
-2.8-2.8-0.9-1.2-1.8-2.5
0.5
1977 1982 1987 1992 1997 2002 2007 2012
Consumption (%) Govt (%) Pvt Invt (%) Net exports (%)
GDP
( US$ b )
101 190 246 268 386 480 1,006 2,003
The Big Picture
India’s GDP breakdown (exp. approach) – C + G + I + X
www.motilaloswal.com12th Annual Wealth Creation Study
Consumption exponentiality
www.motilaloswal.com12th Annual Wealth Creation Study
Accelerating Per Capita GDP, but …
451
357
897
1,657
1990
1991
1992
1993
1994
1995
1996
1997
1998
1999
2000
2001
2002
2003
2004
2005
2006
2007
2008
2009
2010
2011
2012
Per Capita GDP expected to grow to US$1,657
in 2012 from US$897 in 2007
Acceleration in Per Capita
GDP from 2000
CAGR of 2.4%
CAGR of 10.3%
CAGR of 12.8%
www.motilaloswal.com12th Annual Wealth Creation Study
14.6 15.4 17.1 18.7
20.6
23.3
45.1
39.8
35.0
30.8
27.0
64.1
62.8
61.8
59.7
57.9
56.9 56.8 56.8 56.7 56.6 56.4
2002 2003 2004 2005 2006 2007 2008 2009 2010 2011 2012
Private final conspn. exp. (Rs lakh cr)
PFCE (% to GDP)
… Consumption Lagging GDP Growth
PRIVATE FINAL CONSUMPTION EXPENDITURE TO GDP (%)
www.motilaloswal.com12th Annual Wealth Creation Study
… Consumption Lagging GDP Growth
Consumption & Saving pattern determined by income distribution
60
30
10
Population (mln)
30
36
34
Share of Income
33
37
30
Share of Cons. Exp.
Top 10% income
Next 30% income
Bottom 60%
www.motilaloswal.com12th Annual Wealth Creation Study
Consumption Exponentiality – Comforts & Luxuries
% TO GDP
CAGR (%)
2000-06 2006-15
Nominal GDP 10.6 14.2
Consumption Exp. 8.7 13.8
Luxuries 15.9 16.6
Comforts 13.8 15.6
Necessities 4.6 11.3
High-growth categories
Beverages 25.3 19.5
Communication 18.4 19.5
Educ. & Recreation 12.3 18.6
Personal transport 17.5 18.1
Hotels & restaurants 13.0 17.2
Healthcare 16.3 17.2
42.1
36.3
30.2
23.9
11.9
13.6
14.1
15.7
10.3
12.8
13.6
16.4
2000 2003 2006 2015
64.2
62.8
57.9
56.0
Necessities
Comforts
Luxuries
www.motilaloswal.com12th Annual Wealth Creation Study
Government finance exponentiality
www.motilaloswal.com12th Annual Wealth Creation Study
Tax Buoyancy Boosts Government Finance
India’s Tax Collection to GDP is rising
10,56,100
7,34,200
4,66,500
1,87,1001,71,700
3,04,900
13.4
8.2
11.6
10.3
8.8
2000
2001
2002
2003
2004
2005
2006
2007
2008
2009
2010
2011
2012
Direct Tax Indirect Tax Tax % to GDP
www.motilaloswal.com12th Annual Wealth Creation Study
Revenue Deficit As % Of GDP : down to zero in 2008-09
4.4
3.6
2.5
7.0
5.8
2.7
1.2
2002
2003
2004
2005
2006
2007
2008
2009
2010
2011
2012
Centre
Combined Centre & State
Exponential Impact of Tax Buoyancy
www.motilaloswal.com12th Annual Wealth Creation Study
Combined Fisc capped at 6% of GDP : thrust on capex
6.2
4.5
3.7 3.0 3.0
9.9
8.5
6.7
6.0 6.0
2002
2003
2004
2005
2006
2007
2008
2009
2010
2011
2012
Centre
Combined Centre & State
Exponential Impact of Improved Govt Finance
www.motilaloswal.com12th Annual Wealth Creation Study
Investment exponentiality
www.motilaloswal.com12th Annual Wealth Creation Study
Exponential thrust on infrastructure
Infrastructure Spend rising to 9.2% of GDP by end of XI Plan
7,38,049
4,43,606
2,50,490
1,75,089
1,14,053
5.6
9.2
7.2
6.0
5.0
2002 2003 2004 2005 2006 2007 2008 2009 2010 2011 2012
Infra. spend (Rs cr)
% to GDP
CAGR of 17%
CAGR of 24%
www.motilaloswal.com12th Annual Wealth Creation Study
Exponential growth in private sector investment
Housing and corporate capex drive capital formation
12,69,500
11,42,700
9,40,000
7,65,900
6,00,500
4,71,200
3,64,800
26.727.4
26.4
24.5
21.7
19.2
16.0
2002 2003 2004 2005 2006 2007 2008
Private Capex (Rs cr)
Private Capex (% to GDP)
www.motilaloswal.com12th Annual Wealth Creation Study
External Sector exponentiality
www.motilaloswal.com12th Annual Wealth Creation Study
India’s Foreign Trade
17 18 18 19 22 26 32 33 35 33 37 44 44
53
64
84
103
126
-21 -24 -20 -22 -23 -29 -37 -39 -42 -42 -50 -50 -52
-62
-78
-111
-149
-190
1990
1991
1992
1993
1994
1995
1996
1997
1998
1999
2000
2001
2002
2003
2004
2005
2006
2007
Exports - $ B
Imports - $ B
2002-07 CAGR : 23%
2002-07 CAGR : 30%
www.motilaloswal.com12th Annual Wealth Creation Study
-1.0
-1.3
-0.4
2.5
1.4
0.8
-0.6
-1.1-1.1
-1.5-1.3
-1.8
-1.2
-0.5
-1.6
-0.5
-3.4
4.5
3.2
4.4
3.0
2.3
1.92.1
2.5
2.1
2.5
3.1
0.7
2.5
3.6
2.4
2.0
3.0
200720052003200119991997199519931991
Current Account Balance (% of GDP)
Foreign Capital Inflow (% of GDP)
Forex capital flows higher than CAD
www.motilaloswal.com12th Annual Wealth Creation Study
199
152
141
110
75
54
4238
32
2622
1721
15
662
2007
2006
2005
2004
2003
2002
2001
2000
1999
1998
1997
1996
1995
1994
1993
1992
1991
Exponential Rise in Forex Reserves
Figures in US$ billion
www.motilaloswal.com12th Annual Wealth Creation Study
Exponentiality in key industries
www.motilaloswal.com12th Annual Wealth Creation Study
Financial Services
High Level Of Domestic Savings
113
134
179
216
261
313
384
437
498
567
646
32.332.332.4
23.5
29.7
2002
2003
2004
2005
2006
2007
2008
2009
2010
2011
2012
Gross Domestic Savings (US$ B) Gross Domestic Savings / GDP (%)
Cumulative
$900 b
Cumulative
$2,500 b
www.motilaloswal.com12th Annual Wealth Creation Study
Financial Services
India’s Credit / GDP (%) among the lowest in the world
319
224
206
185
168
144
136
133
111
110
86
83
71
57
51
136
51
Japan
USA
Canada
South Africa
UK
Malaysia
China
Germany
New Zealand
Thailand
France
Chile
Brazil
Singapore
Turkey
Philippines
India
www.motilaloswal.com12th Annual Wealth Creation Study
Wireless Telecom
Mobile Penetration (% Of Population) - India Vs China
35.1
30.1
25.8
20.9
11.4
16.0
14.3
8.6
5.0
3.2
1.20.6
2001 2002 2003 2004 2005 2006
CHINA
INDIA
www.motilaloswal.com12th Annual Wealth Creation Study
Cars
Cars ('000 nos.) - India Vs China
571
507 607
704
1,092
2,071
2,276
2,770
3,870
410
639
591 558 612
819
981
1,052
1,269
1998
1999
2000
2001
2002
2003
2004
2005
2006
CHINA
INDIA
www.motilaloswal.com12th Annual Wealth Creation Study
Engineering & Construction
Beneficiary of huge spend in infrastructure
7,38,049
4,43,606
2,50,490
1,75,089
1,14,053
5.6
9.2
7.2
6.0
5.0
2002 2003 2004 2005 2006 2007 2008 2009 2010 2011 2012
Infra. spend (Rs cr)
% to GDP
CAGR of 17%
CAGR of 24%
www.motilaloswal.com12th Annual Wealth Creation Study
Cement
Cement Production (Million Tonnes) - India Vs China
536512
573
597
661
725
862
967
1,069
1,240
77 82 94 94
102 111 117 126 142
155
1998
1999
2000
2001
2002
2003
2004
2005
2006
2007
CHINA
INDIA
www.motilaloswal.com12th Annual Wealth Creation Study
Steel
Crude Steel Production (Million Tonnes) - India Vs China
283
222
353
420
32 32
39 43
2003 2004 2005 2006
CHINA
INDIA
www.motilaloswal.com12th Annual Wealth Creation Study
Market Outlook
www.motilaloswal.com12th Annual Wealth Creation Study
High Corporate Tax Buoyancy
Past Corporate Tax Buoyancy – multiple of nominal GDP growth
Financial Year Corporate Tax Buoyancy
1995-96 2.19
1996-97 2.21
1997-98 2.18
1998-99 2.22
1999-00 2.25
2000-01 2.26
2001-02 2.29
2002-03 2.29
2003-04 2.33
2004-05 2.29
2005-06 2.31
www.motilaloswal.com12th Annual Wealth Creation Study
Healthy Corporate Sector Profit Growth
Corporate Profits To GDP (%) : At all time highs
1.3
1.6
2.2
3.5
2.4
1.8
2.1
5.0
3.1
5.8
6.7
7.8
1990
1992
1994
1996
1998
2000
2002
2004
2006
2008
2010
2012
www.motilaloswal.com12th Annual Wealth Creation Study
Interest Rate scenario benign-to-favourable
10-year GSec yield : seems to have plateau-ed
11.7
5.1
7.9
14
4.0
6.5
9.0
11.5
14.0
Nov-92
Nov-93
Nov-94
Nov-95
Nov-96
Nov-97
Nov-98
Nov-99
Nov-00
Nov-01
Nov-02
Nov-03
Nov-04
Nov-05
Nov-06
Nov-07
www.motilaloswal.com12th Annual Wealth Creation Study
Earnings yield to bond yield < 15-year average
0.6
1.8
0.2
0.0
0.3
0.6
0.9
1.2
1.5
1.8
Nov-92
Nov-93
Nov-94
Nov-95
Nov-96
Nov-97
Nov-98
Nov-99
Nov-00
Nov-01
Nov-02
Nov-03
Nov-04
Nov-05
Nov-06
Nov-07
15 Year Average: 0.74x
www.motilaloswal.com12th Annual Wealth Creation Study
Market Cap to GDP (%) - All Time High
19
54
24
43 43 44
29
51
26 26
23
43
54
85 86
136
34
37
1991
1992
1993
1994
1995
1996
1997
1998
1999
2000
2001
2002
2003
2004
2005
2006
2007
Nov-07
www.motilaloswal.com12th Annual Wealth Creation Study
Sensex EPS & PE
Future EPS growth of 20% - slower than 30% of last five years
201
1,772
1,477
1,231
1,026
523
348
272
450
718
876
2002 2003 2004 2005 2006 2007 2008E 2009E 2010E 2011E 2012E
CAGR of 29%
CAGR of 20%
0
5
10
15
20
25
30
35
40
45
Nov-07Nov-04Nov-01Nov-98Nov-95Nov-92
15 Year Median: 15.7x
P/E higher than 15-year median
www.motilaloswal.com12th Annual Wealth Creation Study
• Bargains are made when markets are blind to large
opportunities, positive changes or sustained growth
• Losses are guaranteed when one grossly overpays
• India's next trillion dollar journey will see distinctly buoyant
corporate profits; boom in savings & investment
• At current market valuations, margin of safety is low
• High liquidity could lift the market to rich valuation levels
for quite some time
In Conclusion
www.motilaloswal.com12th Annual Wealth Creation Study
Thank You
&
Happy Wealth Creating
in the NTD era !!

Wealth Creation Study 2002-2007

  • 1.
    www.motilaloswal.com12th Annual WealthCreation Study 12th Annual Wealth Creation Study 2002-2007 By Raamdeo Agrawal December 14, 2007
  • 2.
    www.motilaloswal.com12th Annual WealthCreation Study Concept Wealth Creation: The process by which a company enhances market value of the capital entrusted to it by its shareholders
  • 3.
    www.motilaloswal.com12th Annual WealthCreation Study Wealth Creation Study Methodology Wealth Creators: Companies which created at least Rs100 crores of wealth between 2002 and 2007 (adjusted for corporate events such as mergers, de-mergers, equity issues, etc)
  • 4.
    www.motilaloswal.com12th Annual WealthCreation Study The 10 Biggest Wealth Creators Rank Company Net Wealth Created Price Price Rs crores % share Apprec. (X) 7.7 4.8 19.9 4.3 6.9 13.4 23.3 17.9 4.5 2.0 CAGR (%) 1 Reliance Inds. 185,551 11.4 50 2 O N G C 149,020 9.1 37 3 Bharti Airtel 136,578 8.4 82 4 Infosys Tech. 85,471 5.2 34 5 ICICI Bank 56,564 3.5 47 6 B H E L 51,201 3.1 68 7 S A I L 45,104 2.8 88 8 Larsen & Toubro 43,277 2.7 78 9 S B I 40,688 2.5 35 10 Wipro 39,361 2.4 15 Total of above 832,815 51.0 Total of 100 cos. 1,632,267 100.0
  • 5.
    www.motilaloswal.com12th Annual WealthCreation Study The 10 Fastest Wealth Creators Rank Company Price Appre- Price MCap 2002 ciation (X) CAGR (%) (Rs cr) 1 BF Utilities 665 267 13 2 Unitech 497 246 63 3 Anant Raj Inds. 401 232 4 4 Praj Inds. 274 207 9 5 Aban Offshore 144 170 44 6 Kirl. Brothers 110 156 35 7 Guj. Flouro 76 138 43 8 Sesa Goa 70 134 95 9 Areva T&D 57 124 76 10 Pantaloon Retail 51 120 59
  • 6.
    www.motilaloswal.com12th Annual WealthCreation Study The Most Consistent Wealth Creators Rank Company Appeared In 15-yr Price WC Study (X) CAGR (%) 24 14 47 36 23 20 19 12 10 8 1 Hero Honda Motor 12 2 Ranbaxy Labs. 12 3 Wipro 11 4 Cipla 11 5 Dr Reddy's Labs. 11 6 H D F C 11 7 Asian Paints 10 8 ITC 10 9 Nicholas Piramal 10 10 GSK Pharma 10
  • 7.
    www.motilaloswal.com12th Annual WealthCreation Study Wealthex v/s Sensex (2002-2007) Year ending March 2002 2003 2004 2005 2006 2007 5-Year CAGR (%) BSE Sensex 3,469 3,049 5,591 6,493 11,280 13,072 30 YoY change (%) -12 83 16 74 16 Wealthex-rebased 3,469 3,529 7,706 9,590 16,671 19,261 41 YoY change (%) 2 118 24 74 16 Sensex EPS (Rs) 201 272 348 450 523 718 29 YoY change (%) 35 28 29 16 37 Sensex PE (x) 17 11 16 14 22 18 Wealthex EPS (Rs) 284 442 564 761 860 1,174 33 YoY change (%) 56 28 35 13 37 Wealthex PE (x) 12 8 14 13 19 16
  • 8.
    www.motilaloswal.com12th Annual WealthCreation Study Wealth Creation by Industry Industry (No. of cos.) Wealth Created (Rs cr) Share of WC (%) Oil & Gas (7) 398,056 24 Banking & Finance (11) 208,313 13 Engineering (13) 171,086 10 IT (6) 168,659 10 Metals (10) 148,465 9 Telecom (2) 142,690 9 Auto (10) 96,116 6 FMCG (7) 65,405 4 Pharma (10) 60,118 4 Cement (5) 45,359 3 Others (8) 42,209 3 Constn / Real Estate (3) 37,691 2 Ultility (4) 25,307 2 Media (2) 14,652 1 Retail (2) 8,141 0 Total 16,32,267 100
  • 9.
    www.motilaloswal.com12th Annual WealthCreation Study Wealth Creation by Mcap (Base Year) Price CAGR by MCap : The rise of Indian Entrepreneurship 2002 Mid-Cap Range (Rs crores) 136 76 51 51 33 25 69 34 < 200 200-500 500-1000 1000-2000 2000-5000 5000-10000 10000- 20000 >20000 Avg Price CAGR: 41%
  • 10.
    www.motilaloswal.com12th Annual WealthCreation Study Wealth Creation by Earnings Growth Earnings Growth Range (%) 28 28 46 52 70 32 68 0-10 10-20 20-30 30-40 40-50 50-70 >70 Avg Price CAGR: 41% Price CAGR by Earnings Growth Range : Higher the better
  • 11.
    www.motilaloswal.com12th Annual WealthCreation Study Wealth Creation based on ROE ? Price CAGR by ROE in 2002 : Bargains are found when the markets are blind to change 72 69 45 30 39 27 25 17 <5 5-10 10-15 15-20 20-25 25-30 30-40 >40 Avg Price CAGR:41% Return-risk balance Bargains 2002 ROE Range (%)
  • 12.
    www.motilaloswal.com12th Annual WealthCreation Study Wealth Creation by Age Group Price CAGR by Age Range : Young companies have speed Age range in years 100 49 106 39 45 35 313134 0-10 11-20 21-30 31-40 41-50 51-60 61-70 71-80 81-90 >90 Avg Price CAGR : 41%
  • 13.
    www.motilaloswal.com12th Annual WealthCreation Study PSUs v/s Private Companies Value Migration from Public to Private sector 49 25 28 30 26 18 36 51 1999-2004 2000-2005 2001-2006 2002-2007 % Wealth Created No. of PSUs
  • 14.
    www.motilaloswal.com12th Annual WealthCreation Study “There is absolutely no substitute for paying right price. In the Bible, it says that love covers a multitude of sins. Well, in the investing field, price covers a multitude of mistakes. For human beings, there is no substitute for love. For investing there is no substitute for paying right price – absolutely none.” — Van Dan Berg, OID, April 2004 Wealth Creation by Value Parameters
  • 15.
    www.motilaloswal.com12th Annual WealthCreation Study Wealth Creation by Value Parameters Purchase price is critical BASE YEAR P/E 2002 P/E (x) No of Cos. Share of WC (%) Price CAGR (%) < 5 23 21 56 5-10 29 40 44 10-15 14 15 43 15-20 14 8 37 > 20 20 16 28 Total 100 100 41 BASE YEAR PRICE/BOOK 2002 Price to Book (x) No of Cos. Share of WC (%) Price CAGR (%) < 1 45 28 65 1-2 29 48 43 > 2 26 24 28 Total 100 100 41
  • 16.
    www.motilaloswal.com12th Annual WealthCreation Study Top Wealth Destroyers (2002-2007) Even Blue Chips can turn Red !! Company Wealth Destroyed Price Rs Crores % Share CAGR (%) Hindustan Unilever 4,442 31 -2 Pentamedia Graphics 3,289 23 -47 H P C L 1,495 11 -3 Silverline Technologies 317 2 -4 Mascon Global 252 2 18 Morepen Labs. 245 2 -4 LML 219 2 -14 Rashel Agrotech 213 2 -61 Baffin Engg. 205 1 -50 Total of above 10,676 75 -3 Total Wealth Destroyed 14,155 100 -4
  • 17.
    www.motilaloswal.com12th Annual WealthCreation Study Theme 2008 India : The Next Trillion $$$ Opportunity !!
  • 18.
    www.motilaloswal.com12th Annual WealthCreation Study 101 136 184 198 210 246 293 317 260 324 386 414 461 509 696 1,006 2,003 1,355 1977 1979 1981 1983 1985 1987 1989 1991 1993 1995 1997 1999 2001 2003 2005 2007 2009E 2011E First US$ Trillion Second US$ Trillion CAGR of 14.8% CAGR of 6.2% for 25 years CAGR of 16% in 5 years US$100 bn to US$1,000 bn - 30 Years US$1,000 bn to US$2,000 bn - 5 Years India’s Journey – 1977 to 2012
  • 19.
    www.motilaloswal.com12th Annual WealthCreation Study India Shining … in the world too! 1.0 1.1 1.2 1.3 1.4 1.5 1.6 1.7 1.8 1.9 2.0 1980 1982 1984 1986 1988 1990 1992 1994 1996 1998 2000 2002 2004 2006 1.9% of World GDP of $11 Trillion 1.1% of World GDP of $25 Trillion 1.8% of World GDP of $48 Trillion 1.0 2.0 3.0 4.0 5.0 1980 1985 1990 1995 2000 2005 Following the Chinese trail … India China India: Share of World GDP (%)
  • 20.
    www.motilaloswal.com12th Annual WealthCreation Study Exponentiality in the NTD Era • Macro-economic exponentiality • Exponentiality in key industries • Corporate profit exponentiality • Valuation exponentiality
  • 21.
    www.motilaloswal.com12th Annual WealthCreation Study Macro economic exponentiality — Consumption — Government — Investment — External Sector
  • 22.
    www.motilaloswal.com12th Annual WealthCreation Study 73.9 75.1 71.0 67.3 66.2 65.2 56.4 56.4 18.8 19.0 22.6 20.4 18.3 19.5 18.7 22.6 6.7 8.4 8.2 12.3 16.6 16.2 27.7 23.8 -2.8-2.8-0.9-1.2-1.8-2.5 0.5 1977 1982 1987 1992 1997 2002 2007 2012 Consumption (%) Govt (%) Pvt Invt (%) Net exports (%) GDP ( US$ b ) 101 190 246 268 386 480 1,006 2,003 The Big Picture India’s GDP breakdown (exp. approach) – C + G + I + X
  • 23.
    www.motilaloswal.com12th Annual WealthCreation Study Consumption exponentiality
  • 24.
    www.motilaloswal.com12th Annual WealthCreation Study Accelerating Per Capita GDP, but … 451 357 897 1,657 1990 1991 1992 1993 1994 1995 1996 1997 1998 1999 2000 2001 2002 2003 2004 2005 2006 2007 2008 2009 2010 2011 2012 Per Capita GDP expected to grow to US$1,657 in 2012 from US$897 in 2007 Acceleration in Per Capita GDP from 2000 CAGR of 2.4% CAGR of 10.3% CAGR of 12.8%
  • 25.
    www.motilaloswal.com12th Annual WealthCreation Study 14.6 15.4 17.1 18.7 20.6 23.3 45.1 39.8 35.0 30.8 27.0 64.1 62.8 61.8 59.7 57.9 56.9 56.8 56.8 56.7 56.6 56.4 2002 2003 2004 2005 2006 2007 2008 2009 2010 2011 2012 Private final conspn. exp. (Rs lakh cr) PFCE (% to GDP) … Consumption Lagging GDP Growth PRIVATE FINAL CONSUMPTION EXPENDITURE TO GDP (%)
  • 26.
    www.motilaloswal.com12th Annual WealthCreation Study … Consumption Lagging GDP Growth Consumption & Saving pattern determined by income distribution 60 30 10 Population (mln) 30 36 34 Share of Income 33 37 30 Share of Cons. Exp. Top 10% income Next 30% income Bottom 60%
  • 27.
    www.motilaloswal.com12th Annual WealthCreation Study Consumption Exponentiality – Comforts & Luxuries % TO GDP CAGR (%) 2000-06 2006-15 Nominal GDP 10.6 14.2 Consumption Exp. 8.7 13.8 Luxuries 15.9 16.6 Comforts 13.8 15.6 Necessities 4.6 11.3 High-growth categories Beverages 25.3 19.5 Communication 18.4 19.5 Educ. & Recreation 12.3 18.6 Personal transport 17.5 18.1 Hotels & restaurants 13.0 17.2 Healthcare 16.3 17.2 42.1 36.3 30.2 23.9 11.9 13.6 14.1 15.7 10.3 12.8 13.6 16.4 2000 2003 2006 2015 64.2 62.8 57.9 56.0 Necessities Comforts Luxuries
  • 28.
    www.motilaloswal.com12th Annual WealthCreation Study Government finance exponentiality
  • 29.
    www.motilaloswal.com12th Annual WealthCreation Study Tax Buoyancy Boosts Government Finance India’s Tax Collection to GDP is rising 10,56,100 7,34,200 4,66,500 1,87,1001,71,700 3,04,900 13.4 8.2 11.6 10.3 8.8 2000 2001 2002 2003 2004 2005 2006 2007 2008 2009 2010 2011 2012 Direct Tax Indirect Tax Tax % to GDP
  • 30.
    www.motilaloswal.com12th Annual WealthCreation Study Revenue Deficit As % Of GDP : down to zero in 2008-09 4.4 3.6 2.5 7.0 5.8 2.7 1.2 2002 2003 2004 2005 2006 2007 2008 2009 2010 2011 2012 Centre Combined Centre & State Exponential Impact of Tax Buoyancy
  • 31.
    www.motilaloswal.com12th Annual WealthCreation Study Combined Fisc capped at 6% of GDP : thrust on capex 6.2 4.5 3.7 3.0 3.0 9.9 8.5 6.7 6.0 6.0 2002 2003 2004 2005 2006 2007 2008 2009 2010 2011 2012 Centre Combined Centre & State Exponential Impact of Improved Govt Finance
  • 32.
    www.motilaloswal.com12th Annual WealthCreation Study Investment exponentiality
  • 33.
    www.motilaloswal.com12th Annual WealthCreation Study Exponential thrust on infrastructure Infrastructure Spend rising to 9.2% of GDP by end of XI Plan 7,38,049 4,43,606 2,50,490 1,75,089 1,14,053 5.6 9.2 7.2 6.0 5.0 2002 2003 2004 2005 2006 2007 2008 2009 2010 2011 2012 Infra. spend (Rs cr) % to GDP CAGR of 17% CAGR of 24%
  • 34.
    www.motilaloswal.com12th Annual WealthCreation Study Exponential growth in private sector investment Housing and corporate capex drive capital formation 12,69,500 11,42,700 9,40,000 7,65,900 6,00,500 4,71,200 3,64,800 26.727.4 26.4 24.5 21.7 19.2 16.0 2002 2003 2004 2005 2006 2007 2008 Private Capex (Rs cr) Private Capex (% to GDP)
  • 35.
    www.motilaloswal.com12th Annual WealthCreation Study External Sector exponentiality
  • 36.
    www.motilaloswal.com12th Annual WealthCreation Study India’s Foreign Trade 17 18 18 19 22 26 32 33 35 33 37 44 44 53 64 84 103 126 -21 -24 -20 -22 -23 -29 -37 -39 -42 -42 -50 -50 -52 -62 -78 -111 -149 -190 1990 1991 1992 1993 1994 1995 1996 1997 1998 1999 2000 2001 2002 2003 2004 2005 2006 2007 Exports - $ B Imports - $ B 2002-07 CAGR : 23% 2002-07 CAGR : 30%
  • 37.
    www.motilaloswal.com12th Annual WealthCreation Study -1.0 -1.3 -0.4 2.5 1.4 0.8 -0.6 -1.1-1.1 -1.5-1.3 -1.8 -1.2 -0.5 -1.6 -0.5 -3.4 4.5 3.2 4.4 3.0 2.3 1.92.1 2.5 2.1 2.5 3.1 0.7 2.5 3.6 2.4 2.0 3.0 200720052003200119991997199519931991 Current Account Balance (% of GDP) Foreign Capital Inflow (% of GDP) Forex capital flows higher than CAD
  • 38.
    www.motilaloswal.com12th Annual WealthCreation Study 199 152 141 110 75 54 4238 32 2622 1721 15 662 2007 2006 2005 2004 2003 2002 2001 2000 1999 1998 1997 1996 1995 1994 1993 1992 1991 Exponential Rise in Forex Reserves Figures in US$ billion
  • 39.
    www.motilaloswal.com12th Annual WealthCreation Study Exponentiality in key industries
  • 40.
    www.motilaloswal.com12th Annual WealthCreation Study Financial Services High Level Of Domestic Savings 113 134 179 216 261 313 384 437 498 567 646 32.332.332.4 23.5 29.7 2002 2003 2004 2005 2006 2007 2008 2009 2010 2011 2012 Gross Domestic Savings (US$ B) Gross Domestic Savings / GDP (%) Cumulative $900 b Cumulative $2,500 b
  • 41.
    www.motilaloswal.com12th Annual WealthCreation Study Financial Services India’s Credit / GDP (%) among the lowest in the world 319 224 206 185 168 144 136 133 111 110 86 83 71 57 51 136 51 Japan USA Canada South Africa UK Malaysia China Germany New Zealand Thailand France Chile Brazil Singapore Turkey Philippines India
  • 42.
    www.motilaloswal.com12th Annual WealthCreation Study Wireless Telecom Mobile Penetration (% Of Population) - India Vs China 35.1 30.1 25.8 20.9 11.4 16.0 14.3 8.6 5.0 3.2 1.20.6 2001 2002 2003 2004 2005 2006 CHINA INDIA
  • 43.
    www.motilaloswal.com12th Annual WealthCreation Study Cars Cars ('000 nos.) - India Vs China 571 507 607 704 1,092 2,071 2,276 2,770 3,870 410 639 591 558 612 819 981 1,052 1,269 1998 1999 2000 2001 2002 2003 2004 2005 2006 CHINA INDIA
  • 44.
    www.motilaloswal.com12th Annual WealthCreation Study Engineering & Construction Beneficiary of huge spend in infrastructure 7,38,049 4,43,606 2,50,490 1,75,089 1,14,053 5.6 9.2 7.2 6.0 5.0 2002 2003 2004 2005 2006 2007 2008 2009 2010 2011 2012 Infra. spend (Rs cr) % to GDP CAGR of 17% CAGR of 24%
  • 45.
    www.motilaloswal.com12th Annual WealthCreation Study Cement Cement Production (Million Tonnes) - India Vs China 536512 573 597 661 725 862 967 1,069 1,240 77 82 94 94 102 111 117 126 142 155 1998 1999 2000 2001 2002 2003 2004 2005 2006 2007 CHINA INDIA
  • 46.
    www.motilaloswal.com12th Annual WealthCreation Study Steel Crude Steel Production (Million Tonnes) - India Vs China 283 222 353 420 32 32 39 43 2003 2004 2005 2006 CHINA INDIA
  • 47.
    www.motilaloswal.com12th Annual WealthCreation Study Market Outlook
  • 48.
    www.motilaloswal.com12th Annual WealthCreation Study High Corporate Tax Buoyancy Past Corporate Tax Buoyancy – multiple of nominal GDP growth Financial Year Corporate Tax Buoyancy 1995-96 2.19 1996-97 2.21 1997-98 2.18 1998-99 2.22 1999-00 2.25 2000-01 2.26 2001-02 2.29 2002-03 2.29 2003-04 2.33 2004-05 2.29 2005-06 2.31
  • 49.
    www.motilaloswal.com12th Annual WealthCreation Study Healthy Corporate Sector Profit Growth Corporate Profits To GDP (%) : At all time highs 1.3 1.6 2.2 3.5 2.4 1.8 2.1 5.0 3.1 5.8 6.7 7.8 1990 1992 1994 1996 1998 2000 2002 2004 2006 2008 2010 2012
  • 50.
    www.motilaloswal.com12th Annual WealthCreation Study Interest Rate scenario benign-to-favourable 10-year GSec yield : seems to have plateau-ed 11.7 5.1 7.9 14 4.0 6.5 9.0 11.5 14.0 Nov-92 Nov-93 Nov-94 Nov-95 Nov-96 Nov-97 Nov-98 Nov-99 Nov-00 Nov-01 Nov-02 Nov-03 Nov-04 Nov-05 Nov-06 Nov-07
  • 51.
    www.motilaloswal.com12th Annual WealthCreation Study Earnings yield to bond yield < 15-year average 0.6 1.8 0.2 0.0 0.3 0.6 0.9 1.2 1.5 1.8 Nov-92 Nov-93 Nov-94 Nov-95 Nov-96 Nov-97 Nov-98 Nov-99 Nov-00 Nov-01 Nov-02 Nov-03 Nov-04 Nov-05 Nov-06 Nov-07 15 Year Average: 0.74x
  • 52.
    www.motilaloswal.com12th Annual WealthCreation Study Market Cap to GDP (%) - All Time High 19 54 24 43 43 44 29 51 26 26 23 43 54 85 86 136 34 37 1991 1992 1993 1994 1995 1996 1997 1998 1999 2000 2001 2002 2003 2004 2005 2006 2007 Nov-07
  • 53.
    www.motilaloswal.com12th Annual WealthCreation Study Sensex EPS & PE Future EPS growth of 20% - slower than 30% of last five years 201 1,772 1,477 1,231 1,026 523 348 272 450 718 876 2002 2003 2004 2005 2006 2007 2008E 2009E 2010E 2011E 2012E CAGR of 29% CAGR of 20% 0 5 10 15 20 25 30 35 40 45 Nov-07Nov-04Nov-01Nov-98Nov-95Nov-92 15 Year Median: 15.7x P/E higher than 15-year median
  • 54.
    www.motilaloswal.com12th Annual WealthCreation Study • Bargains are made when markets are blind to large opportunities, positive changes or sustained growth • Losses are guaranteed when one grossly overpays • India's next trillion dollar journey will see distinctly buoyant corporate profits; boom in savings & investment • At current market valuations, margin of safety is low • High liquidity could lift the market to rich valuation levels for quite some time In Conclusion
  • 55.
    www.motilaloswal.com12th Annual WealthCreation Study Thank You & Happy Wealth Creating in the NTD era !!