TABLE
OF CONTENT
• OVERVIEW
•COMPANIES PROFILE
• METHODOLOGY
• NEED FOR THE STUDY
• OBJECTIVE OF THE STUDY
• SCOPE OF THE STUDY
• DATA ANALYSIS &
INTERPRETATION
• FINDINGS
• SUGGESTIONS
• CONCLUSION
3.
OVERVIEW
"The financial marketis a vital platform for trading securities like
stocks and bonds, driving economic growth by mobilizing savings
and providing liquidity. Investments can be in equity shares, bonds,
or mutual funds, balancing risk and return. The National Stock
Exchange (NSE), India’s largest electronic exchange, ensures
efficient trading with innovations like T+1 settlement, while the
Bombay Stock Exchange (BSE), Asia’s oldest, tracks market trends
via the Sensex. Stock indices like Nifty 50 and Sensex reflect market
performance, guiding investors and serving as benchmarks for
derivatives. Together, these elements form the backbone of India’s
dynamic capital markets."
4.
1 2
As India’slargest public sector bank, SBI
dominates the financial services sector with over
22,000 branches and a strong digital presence
through its YONO app. Despite its vast network
and government backing, SBI faces challenges
like high NPAs (2.78% in 2023) and bureaucratic
inefficiencies. Its global footprint and focus on
financial inclusion remain key strengths, but
competition from private banks and cybersecurity
risks pose threats.
STATE BANK OF INDIA
(SBI)
COMPANIES PROFILE
Coal India is the world’s largest coal producer,
accounting for 80% of India’s domestic coal
supply. With revenues exceeding 95,435
₹
crore (2023), the company benefits from
government support and rising energy demand.
However, environmental concerns, reliance on
manual mining, and global shifts toward
renewables threaten its long-term
sustainability. Diversification into solar power
and coal gasification offers growth
opportunities.
COAL INDIA
A global IT leader, Wipro generates $7.3
billion in revenue, specializing in AI, cloud
computing, and digital transformation. While
its innovation-driven portfolio and strategic
acquisitions (like Capco) strengthen its market
position, high employee attrition (~21%) and
margin pressures due to rising R&D costs are
key challenges. The company’s focus on
sustainability and partnerships with tech giants
like Microsoft provides a competitive edge.
WIPRO
3
5.
3 4
BHARTI AIRTEL
COMPANIESPROFILE
ITC
Bharti Airtel, India’s second-largest
telecom operator, serves 500 million+
subscribers worldwide. Its aggressive 5G
rollout and fiber network expansion are
countered by high debt ( 1.43 lakh crore)
₹
and intense competition from Reliance Jio.
The company’s diversified services (Airtel
Payments Bank, Xstream Fiber) and rural
penetration strategies are critical to
maintaining its market share.
ITC’s diversified portfolio spans FMCG,
hospitality, and agri-business, with brands
like Aashirvaad and Sunfeast driving
growth. While its sustainability initiatives
(carbon-positive for 18+ years) enhance its
reputation, reliance on tobacco revenues
(25%) and regulatory pressures remain
hurdles. Expansion into premium FMCG
and luxury hotels aligns with India’s
consumption trends.
Asian Paints commands a 50%+
market share in India’s decorative
paints segment, supported by 70,000+
dealers and brands like Royale.
Volatile crude oil prices (a key raw
material) and competition from global
players like Berger Paints impact
margins. Its focus on eco-friendly
products and rural expansion aims to
sustain growth.
ASIAN PAINTS
5
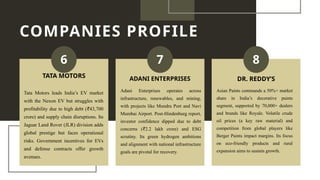
6.
6 7
Tata Motorsleads India’s EV market
with the Nexon EV but struggles with
profitability due to high debt ( 43,700
₹
crore) and supply chain disruptions. Its
Jaguar Land Rover (JLR) division adds
global prestige but faces operational
risks. Government incentives for EVs
and defense contracts offer growth
avenues.
TATA MOTORS
COMPANIES PROFILE
Adani Enterprises operates across
infrastructure, renewables, and mining,
with projects like Mundra Port and Navi
Mumbai Airport. Post-Hindenburg report,
investor confidence dipped due to debt
concerns ( 2.2 lakh crore) and ESG
₹
scrutiny. Its green hydrogen ambitions
and alignment with national infrastructure
goals are pivotal for recovery.
ADANI ENTERPRISES
Asian Paints commands a 50%+ market
share in India’s decorative paints
segment, supported by 70,000+ dealers
and brands like Royale. Volatile crude
oil prices (a key raw material) and
competition from global players like
Berger Paints impact margins. Its focus
on eco-friendly products and rural
expansion aims to sustain growth.
DR. REDDY’S
8
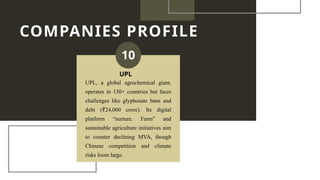
7.
10
UPL, a globalagrochemical giant,
operates in 130+ countries but faces
challenges like glyphosate bans and
debt ( 24,000 crore). Its digital
₹
platform “nurture. Farm” and
sustainable agriculture initiatives aim
to counter declining MVA, though
Chinese competition and climate
risks loom large.
UPL
COMPANIES PROFILE
8.
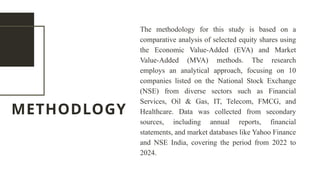
METHODLOGY
The methodology forthis study is based on a
comparative analysis of selected equity shares using
the Economic Value-Added (EVA) and Market
Value-Added (MVA) methods. The research
employs an analytical approach, focusing on 10
companies listed on the National Stock Exchange
(NSE) from diverse sectors such as Financial
Services, Oil & Gas, IT, Telecom, FMCG, and
Healthcare. Data was collected from secondary
sources, including annual reports, financial
statements, and market databases like Yahoo Finance
and NSE India, covering the period from 2022 to
2024.
9.
• This studyis crucial because traditional financial metrics like
ROE and P/E ratios often overlook the cost of capital and market
sentiment, leading to incomplete evaluations of company
performance.
• By comparing Economic Value Added (EVA) and Market Value
Added (MVA), the research fills a gap in understanding how
these advanced metrics align with equity valuation, particularly
in volatile post-pandemic markets.
• The findings will benefit investors, analysts, and corporate
managers by providing insights into capital efficiency, strategic
decision-making, and long-term value creation.
NEED FOR THE STUDY
10.
OBJECTIVE OF THESTUDY
• The primary objectives are to compare EVA and
MVA’s effectiveness in assessing equity
performance, analyze their consistency across
different market conditions, and evaluate their
sector-specific applicability (e.g., IT, banking,
FMCG).
• Additionally, the study examines the impact of post-
pandemic economic disruptions on these metrics
and identifies methodological limitations to enhance
their practical utility for investors and businesses.
11.
SCOPE OF THESTUDY
• The study focuses on NSE-listed companies in India, spanning sectors
like banking (SBI), IT (Wipro), and FMCG (ITC).
• It uses secondary data from annual reports and financial databases
(2022–2025) and applies the EVA method, though it is limited to three
key adjustments.
• While comprehensive, the scope excludes qualitative factors like
corporate governance, providing a focused analysis of financial
performance metrics.
12.
DATA ANALYSIS &INTERPRETATION
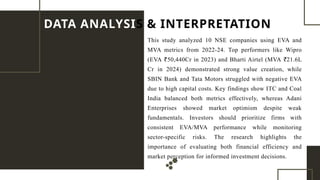
This study analyzed 10 NSE companies using EVA and
MVA metrics from 2022-24. Top performers like Wipro
(EVA 50,440Cr in 2023) and Bharti Airtel (MVA 21.6L
₹ ₹
Cr in 2024) demonstrated strong value creation, while
SBIN Bank and Tata Motors struggled with negative EVA
due to high capital costs. Key findings show ITC and Coal
India balanced both metrics effectively, whereas Adani
Enterprises showed market optimism despite weak
fundamentals. Investors should prioritize firms with
consistent EVA/MVA performance while monitoring
sector-specific risks. The research highlights the
importance of evaluating both financial efficiency and
market perception for informed investment decisions.
13.
FINDINGS The studyanalyzed 10 NSE-listed companies
using Economic Value Added (EVA) and Market
Value Added (MVA). Coal India, ITC, and Dr.
Reddy’s showed strong positive EVA, indicating
efficient capital use, while SBIN, Tata Motors, and
Adani Enterprises had negative EVA due to high
costs and poor profitability. MVA trends revealed
Bharti Airtel and Coal India as top performers,
whereas Asian Paints and UPL declined due to
sectoral challenges.
FRADEL AND SPIES
14.
SUGGESTIONS
1.Reduce Debt: High-WACCfirms (Adani, UPL) should refinance loans.
2.Improve Efficiency: Negative EVA companies (Tata Motors, SBIN)
must optimize operations.
3.Enhance Investor Trust: Firms with diverging EVA-MVA (Wipro)
should improve transparency.
4.Sector-Specific Strategies: Focus on high-growth areas (5G for
Bharti Airtel, EVs for Tata Motors).
15.
Companies with consistentEVA and MVA growth (e.g., ITC, Coal India) demonstrated
strong financial health and investor confidence. In contrast, firms with negative EVA (e.g.,
SBIN, Adani) struggled with high debt and inefficiencies. EVA and MVA alignment is
crucial for sustainable value creation. Balancing profitability (EVA) and market perception
(MVA) is key to long-term success. Investors should favor low-debt, high-EVA sectors
(FMCG, Healthcare) while monitoring volatile industries (Banking, Metals).
CONCLUSION