This document summarizes a research paper that models how a mutual fund manager's choice of portfolio risk is affected by the fund's prior performance and the manager's compensation structure. The model shows that when compensation cannot fall to zero, managers take on more tracking error risk (deviation from the benchmark portfolio) as performance declines. However, increased total return volatility is not necessarily predicted. Empirical tests on over 6,000 funds from 1962-2006 find evidence managers increase tracking error, but not return, volatility during poor performance, especially longer-tenured managers. This adds new insights to research on risk-shifting incentives in mutual fund tournaments.
This study examines how hedge fund manager characteristics impact fund performance. The authors analyze data on over 1,000 hedge fund managers, including SAT scores, education levels, work experience, and age. They find managers from higher-SAT undergraduate institutions tend to have higher raw and risk-adjusted returns, more inflows, and take less risk. Unlike mutual funds, the study also finds hedge fund flows do not negatively impact future performance.
These documents summarize several academic studies on hedge fund performance and investor returns:
1) One study finds that annualized returns for hedge fund investors are 3-7% lower than buy-and-hold returns for the same funds, due to poor timing of capital flows. Risk-adjusted returns are close to zero.
2) Another examines how fund life cycles are affected by flows, size, competition and performance. It finds increasing competition in a category decreases fund survival probabilities.
3) A third study finds macroeconomic risk explains a significant portion of hedge fund return dispersion, but not for mutual funds. Higher macroeconomic risk is positively related to future hedge fund returns.
The document discusses how incentive fees and a hedge fund manager's personal investment in the fund affect the manager's risk-taking behavior. It presents a theoretical model analyzing how loss-averse managers, as described by prospect theory, will increase risk when incentive fees are higher in order to maximize the chance of earning those fees. However, risk-taking is reduced when the manager has a substantial personal investment (at least 30%) in the fund. The document then empirically tests these predictions using data on hedge funds and funds of funds, finding support for higher risk-taking being positively related to incentive fee levels.
This document summarizes a research paper about mutual fund flows and performance. It contains the following key points:
1) The paper presents a rational model of active portfolio management that can reproduce many observed patterns in mutual fund performance and flows, without relying on investor irrationality.
2) In the model, fund flows rationally respond to past performance even though performance is not persistent on average, due to competitive capital allocation to managers.
3) The model shows that lack of performance persistence does not imply managers lack skill or that evaluating performance is wasteful, as differential ability exists but is not consistently rewarded due to competitive capital allocation.
This document summarizes a study examining 125 equity mutual funds that closed to new investment between 1993 and 2004. The study tests three hypotheses about why funds close: 1) The "good steward" hypothesis argues funds close to restrict inflows and maintain performance, and will perform well after reopening. 2) The "cheap talk" hypothesis posits closing has no real cost if fees increase and existing investors contribute, compensating managers. 3) The "family spillover" hypothesis claims closing diverts attention to other funds in the same family. The study finds little support for good steward performance, but evidence managers raise fees consistent with cheap talk, and little family benefit except briefly around closure.
Standard & poor's 16768282 fund-factors-2009 jan1bfmresearch
This document summarizes a study by Standard & Poor's on factors that predict investment fund performance. The study analyzed both qualitative factors like fund size, expenses, and age as well as quantitative metrics like Jensen's alpha and information ratio. The key findings were:
- For developed markets, larger funds with lower expenses tended to outperform. But for emerging markets, smaller funds did better due to differences in liquidity.
- Jensen's alpha and information ratio best predicted future performance of developed market equity funds over shorter time periods.
- Past performance was informative over 2 years but less so over 1 year due to noise. Fund selection should focus on factors predicting shorter term outperformance.
Superior performance by combining Rsik Parity with Momentum?Wilhelm Fritsche
This document examines different strategies for global asset allocation between equities, bonds, commodities and real estate. It finds that applying trend following rules substantially improves risk-adjusted performance compared to traditional buy-and-hold portfolios. It also finds trend following to be superior to risk parity approaches. Combining momentum strategies with trend following further improves returns while reducing volatility and drawdowns. A flexible approach that allocates capital based on volatility-weighted momentum rankings of 95 markets produces attractive, consistent risk-adjusted returns.
Active managementmostlyefficientmarkets fajbfmresearch
This survey of literature on active vs passive management shows:
1) On average, actively managed funds do not outperform the market after accounting for fees and expenses, though a minority do add value.
2) Studies suggest some investors may be able to identify superior active managers in advance using public information.
3) Investors who identify superior active managers could improve their risk-adjusted returns by including some exposure to active strategies.
This document analyzes different categories of active mutual fund management based on measures of Active Share and tracking error. It finds that the most active stock pickers have outperformed their benchmarks after fees, while closet indexers and funds focusing on factor bets have underperformed after fees. Performance patterns were similar during the 2008-2009 financial crisis. Closet indexing has become more popular recently. Fund performance can be predicted by cross-sectional stock return dispersion, favoring active stock pickers when dispersion is higher.
The document summarizes the mid-year 2011 Standard & Poor's Indices Versus Active Funds (SPIVA) Scorecard, which compares the performance of actively managed mutual funds to relevant benchmarks. Some key findings over the past 3 and 5 years include:
- Over 63% of large-cap, 75% of mid-cap, and 63% of small-cap US stock funds underperformed their benchmarks.
- Over 57% of global stock funds, 65% of international stock funds, and 81% of emerging markets stock funds underperformed.
- Over 50% of active bond funds failed to outperform benchmarks, except for emerging market debt funds.
- Asset-weighted returns also showed
Prior performance and risk taking ammannbfmresearch
This document discusses using a dynamic Bayesian network approach to analyze the behavior of mutual fund managers, specifically how prior performance impacts risk-taking. The key findings are:
1) In contrast to some theories and studies, the analysis found that prior performance has a positive impact on the choice of risk level - successful fund managers take on more risk in the following year by increasing measures like volatility, beta, and tracking error.
2) Poor-performing fund managers were found to switch to more passive strategies.
3) Bayesian networks allow capturing nonlinear patterns and assigning probabilities to different outcomes, providing a more robust approach than previous studies on this topic.
Performance of trades and stocks of fund managers pinnuckbfmresearch
This document summarizes a study that examines the performance of stock holdings and trades of Australian fund managers. The study finds:
1) The stocks held by fund managers realize abnormal returns on average, consistent with some stock selection ability.
2) Stocks purchased by fund managers realize abnormal returns on average, while stocks they sell do not, supporting the idea that fund managers have superior information.
3) Large stocks are more likely to benefit from fund managers' superior information than small stocks.
However, the superior returns from stock holdings are not delivered to unit holders, possibly due to fees and poor market timing. The results provide out-of-sample support for recent U.S. studies finding fund managers
This document discusses risk budgeting and active manager allocation for multi-asset class funds. It defines the different types of risks that can be budgeted (systematic, active, etc.) and how the majority of a fund's risk comes from its systematic/beta exposures rather than active risk. The document provides mathematical formulas for decomposing total fund risk and return. It also discusses methods for determining manager allocations based on information ratios and evaluating whether returns come from alpha or beta.
Performance Of Fo F Do Experience And Size Matterchardingsmith
This summary provides the key information from the document in 3 sentences:
The document discusses the performance of funds of hedge funds (FHFs), analyzing whether experience and size impact performance. It uses quantile regression to study the effect of these factors on various return levels rather than just average return. The empirical results suggest that experience and size have a negative effect on performance at higher quantiles, but size has a positive effect at lower quantiles, with both factors showing no significant effect at the median.
This document discusses using active share and tracking error as measures of portfolio manager skill. It defines active share as the percentage of a fund's portfolio that differs from its benchmark index. Tracking error measures systematic factor risk by capturing how much a fund's returns vary from its benchmark. Research shows funds with high active share and moderate tracking error tend to outperform on average. The document examines how active share and tracking error can help identify skillful managers by focusing on their portfolio construction process rather than just past returns.
The article discusses risk parity strategies and evaluates their performance relative to a traditional 60% equity/40% bond portfolio. It finds that while risk parity funds have generally achieved attractive returns compared to the 60/40 portfolio over the past 5 years, their performance has varied. Some key points:
- Risk parity funds use leverage and derivatives to equalize risk across asset classes in order to improve risk-adjusted returns compared to traditional portfolios.
- An analysis of 12 major risk parity managers found that most outperformed the 60/40 portfolio in 2008 and 2009, though returns varied significantly between funds.
- More recently, some risk parity funds have experienced negative returns as rising interest rates became a headwind for their fixed income
Should investors avoid active managed funds baksbfmresearch
This document summarizes a study that analyzes mutual fund performance from an investor's perspective. The study develops a Bayesian method to evaluate mutual fund manager performance using flexible prior beliefs about managerial skill. The method is applied to a sample of over 1,400 equity mutual funds. The study finds that even with extremely skeptical prior beliefs about manager skill, some allocation to actively managed funds is justified. The economic importance is quantified by estimating the portfolio share and certainty equivalent loss from excluding all active managers.
This document discusses risk analysis and techniques for measuring risk. It defines risk and uncertainty, and outlines different types of risk including systematic and unsystematic risk. Several techniques for measuring risk are described, such as the risk-adjusted cut off rate method, certainty equivalent method, sensitivity technique, probability technique, standard deviation method, and coefficient of variation method. Decision tree analysis is also covered as a technique for risk measurement.
This document summarizes a journal article that examines how stale prices impact the performance evaluation of mutual funds. The article introduces a model to estimate "true alpha" based on the true returns of underlying fund assets, independent of biases from stale pricing. Empirical tests show true alpha is about 40 basis points higher than observed alpha and remains positive on average. The difference between the two alphas consists of three components - a small statistical bias, dilution from long-term fund flows, and a large and significant dilution effect primarily from short-term arbitrage flows exploiting stale prices.
investment decisions, risk and uncertainity, types of risk, techniques of measuring risk, cost of capital, importance, factors affecting cost of capital, computation of cost of capital, capital structure, capital structure theories, dividend theories, walter model, gordon model, mm model, working capital management, types of working capital, factors influencing working capital, preparation of cash budget, problems on working capital, corporate valuation,methods
CHW Vol 15 Isu 7 July Quarterly EHP Funds v1J Scott Miller
This document provides a summary of topics covered in the July 2015 issue of a quarterly review publication on hedge funds and alternative investing. It discusses an AIMA Canada seminar series to help new hedge fund managers, performance numbers for the recent quarter, and an article on using a trend-based approach to manage risk. The article describes how following a simple strategy of holding stocks only when they are above their 10-month moving average achieved equity-like returns with lower drawdowns and volatility than a buy-and-hold approach. It also introduces the author's own "EHP Fear Index" for determining their funds' risk levels.
Individuals asset class choice behavior in their pension fund individual account appear consistent with the use of naive learning rules. Preliminary results from joint work with Felix Villatoro, Olga Fuentes and Pamela Searle.
PRELIMINARY AND INCOMPLETE
If a quali ed investor has a choice between investing in a secretive fund and a transparent fund with the same investment objective, which should she choose? Prior work suggests that the secretive fund is better. Hedge fund managers generally use their discretion for the bene t of their investors (Agarwal, Daniel and Naik, 2009, Agarwal, Jiang, Tang and Yang, 2013). In this study we identify a subset of hedge funds managers, which appear to use their discretion to feign skill. Using a proprietary dataset obtained from a fund of funds, we document that hedge funds that are more secretive earn somewhat higher returns than their investment-objective-matched peers during up markets, consistent with earlier papers documenting skill-based performance, but signi cantly worse returns during down markets. This evidence suggests that at least part of the superior performance that secretive funds appear to generate is in fact compensation for loading on additional risk factor(s) as compared to their objective-matched peers.
This document discusses a research paper that investigates why mutual fund performance does not persist over the long run. It finds that fund flows and manager changes act as mechanisms that prevent persistent outperformance or underperformance. For winner funds, high inflows reduce future performance, and losing a top manager also lowers returns. However, winner funds not experiencing high inflows or a manager change outperform those facing both by 3.6% annually. For loser funds, internal governance through manager replacement is more important than external governance from outflows. Firing an underperforming manager and experiencing outflows together improves future performance more than the individual effects alone.
Over a 32-year period, the study found that only 0.6% of funds delivered positive alpha (returns in excess of their benchmarks) through skill rather than luck. The proportion of skilled managers decreased over time, with only 0.6% found to be skilled in 2006 compared to 14.4% in 1990. No funds in the Growth & Income category exhibited skill, while the Aggressive Growth funds showed the most skill. Expenses eliminated the good performance of many managers who appeared skilled. The authors believe the movement of skilled managers to the higher-paying hedge fund industry best explains the decline in mutual fund manager skill over this period.
Strategic asset allocation involves defining portfolio allocations based on long-term historical performance and volatility data, aiming to achieve the optimal balance of risk and return. Tactical asset allocation takes a similar long-term strategic view but allows flexibility to adjust allocations in response to short-term market conditions. While tactical allocation seeks to generate higher returns, it involves ongoing costs and research and there is no guarantee of outperformance. Ultimately, both approaches have merits and the choice depends on an investor's preferences and willingness to take on additional costs and risks of a tactical approach.
Fis group study on emerging managers performance drivers 2007bfmresearch
This study examined the performance of emerging investment managers over three years ending in 2006. It found that:
1) For large cap managers, increased firm assets were negatively correlated with risk-adjusted returns for core and growth strategies, but not for value. This may be because increased assets led to less concentrated core portfolios, lowering returns.
2) For small cap managers, risk-adjusted returns were highest for firms with less than $500 million in assets, possibly due to added resources like analysts. Returns leveled off between $500 million and $1 billion, and declined above $1 billion.
3) Having more research analysts was consistently positively correlated with higher risk-adjusted returns across strategies, while the impact
This report provides an analysis of defined contribution retirement plans based on 2010 Vanguard recordkeeping data. Some key findings include:
- Median and average account balances reached their highest levels since tracking began in 1999, recovering from market declines.
- Use of target-date funds as investment options and default investments continues to grow significantly, with 42% of participants using them and 20% wholly invested in a single target-date fund.
- Professionally managed investment options like target-date funds are being used by an increasing number of participants, with 29% solely invested in an automatic investment program in 2010 compared to just 9% in 2005.
The document presents a model showing that mutual fund managers have an incentive to distort new investments toward stocks their fund already holds large positions in near the end of quarters. This increases the fund's reported returns and attracts more inflows, allowing for greater distortion next quarter. However, the price impact is temporary, so each quarter starts with a larger return deficit until it cannot be overcome, explaining the empirical evidence of short-term persistence and long-term reversal in fund performance. The model also provides insights into why some funds underperform and explains behaviors of smaller and younger funds.
1) Selecting good mutual funds is difficult as only 20% outperform over the long run and 40% of funds from 10 years ago are no longer in existence.
2) Both qualitative and quantitative factors must be analyzed to pick funds, including the people and investment process, fees, performance history, and consistency with the stated investment strategy.
3) A disciplined due diligence process considers the experience, philosophy, ownership structure, incentives, and research capabilities of the fund managers as well as the quantitative metrics of costs, returns, risk levels, and turnover of the fund.
This study examines persistence in mutual fund performance over 1962-1993 using a survivorship-bias-free database. The author finds:
1) Common factors in stock returns and differences in mutual fund expenses explain almost all persistence in mutual fund returns, with the exception of strong underperformance by the worst-performing funds.
2) The "hot hands effect" documented in prior literature is driven by the one-year momentum effect in stock returns, but individual funds do not earn higher returns from actively following momentum strategies after accounting for costs.
3) Expenses have a negative impact on performance of at least one-for-one, and higher turnover also negatively impacts performance, reducing returns by around 0.95
Performance changes and mgmt turnover khoranabfmresearch
This document summarizes a study examining the impact of mutual fund manager replacements on subsequent fund performance. The key findings are:
1) Funds with negative pre-replacement performance continue to underperform benchmarks post-replacement, but see improved relative performance compared to pre-replacement.
2) Replacing outperforming managers results in deteriorating post-replacement performance relative to pre-replacement.
3) Funds with poor pre-replacement performance see significantly declining asset inflows pre-replacement, providing evidence that manager replacements are important for advisors to reverse declining inflows.
This document provides an extensive literature review of studies examining performance persistence in mutual funds. The review summarizes findings from early studies in the 1960s-1980s that used long time periods of 10-15 years and generally found some evidence of performance persistence, especially for inferior performers. However, later studies using shorter time periods found more inconsistent results and that persistence was strongly dependent on the sample and methodology used. The review concludes that while short-term persistence is sometimes found, past performance is not a reliable predictor of future returns due to biases in conventional testing procedures. Results are often sensitive to the specific measures and time periods examined, especially for equity funds.
Short term persistence in mutual fund performance(12)bfmresearch
This study examines the short-term persistence of mutual fund performance using daily returns data over quarterly periods. The researchers estimate stock selection and market timing models for mutual funds and rank funds into deciles based on their estimated abnormal returns each quarter. They then measure the average abnormal return of each decile in the following quarter. They find that the top-performing decile in a given quarter generates a statistically significant average abnormal return of 25-39 basis points in the subsequent quarter, providing evidence of short-term persistence in performance. However, this persistence disappears when funds are evaluated over longer periods using a concatenated time series approach.
This document provides a 3-sentence summary of a research paper that develops a multifactor model to forecast the 1-year returns of actively managed equity mutual funds. The model uses forecasts of a fund's manager skill, style (based on factors like market, size, value, and momentum), and expected factor returns. When tested on German equity funds, the multifactor model substantially improved forecasts compared to a naive model, reducing the mean squared error by up to 30% and yielding returns over 200 basis points higher for top-decile funds.
Performance persistence of fixed income funds dromsbfmresearch
This study examines the performance persistence of fixed income mutual funds between 1990 and 1999. It uses a methodology that ranks funds based on their annual returns, with the top 50% labeled as "winners" and bottom 50% labeled as "losers". It then analyzes whether winners and losers in one period remain winners or losers in the next period. The study finds some evidence of short-term persistence in fund performance driven by changes in interest rates, with statistical significance and consistency between the direction of persistence and bond returns. However, the nature of persistence is shown to be dependent on shifts in interest rates over time.
Measuring luck in estimated alphas barras scailletbfmresearch
This paper develops a new technique to account for "false discoveries" or luck-driven significant performance estimates when evaluating the abilities of multiple mutual fund managers simultaneously. The technique estimates the proportion of funds with true zero alphas, without alphas, and with positive alphas. Applying this to a large dataset of US equity mutual funds, the analysis finds that 75.4% of funds have zero true alpha, 24.0% have negative alphas, and only 0.6% have positive alphas, suggesting very few truly skilled managers despite some funds appearing successful due to luck. This challenges previous work suggesting more widespread manager skill.
- Investors spend an estimated 0.67% of the total value of the US stock market each year on active investing strategies seeking returns above the market.
- This amounts to at least a 10% capitalized cost of the current market value to facilitate price discovery through active investing.
- Under reasonable assumptions, a typical investor could increase average annual returns by 67 basis points over 1980-2006 by switching to a passive market portfolio instead of active strategies.
This document summarizes a study that examines whether mutual fund managers can pick stocks by analyzing the performance of stocks that funds buy and sell around subsequent quarterly earnings announcements. The study finds:
1) On average, stocks that mutual funds buy outperform stocks they sell by about 10 basis points in the 3 days around the next earnings announcement.
2) This performance persists after benchmarking against stocks with similar characteristics, and funds that perform best tend to have a growth style.
3) Mutual fund trades forecast future earnings surprises, indicating managers can predict fundamentals.
4) Abnormal returns around earnings announcements account for 18-51% of total abnormal returns to stocks funds trade.
2010 09 the empirical law of active managementbfmresearch
The document proposes a new analytical framework called the Empirical Law of Active Management to assess the skill and diversification of portfolio managers. It generalizes the Fundamental Law of Active Management. The author applies this framework to analyze the evolution of skill and diversification among 2,798 U.S. mutual funds since 1980. The analysis finds that skill has declined while diversification has increased among U.S. mutual funds. The author proposes two explanations for the decrease in skill: 1) growth in mutual fund assets has made it harder to outperform the market, and 2) funds have responded to demand by creating less informationally-content funds.
The document discusses China's transition to a consumer-driven economy. It provides analysis from CLSA China Macro Strategist Andy Rothman on trends in China's economy including the declining importance of exports, strong growth in domestic consumption, increasing incomes driving spending, and continued growth in infrastructure investment. The analysis suggests China's economy remains healthy and growing despite slowing external demand.
The document discusses quantitative research on the prospects for a large cap comeback. It finds that large cap stocks have underperformed small caps for years and currently trade at large discounts based on various valuation metrics. Some factors that have contributed to this include the growth of ETFs which benefited small and mid caps, an increased focus on risk that favored higher beta small caps, and increased hedging and shorting that particularly impacted large liquid stocks. The research argues these valuation differences and factors favor a potential comeback by large caps.
This study examines whether the ownership stakes of directors in mutual funds are related to fund performance. The researchers collected data on the ownership of independent and non-independent directors of large equity mutual funds. They found that funds with low director ownership, or "skin in the game", significantly underperformed peers. This underperformance was both statistically significant and economically large. Further analysis showed fees only explained a small part of the underperformance, suggesting director oversight impacts more than just fee negotiations. The study aimed to distinguish between directors having private information on future performance versus a lack of incentive alignment causing the underperformance, finding evidence supported the latter explanation.
The document discusses how beliefs systems influence investment decisions and strategies in important ways. It provides two examples: 1) How beliefs about economic versus accounting frames of reference led to divergent views on liability-driven investing. 2) How the use of style boxes to classify investment managers can create incentives for managers to conform to consultant definitions of style over pursuing returns. The document argues that unpacking unconscious beliefs and their cultural influences is important for improving investment judgment and evaluating investment managers.
This paper examines the relationship between mutual fund manager ownership stakes in the funds they manage and the performance of those funds. The author hypothesizes that greater manager ownership will be positively associated with fund returns and negatively associated with fund turnover, as higher ownership would better align manager and shareholder interests by reducing agency costs. Using a dataset of manager ownership disclosures from 2004-2005, the author finds that funds with higher manager ownership had higher returns and lower turnover, supporting the hypotheses. However, manager ownership was not related to a fund's tax burden.
Fund flow volatility and performance rakowskibfmresearch
This paper analyzes the impact of daily mutual fund flow volatility on fund performance. The author finds that higher daily flow volatility is negatively associated with risk-adjusted fund performance. This relationship is strongest for domestic equity funds, smaller funds, better performing funds, and those that experienced net inflows. The results suggest daily fund flows impose liquidity costs through unnecessary trading that reduces returns.
Examination of hedged mutual funds agarwalbfmresearch
Hedge funds have traditionally only been available to accredited investors while providing lighter regulation and stronger performance incentives compared to mutual funds. Recently, some mutual funds have adopted hedge fund-like strategies but remain subject to tighter regulation. This study examines the performance of these "hedged mutual funds" relative to both hedge funds and traditional mutual funds. It finds that despite using similar strategies as hedge funds, hedged mutual funds underperform due to their tighter regulation and weaker incentives. However, hedged mutual funds outperform traditional mutual funds, with the superior performance driven by those with managers having hedge fund experience.
This paper examines the relationship between portfolio manager ownership stakes in the mutual funds they manage and those funds' future performance. The paper finds:
1) Almost half of all managers have ownership stakes in their funds, though the average stake represents a modest percentage of assets under management.
2) Higher managerial ownership is positively associated with improved future risk-adjusted fund performance - performance improves by about 3 basis points for each 1 basis point of managerial ownership.
3) Both the component of managerial ownership predicted by other fund characteristics and the residual component are significant in predicting future fund performance, indicating managerial ownership provides new information to investors.
This study explores performance persistence in mutual funds. The authors find:
1) Funds that perform relatively poorly compared to peers and benchmarks are more likely to disappear, indicating survivorship bias can be relevant in mutual fund studies.
2) Mutual fund performance persists from year to year on a risk-adjusted basis, though much of the persistence is due to repeated underperformance relative to benchmarks.
3) Persistence patterns vary dramatically between time periods, suggesting performance is correlated across managers due to common strategies not captured by risk adjustments. Poorly performing funds also persist instead of being fully eliminated by the market.
Price and performance in funds gil bazobfmresearch
This study examines the relationship between mutual fund fees and performance. It finds a puzzling negative relationship: funds with worse risk-adjusted performance before fees charge higher fees. The study explores several potential explanations for this relationship, including strategic fee setting by funds and the role of fund governance. Some evidence suggests funds with stronger governance structures have fees more aligned with performance.
Mercer Capital | Valuation Insight | Corporate Finance in 30 Minutes Mercer Capital
This document provides a primer on corporate finance for directors and shareholders. It summarizes key concepts in three areas: capital structure, capital budgeting, and dividend policy. For capital structure, it discusses the tradeoff between debt and equity and how the optimal structure minimizes overall cost of capital. For capital budgeting, it outlines how management should select projects with expected returns exceeding the cost of capital. For dividend policy, it addresses shareholders' preferences for income versus growth and how these fit a company's strategic position. The goal is to give directors and shareholders a framework to meaningfully contribute to major financial decisions.
Hedge Fund Predictability Under the Magnifying Glass:The Economic Value of Fo...Ryan Renicker CFA
This document summarizes a study that examines the predictability of individual hedge fund returns based on macroeconomic variables. The study finds that a large proportion (over 60%) of hedge fund returns can be predicted using factors like default spreads, dividend yields, and market volatility. However, exploiting this predictability out-of-sample is challenging due to estimation risk and model uncertainty. The study finds that a combination strategy that averages predictive signals from multiple factors delivers superior risk-adjusted performance compared to strategies relying on single factors alone. This strategy is also more robust, especially during periods of financial crisis when predictor values deviate significantly from historical averages.
Collateralized Fund Obligations MSc thesis Executive SummaryNICOLA Padovani
This dissertation analyzes Collateralized Fund Obligations (CFOs), which issue securitized tranches backed by pools of hedge funds. The author aims to explain the limited success of CFOs compared to expectations.
The paper reviews hedge fund investment vehicles and risks. It identifies clusters of correlated hedge fund strategies using indices. It models pools of strategies using multivariate Archimedean copulas to account for joint extreme returns.
The paper analyzes how CFOs apply techniques from Collateralized Debt Obligations, like credit support and diversification covenants. It proposes a modeling and pricing approach using copulas to simulate joint distributions and calculate tranche spreads. Hypothetical CFOs are priced using
This paper examines how hedge funds use derivatives and how that relates to risk taking. The paper finds that 71% of hedge funds in the sample use derivatives. After controlling for other factors, derivatives users on average exhibit lower risks such as market risk, downside risk, and event risk. This risk reduction is especially pronounced for directional-style funds. Derivatives users also engage in less risk shifting and are less likely to liquidate during poor market conditions. However, investors do not appear to differentiate between derivatives users and non-users when making investment decisions.
1. The document analyzes whether systematic rules-based strategies based on traditional and alternative risk factors can successfully replicate the performance of various hedge fund strategies.
2. Regression analysis shows the factors explain a substantial portion of hedge fund returns, though the explanatory power is higher in-sample than out-of-sample. More dynamic strategies are harder to replicate than directional ones.
3. Out-of-sample, a rolling-window approach to estimating time-varying factor exposures works as well or better than a Kalman filter model for most strategies. Replication quality varies by strategy, with more directional strategies like short selling replicating better than dynamic ones.
This master's thesis examines whether hedge fund performance is due to manager skill or luck. The document provides an abstract that summarizes the thesis. It applies a false discovery rate methodology to measure the proportion of lucky funds among hedge funds with statistically significant returns. The results show that hedge funds outperform due to skill more than luck, and underperform due to being unlucky rather than unskilled. Event driven, relative value, and multi-strategy funds have very low false discovery rates, implying manager skill. CTA, relative value, and short bias funds have higher false discovery rates when underperforming, implying more luck than skill. Small funds' outperformance is also more due to luck, while large funds' underperformance is
Brown Advisory believes recent academic research validates their approach to active equity management. Studies show only managers with high active share (divergent portfolios from benchmarks) and moderate tracking error consistently outperformed. Brown Advisory portfolios have high active share and low tracking error, concentrating on 30-80 carefully selected stocks across sectors. Their research-driven process aims to add value through independent thinking rather than closely tracking indexes.
This document summarizes a study on the determinants of capital structure in Thailand. The study analyzed data on 144 Thai listed companies from 2000 to 2011 to examine how firm-specific factors like size, profitability, asset tangibility, growth opportunities, and volatility influence a company's leverage ratios. The results showed that leverage ratios increased significantly with firm size but decreased significantly with profitability, in line with trade-off and pecking order theories. However, tangibility, growth, and volatility did not have significant relationships with leverage ratios. Therefore, the study concluded that firm size and profitability are the main determinants of capital structure for companies in Thailand.
This document discusses an analysis of investors' risk perceptions towards mutual fund services. It begins with an abstract that outlines the goal of understanding investors' perceptions and expectations to support financial decision making for mutual funds.
The introduction provides background on mutual funds and how they have diversified their product offerings over time. However, these changes still need to align with investors' expectations. The literature review covers previous research on investors' rationality regarding risk-return tradeoffs, investment expectations, and financial innovations in mutual funds.
The document then discusses potential service quality gaps for mutual funds, including ambiguity in investors' expectations and gaps in designing fund services. It introduces the concept of a "tolerance zone" to depict investors' acceptable levels of
JP Morgan Chase The Balance Between Serving Customers and Maxim.docxpauline234567
JP Morgan Chase: The Balance Between Serving Customers and Maximizing Shareholder Wealth
Penelope Bender
William Woods University
BUS 585: Integrated Studies in Business Administration
Dr. Leathers
Abstract
This paper investigates why JP Morgan Chase and other financial institutions struggle to balance client interests over maximizing wealth.
It is an exploratory study done through literature review.
Often financial institutions, like JP Morgan, put profits ahead of the interests of those they serve.
The paper contributes to better understanding of corporate culture.
This paper investigates why JP Morgan Chase and other financial institutions struggle to balance client interests over maximizing shareholder wealth. This exploratory study is done through a literature review to answer why financial institutions, specifically JP Morgan, often put profits ahead of those they serve. The study will provide evidence of the complex nature of balancing client interests over maximizing shareholder and individual wealth and the need for tighter internal and external oversight. This paper contributes to a better understanding of why corporate culture encourages profit over stakeholders’ interests.
2
Research Question
Why does JP Morgan Chase and other financial institutions struggle to balance client interests over maximizing shareholder wealth?
Employees of JP Morgan Chase and other large banks work in their best interests to increase wealth and succeed by meeting management goals. However, because of the complex nature of large banks, an individual(s), unethical behavior can go unchecked.
3
Problem Statement
JP Morgan Chase competes globally and faces competition from other large banks in the US and abroad.
JP Morgan Chase is part of a complex system of regulation, self-interests, and wealth creation.
The interests of shareholders and investors is sometimes overshadowed by agents working in their own best interests.
Financial markets are a complex web of interests, and because of opportunities for individual profits, regulating individual’s actions without stricter regulations and internal oversight is impossible.
The study is not meant to be a moral or ethical analysis but merely why the complex relationship exists and will continue to exist in capitalist society. This paper contributes to a better understanding of why capitalism or financialism’s (Clarke, 2014) fundamentals encourage wealth creation. Financial markets are a complex web of interests, and because of opportunities for individual profits, regulating individual’s actions without stricter regulations and internal oversight is impossible.
4
Literature Review
The literature review showed a connection between self-interests, regulators, competition, and risk, which all lead to a complex system of conflicting agendas.
5
How Self-Interests Influence Behavior
Ross (1973) explains that all employment relationships are agency relationships and moral hazards are generally .
Do funds with few holdings outperform kaushikbfmresearch
This document summarizes a study that investigates the performance of mutual funds that hold a small number of stocks (10-30) in their portfolio, which are considered less diversified. The authors analyze funds over the period of 2001-2006 and compare their performance to benchmarks like the S&P 500 index. They find that on average, funds with fewer holdings underperform the market by about 20 basis points per month, or 2.4% annually. However, they also find that "Winner" portfolios outperform the market by 49.2% per year on average, while "Loser" portfolios underperform by 38.4% per year. Regression analysis indicates characteristics like fund turnover and concentration are positively related to
A Study on the Performance of Mutual Fund Scheme in IndiaIJAEMSJORNAL
A mutual fund is a trust that encompasses the savings of a number of investors who share a common financial goal. The money thus collected is then invested in capital market instruments such as shares, debentures and other securities. The income earned through these investments and the capital appreciation realized is shared by its unit holders in proportion to the number of units owned by them. Thus, Mutual Fund is one of the most effective instruments for the small & medium investors for investment and offers opportunity to them to participate in capital market with low level of risk. It also provides the facility of diversification i.e. investors can invest across different types of schemes. Indian Mutual Fund has achieved a lot of popularity since last two decades. For a long time UTI enjoyed the monopoly in mutual fund industry. But with the passage of time many new players came in the market and thus the mutual fund industry faces a lot of competition. Now a day this industry has become the major player of the financial system. Therefore it becomes important to investigate the mutual fund performance at continuous basis. The wide variety of schemes floated by these mutual fund companies gave wide investment choice for the investors. Among wide variety of funds equity, diversified fund is considered as substitute for direct stock market investment. In present paper an attempt has been made to investigate the performance of the open ended, growth oriented, equity diversified schemes on the basis of return and risk evaluation. The analysis was achieved by assessing various financial tests like Average Return, Standard Deviation, Beta, Coefficient of Determination (R2), Alpha, Sharpe Ratio and Treynor Ratio whose results will be useful for investors for taking better investment decisions. The data has been taken from various websites of mutual fund schemes and from amfiindia.com. The analysis depicts that majority of funds selected for study have outperformed under Sharpe Ratio as well as Treynor Ratio.
Liquidity, investment style, and the relation between fund size and fund perf...bfmresearch
This document summarizes a study that examines the effect of liquidity and investment style on the relationship between fund size and fund performance. The study finds:
1) Fund performance declines as fund size increases, consistent with prior research.
2) This inverse relationship is stronger for funds holding less liquid portfolios, providing evidence that liquidity issues contribute to performance declining with size.
3) The negative effect of size on performance is also more pronounced for growth funds and high-turnover funds, which tend to have higher trading costs.
4) Controlling for other fund characteristics, performance is still negatively related to size, and this effect is stronger for less liquid funds.
Active managementmostlyefficientmarkets fajbfmresearch
This survey of literature on active vs passive management shows:
1) On average, actively managed funds do not outperform the market after accounting for fees and expenses, though a minority do add value.
2) Studies suggest some investors may be able to identify superior active managers in advance using public information.
3) Investors who identify superior active managers could improve their risk-adjusted returns by including some exposure to active strategies.
Similar to Prior performance and risk chen and pennacchi (20)
Performance emergingfixedincomemanagers joi_is age just a numberbfmresearch
1) Younger fixed-income managers tend to outperform older, more established managers in terms of gross returns. Returns are significantly higher for emerging managers in their first year and first five years compared to later years.
2) The study examines 54 fixed-income managers formed since 1985 that had majority employee ownership. Most were formed before 2000, when barriers to entry increased.
3) Business risk is low for emerging managers, as only 6.8% of the 88 examined managers are no longer in business. Higher first-year and early-period returns for emerging managers indicate they provide alpha during their hungry startup phase.
This document analyzes different categories of active mutual fund management based on measures of Active Share and tracking error. It finds that the most active stock pickers have outperformed their benchmarks after fees, while closet indexers and funds focusing on factor bets have underperformed after fees. Performance patterns were similar during the 2008-2009 financial crisis. Closet indexing has become more popular recently. Fund performance can be predicted by cross-sectional stock return dispersion, favoring active stock pickers when dispersion is higher.
The document summarizes findings from the Standard & Poor's Indices Versus Active Funds (SPIVA) Scorecard, which compares the performance of actively managed mutual funds to relevant benchmarks. Some key points:
- Over the past 3 years, the majority (over 50%) of actively managed large-cap, mid-cap, small-cap, global, international, and emerging market funds underperformed their benchmarks.
- Over the past 5 years, indices outperformed a majority of active managers in nearly all major domestic and international equity categories based on equal-weighted returns. Asset-weighted averages also showed underperformance in 11 out of 18 domestic categories.
- For fixed income funds, over 50% under
This document summarizes research on the relationship between portfolio turnover and investment performance. Recent studies have found no evidence that higher portfolio turnover leads to lower returns, as was previously thought. Trading costs have declined over time, and portfolio turnover is not a good proxy for actual trading costs, which depend more on trade size and type of security traded. A 2007 study directly estimated trading costs and found no clear correlation between costs and returns. The author's own analysis of mutual funds from 2007-2008 also found little relationship between turnover and performance. Therefore, advisors should not assume higher turnover means lower returns.
This document is a guide to the markets published by JPMorgan that provides data and analysis across various asset classes including equities, fixed income, international markets, and the economy. It includes sections on returns by investment style and sector for equities, economic indicators and drivers, interest rates and other data for fixed income, international market returns and valuations, and asset class performance and correlations. The guide contains over 60 charts and analyses global and domestic financial trends and investment opportunities.
The document discusses whether the concept of "Alpha" is a useful performance metric for investors. It makes two main arguments:
1) Alpha alone does not determine if a portfolio has superior risk-adjusted returns, as portfolio volatility and correlation to benchmarks also influence risk-adjusted returns.
2) Alpha is dependent on leverage - a higher reported Alpha could simply be due to using leverage rather than superior investment skill.
The document concludes that Alpha is a misleading performance measure and not suitable as the sole metric, especially for investors concerned with total risk and returns rather than just a single return component.
The document discusses Barclays' process for evaluating and selecting investment managers. It states that identifying the right asset allocation and implementing it properly are both important for achieving investment goals. The process involves both science, through a formal and structured methodology, and art, by applying judgment and philosophy. Barclays aims to identify managers most likely to perform well through rigorous due diligence and ongoing monitoring. The paper will explain Barclays' comprehensive approach to manager analysis, selection, and review.
This document summarizes recent academic research on active equity managers who deliver persistent outperformance. It discusses studies finding that:
1) While the average equity manager underperforms after fees, a minority of managers have demonstrated persistent outperformance that cannot be attributed to chance alone.
2) Managers with higher "active share" (the degree to which their portfolio composition differs from the benchmark) tend to generate greater risk-adjusted returns.
3) Managers with lower portfolio turnover and a focus on strong stock selection, rather than market timing, are more likely to outperform over time.
The document evaluates how Brown Advisory's investment approach aligns with the characteristics identified in these studies as being associated with persistent
The document discusses the benefits of exercise for mental health. Regular physical activity can help reduce anxiety and depression and improve mood and cognitive function. Exercise causes chemical changes in the brain that may help protect against mental illness and improve symptoms.
Information ratio mgrevaluation_bossertbfmresearch
This document discusses using the Information Ratio (IR) to evaluate mutual fund managers. The IR measures excess return over a benchmark relative to excess return volatility. While commonly used, the IR has limitations that depend on benchmark choice, data frequency, and fund return distributions. The document aims to empirically analyze IR characteristics across different asset classes and countries to determine if it is a reliable performance measure or if guidelines are needed for its use.
This document summarizes a study comparing the performance of mutual funds managed by individual managers versus teams of managers. The study finds that funds managed by teams have similar risk-adjusted performance to individually-managed funds, despite team-managed funds growing at a faster rate. Additionally, team-managed funds have significantly lower risk, lower cross-sectional performance differences, lower expenses, and lower portfolio factor loadings than individually-managed funds. The study uses a large sample of domestic and international mutual funds to test these findings.
This document discusses returns-based style analysis (RBSA), a technique developed by William Sharpe to determine the style of a portfolio or mutual fund using only returns data. The document provides an overview of RBSA and compares it to holdings-based style analysis. It then describes how to implement RBSA using Excel by constructing a portfolio of indices to minimize the tracking error between the returns of the portfolio being analyzed and the index portfolio returns. The document concludes by providing an example RBSA using the Dodge & Cox Balanced Fund to illustrate the technique.
1) The study investigates how fund size affects performance in the active money management industry. Specifically, it analyzes whether fund returns decline as fund size increases.
2) The results show that both gross and net fund returns decline as lagged fund size increases, even after accounting for various performance benchmarks and fund characteristics. This suggests that larger fund size erodes performance.
3) However, controlling for its own size, a fund's performance does not deteriorate as the size of the family it belongs to increases. This indicates that scale itself does not necessarily harm performance, depending on how the fund is organized.
Morningstar ratings and fund performance blake moreybfmresearch
This study examines the ability of Morningstar ratings to predict the future performance of mutual funds compared to alternative predictors. The authors analyze two samples of US equity funds: seasoned funds from 1992-1997 and complete funds from 1993. They assess predictive ability using out-of-sample performance over 1, 3, and 5 year horizons, adjusting for loads and styles. The results indicate that low Morningstar ratings generally predict relatively poor future performance, but there is little evidence that top-rated funds outperform similar funds. Morningstar ratings do only slightly better than alternative predictors in forecasting future fund performance.
Fund returnsandperformanceevaluationtechniques grinblattbfmresearch
This paper empirically compares three techniques for evaluating mutual fund performance: the Jensen Measure, the Positive Period Weighting Measure, and the Treynor-Mazuy Measure of Total Performance. It does so using a sample of 279 mutual funds and 109 passive portfolios constructed from firm characteristics and industries. The study finds that 1) the performance measures can yield different inferences depending on the benchmark used, 2) measures may detect timing ability differently, and 3) cross-sectional regressions of performance on fund characteristics may provide insights even when individual performance measures lack statistical power.
This study analyzes the trading behaviors of 155 mutual funds between 1975 and 1984 to determine if they exhibited momentum investing and herding behaviors. The researchers find that 77% of funds were "momentum investors," buying stocks that had outperformed in the past, though most did not systematically sell past underperformers. Funds exhibiting momentum behaviors on average realized significantly better risk-adjusted returns than other funds. The study also finds weak evidence that funds tended to buy and sell the same stocks at the same time, known as herding behavior.
This document contains multiple repetitions of the copyright notice for the year 1998 with all rights reserved. The copyright notice is stating that the full copyright with all rights is reserved for anything covered under copyright laws in the year 1998. The repetitive nature of the notice suggests it is meant to strongly assert ownership and control over any applicable copyrighted materials from that year.
^%$Zone1:+971)581248768’][* Legit & Safe #Abortion #Pills #For #Sale In #Duba...mayaclinic18
Whatsapp (+971581248768) Buy Abortion Pills In Dubai/ Qatar/Kuwait/Doha/Abu Dhabi/Alain/RAK City/Satwa/Al Ain/Abortion Pills For Sale In Qatar, Doha. Abu az Zuluf. Abu Thaylah. Ad Dawhah al Jadidah. Al Arish, Al Bida ash Sharqiyah, Al Ghanim, Al Ghuwariyah, Qatari, Abu Dhabi, Dubai.. WHATSAPP +971)581248768 Abortion Pills / Cytotec Tablets Available in Dubai, Sharjah, Abudhabi, Ajman, Alain, Fujeira, Ras Al Khaima, Umm Al Quwain., UAE, buy cytotec in Dubai– Where I can buy abortion pills in Dubai,+971582071918where I can buy abortion pills in Abudhabi +971)581248768 , where I can buy abortion pills in Sharjah,+97158207191 8where I can buy abortion pills in Ajman, +971)581248768 where I can buy abortion pills in Umm al Quwain +971)581248768 , where I can buy abortion pills in Fujairah +971)581248768 , where I can buy abortion pills in Ras al Khaimah +971)581248768 , where I can buy abortion pills in Alain+971)581248768 , where I can buy abortion pills in UAE +971)581248768 we are providing cytotec 200mg abortion pill in dubai, uae.Medication abortion offers an alternative to Surgical Abortion for women in the early weeks of pregnancy. Zone1:+971)581248768’][* Legit & Safe #Abortion #Pills #For #Sale In #Dubai Abu Dhabi Sharjah Deira Ajman Fujairah Ras Al Khaimah%^^%$Zone1:+971)581248768’][* Legit & Safe #Abortion #Pills #For #Sale In #Dubai Abu Dhabi Sharjah Deira Ajman Fujairah Ras Al Khaimah%^^%$Zone1:+971)581248768’][* Legit & Safe #Abortion #Pills #For #Sale In #Dubai Abu Dhabi Sharjah Deira Ajman Fujairah Ras Al Khaimah%^^%$Zone1:+971)581248768’][* Legit & Safe #Abortion #Pills #For #Sale In #Dubai Abu Dhabi Sharjah Deira Ajman Fujairah Ras Al Khaimah%^^%$Zone1:+971)581248768’][* Legit & Safe #Abortion #Pills #For #Sale In #Dubai Abu Dhabi Sharjah Deira Ajman Fujairah Ras Al Khaimah%^^%$Zone1:+971)581248768’][* Legit & Safe #Abortion #Pills #For #Sale In #Dubai Abu Dhabi Sharjah Deira Ajman Fujairah Ras Al Khaimah%^^%$Zone1:+971)581248768’][* Legit & Safe #Abortion #Pills #For #Sale In #Dubai Abu Dhabi Sharjah Deira Ajman Fujairah Ras Al Khaimah%^^%$Zone1:+971)581248768’][* Legit & Safe #Abortion #Pills #For #Sale In #Dubai Abu Dhabi Sharjah Deira Ajman Fujairah Ras Al Khaimah%^^%$Zone1:+971)581248768’][* Legit & Safe #Abortion #Pills #For #Sale In #Dubai Abu Dhabi Sharjah Deira Ajman Fujairah Ras Al Khaimah%^^%$Zone1:+971)581248768’][* Legit & Safe #Abortion #Pills #For #Sale In #Dubai Abu Dhabi Sharjah Deira Ajman Fujairah Ras Al Khaimah%^^%$Zone1:+971)581248768’][* Legit & Safe #Abortion #Pills #For #Sale In #Dubai Abu Dhabi Sharjah Deira Ajman Fujairah Ras Al Khaimah%^^%$Zone1:+971)581248768’][* Legit & Safe #Abortion #Pills #For #Sale In #Dubai Abu Dhabi Sharjah Deira Ajman Fujairah Ras Al Khaimah%^^%$Zone1:+971)581248768’][* Legit & Safe #Abortion #Pills #For #Sale In #Dubai Abu Dhabi Sharjah Deira Ajman Fujairah Ras Al Khaimah%^^%$Zone1:+971)581248768’][* Legit & Safe #Abortion #Pills #For #Sale In #Dubai Abu Dhabi Sharjah Deira Ajman
Vicinity Jobs’ data includes more than three million 2023 OJPs and thousands of skills. Most skills appear in less than 0.02% of job postings, so most postings rely on a small subset of commonly used terms, like teamwork.
Laura Adkins-Hackett, Economist, LMIC, and Sukriti Trehan, Data Scientist, LMIC, presented their research exploring trends in the skills listed in OJPs to develop a deeper understanding of in-demand skills. This research project uses pointwise mutual information and other methods to extract more information about common skills from the relationships between skills, occupations and regions.
Economic Risk Factor Update: June 2024 [SlideShare]Commonwealth
May’s reports showed signs of continued economic growth, said Sam Millette, director, fixed income, in his latest Economic Risk Factor Update.
For more market updates, subscribe to The Independent Market Observer at https://blog.commonwealth.com/independent-market-observer.
2. Elemental Economics - Mineral demand.pdfNeal Brewster
After this second you should be able to: Explain the main determinants of demand for any mineral product, and their relative importance; recognise and explain how demand for any product is likely to change with economic activity; recognise and explain the roles of technology and relative prices in influencing demand; be able to explain the differences between the rates of growth of demand for different products.
University of North Carolina at Charlotte degree offer diploma Transcripttscdzuip
办理美国UNCC毕业证书制作北卡大学夏洛特分校假文凭定制Q微168899991做UNCC留信网教留服认证海牙认证改UNCC成绩单GPA做UNCC假学位证假文凭高仿毕业证GRE代考如何申请北卡罗莱纳大学夏洛特分校University of North Carolina at Charlotte degree offer diploma Transcript
Abhay Bhutada, the Managing Director of Poonawalla Fincorp Limited, is an accomplished leader with over 15 years of experience in commercial and retail lending. A Qualified Chartered Accountant, he has been pivotal in leveraging technology to enhance financial services. Starting his career at Bank of India, he later founded TAB Capital Limited and co-founded Poonawalla Finance Private Limited, emphasizing digital lending. Under his leadership, Poonawalla Fincorp achieved a 'AAA' credit rating, integrating acquisitions and emphasizing corporate governance. Actively involved in industry forums and CSR initiatives, Abhay has been recognized with awards like "Young Entrepreneur of India 2017" and "40 under 40 Most Influential Leader for 2020-21." Personally, he values mindfulness, enjoys gardening, yoga, and sees every day as an opportunity for growth and improvement.
OJP data from firms like Vicinity Jobs have emerged as a complement to traditional sources of labour demand data, such as the Job Vacancy and Wages Survey (JVWS). Ibrahim Abuallail, PhD Candidate, University of Ottawa, presented research relating to bias in OJPs and a proposed approach to effectively adjust OJP data to complement existing official data (such as from the JVWS) and improve the measurement of labour demand.
Falcon stands out as a top-tier P2P Invoice Discounting platform in India, bridging esteemed blue-chip companies and eager investors. Our goal is to transform the investment landscape in India by establishing a comprehensive destination for borrowers and investors with diverse profiles and needs, all while minimizing risk. What sets Falcon apart is the elimination of intermediaries such as commercial banks and depository institutions, allowing investors to enjoy higher yields.
1. J O U R N A L OF FINANCIAL A N D QUANTITATIVE ANALYSIS Vol. 44, No. 4, A u g . 2009, p p . 7 4 5 - 7 7 5
COPYRIGHT 2009, MICHAEL G. FOSTER SCHOOL OF BUSINESS, UNIVEHSITY OF WASHINGTON, SEAHLE. WA 98195
doi:1Q.1017/S002210900999010X
Does Prior Performance Affect a Mutual Fund's
Choice of Risk? Theory and Further Empirical
Evidence
Hsiu-lang Chen and George G. Pennacchi*
Abstract
Recent empirical studies of mutual fund competition examine the relation between a fund's
performance, the fund manager's compensation, and ihe finid manager's choice of portfo-
lio risk. This paper models a manager's portfolio choice for compensation rules that can
be either a concave, linear, or convex function of the fund's performance relative to that
of a benchmark. For particular compensation structures, a manager increases the fund's
"tracking error" volatility as its relative perfomiance declines. However, declining perfor-
mance does not necessarily lead the manager to raise the volatility of the fund's return. The
paper presents nonparameiric and parametric tests of the relation between mulua! fund per-
formance and risk taking for more than 6.üt)ü equity mutual funds over the l%2 to 2006
period. There is a tendency for mutual funds to increase the standard deviation of tracking
errors, but not the standard deviation of returns, as their perfomiance declines. This risk-
shifting behavior appears more common for funds whose managers have longer tenures.
I. Introduction
As mtitual fund investing has grown, the management of mutual funds has
come under closer scrutiny by financial ecotwmists. One strand of research ex-
amines potential agency problems between a mutual fund's shareholders and its
portfolio manager. Several studies investigate whether a manager might unneces-
sarily shift the fund's risk in response to changes in its performance relative to
other funds. This behavior is linked to the way the manager is compensated and
to the actions of mutual fund investors. The manager's compensation depends on
her success in generating flows of new investments into the fund, while mutual
fund investors "chase returns" by channeling investments into funds with better
'Chen, hsiulang@uic.edu. College of Business Administration. University of Illinois at Chicago.
601 S. Morgan St.. Chicago. IL 60607; Pennacchi, gpennaccCa'illinois.edu, College of Business. Uni-
versity of Illinois at Urbana-Champaign. 515 E. Gregory Dr.. Champaign, IL 61820. We are grateful
for valuable comments pmvided by Wayne Fersnn (associate editor and referee), Zoran Ivkovich.
Jason Karceski, Maiii Keloharju, Paul Malafesta (Ihe editor), and participants al the 2000 .WA
Meetings and at seminars al llie Federal Reserve Bank of Cleveland, the University of Illinois, the
University of North Carolina at Chapel Hill, and the University of Notre Dame.
745
2. 746 Journal of Financial and Quantitative Analysis
relative performance. This creates a situation described as a mutual fund "tour-
nament," where portfolio managers compete for better performance, greater fund
inflows, and, ultimately, higher compensation.
Inflows rise nonlinearly with a fund's relative performance. Numerous stud-
ies document that mutual funds with the best recent performance experience the
lion's share of new inflows, but poorly pertbrming funds are not penalized with
sharply higher outflows.' If the fund manager's compensation rises in propor-
tion to the fund's inflows, this convex pertbrmance-fund flow relation produces
a convex performance-compensation structure.^ Research such as Sirri and
Tufano (1998) notes that such compensation is similar to a call option, creat-
ing an incentive for a manager to raise the risk of the fund's relative returns.
Chevalier and Ellison (1997), Brown, Harlow, and Starks (BHS) (1996), Basse
(2001 ), and Goriaev, Nijman, and Werker (GNW) (2005) have empirically exam-
ined the behavior of a cross-section of mutual funds for which this risk-taking
incentive is predicted tti differ.
The current paper adds to this mutual fund tournament literature by pro-
viding new theoretical and empirical insights into risk taking by mutual funds. It
models the optimal intertemporal portfolio strategy of a mutual fund manager that
faces the competitive tournament environment assumed by recent empirical work.
Explicit solutions for this manager's portfolio allocation are derived when her util-
ity displays constant relative risk aversion and compensation is either a concave,
linear, or convex function of the fund's relative calendar-year performance.
The model shows that the deviation of a fund manager's optimal portfo-
lio from the benchmark portfolio is a function of the fund's performance. If the
penalty for poor performance is limited so that the manager's total compensation
can never fall to zero, then the fund manager chooses to deviate more from the
benchmark portfolio as the fund's relative performance declines. In other words,
when a fund is performing poorly it displays more "tracking error" than when it
performs relatively well. However, it is not necessarily true that an underperiorm-
ing fund chooses to raise the volatility (standard deviation) of its returns.
Almost all empirical studies that have tested for tournament risk shifting
have analyzed fund risk measures other than tracking error. Most commonly, em-
pirical research has tested for whether underpertbrming funds increase the stan-
dard deviation of their total returns, rather than the standard deviation of their
tracking errors. The most comprehensive of these studies conclude that there is
no evidence for tournament behavior. However, based on our model's insights.
'Siudies examining the fund flow-performance relalionship include IppoliUi (1992). Gruber
(1996), Chevalier and Ellison (1997), Sirri and Tufano (1998). Gœtzmann and Peles (1997), and
Del Guercio and Tkac (2002).
-The literature on mutual fund tournaments distinguishes between a fund's investment advisor,
the entity responsible for ponfoho management, and the portfolio manager hired by the advisor. The
typical investment advisor is paid a fixed fraction of the fund's assets, assets that depend on both net
fund inflows(externali;rowthof assets) and the fund's return (internal growthof assets). However, the
ptirtfoUu manager's compensation is assumed to depend only on his ability lo generate extraordinary
growth in fund assets, growth that depends on the fund's return relative to (the average of) other funds'
rettims. Common or systematic shocks to all funds' returns (affecting internal asset growth) are not
due to the individual manager's ponfolio selection ability and would not alïect compensation. Hence,
compensation is assumed to depend on relative, not absolute, performance.
3. Chen and Pennacchi 747
we argue that this conclusion may be unwarranted because it is based on tests that
have employed risk measures that are inappropriate for examining the tournament
hypothesis.
This paper reexamines the empirical evidence for tournament behavior in
light of our model's predictions. We construct two different types of tests. One is
a nonparametric test that modifies the standard deviation ratio (SDR) tests used
in prior studies. It analyzes risk shifting for a cross-section of mutual funds based
on the SDR of their tracking errors, rather than the SDR of their returns. Another
parametric test exatiiines individual mutual funds' time-series behavior based on
an empirical model that nests our paper's theoretical one. Unlike the nonparamet-
ric tests that allow a fund's risk to change only once per year, this parametric test
permits each fund's risk to vary at every (monthly) observation date.
Both tests are performed using data on tiiore than 6.00() mutual funds that
operated during the 1962 to 2006 period. As predicted by our model, the empirical
evidence suggests that an underpertorming mutual fund manager increases the
standard deviation of tracking error, but not the standard deviation of returns.
Evidence is strongest for managers that have longer tenures at their funds, a result
that also is consistent with our model.
The plan of the paper is as follows. Section II briefly discusses related the-
oretical and empirical work on the risk-taking incentives of mutual fund man-
agers. In Section III we present our model. Section IV discusses nonparametric
and parametric empirical methods for testing the risk-taking behavior implied by
our model. Section V describes our data, and Section VI presents the empirical
results. Concluding comments are in Section VII.
II. Related Literature
This section begins by discussing sotne of the theoretical research that
relates to our paper's model. It then reviews empirical studies of mutual fund
tournaments.
A. Models of Portfolio Management
A growing literature examines links between a fund manager's compensa-
tion contract and his portfolio choice. Grinblatt and Titman (1989) show how
compensation contracts that include a bonus for good performance can produce
moral hazard incentives. Mutual fund managers can maximize the present value
of their option-like bonus by choosing a fund portfolio with excessive risk. More-
over, the fund manager can risklessly capture the increased value of this bonus if
she can hedge using her personal wealth.
Starks (1987) considers the moral hazard incentives of a bonus contract, fo-
cusing on situations of asymmetric information between investors and fund man-
agers. When investors cannot observe a manager's choice of portfolio risk or the
manager's effort level, compensation contracts with symmetric payoffs dominate
contracts that include a bonus. However, Das and Sundaram (2002) show that the
relative advantages of symmetric and bonus contracts can be reversed if investors'
choice of funds is made endogenous to the funds' risk levels and compensation
4. 'r
748 Journal of Financial anä Quantitative Analysis
contracts. In their model, bonus contracts provide better risk sharing between in-
vestors and fund managers when investors take account of a fund's risk and con-
tract choice. Dybvig. Farnsworth. and Carpenter (2009) also find that contracts
should include a bonus proportional to the fund's return in excess of a benchmark
return when a fund manager's effort determines the quality of her information.-'
Other research, such as Huberman and Kandel ( 1993), Heinkel and Stoughton
(1994). and Huddart (1999), considers environments where fund managers pos-
sess different abilities that are unknown to investors. In these screening mod-
els, there is typically an initial period when investors learn of managers* abilities
based on their relative performances, followed by a second period when investors
can switch their savings to those managers perceived to have the highest abilities.
Hence, these "investor learning" models can explain the link between fund flows
and prior performance. In addition, if managerial ability displays decreasing re-
turns to scale. Berk and Green (2004) show that fund flows determine the relative
sizes of mutual funds such that, in equilibrium, investors expect no future superior
returns net of fund fees and expenses.
The model in the current paper differs from this previous work by focusing
on how prior performance affects a fund manager's intertemporal choice of port-
folio risk. We take the structure of compensation as given and study a manager's
dynamic portfolio choice during an annual mutual fund tournament. Models by
Carpenter (200Í)), Cuoco and Kaniel (2001), and Basak, Pavlova, and Shapiro
(2007) are related to ours. These papers assume that the performance-related coni-
f>onents of a manager's compensation are piece-wise linear functions of perfor-
mance. Carpenter (2000) specifies compensation equal to a fixed fee plus a call
option written on the value of the managed portfolio with an exercise price equal
to a benchmark asset. Cuoco and Kaniel (2001) permit compensation to contain
a penalty for poor performance in the form of the manager's writing a put option
on the managed portfolio. Basak, Pavlova, and Shapiro (2007) assume a man-
ager's compensation is linear in portfolio returns relative to a benchmark but sub-
ject to fixed minimum and maximum payoffs, equivalent to a bull spread option
strategy.
While we also assume that a manager's compensation depends on the port-
folio's performance relative to a benchmark, the contract is not strictly in the form
of standard call or put options. Rather than being an option-like, piece-wise lin-
ear function of performance, our compensation contract is a smooth function that
can be concave, linear, or convex in relative performance. An advantage of our
smooth compensation schedule is that it leads to simple and intuitive closed-form
solufions for a fund manager's optimal portfolio choice. This simplicity allows
the model to guide our later empirical tests of mutual fund behavior.
Arguably, a smooth performance-compensation function better captures the
environment of a mutual fund tournament where compensation is proportional to
a fund's assets under management that, in tum, depend on how investor inflows
^Becker, Ferson. Myers, and Schill (1999) also analyze the consequences for portfolio choice
when a manager has compensation based on the fund's return in excess of a benchmark and also has
the ability to time the market.
5. Chen and Pennacchi 749
respond to the fund's relative performance.'' Chevalier and Ellison (( 1997). p. 1181 )
contend that assuming a smooth relationship between miitu;il fund performance
and fund flows is preferable because it avoids imposing the strong restrictions on
risk incentives that occur with a piece-wise linear contract. Under a piece-wise
linear contract, a manager's risk incentives are always maximized or minimized
at the contract's kink points, yet for mutual funds, identifying the location of these
kink points is subject to error since they must be estimated from past fund flows.
B. Empirical Research on Mutual Fund Tournaments
Several empirical studies have analyzed the relationship between a mutual
fund's prior pertbrmance and its choice of risk. Chevalier and Ellison ( 1997) esti-
mate the shape of mutual funds" performance-fund How relation and use it to infer
different funds' risk-taking incentives. They, like other researchers, assume that
a fund's inflows respond primarily to its relative performance calculated over the
previous calendar year. Thus fund managers compete in annual tournaments that
begin in January and end in December.-^ A fund's risk-taking incentive over the
final quarter of the year is assumed to be proportional to the estimated convexity
of fund inflows measured locally around the fund's September performance rank-
ing. Using 1983 to 1993 data on the equity holdings of mutual funds at the ends
of September and December. Chevalier and Ellison (1997) find that a fund tends
to change the standard deviation of its return relative to a benchmark return as the
performance-fund flow relation predicts. For example, young mutual funds that
perform relatively poorly from January to September tend to raise the standard
deviation of their return in excess of a benchmark return (standard deviation of
tracking error) during October to December/'
Another study by BHS (1996) performs SDR tests of whether a fund that
performs relatively poorly at midyeai- tends to raise the standard deviation of its
return over the latter half of the year more than does a fund that performs relatively
well at midyear. They use monthly returns data for a cross-section of mutual funds
during 1980 to 1991 and ñnd support for the tournament hypothesis that midyear
"losers" gamble to improve their relative end-of-year performance by raising tbeir
funds' standard deviation of returns more than do midyear "winners." Koski and
Pontiff (1999) also use monthly returns data over the 1992 to 1994 period to
"•The ciinlract in Carpenter {2()(K)} may better represeiU ihe irompensalion of a nonfiniinciiil timi
manager who receives stock options. Cuoco ¡md Kaniel's {2(K)I ) compensation contract miyht be mosl
appropriate for other poritblio managers, such as managers of pension funds. Their analysis focuses
on tlie equilihriuni asset pricing consequences of portfolio management. Basak el ai. (2007) assume a
complete markets environment where portfolio managers lack asset selection ability and choose only
systematic risk.
^This assumption is justified because sources of mutual fund information, such as Momingstar,
Inc., typically compute relative fund performances using this calendar-year period. Hence, flows of
investor funds and. in turn, managerial compensation should be most sensitive to a fund's calendar-
year performance- Empirical evidence in Koski and Pontiff ( 1999) indicates that changes in a fund's
risk are most strongly related to performance calculated over calendar years.
''Chevalier and Ellison (1997) also test their estimated performance-flow relation using monthly
data on fund returns. They measure a fund's risk as ihe standard deviation of its return in excess of
the return on a value-weighted index of NYSE. AMEX. and NASDAQ stocks and lind thai it moves
in the predicted direclion during ihe last quarter of the year.
6. 750 Journal of Financial and Quantitative Analysis
calculate various measures of a fund's risk, including the standard deviation, beta,
and idiosyncratic risk of a fund's returns. Their results are similar to those of BHS
(1996) in that a mutual fund's performance in the first half of the calendar year is
negatively related to its change in risk during the second half.
However, more recent research finds that some of these results are not ro-
bust to other testing methods and sample periods. Busse {2001) uses a different
database of daily, rather than monthly, mutual fund returns from 1985 to 1995
to calculate more accurate estimates of a fund's SDRs. He duplicates the SDR
tests in BHS (1996) and finds no evidence that midyear poor-performing funds
increase their standard deviation of return more than midyear better-performing
funds. He also shows that if standard deviations are calculated using monthly re-
turns measured from the middle of each month, rather than from the beginning of
each month as in BHS ( 19%), the evidence disappears for raising return standard
deviations as relative performance declines.
Similariy. GNW (2005) replicate BHS's (19%) SDR tests using an expanded
1976 to 2001 sample of monthly fund returns and correct their test significance
levels for cross-correlation in fund returns. They also find no evidence that un-
derperfonning funds raise their standard deviations of returns. Hence, the more
comprehensive studies of Busse (2001 ) and GNW (2005) conclude that the BHS
(1996) finding of tournament behavior is fragile. It does not hold up to more pre-
cise tests and larger samples of mutual fund returns.
As our model of mutual fund tournaments in the next section demonstrates,
under plausible conditions, an optimizing manager chooses to raise the standard
deviation of her fund's tracking error (return in excess of a benchmark) as the
fund's relative performance declines. Such behavior does not necessarily imply
a rise in the fund's standard deviation of returns, beta, or residual risk. Hence,
with the exception of Chevalier and Ellison (1997). prior tests of tournament be-
havior are based on arguably inappropriate risk measures. In particular. Busse's
(2001) and GNW's (2005) rejection of tournament behavior may be unjustified
since their SDR tests, like those of BHS (1996). employ standard deviations of
total returns, rather than tracking error. Reexamining the evidence for tournament
behavior with a focus on mutual funds' tracking errors, rather than their total
returns, motivates our paper's empirical work.
III. Modeling a Mutual Fund Manager's Portfolio Decisions
We now describe our model's specific assumptions. A fund manager's com-
pensation is assumed to depend on tbe fund's performance relative to a benchmark
index. The fund's portfolio can be invested partly in this benchmark index and
partly in a set of "alternative" securities cbosen by its fund manager. These alter-
native securities are defined as the portion of the fund's total assets that accounts
for the difference between the fund's portfolio and one that is invested solely in
the benchmiu-k portfolio. Tbe Appendix shows that when securities' excess re-
turns and return covariances are conslant, the fund manager's optimal choice of
individual alternative securities is one where their relative portfolio proportions
do not vary over time. This implies that tbe manager's intertemporal portfolio
choice problem can be transformed to one of allocating a portion of the fund's
7. Chen and Pennacchi 751
portfoiio to tiie i^enchmarii index and the remaining portion to a single alternative
composite security.' Hence, we simplify the presentation by assuming at the start
that the portfoiio allocation prohiem involves only two types of securities: the
benchmark index and a single alternative security.
Defme 5, as the value of the relevant benchmark index at date / and A, as the
date / value of the alternative securities. Then 5, and A, are assumed to follow the
processes
àS . . .
(I) — = asdt + asdz and
(2) — = aAdt + aAdq>
where tT^rf-fT.Aí/^—tTAsííí-For analytical convenience,CT^.0-5. and (Tasare assumed
to be constants. Here, a^ and as may be time varying, as might be the case if
market interest rates are stochastic.** However, we require that the spread between
their expected rates of return, o^ - as. be constant.
If the fund manager allocates a portfolio proportion of 1 -u; to the benchmark
index and a proportion ui to the alternative securities, then the portfolio's value,
V. follows the process
dV ,, JS dA
(3) y - (l-.^)y.^^
= [( 1 — u;) Qs + U;Û;^] dt + (] — uj) fT
Note that whenever CJ ^ 0, the fund's return in equation (3) deviates from the
benchmark return. We can also calculate the process followed by the fund's rela-
tive performance. Define G, = V¡/S, to be the date t ratio of the value of a share of
the fund's portfolio to that of the benchmark. A simple application of Itô's lemma
shows that
(4) —r = uj(aA- as + o-¡ - ffAs) ät + uj [aAdq - asdz).
Lf
The fund manager is assumed to compete in a tournament for inflows into
the fund. At the start of the tournament's assessment period. G = 1 by definition,
but it then changes stochastically according to equation (4). Thus, G, measures
the date t ratio of the fund's return to that of the benchmark since the start of the
tournament, and hence D, ^ ln(G,) is the difference between the fund's contin-
uously compounded return and that of the benchmark index since the beginning
of the tournament.^ The tournament ends at date 7", which, for example, could be
'This "two-fund separaiion" resull is similar to Merton's ( 1971 ) case of lognormal asset prices.
^The Appendix derives the values of a, and a^ in terms of the p:irameters o!" processes for n
individual altemalive securities.
^We refer to relative performance as the ratio of returns. G,. rather than the difference in returns.
Dr. but this distinction is nonessential. The manager's compensation function could be rewritten in
terms of In (Gf). rather than G,. As will be shown, a manager's optimal portfolio choice is independent
of prior performance when compensation is proportional to a power of G, rather than D,, so the ratio
is a natural variable to use.
8. 752 Journal of Financial and Quantitative Analysis
the last trading day of the calendar year. The manager's compensation is a func-
tion of the fund's relative perfonnance at the end of the tournament, so that his
compensation or "pay" can be written as /'[G7].'"'"
The fund manager maximizes his expected utility of compensation (wealth)
at the end of the tournament by choosing the fund's asset allocation at each point
in time during the assessment period.'^ This maximization problem can be written
as
(5) Max E.{U{PIGT])],
uj{.,) V sç[,,T]
subject to the process followed by G given in equation (4). If we define J{G, t)
as the derived utility of wealth (or performance) function, then assuming that
U{P[GT]) is concave in Gj, the first-order condition of the Bellman equation
with respect to u; implies that the portfolio proportion invested in the alternative
securities is
(0) ÜJ —
where « c = QA - as +CT|- (TAS and (J¿- ^ ffj - 2(T^5 + «rj. Substituting this back
into the Belltnan equation, one obtains an equilibtium partial differential equation
for J that must satisfy the boundary condition J{GT, T) = U(P[GT]). A solution
requires that the manager's utility function and compensation schedule be speci-
fied. We make the standard assumption that utility displays constant relative risk
aversion, U{P[GT]) — {P[GT)'' /-y, where 7 < 1. For the manager's compensation
schedule, we choose a flexible specification that can be either a concave, linear,
or convex function of fund performance:
(7) P[GT] -
where b > 0, c > 0, a > -b/c, and c-y < 1. When 0 < c < I. the manager's
compensation is a concave function of performance. Gr- Compensation is linear
'"In practice, compensation may depend also on the performance of the ovenill equily (mutual
fund) market. Kareeski (:îOO2) shows thai a fund's inflows are highest when the fund performs rela-
tively well and. simultaneously, the overall stock markei performs well. He studies the implications
of ihis pheTH)menon ¡br fund managers' selection of high versus low beta stocks and the equilibrium
etïecls on as.sei prices. Our analysis omils (his market effect.
' The assumption that compensation depends only on ihe fund's performance relallve to a single
index is a simplificaiion for another reasim. In general, a fund's nei inflows, and hence ils manager's
portfolio choices, might depend on the iinal pertonnances of each of the mutual fund's compeiitors.
Oursimplitied siructure can be justified i]i an environment where there arc a large (intiniie) number of
mutual funds that choose dilferenl "altemaiive" securities. Their relative performances over the year
wmild be a smooth, approximately normally distributed function around a mean performance. This
would justify (as we do in our empirical work) using the "average" performance of all mutual funds
as a sufficieni statistic for comparing any given mutual fund's performance.
'•'Our model selling is very similar lo thai of Diitfie and Richardson (1991), who study ihe trading
strategy of a risk-averse hedger. We assume that the manager does noi hedge his compensation risk
via his personal ponfolio. This is a standard assumption, though Grinblatt and Titman (1989) is an
exceplion.
9. Chen and Pennacchi 753
in performance when c = 1, whereas when c > 1 the funcfion is convex.'-* If
a is set equal to 1 and the limit of P is taken as c goes to infinity, the function
becomes exponential, P[Gr] - QxpihGr). While most prior empirical .studies of
tiiutual funds emphasize the convexity of fund flows and compensation to perfor-
mance, the allowance in equation (7) for a nonconvex function may be useful for
modeling money managers in other industries.'*
As will be shown, the sign of the parameter a is critical to a manager's in-
cenfive to shift a fund's risk. In the linear case ofc=,a can be interpreted as the
fixed component of a manager's net compensation or end-of-period wealth. Plau-
sible arguments can be made for a to be positive or negative, depending on the
particular fund manager. For example, if a manager incurs fixed expenses (over-
head) that are not explicitly reimbursed by the fund, then a could be negative.
On the other hand, if P[GT is interpreted as a fund manager's total wealth that
includes personal wealth as well as net compensation, then a may be positive if
personal wealth is substantial. Personal wealth may tend to be greater for more
experienced managers for at least two reasons. First, experienced managers are
more likely to have savings from past compensation. Second, Chevalier and
Ellison (1999) find that tnutual fund managers who are older or have longer
tenures at their funds are less likely to be terminated for underperformance; that
is, they have more job stability. Hence, due to saved past compensation and the
present value of future compensation, one might expect the parameter a to be
greater for more experienced managers.
In general, when c ^ , the parameter a does not translate directly to a
fixed component of wealth or total compensation, but its sign continues to de-
termine whether total compensation has the potential to be nonpositive. Lowering
a (possibly below zero) decreases total compensation, but sensible solutions to
the manager's portfolio choice problem require that a > —h/c. This restriction
provides the manager with a feasible portfolio strategy that guarantees positive
wealth at the end of the tournament. The manager can avoid zero wealth (and infi-
nite marginal utility) by investing solely in the benchmark portfolio for the entire
assessment period, since then compensation equals {a+G-ih/cY = {a+b/cY > 0.
The restriction cf < I ensures that the boundary condition U{P[GT]) —
{P[GT])''/"/ is a concave function of Gj and that an interior solution to the man-
ager's portfolio choice problem exists. This is always the case when 7 < 0, that
is, the manager's risk aversion exceeds that of logarithmic utility. However, if
0 < 7 < 1 and c is sufficiently greater than 1 so that 7c > I, then U(P[GT]) is
convex, and the manager chooses u; to maximize the expected rate of return on
G. From equation (4), this implies setting oj — +00 if ac > 0, and uj — —00 if
do < 0.
'-'The function could be generalized to P{GT] = íi{a + {b¡c)GrY. where d >0. bul this extension
has no effect on portfolio choice, if performance is defined as the difference in, rather than the ratio
of. returns, then compensation is convex (concave) in Dj = ln(G7 ) whenever a + hG-¡ is positive
(negative). Since it will be shown that a+{b/c)GT is always positive in equilibriutii. compensation can
be a convex function of the difference in returns even when 0 < c < 1. Thus, denning performance
as the difference in returns expands the range for which compensation is convex in performance.
'''Empirical evidence in Del Guercio and Tkac (2002) finds a performance-fund flow relation that
appears to be linear for pension fund managers.
10. 754 Journal of Financial and Quantitative Analysis
Assuming 17 < 1, the solution to the Bellman equation is
f8) 7(G,0 ^ ij^^ + ^
whereö = -c-ya};/ [2(1 - f7) (T¿] .Ifequation (8) is substituted into equation (6),
then the manager's optimal proportion invested in the alternative securities is
(I - n l
Note from the restriction a > -b/c that the term ( 1 + (ac/hG) ) is always nonneg-
ative in equilibrium, even when a < 0. To see this, suppose that a is negative and
that G declines sufficiently from its initial value of unity, so that (I -1- {cic/hG))
approaches zero. Then from equation (9). the manager's optimal strategy is to in-
vest fully in the benchmark portfolio. But at this point, with UJ* ^ 0, equation (4)
implies that dG — 0. Wiih no further changes in the relative performance of the
fund, the manager optimally prevents compensation from falling to zero.
Equation (9) shows that the manager chooses a long (short) position in the
alternative securities whenever » G is positive (negative), and the magnitude of
the position is decreasing in risk aversion, - 7 , but increasing in the fixed com-
ponent of compensation. aP Also, the manager's position is independent of the
tournament's time horizon. T - i.'^ For the special case of a = 0, so that cotn-
pensation is proportional to a power of relative performance, PGT = {bCrlcY,
the alternative securities' portfolio weight is constant and invariant to changes in
the fund's performance. However, for the general case of û ^ 0, w* varies with
changes in G. When a > 0. the manager moves closer to the benchmark portfolio
with improvements in fund performance. The reverse occurs when a < 0. For the
special case of a = 1 and c -^ 00, that is. compensation is the exponential form
P[GT] = exp{hGi). equation (9) becomes
(10) u;* - "'^
so that the alternative securities' portfolio weight responds inversely to relative
performance.
We summarize the manager's portfolio behavior with the following
proposition:
'^tf, as discussed earlier, the parameter a tends to be greater for more experienced fund managers.
then equation (9) predicts that more experienced fund managers lend to deviate íTnire from the bench-
mark portfolio, ail else being equal. Chevalier and Ellison's (199*J) empirical resulls confirm this
prediction. They find that older mutual fund managers tend to deviate more from the average portfolio
chosen by other managers having the same investment style.
""That portfolio choice is independent of the investment hori/on is a common feature of standard
ponlolio choice problems such as Merton ( 19711. The solution in equation (9) is analogous to thai of
a standard portfolio choice problem where the alternative securities ponfolio plays the role of a risky
asset portfolio and the benchmark portfolio is the risk-free asset. From this perspective. Qf; and ac,
are the risky asset's excess return and its standard deviation of return, respectively, and ri.sk aversion
is (I - c~))bG I {ac A- hG). Hence, the manager acts as if risk aversion varies wilh performance.
11. Chen and Pennacchi 755
Proposition I. If a fund manager's utility displays constant relative risk aversion
and has compensation given by equation (7), then when 07 < 1 an interior solu-
tion to the portfolio choice problem exists. Moreover,
clad
— —ÜT^
dG
whose sign is opposite to that of the compensation parameter«. When « is positive
(negative), a decline in the fund's relative performance leads the fund manager to
deviate more (less) from the benchmark index.
The case a > 0 provides theoretical justification for Lakonisbok, Shleifer,
and Vishny's (1992) argument that successful managers attempt to lock in gains.
Furthermore, such behavior is likely to increase with the convexity of compen-
sation, since when 7 < 0, one can show that a larger value of c makes portfolio
choice more sensitive to prior perfonnance. In contrast, the a < 0 case leads to
managerial risk-shifting behavior that is opposite to that assumed in recent empir-
ical studies of tournaments. For this case, total compensation is not automatically
bounded at zero, and a manager more closely matches the benchmark as perfor-
mance declines to prevent zero compensation and infinite marginal utility.'^
Proposition 1 has implications for the risk measures chosen by BHS (1996),
Busse (2001), and GNW (2005). These studies test the SDR relation:
(II) -^ >
where íTy denotes the standard deviation of the rate of return on mutual fund
y's portfolio during the ith half of the year. Mutual fund 7 = Í, is a "loser" that
displayed relatively poor performance in the first half of tbe year, while mutual
fund 7 — W in a "winner" that had relatively good performance during the first
half. The implication is that a mutual fund that is a midyear loser should increase
the standard deviation of its return more than that of a fund that was a midyear
winner.
Does our model imply tbe inequality in equation (11)',' Note that tbe pro-
portion invested in the alternative securities that would minimize the standard
deviation of the mutual fund's rate of return given by equation (3) is
'^Proposition I is consistent with Carpenter (2000) and Cuoco and Kaniel (2001). When they
assume that compensation equals a positive componenl plus a cali option written on the portfolio's
relative performance, they lind that a manager increases tracking error as performance declines. This
compares to our ca.se of a > 0. since in both instances the compensation rule is always positive and
portfolio managers need not fear obtaining zero wealth as tracking error risk increa.ses. In contrast.
when Cuoco and Kaniel (2001) assume that compensation also includes [he manager writing a put
option on his performance, the manager reduces his tracking enor as performance declines. Here.
compensation includes a penalty for poor performance and compares to our case with a < 0, since in
hoth instances compensation may be nonpositive.
12. 756 Journal oí Financial and Quantitative Analysis
Written in terms of equation ( 12), the optimal portfolio allocation in equation (9)
becomes
(13) to' = CJ^in-r^ ^ ^('"^n)'
This allows us to state the following proposition:
Pmposuion 2. Suppose C7 < I and a > 0. so that an interior solution exists
in which the manager deviates more from the benchmark index as performance
declines. If
-x > 0 and —^ 1 + -p^ < 1,
^s ~ ^'^^ i'^s ~ ^As)^ ~ o ) hG/
so that ÜJ* and ujmia are of the same sign but u;* is smaller in magnitude than uJmin.
then a decline in G that moves w* farther from zero and closer to Umin reduces the
standard deviation of the mutual fund's return. Otherwise, a decline in G raises
the standard deviation of the fund's return.
Therefore, our model does not necessarily imply the SDR relation equation
(II), and empirical evidence against equation (II) found by Busse (2(X)I) and
GNW (2005) catinot rule out tournament behavior. Propositions 1 and 2 clarify
that worsening performance may, indeed, cause a mutual fund manager to deviate
more from the benchmark portfolio, but this could move the portfolio closer to
one that minimizes standard deviation. Hence, the correct empirical indicator of
risk shifting should be the standard deviation of a fund portfolio's return relative
to the benchtnark's return (tracking error), not the portfolio's total return stan-
dard deviation.'** Indeed, perhaps the most publicized "gamble" by a mutual fund
tiianager was one that increased tracking errors, but reduced total return standard
deviation. In late 1995, Jeffrey Vinik shifted the portfolio of Fidelity's Magellan
Fund out of technology stocks and into allocations of 19% bonds and 10% cash.
With the subsequent stock market rally, the bet turned sour, leading to Robert
Stansky's replacing Vinik as the fund's portfolio manager.
We can characterize the model's prediction for the time .series of a mutual
fund's tracking error, which will be a basis for our empirical tests. Let R,+ [ ~
In(V,+i/V,) be an individual mutual fund's rate of return from the beginning of
month t to the start of month / + 1, and let Rs.!+¡ ^ ln(5,+ i /5,) be the benchmark
portfolio's rate of return from the beginning of month / to the start of month
t + I. Since G, - V,/S„ note that R,^i - Rs.,^ = ln(V;+,/V,) - ln(S,+i/5,) =
"*Koski and Pontiff's (199')) tests calculate alleniative rhV. nioa.'iures equal to the fund return's
total standard deviation, ils beia. and its residual (idiosyncratic) risk. None of these measures are
equal to the standard deviaiion of a fund's return in excess of a benchmark return (tracking error),
even if the benchmark is assumed to be the market portfolio from which a fund's beta is calculated.
For example, if a > 0 so thai a fund manager increases tracking error risk as perfonnance declines,
then it can be .shown that the fund's beta deviates more from unity as performance declines. That is,
dßv - II/OG = ßfl - I diu/dG < 0 for a > 0, where ßv and ß^ are the betas of the fund's
portfolio and the alternative asset portfolio, respectively. However, the fund's beta or residual risk
need not necessarily increase or decrease following poor performance. A derivation of this result is
available from the authors.
13. Chen and Pennacchi 757
ln(G,+i/G,) A; dn{Gi) = dD,.'^ The Appendix shows that tracking error, R,+i —
^5^,4.], satisfies
( C
G,
1
^1
where the standard deviation of tracking error equals
A A
(15) y/h, =
and rit^i ~ N{0, 1), ßa ^ OIG/<^G^ ào = acaa/[b{ -n)aG]. and i/| =
I"GI / [(' ~ ^-7) <^c]- The intuition in equation (15) is that the standard deviation
of tracking error, ^/JT,, is inversely related to prior performance when do > 0,
whieh, as shown in Proposition 1, occurs when cy < 1 and a > 0.
IV. Empirical Methodology
This section outlines two empirical methods that we use to examine a mutual
fund's performance and its choice of risk. The first is a nonparametric test that
modifies the SDR tests used in prior studies. The second is a parametric test that
nests our theoretical model.
A. Standard Deviation Ratio Tests
We first replicate prior studies' test of the SDR given in equation (11). As
emphasized in the preceding section, this hypothesis is not one that is predicted
by our model. However, we then test a different SDR hypothesis that is closer in
spirit to our model because it is based on the standard deviation of tracking errors
rather than the standard deviation of total returns:
(16) ^ ^ > ^ ^ ,
where CTC.JJ denotes the standard deviation of the rate of return on mutual fund
/ s portfolio in excess of its benchmark rate of return (tracking error) during the
/th half of the year. Mutual fund / — L is a "loser" that displayed relatively poor
performance in the first half of the year, while mutual fund j — W s a "winner"
that had relatively good perfonnance during the first half.
B. Parametric Tests
We propose a new time-series estimation method that permits a fund's risk to
respond to calendar-year performance at each (monthly) observation date, rather
than just once per year. Allowing frequent changes in the fund's risk is arguably
'^Notc that since tournaments are assumed to ocetir each calendar year. G, is reset to ! at the
beginning of January each year, even though we use multiple years of fund returns to estimate these
pr(x:es!ves. Thus. G, always equals the return on n share of the fund relative to that of ihe benchmark
portfoliu since ihe start of the calendar year.
14. 758 Journal of Financial and Quantitative Analysis
more logical, since our model predicts that an optimizing manager continuously
adjusts the fund's risk as its relative perfonnance changes. Another benefit of our
approach is that it allows the estimation of risk-shifting behavior for each indi-
vidual mutual fund, enabling us to examine whether risk shifting appears stronger
lor particular types of funds.
As with the SDR tests, our parametric te.sts examine the hypothesis of prior
studies that a fund's standard deviation of total returns should vary inversely with
its relative prior performance.^" More importantly, we also test our model's pre-
diction that a fund's standard deviation of tracking error varies inversely with its
relative prior performance. In both cases, the parametric forms that we estimate
permit a mutual fund's returns to display generalized autoregressive conditional
heteroskedasticity (GARCH). Prior research has shown that the returns on indi-
vidual stocks and stock indices reflect GARCH-like behavior, so that a time series
of equity mutual fund returns is likely to exhibit this property.^'
We estimate our model's predicted process in equation (14) but modify equa-
tion (15) to allow tracking error variance, /i,, to change stochastically due to fac-
tors in addition to prior performance. This is done by generalizing h¡ to follow an
exponential GARCH (EGARCH) process first introduced by Nelson ( 1991):
(17)
This log variance process allows for persistence by including the lagged variable
ln(/i,_ i). The variable in(/i,) is also influenced by the prior period's absolute inno-
vation, |7/,|. The.se two variables are standard in EGARCH models. What is unique
in equation (17) and critical for examining the effect of prior performance on a
mutual fund manager's choice of risk is the variable G^ ' / /hi~. As with a pos-
itive value of ¿yo in equation (15), a positive value of «i in equation (17) supports
the hypothesis that a fund manager increases tracking error volatility as the mu-
tual fund's performance declines. A key advantage of this EGARCH specification
versus equation (15) or a standard GARCH form is that the parameter, aj, can
be of either sign without creating the possibility that /i, could become negative.
The rationale for the functional form G,~ ' / yjh,- is that it leads to an effect of
•^°A test of this hypothesis may be of independent interest. While mosl research assumes ihat
changes in a fund's risk are due to managerial incenlives, Ferson and Wanher (1996) offer another
explanation of why a fund's standard deviation could be inversely related to its prior performance.
If better-performing funds receive greater ca.sh inflows, then a funü"s reium standard deviation will
decrease until its new (riskless) cash is fully invested in equities or until the fund increases its ex-
posure by purchasing equity derivatives. Because transactions costs are mitigated by graduai, rather
than immediate, purchase of stocks, and some mutual funds are restricted from holding derivatives,
the standard deviaiion of a fund's returns may decline temporarily following a cash inflow. KoskJ and
Pontiff ( 1999) find evidence consistent with this explanation, since funds that hedge with derivatives
display less risk shifting.
-'For example, see French. Schwert, and Stambaugh (1987), who fit different GARCH models to
the Standard & Poor's 500 stock index.
15. Chen and Pennacchi 759
performance on tracking error volatility that locally approximates equation (15)
where í32 w 2do}^
The alternative hypothesis assumed by prior studies, that a fund's prior per-
formance predicts its future standard deviation of total returns, is tested in a simi-
lar manner. It is assumed that a mutual fund's total returns, rather than its returns
in excess of a benchmark return, satisfy
(18) /?f+i = ßy/ii, - -It, + v^T/,4.1,
where A, is assumed to follow an EG ARCH process as in equation (17). However,
here we see that h¡ is the mutual fund's total return variance, not its tracking error
variance. A positive value of «2 from joint estimation of equations (17) and (18)
would indicate that a mutual fund manager increases the standard deviation of the
fund's total return when its performance declines.
V. Data Description
Information on monthly mutual fund returns and fund characteristics comes
from the Center for Reseiu-ch in Security Prices (CRSP) Survivor-Bias-Free U.S.
Mutual Fund Database. The sample covers mutual funds that operated during the
period from January 1962 to March 2006. We selected domestic equity funds
whose investment style could he broadly classified as either "growth" or "growth
and income."^^ To have sufficient observations for estimating the parameters of
each mutual fund's time-series processes in equations (14), (17). and (18). we
required that a mutual fund report at least 36 consecutive monthly returns. The
final .sample consists of 4,188 growth (G) funds, 861 growth and income (GI)
funds, and 1.129 "style-mixed" (SM) funds, this last category being funds whose
reported investment style was either growth or growth and income during only
part of their life. Each of these three fund groups was given a different benchmark
return, Rs,i+ ^ ]n{S,+/Si), equal to the equally weighted average return on all
funds within the group that operated during month ir'* By benchmarking a fund
relative to others in its broad style classification, we avoid attributing style-related
that our theory of
+e¡ implies —f = -2Í/ÜC,
OU/
Taking the derivative of equation ( 15) with respect to G, leads to
dh, G~ ~ h,
dG, VV^
Therefore, the parameter oj ^ Id» and will be positive when c7 < I and « > 0.
-^Mutual funds with a Wiesenberger or Investment Company Data. Inc. (ICDI) objective of "Ag-
gressive Growth." "Growth." "Maximum Capital Gains." "Small Capitalization Growth," or "Long
Term Growth." are classitied as growth funds. Mutual funds with an objective of "Growth and Income"
or "Growth wiih Current Income" are classified as growth and income funds. Index funds are excluded.
^This assumption implies thai ftmd managers within a group can identify their benchmark as
the "average" of the security holdings of the funds in their same group. Given that there are a large
number of mutual funds in each group, this average of security holdings is likely to be close to ihe
holdings of a style-class index. For example, managers of G funds may identity their benchmark
as approximately the Russell 3000 Growth Index while managers of GI ftinds may identify their
benchmark as approximately the S&P 500 index.
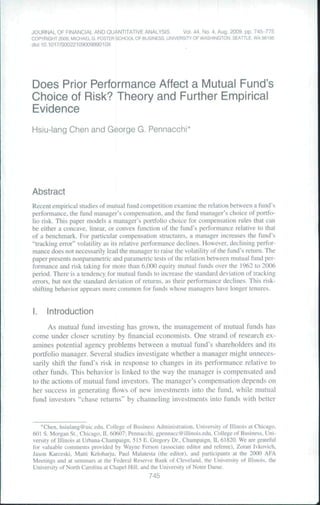
16. 760 Journal of Financial and Quantitative Analysis
differences to performance differences as would occur if the same bencbmark
were used for all funds.-"^
Figure I sbows the sample's number of G, Gl, and SM mutual funds in oper-
ation during each month of our sample period. G funds operating during the past
decade account for a majority of our sample observations. The number of funds
FIGURE 1
Mutual Fund Sample Population
Graph A. Growth Funds
3600
3200
o ) i T ) c > o > 0 > o i O ï o > o a ) O ) < T ] d ï m C î C f i A a > o s o ï O )
Year
Graph B Qrowth & Income and Slyle-Mixed Funds
900
700 - ->-
600-
500-
200-
100 ,-,-,-,=n>
03 Oï 05
Year
Growth & Income Style-Mixed
-''However, in our notiparamelric tesis, we do examitie ihe case of funds' performances relative to
the universe of all firms, so thai [he benchmark is effectively the same for all funds.
17. Chen and Pennacchi 761
grew rapidly over the 1990s and peaked approximately three years prior to the
sample period's end, since no new funds were added during the last 36 months.
This reflects the parameter estimation constraint that a fund report al least three
years of returns. The proportions of all G, GI, and SM sample funds that survived
(were in operation) as of March 2006 are 67%. 65%. and 62%. respectively.
Table 1 presents summary statistics of our mutual fund sample, broken down
by fund style. Age is defined as the number of years from the fund's inception
date until the date it expired or. for surviving funds, the end-of-sample date of
March 2006. Row 1 shows that G and GI funds have, on average, similar ages of
approximately 9.9 years, whereas SM funds, whose definition is conditioned on a
style change having occurred, are much older. On average, G funds have greater
front loads, expense ratios, and turnover ratios than do GI funds. Manager tenure
is the average number of years that the same individual or group manages a fund's
portfolio. Average manager tenure is similar for G and GI funds, but somewhat
greater for SM funds.
Table 1 also reports statistics on funds' asset size scores, which measure
their relative sizes by assigning a rank score from 0 (smallest) to 1 (largest) for
each fund according to its total net asset value at the end of each year. This score is
then averaged over each year of the fund's life. The average SM fund is larger than
typical GI and G funds, likely a reflection of the greater average age of SM funds.
However, on average SM funds display slower but less volatile asset growth, while
GI funds grow slightly faster than G funds.
The final information in Table 1 relates to a fund's number of share clas.ses
and the number of funds in its fund family. These numbers are computed eacb
year and then averaged over all years of a fund's life. SM funds tend to have
fewer share classes and belong to smaller fund families compared to G and GI
funds.
VI, Results
A. Standard Deviation Ratio Test Results
Following prior studies. SDR tests are performed using an annual 2 x 2 clas-
sification of whether a fund's return performance over the first six months (RTN)
was above (winner) or below (loser) the median and whether its SDR computed
over the second versus first halves of the year was above or below the median,
where these medians are for all funds in its style class (G. GI. or SM). First, we
replicate the tests performed by past research by calculating SDR as in equation
(11), equal to the ratio of second to first half-year standard deviations of a fund's
total returns. A finding that the frequency of funds in the category (low RTN, high
SDR) significantly exceeds 25% would be evidence in favor of the hypothesis that
underperforming funds increase their total return standard deviation. Second, we
calculate SDR as in equation (16). equal to the ratio of .second to first half-year
standard deviations of a fund's returns in excess of benchmark returns (tracking
error).
The statistical significance of our SDR tests is determined by the method
of Busse ((2001). pp. 58, 62-63). His method controls for the auto- and
18. 762 Journal of Financial and Quantitative Analysis
TABLE 1
Summary Statistics of Mutual Fund Sample
statistics are based on a sample taken ttom thG CRSP Survivor-Bias-Free U.S. Mutual Fund Database covering Ihe period
January 1962 lo March 2006 Mutual funds witfi a Wiesentierger or Inveslment Company Data, Inc. (ICDI) objective o(
"AggiessivB Growth." "Growth," "Maximum Capiial Gains." "Small Capdaljzation Growth,' or "Long Term Growth," are
classilied as growth funds. Mutual tunds with an ob|eclive of "Growth and Income" Of "Growth with Curren! Income" are
Classified as growth and income funds. Style-mixed funds are mulual funds with a style of growth or growth and income
for only part of their lives Index funds as well as funds with less than 36 consecutive monthly returns are excluded. The
sample contains 4.188 growth funds. 861 growth and income funds, and 1,129 style-mixed funds. Age is defined as the
number ot years from the fund's inception date until the date it expired or. lor surviving funds, the end-of-sample date
of March 2006. A fund's fees and turnover ratios are calculated as the average annual numbers. Managef tenure is the
average number of years that an individual manages a fund's portfolio A fund's asset size score is computed by assigning
a rank score from 0 (smallest) to 1 (largest) for each fund according to its lotal net asset value at the end of each year. This
score IS then averaged over each year ol the tund s life A fund's asset growth equals the average annual log cfiange in
total net assets, and (T of a fund's asset growth rates is the time-series standard deviation of annual log changes In total
net assets. The number of share classes records for each year the number of funds that have the same fund name but
different share classes. Fund family size equals the number of mutual funds that have an identical management oompany
name in each year Both fund family size and numbers ol fund share classes are then averaged over each year of a fund's
life.
Fund No, Of Std.
Chaiacietistic Funds Meen Dev. Min. 25% 50% 75% Max.
Panel A. Growth Mulual Funds
Age (years) 4,188 9.92 6.89 3 6 8 11 74
Front load 4,186 0.014 0.023 0000 0.000 0.000 0.020 0.087
Back toad 4,188 0.011 0.017 0.000 0.000 0,003 0,010 0.060
Expense ratio 4,188 0.016 0.007 0.000 0.011 0.015 0.020 0.167
Turnover ratio 4,145 1.154 2.396 0.000 0.515 0.858 1.363 130.104
Manager tenure (years) 4,011 6.39 3.30 1.00 4.00 6.00 7 75 48.00
Asset size score 4,185 0.41 0.24 0.00 0.21 0.40 0.59 0.97
Asset growth (%) 4,176 32.50 47 00 -277.80 7.39 26.25 50.98 452.18
(T of asset growth (%) 4,138 71.88 56.16 0.22 35.58 56.09 89.69 565.11
Number of share classes 4.188 2.78 139 1 1 3 4 9
Fund family size 4,022 146.74 128.90 1 42 117 224 667
PaneJ S Growth and Income Mulual Ft/nds
Age (years) 861 9.94 9.03 3 6 e 11 82
Front load 861 0.011 0.021 0.000 0.000 0.000 O.0O7 0.085
Backktad 861 0.011 0.017 0.000 0000 0.OO2 0.010 0.060
Expense ratio 860 0.014 0.006 0.000 0.009 0.013 0.019 0.035
Turnover ratio 857 0,703 0.508 0.018 0.387 0.611 0.880 5.956
Manager tenure (years) 847 6.31 3 10 2.00 4.33 6.00 7.50 41 00
Asset size score 861 0.42 0.26 0.00 0.21 0.41 0.62 0.99
Asset growth (%) 858 34.35 45.68 -139.95 6.19 27.13 50.62 283.49
(T of asset growth (%) 850 69 95 58.89 0.58 31.93 53.06 85.51 513.00
Number of share classes 861 2.94 1.51 1 2 3 4 9
Fund family size 848 143 11 113.96 1 47 120 212 626
Panel C. Style-Mixed Mutual Funds
Age (years) 1.129 16.29 14.50 4 9 13 21 83
Front load 1.129 0.021 0.026 0.000 0000 0.000 0.045 0.085
Back load 1.129 0.007 0.014 0.000 0.000 0.001 0.006 0.050
Expense ratio 1,129 0.014 0.008 0.000 0.009 0.013 0017 0.119
Turnover ratio 1,122 0.905 2.030 0.000 0.413 0.674 1.034 60.996
Manager tenure (years) 1,036 7.85 4.82 200 4,50 6.50 9.00 41.00
Asset size score 1,129 0 49 0.24 0 02 0.30 0.50 0.68 0.98
Asset gfowlh (%) 1,128 21.99 30.98 -174.47 5.42 16,98 34.10 183.41
< of asset growth (%)
T 1,126 59.39 43.06 5,32 31.82 48.97 70.52 338.83
Number of share olasses 1,129 1,93 1.24 1 1 1 3 6
Fund family size 1,045 133.34 123.20 1 32 105 199 626
Panel D. All Mulual Funds
Age (yeafs) 6,178 11.45 9.61 3 6 9 12 B3
Front load 6,178 0.015 0.023 0.000 O.OOO 0.000 0.030 0.087
Back bad 6,178 0.010 0.017 0.000 0.000 0,002 0.010 0.060
Expense ratio 6,177 0.015 0.007 0.000 0.010 0.014 0.019 0-167
Turnover ratio 6,124 1.045 2 169 0.000 0,469 0.771 1.23B 130 104
Manager tenure (years) 5,894 6.63 3.63 1.00 4.33 6.00 8.00 48.00
Asset size score 6,175 0.43 0.24 0.00 0.22 0,42 0.62 0.99
Asset growth {%) 6,162 30 83 44.50 -277.80 7.02 23 87 47.46 452 18
a of asset grovrth (%) 6,114 69.31 54.59 0.22 34.35 54.14 65,99 565,11
Number ol share olasses 6,178 265 1.42 t 1 3 4 9
Fund family size 5,915 143.85 125.94 1 41 115 216 667
19. Chen and Pennacchi 763
cross-correlation of fund returns that he and GNW (2005) document.^^ It involves
simulating fund returns from a Fama-French-Carhart four-factor model for each
year and style class to obtain an empirical distribution for the 2 x 2 classifica-
tions. Specifically, for each of the 44 years in our sample, we take the Ny funds of
a particular style class that operated in year y and regress each of their 12 monthly
returns on market, size, book-to-market, and momentum factors. The four factors
and regression residuals are arranged into two matrices: a 12 x 4 matrix of the
four factors for each month; and a 12 x Ay matrix of the monthly residuals for
^
each fund. To simulate factors, we randomly select a row from the factor matrix
and use the following 11 rows in order, continuing with row one of the factor ma-
trix after row 12. To simulate residuals, we resample randomly with replacement
12 rows from the residual matrix. We then create simulated monthly returns for
A'y artificial funds using the betas and intercepts from the Ny regressions with the
simulated factors and simulated residuals.'^^
We compute RTN and SDR (based on either total returns or tracking error)
for each artificial fund and allot funds to cells in 2 x 2 contingency tables based on
the median fund RTN and the median fund SDR. This procedure is repeated for
each year during a particular test sample period (e.g., the entire 1962-2005 sample
or the 1995-2005 subsample) to obtain a single simulation. The entire procedure
is then repeated 10,000 times to generate an empirical distribution of monthly 2x2
contingency table allotments under the null hypothesis of no tournament behavior.
The 10%. 5%, and 1% tails of this empirical distribution provide the significance
levels for our SDR tests. Entries in Table 2 are marked by asterisks *. **. and ***
when results exceed these respective significance levels in the predicted direction
(low RTN, high SDR significantly greater than 25%) and by daggers ^ ^ ^^^
when results are significantly opposite (low RTN. high SDR significantly less
than 25%).
Panel A of Table 2 reports SDR test results when SDR is based on the stan-
dard deviation of total returns as in equation (11), Tests are performed by style
class for the entire sample period, 1962-2005, and for four 11-year subsample
periods. In addition to these separate tests by fund style, we performed tests by
aggregating funds across the style classes. This aggregation was done in two ways:
The first "style ranked" (SR) method aggregates funds based their separate style
class categorizations. For example, if a fund was categorized as (low RTN, high
SDR) based on its particular style class ranking, it remained a (low RTN. high
SDR) observation when funds were aggregated across styles to compute aggregate
2 x 2 frequencies. The second "universe ranked" (UR) method aggregates funds
of all styles prior to calculating RTN and SDR rankings. Hence, this method es-
sentially assumes a tournament where each G, GI. and SM fund competes against
all others irrespective of stated style. This aggregation method is consistent with
-*'The chi-square tesi of significance used by BHS (1996) is valid only under the assumption that
mutual fund returns are serially and cross-sectionally independent.
method preserves cross-correlation in the tactor returns and the fund return residuals, as
well as most of the autocorrelation in the factors. However, using constant factor loadings throughout
the year and resampling Ihe factor retums and fund return residuals removes any relationship between
a fund's prior perlbrmance and risk.
20. 764 Journal of Financial and Quantitative Analysis
the tests performed in Busse (2001 ) and GNW (2005), which assume that G, GI,
and SM funds are a single style.
It is clear from Table 2 that there is no evidenee of underperforming funds
raising the standard deviation of their total returns in the second half of the year.
The only statistically significant results occur for the 1995-2005 period and for
the entire 1962-2005 sample period- But these results are exactly opposite to
the findings of BHS (1996): Funds that underpertbrmed in the first half of the
year tended to reduce the standard deviations of their fund returns in the second
TABLE 2
Standard Deviation Ratio Tests of Risk-Taking Behavior
Cell frequencies are reported tor a 2 x 2 classification based on a fund's, i) standard deviation ratio (SDR), and ii| relum
performance for the lirst six months of each year (RTN). Funds are divided annually into four groups based on whether
i) RTN is below (low of "loser") or above (high or "winner") the median, and ii) SDR is above (high) or below (low) the median.
In Panel A, risk is defined by the total return standard deviation In Panel B, risk is defined by the standard deviation of
tracking error, using as a benchmark the equaiiy weighted return of funds with the same style. Results aggregated across
styles are reported m two ways. "All SR" aggregates funds using the previous styie-ranked categonzations ot RTN and
SDR: and "All UR" aggregates funds using a uni verse-ranked categorizaiion of RTN and SDR. ', " , and * " indicate 10%,
5%, and 1% two-tailed p-values, respectively, when the frequency of iosers with high SDR is significant in the predicted
direction. '', ''*, and " ^ indicate similar signilioance levels for the nonpredicted direction. Significance is calculated for
Busses ((2001), pp 62-63) cross-and au to-corr el at ron adjusted test (symbols following low RTN and fiigh SDR entries).
Panel A SDR Defined by Ihe Standard Deviation of Tolal Returns
Sample Frequency
(% of obs.)
Low RTN High RTN
("iosers*) ("winners")
Low High Low High
Type of Funds Obs SDR SDR SDR SDR
Samp/e Period. 1962-1972
Growth 1,062 22.88 26.93 26.93 23.26
Growth-Income 221 20.36 28 51 28.51 22.62
Slyle-Miïed 1,226 22.68 27.00 27.00 23.33
AllSFI 2.509 22.56 27,10 27.10 23.24
AilUR 2,609 22.76 27.10 27.10 23.04
Sample Petioa. W73-I983
Growth 1,800 26.11 23.72 23.72 26.44
Growth-Income 282 27.30 21.63 21.63 29.43
Styte-Mixed 1,893 26.04 23.77 23.77 26.41
AilSR 3,975 26.16 23.60 23.60 26.64
AHUR 3,975 27.22 22.74 22.74 27.30
Sample Period: !984-l994
Grovith 4,659 24.10 25.80 25.80 24.30
Growth-Income 812 23.89 25 74 25.74 24.63
Style-Mixed 5,317 25.18 24.77 24,77 25.28
AIISR 10,788 24.62 25 29 25.29 24 81
AMUR 10,78B 24.34 25 63 25.63 24.40
Sample Period: 199&-2005
Growth 27,341 27.93 22.06"' 22.06 27.95
Growth-Income 5,633 27.« 22.51 ^ 22.51 27.55
Style-MiKeb 8,556 27.57 22.39''^ 22.39 27.64
AIISH 41,530 27 76 22.19tt' 22.19 27.83
AIIUR 41,530 28.33 21.66ttt 21.66 28.35
Sample Period: 1962-2005
Growth 34,862 27.17 22 8 0 ^ ' ' 22.B0 27.24
Growth-Income 6,948 26.78 23.0Í 23.04 27.13
Styie-Mixed 16,992 26.30 23.62 f 23.62 26.45
AIISR 58,802 26.87 23 0 6 ^ " 23.06 27.00
AHUR 58.602 27.29 22.69^ 22.69 27.32
(continued on next page)
21. Chen and Pennacchi 765
TABLE 2 (continued)
Standard Deviation Ratio Tests of Risk-Taking Behavior
Panel B. SDR Defined by the Standard Deviation of Returns in Excess of Benchmark (trackinq error)
Sample Frequency
1 % o1 obs.)
(•
Low RTN High RTN
("losers") ("winners")
Low High Low High
Type of Funds Obs. SOR SDR SDR SDR
Sarriple Perioa: 1962-1972
Growth 1,062 24.20 25.61 25.61 24.58
Growth-Income 221 20.81 28.05" 28,05 23.08
Siyie-Mixed 1,226 24.23 25.45 25.45 24.88
AIISR 2,509 23.91 25.75 25.75 24.59
AHUR 2,509 24.11 25.75 25.75 24,39
Sample Period: 1973-1983
Grow! h 1,800 23.72 26.11" 26.11 24.06
Growth-Income 292 25.89 23.05 23.05 28.01
Slyle-MiJted 1.893 23.45 26.36- 26,36 23.82
AIISR 3,975 23.75 26.01 — 26 01 24.23
AMUR 3,975 23 60 26.36'" 26,36 23.67
Sample Period: 1984-1994
Growth 4.659 23.76 26.14* 26 14 23.95
Growth-Income 812 23.03 26,60 26,60 23.77
Style-Mixed 5,317 24.58 25.37 25,37 24.68
AIISR 10,786 24 11 25.80 25,80 24.30
AHUR 10.788 24 07 25.90 25,90 24.13
Sample Penotí- 1995-2005
Growth 27,341 24.15 25.84— 25.84 2A 17
Growth-Income 5,633 24.69 25.24 25.24 24.Ô2
Siyle-Mixed a,556 24.08 25.89 25.89 24.15
AIISR 41,530 24.21 25.77" 25.77 24.25
AIIUR 41,530 24.22 25.77- 25,77 24.24
Sample Period: I962'2œ5
Growth 34,862 24,07 25.89-" 25.B9 24.15
G towlh-Income 6.948 24,42 25.40 25.40 24.77
Style-Mixed 16.992 24,18 25.75 25.75 24.33
AIISR 58.802 24 15 25.79-" 25.79 24.27
AHUR 58.802 2d,15 25.83— 25.63 24.18
half.-** Our results confirm those of Busse (2001 ) and GNW (2005). who also find
evidence contrary to BHS (1996).
Panel B of Table 2 reports SDR test results when the SDR is based on the
standard deviation of tracking errors as in equation (16). Recall that according to
our theory, this type of SDR is the appropriate statistic for testing tournament be-
havior. Indeed, we now see that there is substantial evidence that underperforming
funds raise the standard deviations of their tracking errors. This behavior is sta-
tistically significant over the entire 1962-2005 sample period for G funds and for
the aggregation of funds of all styles using either SR or UR rankings. Evidence
of our theory's tournament behavior appears for at least some fund styles during
'**NoteUial BHS's (1996) SDR lesls used Morningstar dala on the returns of G mutual funds from
1980 lo 1991. When we perfurm SDR lests using our CRSP Jala on the returns of G funds over
the exact .siime period. 1980 lo 1991. we match their Undings. Namely, underperforming G funds raise
their standard deviations of returns, and this result is slatistically signilicani at the 5'íí' level, even when
adjusted for correlation in fund returns. As .shown in Panel A of Table 2. the fact that this significance
disappears when different periods of I973-I9S3 or 1984-1994 are tised underscores the fragility of
the BHS (1996) findings.
22. 766 Journal of Financial and Quantitative Analysis
each of the four subsamples. There is tio contrary evidence of the sort found in
Panel A. Measuring risk appropriately as tracking error volatility, rather than total
return volatility, appears to make a big difference for tests of tournament behavior.
While the results are not tabulated, we followed BHS {1996) by performing
SDR tests with samples split by fund age and fund size.^^ Similar to Panel A of
Table 2, underperforming funds, both new and old. in addition to small and large,
did not raise the standard deviations of their total returns. The only statistically
significant results were always in the opposite direction of finding that losing
funds decrease their total return standard deviations. However, like Panel B of
Table 2. there was evidence that underperforming funds, both new and old, in
addition to small and large, raised the standard deviations of their tracking errors
as our theory predicts. Evidence for this behavior was strongest for older and
larger funds.
In summary, these SDR tests provide no evidence for the traditional hypoth-
esis that underperformance leads to an increase in the standard deviation of fund
returns. In contrast, there is substantially more evidence from SDR tests of an
inverse relationship between pertbrmance and the standard deviation of tracking
errors.
B. Parametric Test Results
The previous section's SDR tests are crude in the sense that they allow a
fund's risk to change only once per year and that they require a cross-sectional
grouping of funds that implicitly assumes these funds engage in similar behavior.
We now perform parametric tests for each individual mutual fund that exploits
the time-series properties of its returns. These tests permit a fund's risk to change
at each observation date and allow risk-taking behavior to differ across funds.
Maximum likelihood estimation of the EGARCH equation ( 17), along with either
the total returns equation ( 18) or the tracking error equation ( 14), was carried out
for the 4,t88 G funds, 861 G! funds, and 1,129 SM funds that had at least 36
monthly observations over the period from January 1962 to March 2006.^*''-^'
Table 3 reports summary statistics of the estimates of funds' total return pro-
cesses, equations (17) and (18). Recall that this process is not implied by our
theoretical model because here, /h¡ represents the standard deviation of a fund's
(old} funds were classified as having been in exisleiice for less (greater) than seven years.
Small (large) funds were classified as being below (ahove) the median in asset size.
-"'We obtained convergence of the likelihood function for greater ihar 99.R% (99.9%) of the fund.^
when estimating the total returns (tracking error) processes. For the few cases where we could nol
obtain convergence, the processes were estimated with the GARCH mean reversion coefficient a
constrained to equal the median estimate obtained from the other funds for which it was possible to
find unconstrained e.stimates. These median values are reported in Tables 3 and 4.
" A s a robustness check, we also estimated each fund's total return process (18) and tracking error
process ( 14) under the assumption that their means were constants. Specihcally. the equations
were estimated, where co and IT, are constant intercept terms. This parametric change had ver>' little
effect on the estimates of the other parameters and did not alter the qualitative results that we report
below. Results of this alternative specification are available from the authors.
23. Chen and Pennacchi 767
total returns and is permitted to vary with performance, G,. The first five columns
of Table 3 give the minimum, first quartile, median, third quartile, and maxinium
for each parameter's point estimates for the sample of individual funds. Column 6
reports the proportion of estimates that is strictly greater than zero. Columns 7
and 8 give the proportions of estimates that are significantly positive and nega-
tive, respectively, at the 5% confidence level.
TABLE 3
Parameter Estimates for Mutual Funds' Return Processes
fulaximum likelihood estimates are for the monthly return processes of 4,188 growth, 861 growth-income, and 1,129 style-
mined mutual funds hawing at least 36 mcnthly return observations during the January 1962 to fvlarch 2006 sample period.
The benchmark returns are the equally weighted returns of all (unds. including funds not having at least 36 observations,
within each investment style category, Likefihood function convergence allowed us to obtain estimates of ail parameters for
4,168 growth, 838 growth-income, and 1,129 style-mixed mutual funds. The value of a^ for the remaining growth-income
funds was fixed tc the median estimate of the converged growth-income funds, and constrained maximum likelihood
estimates of these remaining tunds' other parameters were obtained.
r- ^ r-
= a o •r 3] ln(/7[_ 1 )
Distribution of Parameler Estimates Summary Statistics
Quartiies Proportion of
Min. 25% 50% 75% Max, Est > 0 Í > 1.96 f < -1.96
Panel A, Growth Mutual Funds
1' -31,6042 0,0026 0.1313 0.2515 26.5735 0.755 0,288 0.043
äQ ^0.5662 -11,9096 -3.6764 -0.2916 66.6288 0,225 0,074 0.320
3 -5,0833 -1,4663 0.0349 0.9642 5,1631 0,509 0.261 0,199
32 -1,2514 -0 1477 -O.0545 0.0244 6,3555 0.321 0,125 0.245
33 -287.5825 -0,1093 0.1068 0.3474 9.1991 0.631 0.230 0,093
Panel B Growth-Income Mutual Fundí
M -4,6868 0.0697 0.2089 0.3221 33.2046 0.849 0.469 0,020
ao -344.1056 -12.5432 -2,7508 0.4794 18.9702 0.271 0,102 0.308
^1 -379.9965 -1,6006 0.5618 1,3336 6.0008 0,570 0.350 0.189
«2 -80,9025 -0.1239 -0.0183 0.0948 0.6012 0.383 0,189 0.185
03 -157,3799 -0,0149 0,1808 0.3521 4.5886 0,727 0.305 0,102
Panel C Style-MixecJ Mutual Funds
f -1.7164 0 0717 0.2214 0.3059 30,6832 0,817 0,563 0.043
ao -36,0890 -10,8326 -2.3014 -0,3614 15.7107 0,214 0.099 0.336
ai -5,5808 -0,8069 0.6350 1,0442 5.0644 0,620 0.425 0.154
az -0,9953 -0,0737 -0,0119 0,0351 0 5067 0.392 0.173 0.202
as -7,6088 0,0071 0,1763 0,3364 3.5623 0,758 0.395 0.081
Pane; D, All Mutual Funds
-31.6042 0.0189 0,1598 0 2740 33,2046 0.779 0,364 0,040
ao -344.1056 -11.5747 -3,3073 -0.2627 66.6288 0.229 0 083 0,321
ai -379.9965 -1.2882 0,2227 1.0086 6.0008 0.538 0,304 0.189
33 -80.9025 -0,1294 -O.0350 0,0319 6,3555 0,343 0.U2 0.229
33 -287,5825 -0 0743 0 1371 0,3471 9.1991 0668 0.271 0.092
A positive value for the parameter ui would support the hypothesis that a
fund increases its standard deviation of returns as its performance declines. How-
ever, the second-to-last row of Table 3 shows that only 34.3% of all mutual funds
have a positive estimate for aj and that the median estimate. -0.0350, is negative.
Some 14.2% of all funds have a significantly positive estimate of ÍÍ2, but 22.9%
have a significantly negative estimate. Hence, more funds appear to lower, rather
than raise, the standard deviations of their returns as their performance declines.
24. 768 Journal of Financia! and Quantitative Analysis
GI funds are the only .style class that have marginally more estimates of Ü2 that
are significantly positive than are significantly negative (18,9% vs. 18,5%). How-
ever, the general results of this estimation exercise are consistent with the previous
SDR tests in finding relatively few funds that raise the volatility of their returns
when their performance is poor.
Table 4 presents summary statistics of the estimates of funds' tracking error
processes, equations (14) and (17), In this case, sfh, equals the standard devia-
tion of a fund's return in excess of its style benchmark return (tracking error), A
fund having a positive ai increases its standard deviation of tracking error as its
performance declines, which is the type of tournament behavior that is consistent
with our theory. As shown in the second-to-last row of Table 4, there are relatively
more funds with a significantly positive value of «2 than a significantly negative
one (16,8% vs. 12,6%), The result that relatively more funds significantly raise
tracking error volatility with poor performance holds for each style category. But
clearly this tournament behavior is not widespread. Indeed, the majority of funds
have coefficient estimates of «2 that are insignificantly different from zero, and the
median point estimate is just slightly below zero. Still, the effect of tournament
behavior could be sizeable for many funds. At the third quartile point estimate
of «2 = 0,03. a fund that was underperforming by one standard deviation (G, =
0.70) would have an annual standard deviation of tracking error that was 64 basis
points (bps) greater than if its performance equaled the benchmark (G, = I).''^
However, a similarly underperforming fund having the first quartile point esti-
mate of «2 ~ -0,048 would lower tracking error volatility by 102 bps. Thus,
underperformance can lead to economically significant rises or falls in tracking
error volatility, depending on the fund.
To investigate whether funds that significantly raised tracking error with
underperformance (Ö^ > 0) difïer from those that significantly lowered track-
ing error with underperformance («2 < 0)., we compared the characteristics of
these two groups of funds. Table 5 reports the results of a univariate comparison
(Panel A) and a multivariate regression analysis (Panel B), In Panel A. column I
gives the total number of funds for which a particular characteristic is rept)rted.
and columns 2 and 3 show the numbers of these funds for which we obtained
estimates of «2 that were significantly positive and negative, respectively. Then.,
columns 4 and 5 report the average values of fund characteristics for these two
groups of funds whose estimates of 02 were significantly positive and significantly
negative, respectively. Column 6 calculates the difference in the two groups"
averages, while column 7 reports the /-statistic for the test of whether the group
means are statistically different.
-''The monthly standard deviation of G, across ail funds and years is Ü.O87 and 0.30, respectivety,
on an annual basis. Since from equation (17)
dG, 2
the total change in standard deviation at C, = 1 - 0.30 = 0,70 versus G, = I equals
0.7(l 1 1 / I
/
-ujG-'^dt = - a , I 1 I = 0.214ii2 = 0.0064.
2 ^ 2 - 0.70 )
25. Chen and Pennacchi 769
TABLE 4
Parameter Estimates for Mutual Funds' Excess Return (Tracking Error) Processes
Maximum likelihood estimates are for the monthly rettjrn processes o( 4,188 growth. 851 groiMh-income, and 1,129 style-
mixed mulual funds having al least 36 montttly return observalions durihg the January 1962 to March 2006 sample period.
The benchmark returns are the equally weighted returns ol all lunds, including tunds nol having al leasl 36 oDservations,
within each investment style category. Likelihood function convergence allowed us to obtain estimates of ali parameters tor
4,188 growth, 861 growth-income, and!,128 siyie-mixed mutual tunds. The value ol a for the remaining single slyie-mixed
lund was tixed lo the median estimate of the converged style-mixed funds, and constrained maximum likelihood estimates
tor this remaining ftjnd's other parameters were obtained.
= In
N(0,
(v
•32
Distribution of Parameter Estimates Summary Statisties
Quartiles Proportion of
Est. > 0 I > 1.96 f < -1.96
Panel A. Growiti Mutual Funds
-11.3536 -0.0980 0 0079 0 1140 31.2935 0.521 0.095 0.080
-44.2961 -11.1542 -1.654S 0 4566 227.9097 0 296 0 082 0.234
-13.3081 -0.8859 0.7511 1.1768 7.5679 0.644 0.407 0 11!
-1.5855 -0.0576 -0.0012 0.0288 0.7814 0 436 0.152 G.I 35
-991.2410 0.0119 0,2866 0.5372 7.8778 0.766 0.377 0064
Panel B. Growth-Income Mutual Funds
t'G -10.7731 -0.1200 -0.0171 0 1G32 16.0733 0.443 0.101 0.106
ao -53.8398 -9.4249 -2.2038 0.6581 33 8793 0 294 0.100 0206
-5.2996 -0.5546 0.7961 1.1841 5.8628 0 685 0.419 0.095
-0.7395 -0.0377 -0.0005 0.0223 0.4279 0 453 0.163 0 123
33 -66.5036 0.0177 0.3287 0 5412 17 6268 0.774 0.417 0.079
Panel C. Slyle-Mixed Mutual Funds
l^a -2.1955 -0.0958 -0.0059 0.0762 3.0713 0.477 0.090 0.107
-36.6229 -10.2616 -1.5174 0.5645 30.1132 0 291 0.130 0.277
-4.1114 -0.4509 0 8488 1 2268 5.6245 0.693 0.507 0.121
-0,3530 -0.0174 0.0009 0.0362 0.3993 0.521 0 229 0.097
-5.0661 0.0460 0.2402 0.4075 3.7967 0.801 G.5G0 0.078
Panel D. All Mutual Funds
-11.3536 -•0 0993 G.OGIO 0 1059 31 2935 0.502 0 095 O.OBB
-53.8398 -11.1430 -1.6556 0.4995 227.9097 G.295 0.093 0238
-13.3081 -0.7861 0.7705 1.1847 7 5679 0.659 0 427 Olli
-1.5855 -0.0475 -0.0001 0.0298 O.7B14 G.454 0.168 0 126
-991.2410 0.0147 0.2856 0.5088 17.6268 0.773 0 405 0.068
Four of the 11 chiiracteristies are signitieantly different between the two
groups. Relative to a fund displaying a positive relationship between performance
and tracking error, a fund displaying an inverse relationship (tournament behav-
ior) tends to be older, larger, have fewer share classes, and have a portfolio man-
ager with a longer tenure at the fund. That older and larger funds appear more
prone to tournament behavior is consistent with our (untabulated) SDR test find-
ings. However, because many fund characteristics are correlated and may proxy
for one another, more insight regarding the determinants of tournament behavior
can be obtained through multivariate regression.^-^
-'-'For example, ihe correlation between fund age and manager tenure is 0.4 i across all funds and
0.42 across funds whose estimates of ^2 are statistically significani.