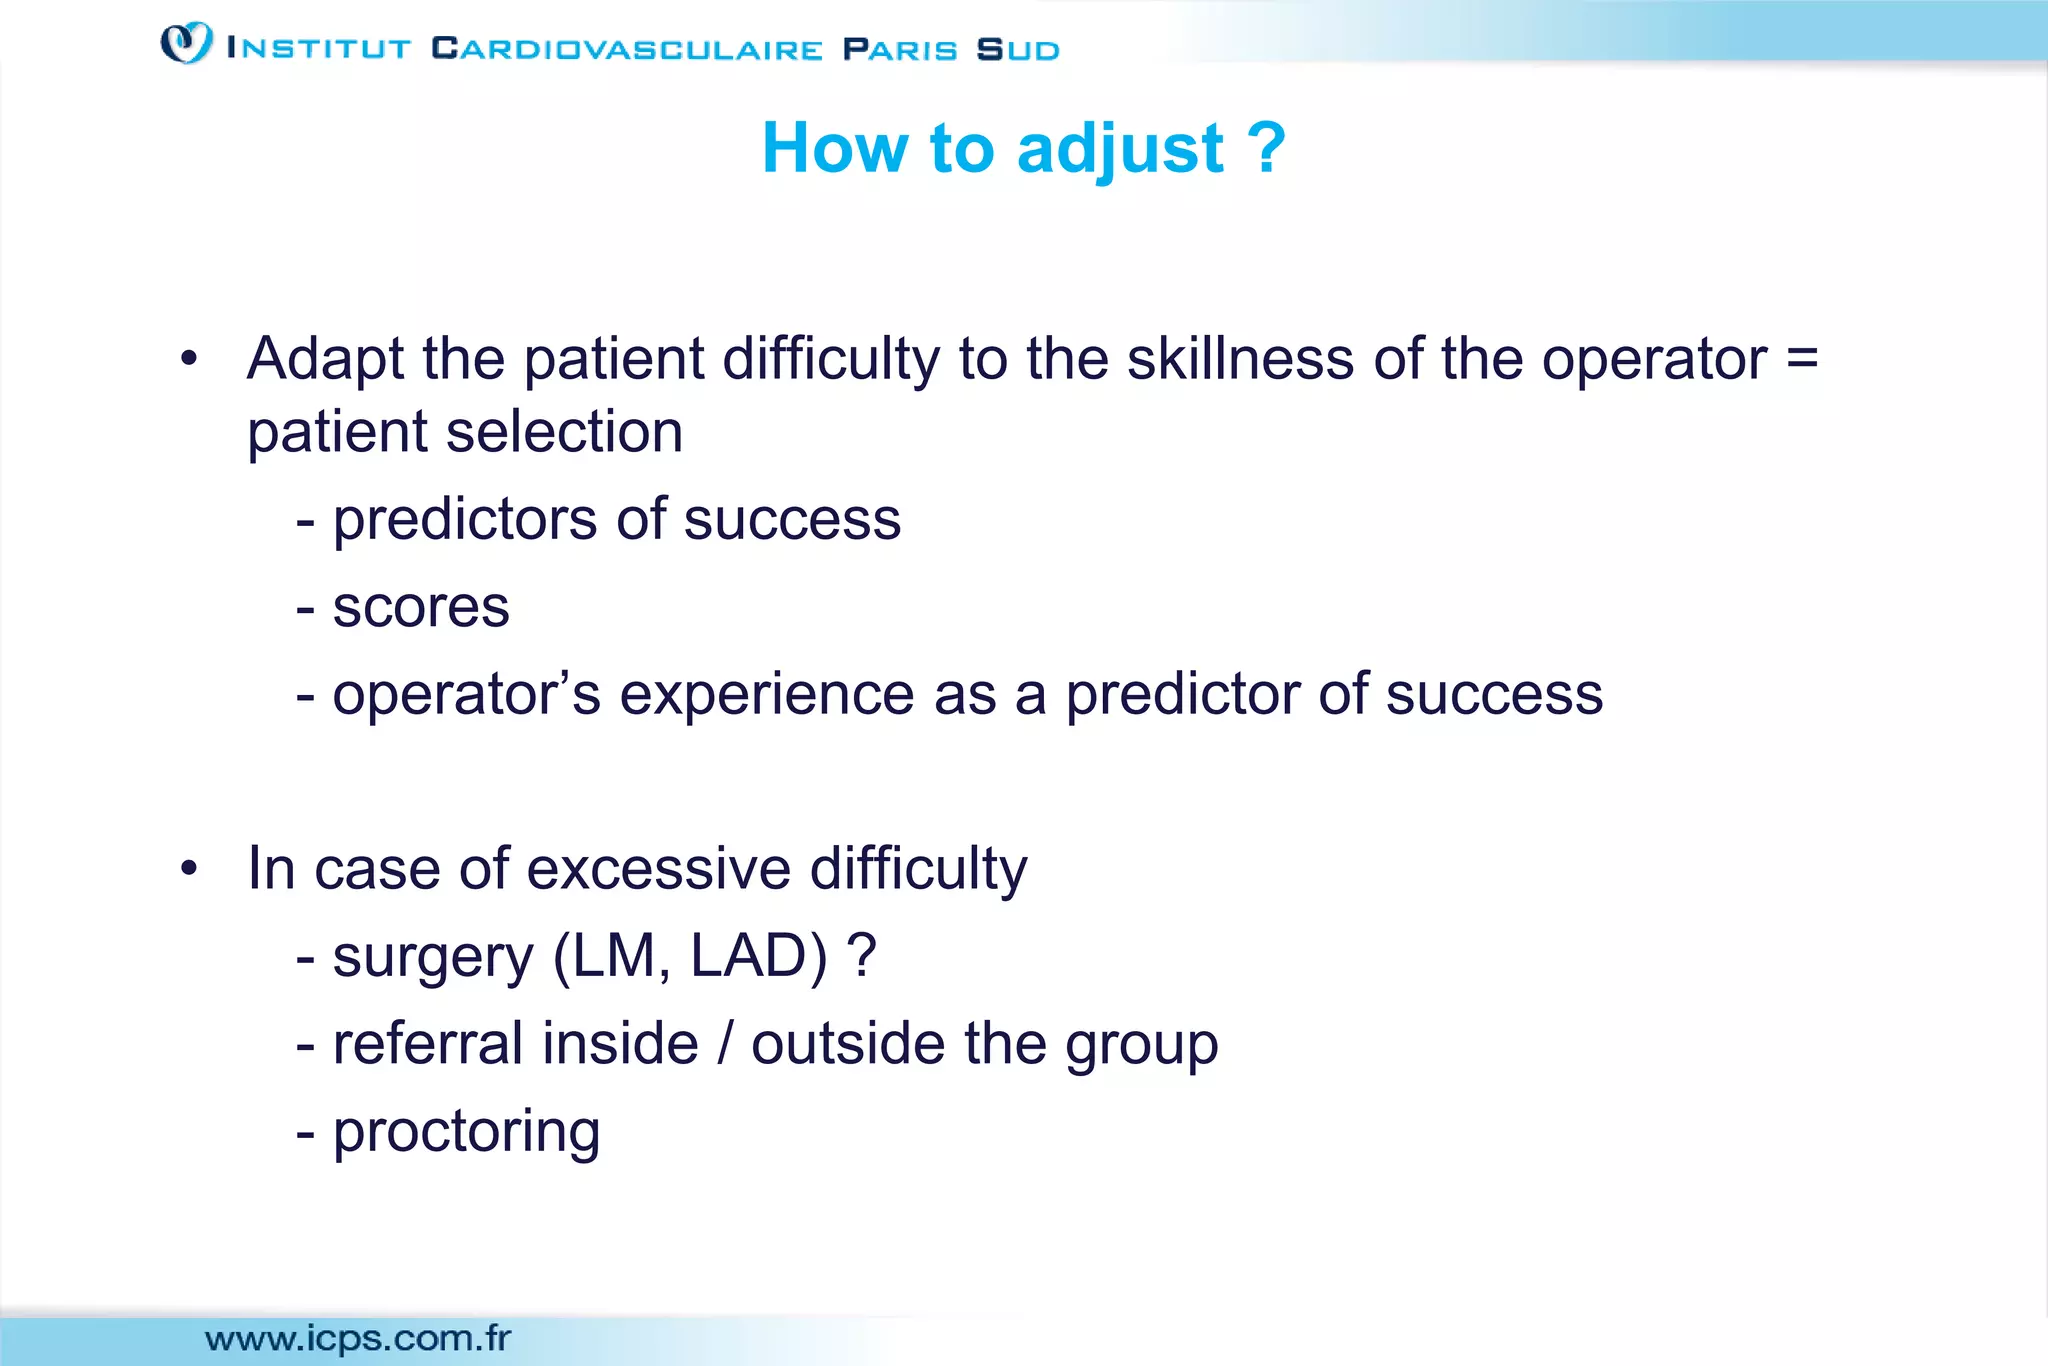
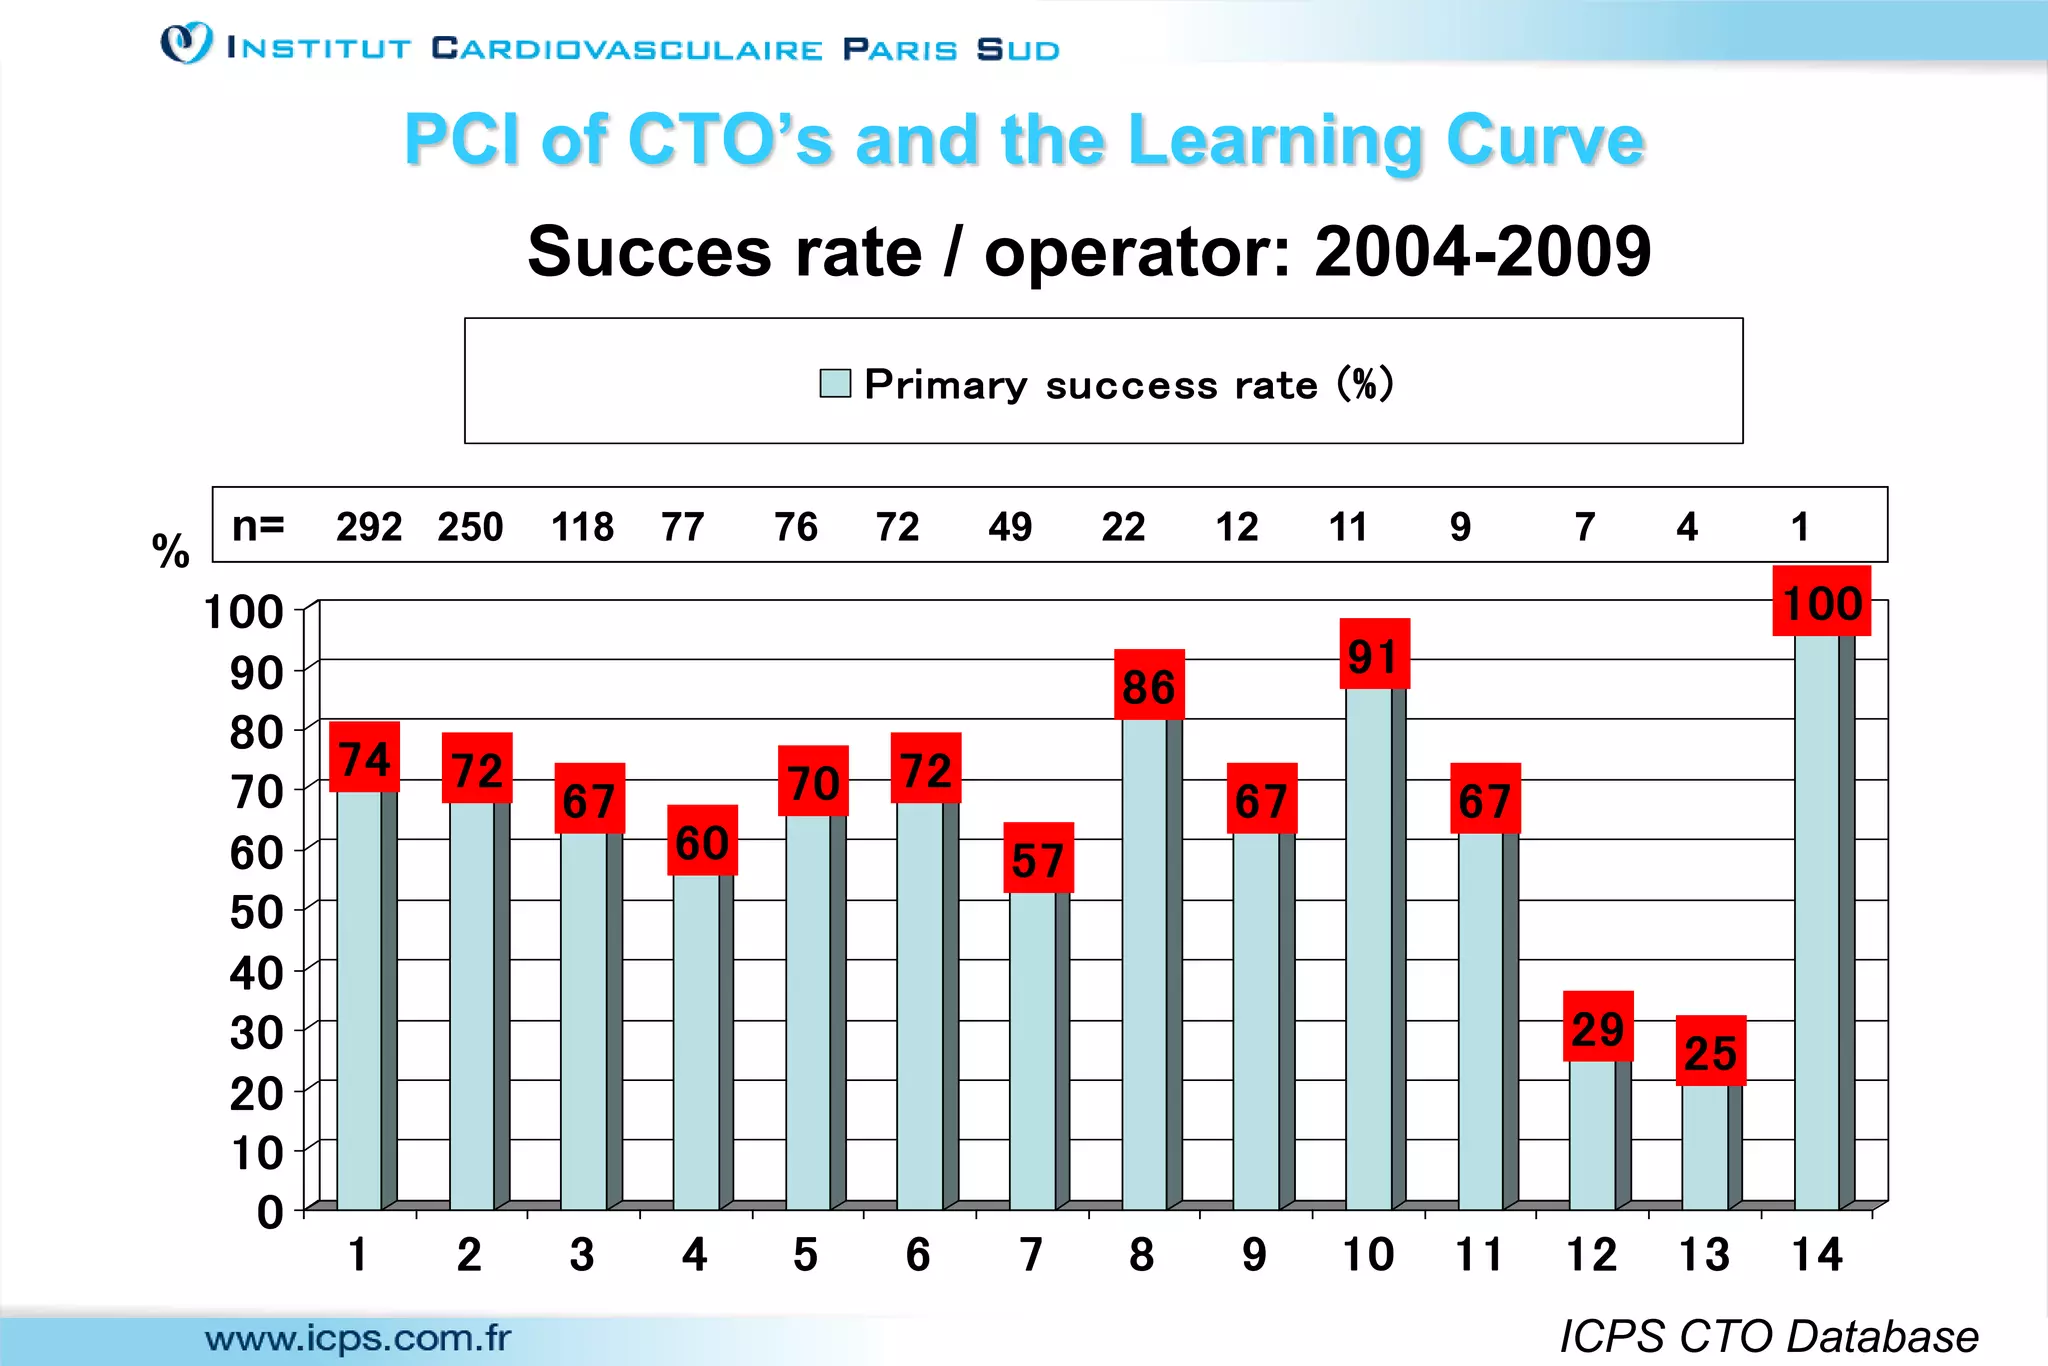
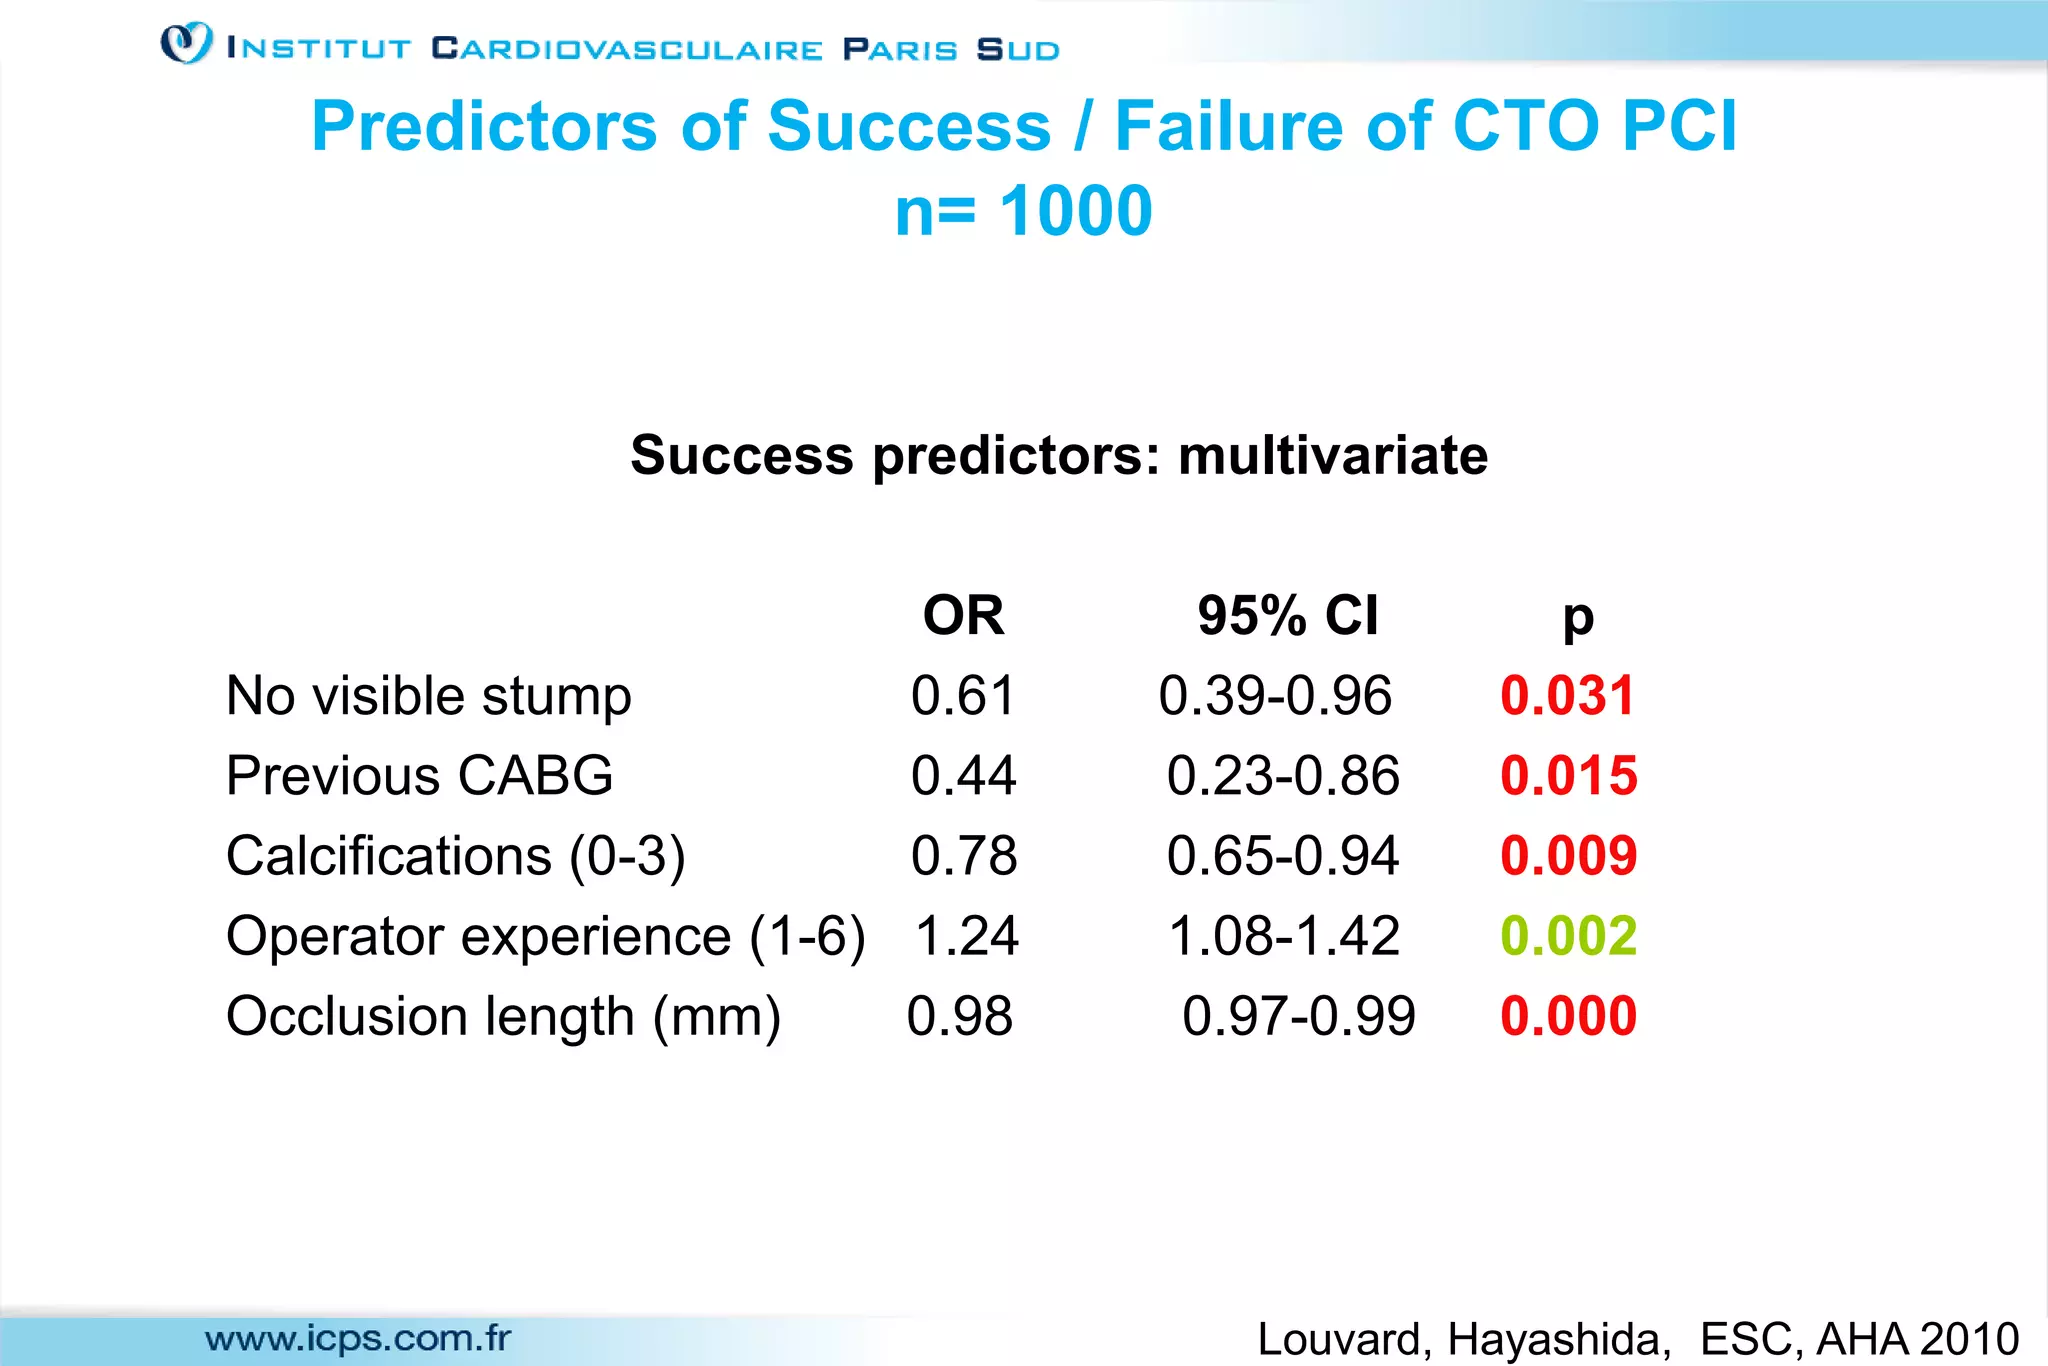
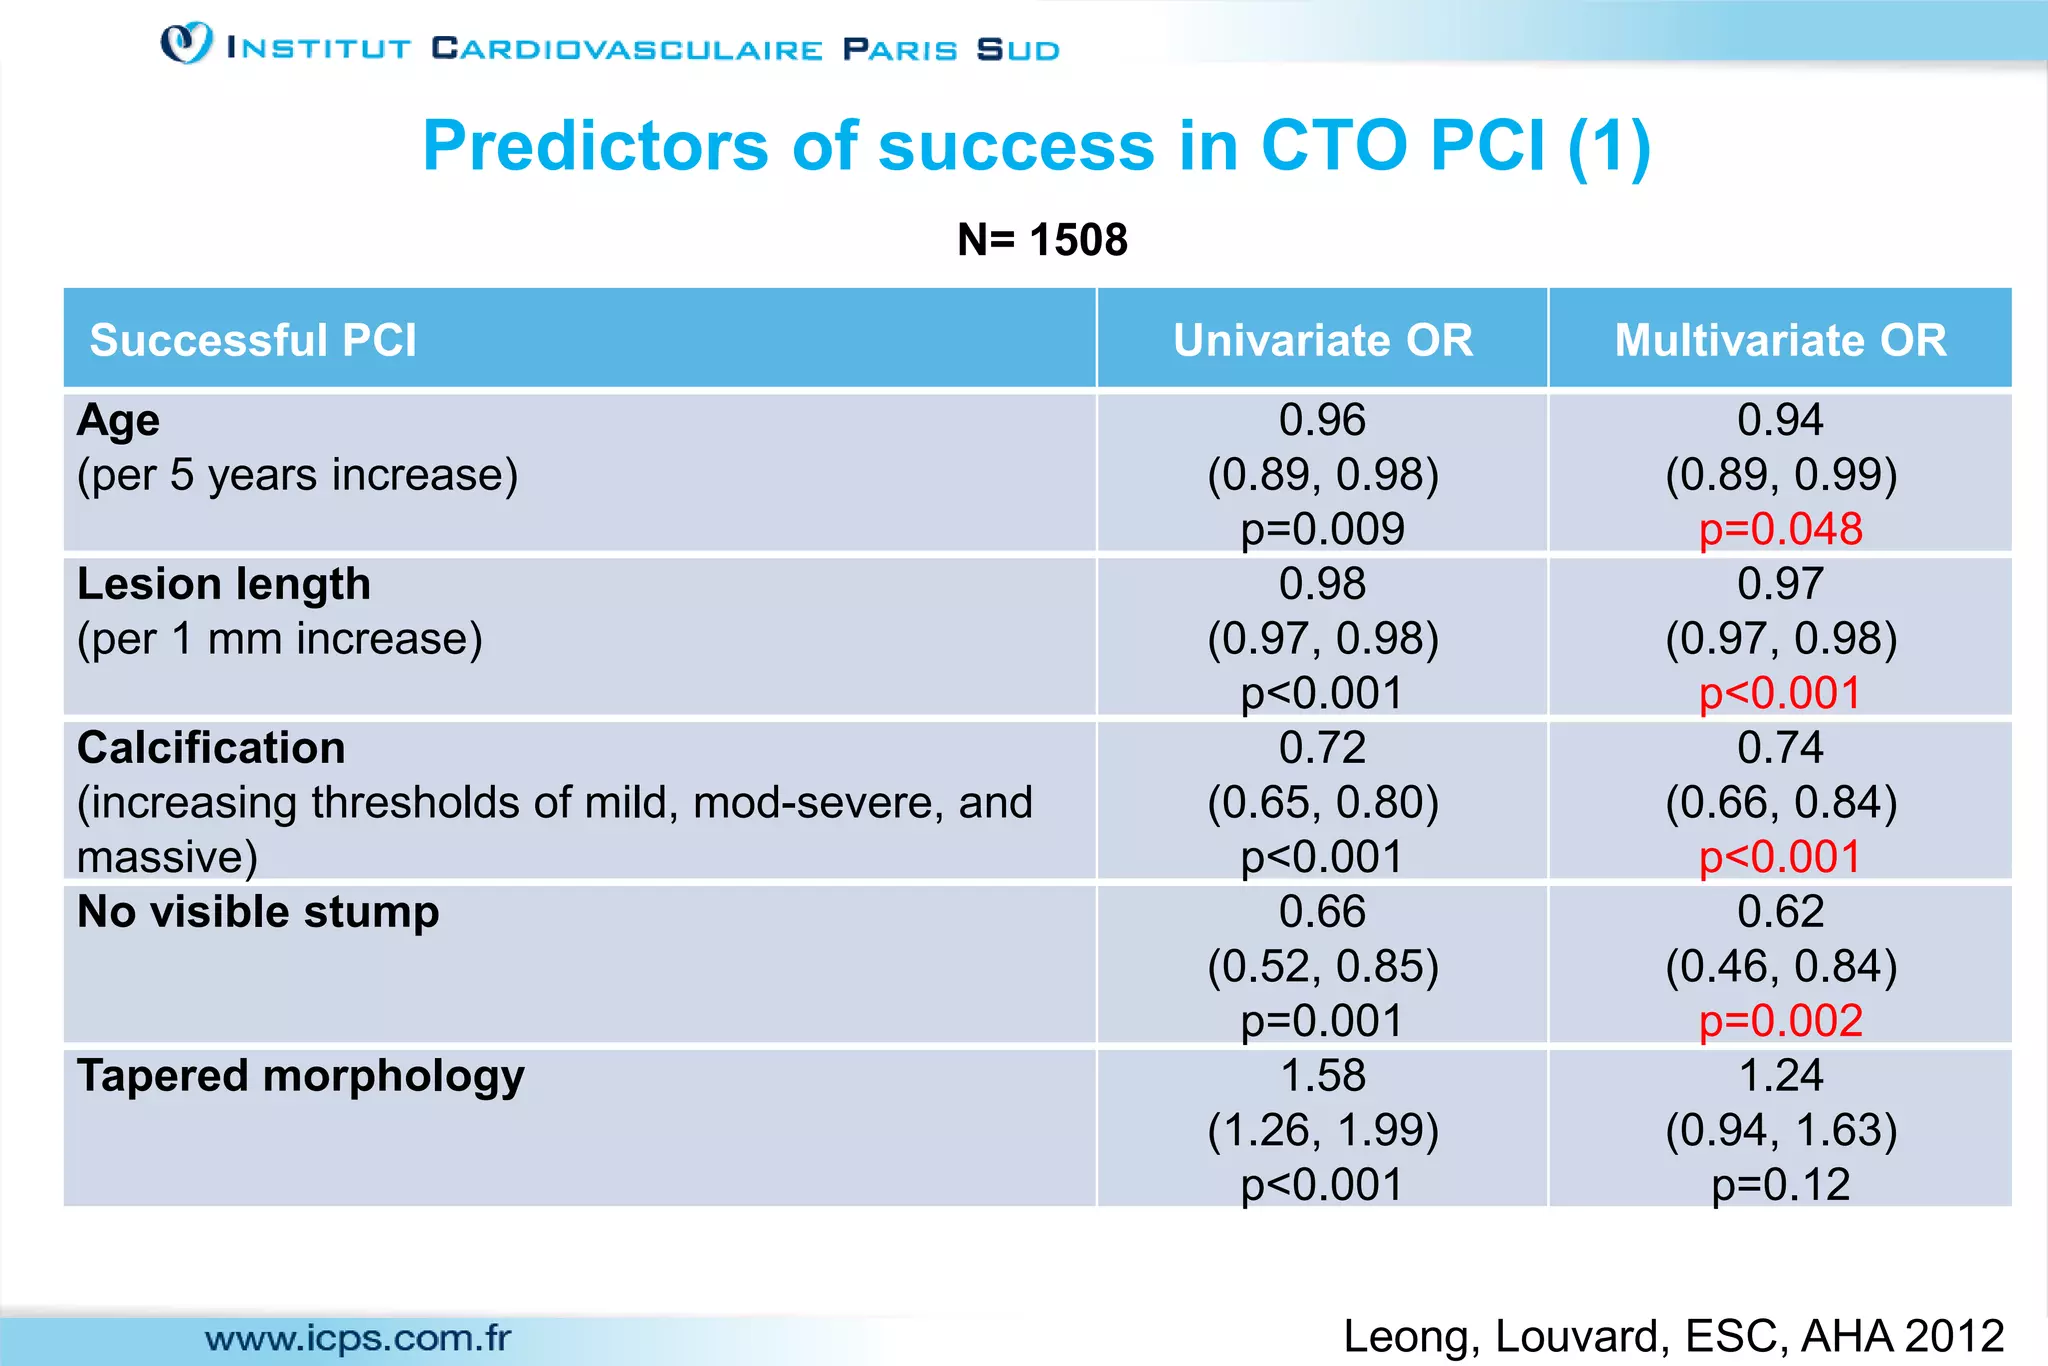
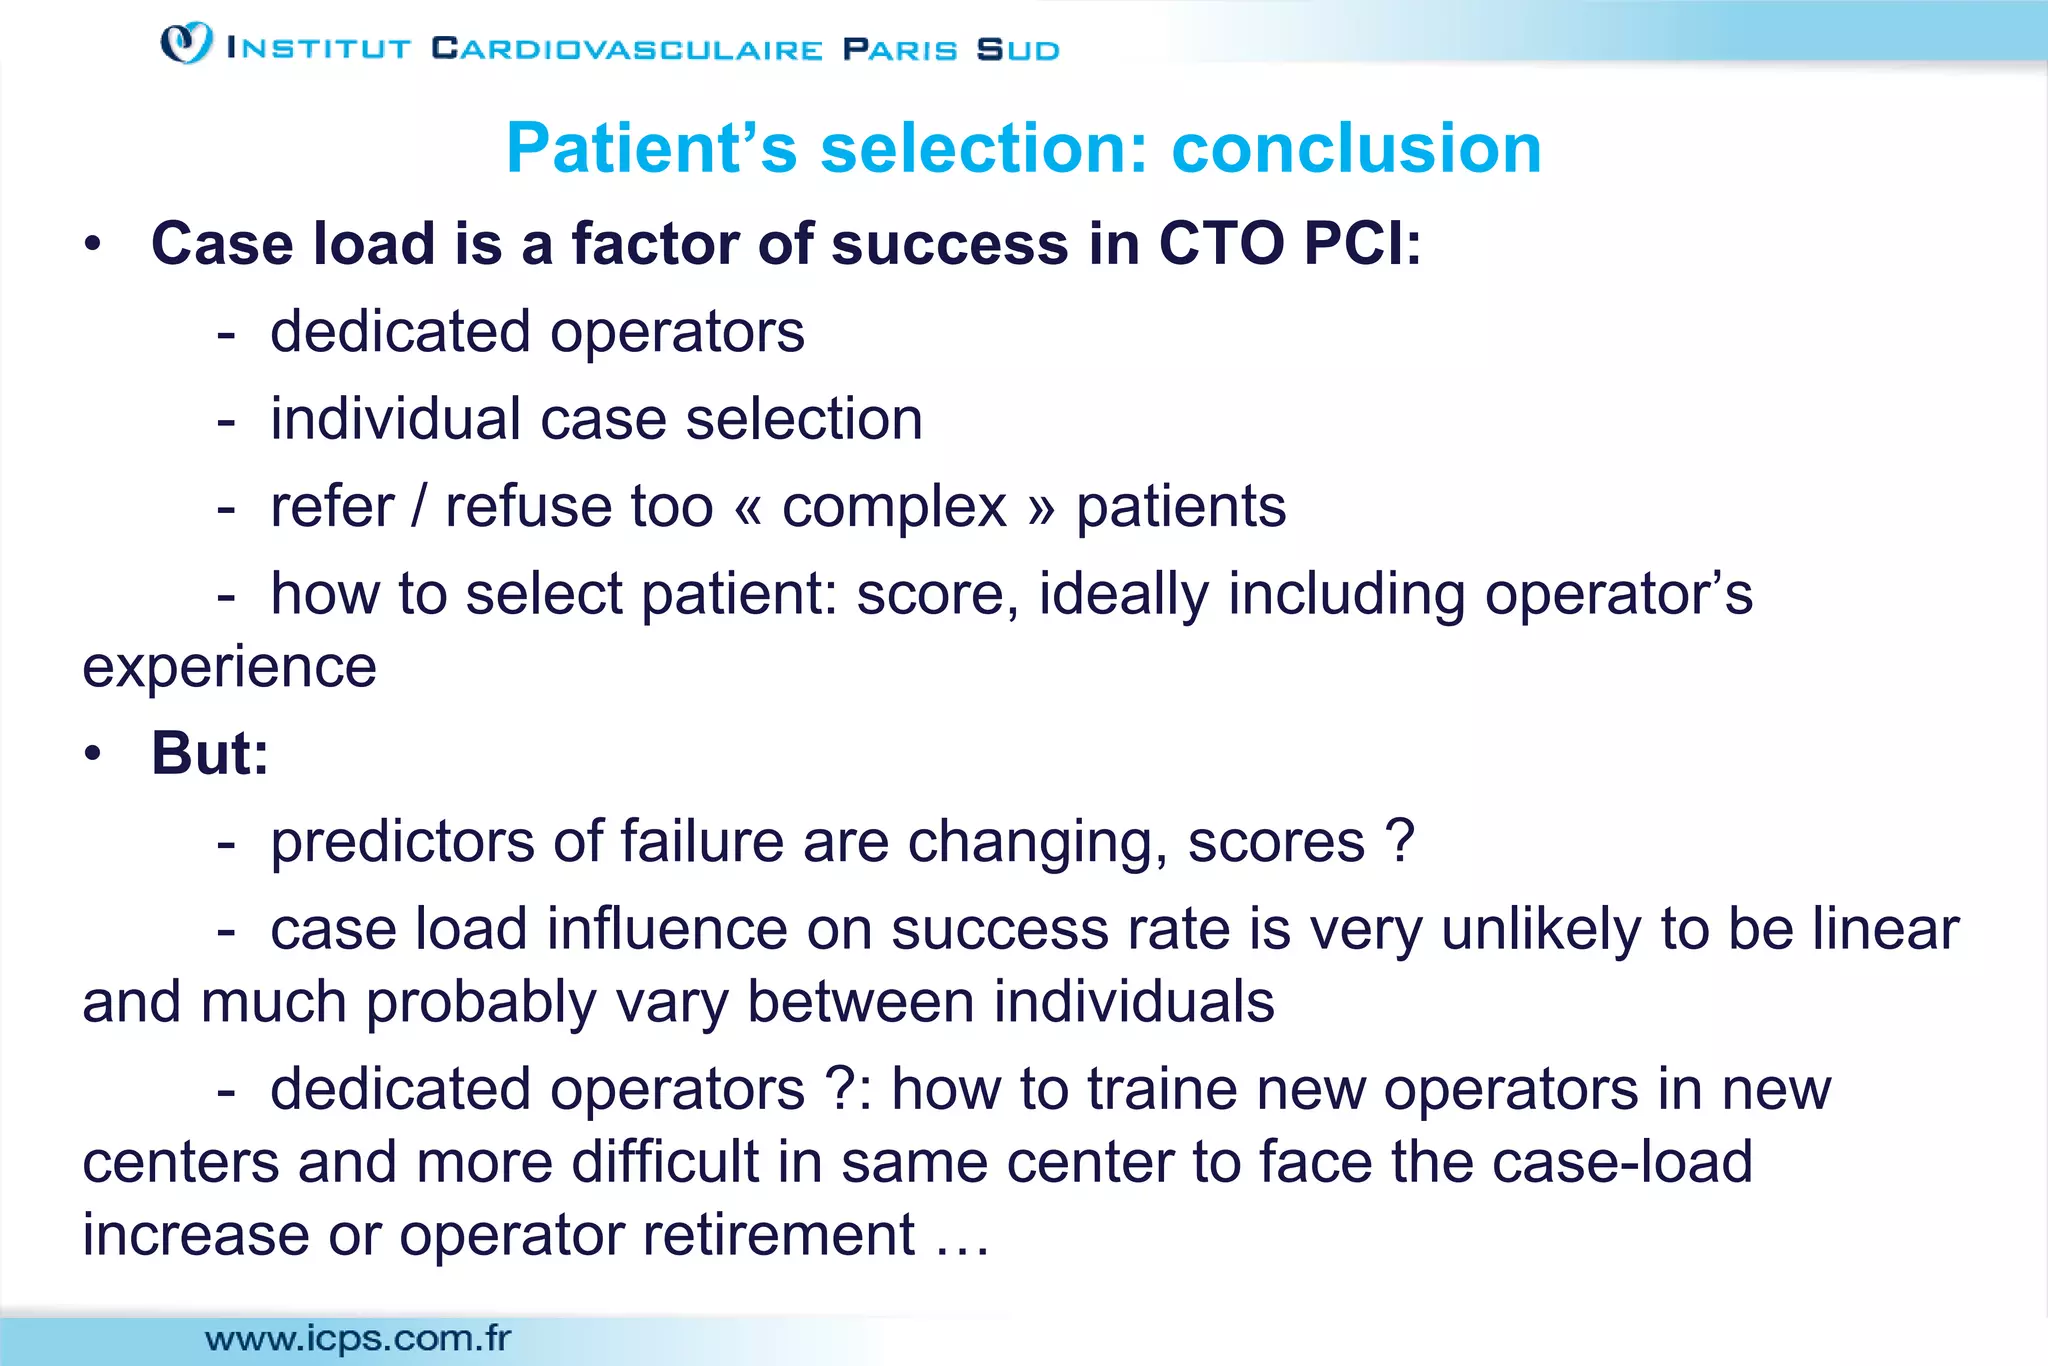
1) Adjusting the difficulty level of chronic total occlusion (CTO) percutaneous coronary intervention (PCI) cases to the skill level of the operator is important. This can be done through patient selection based on predictors of success and operator experience.
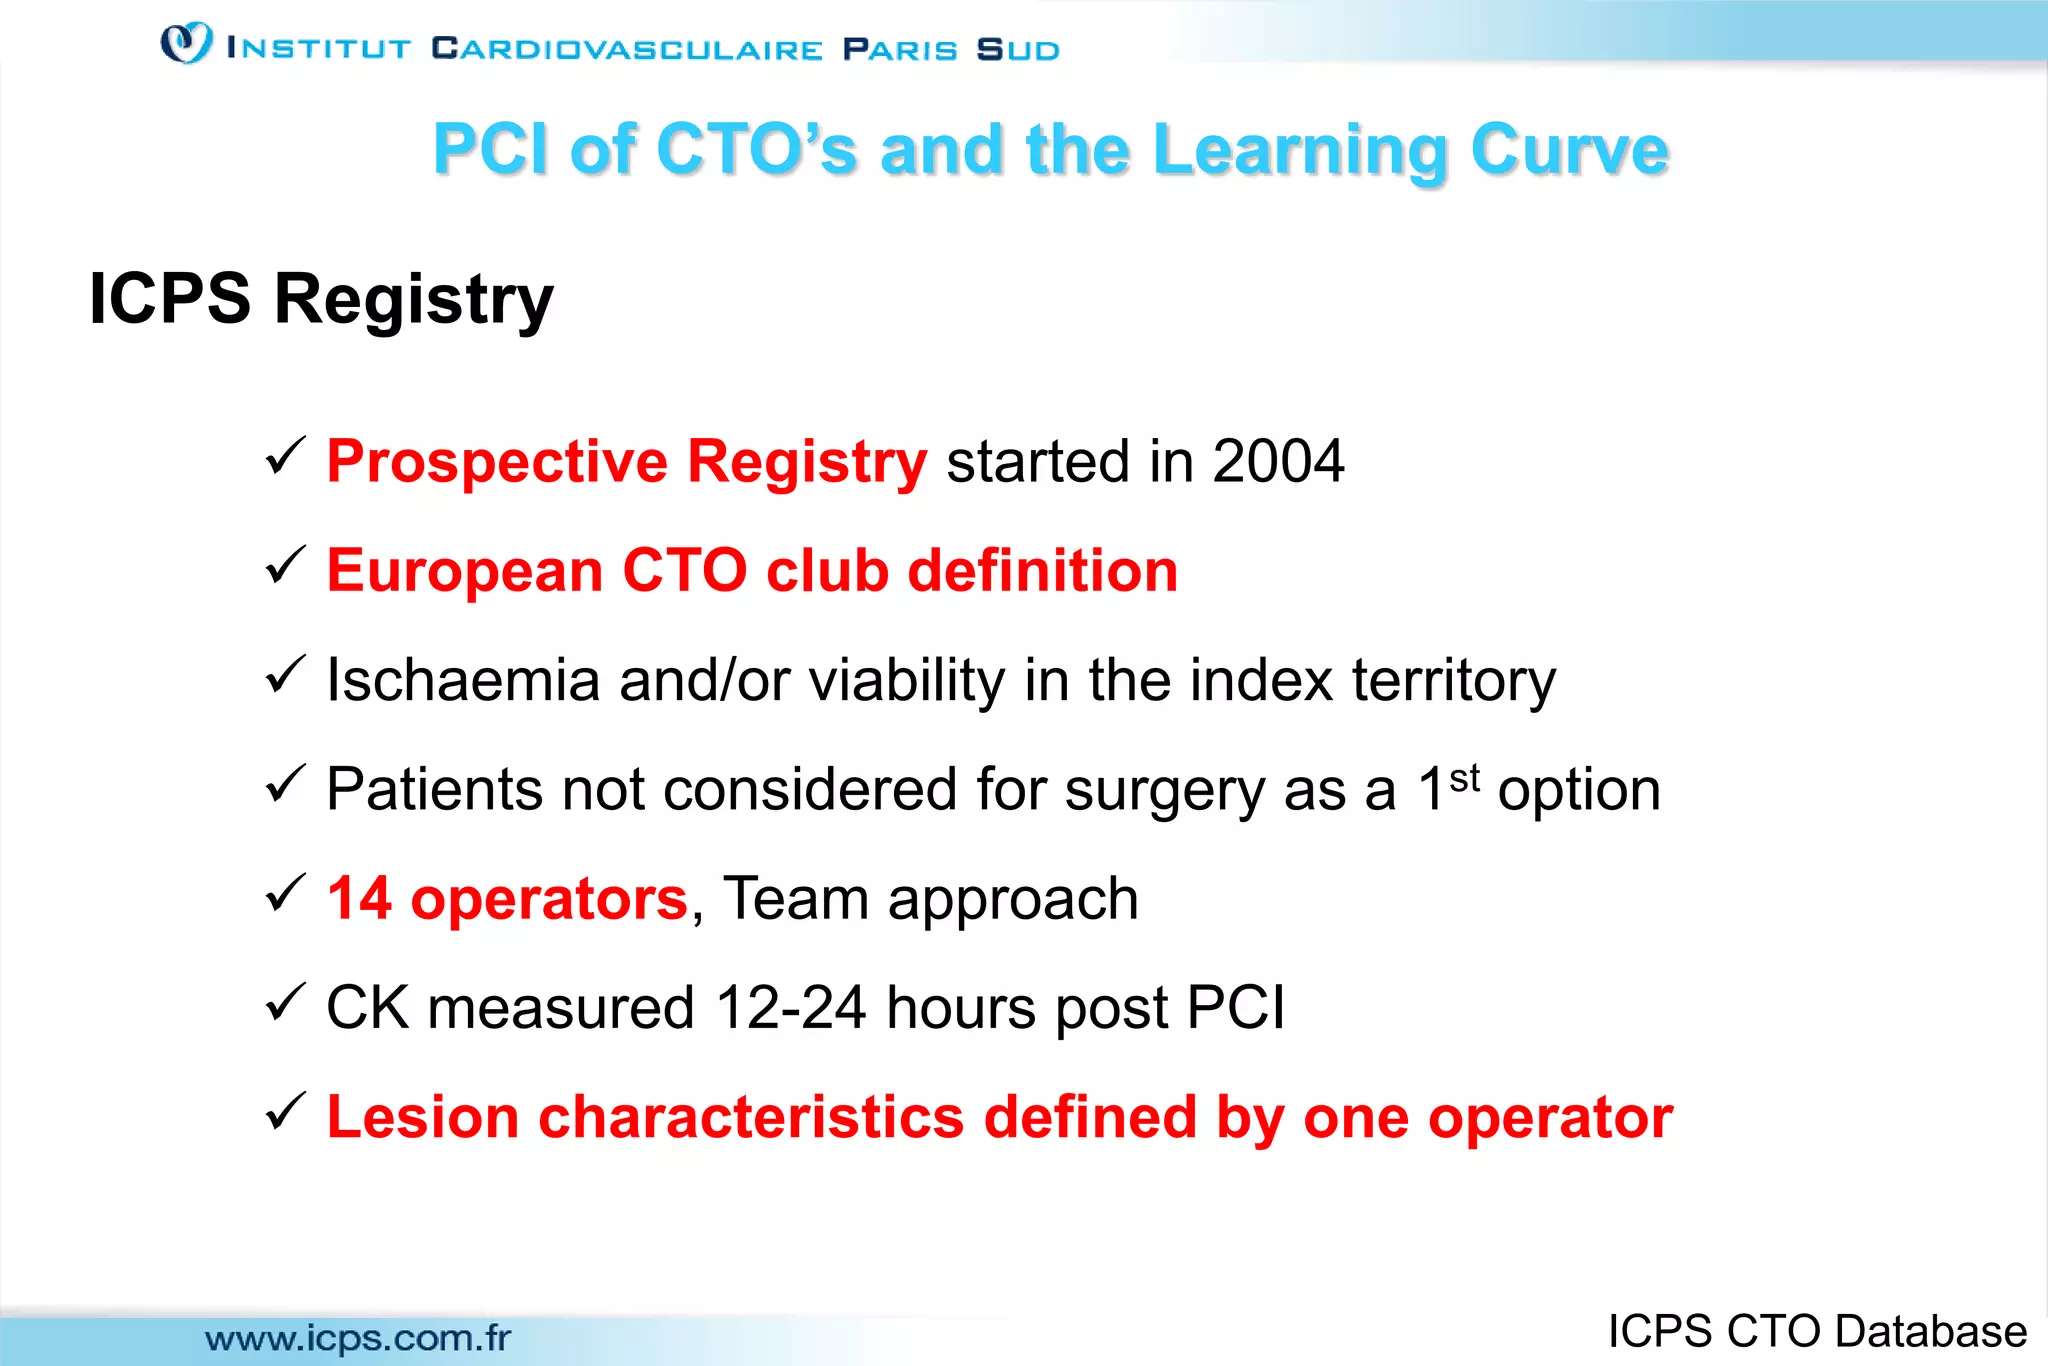
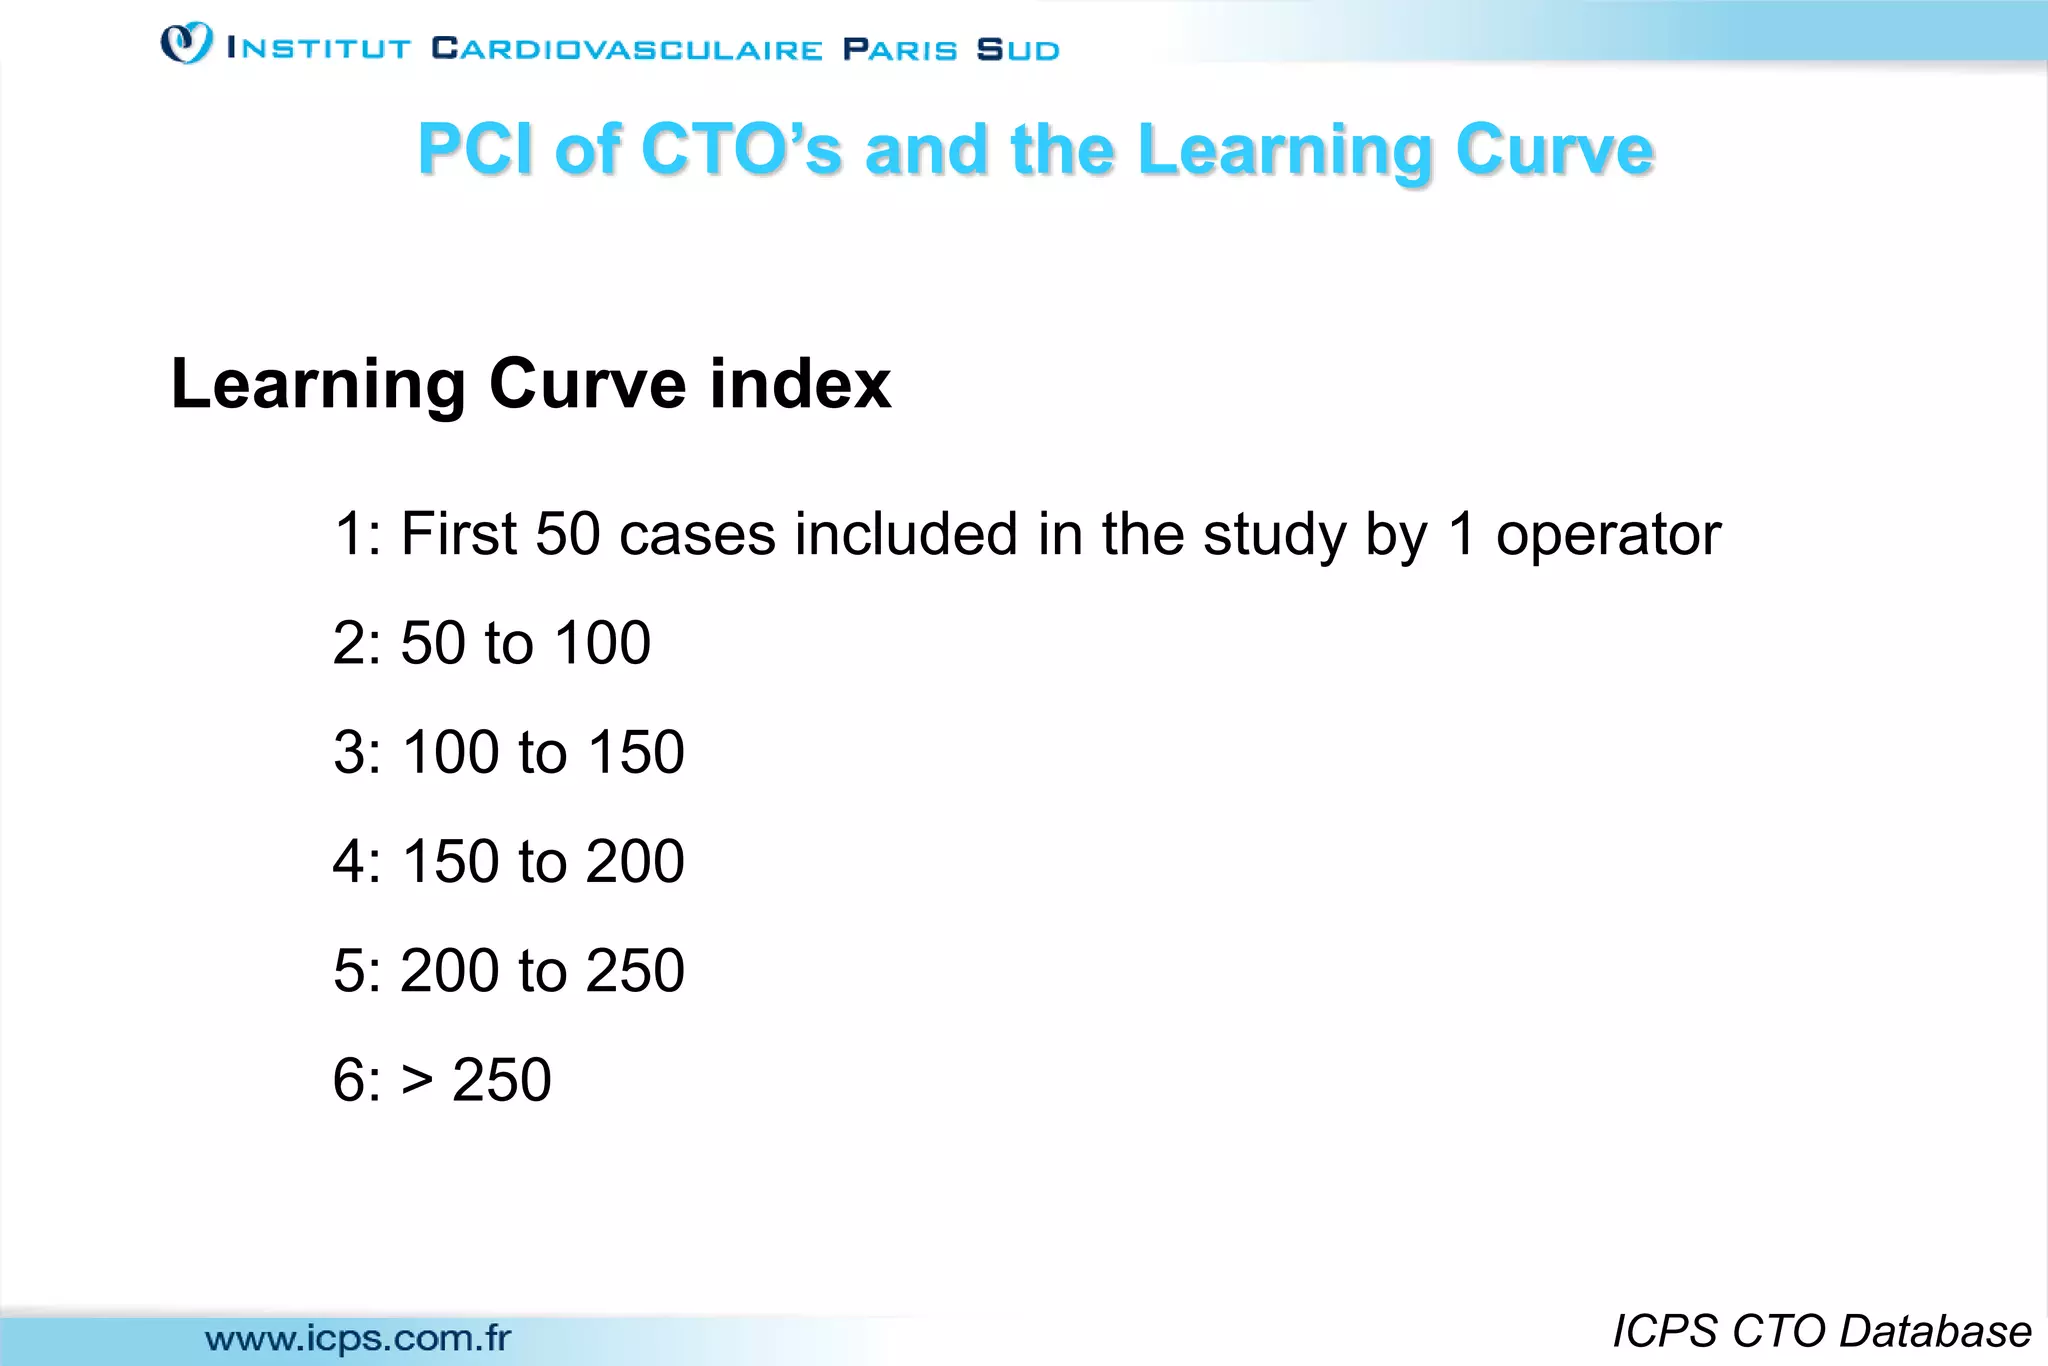
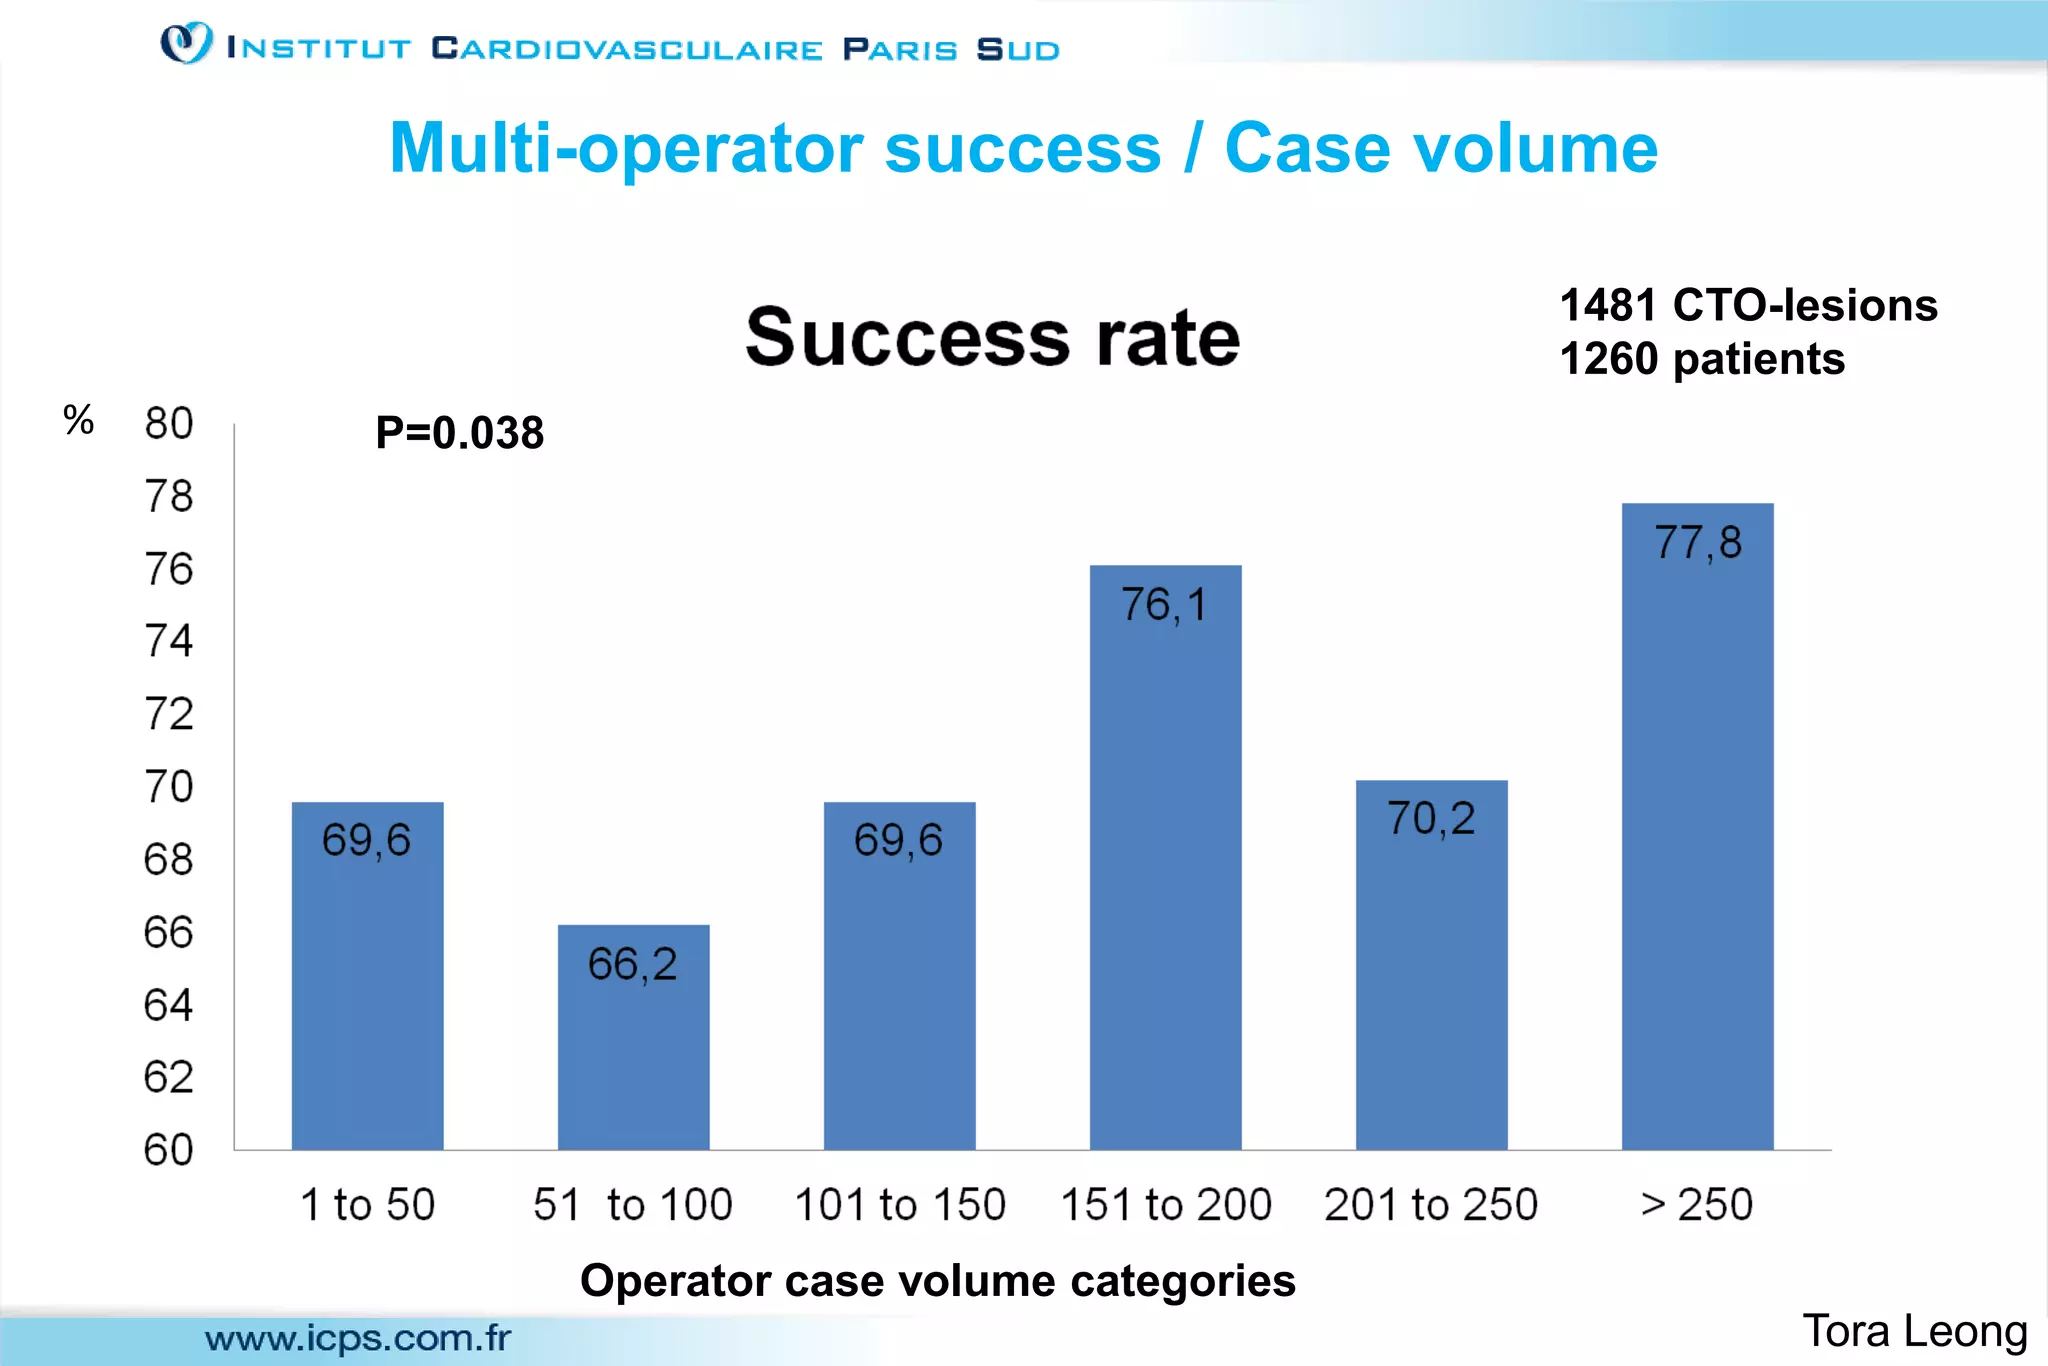
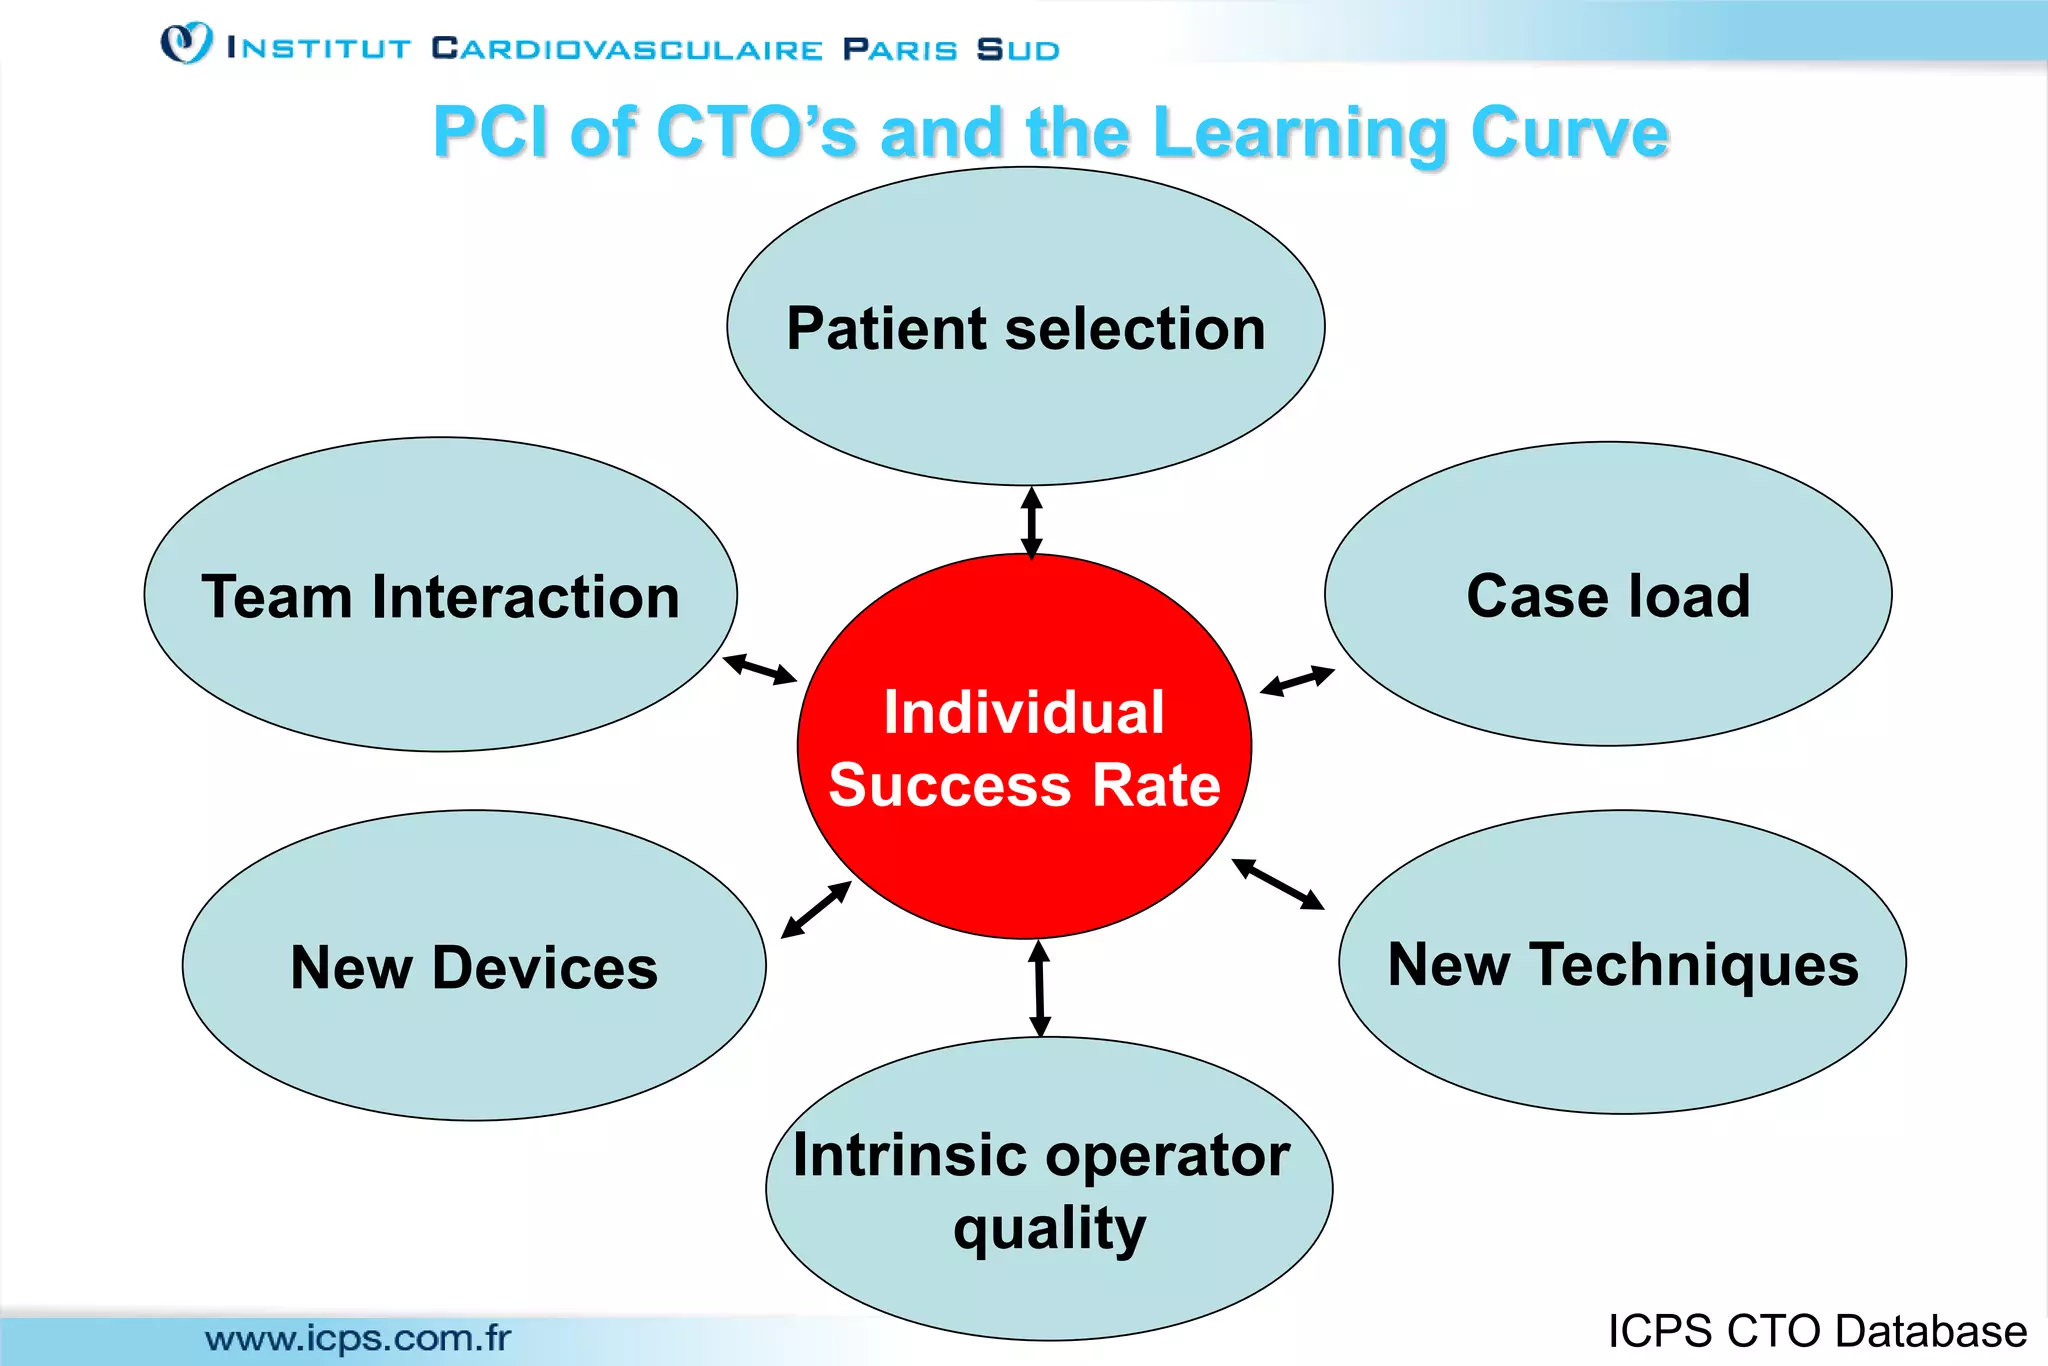
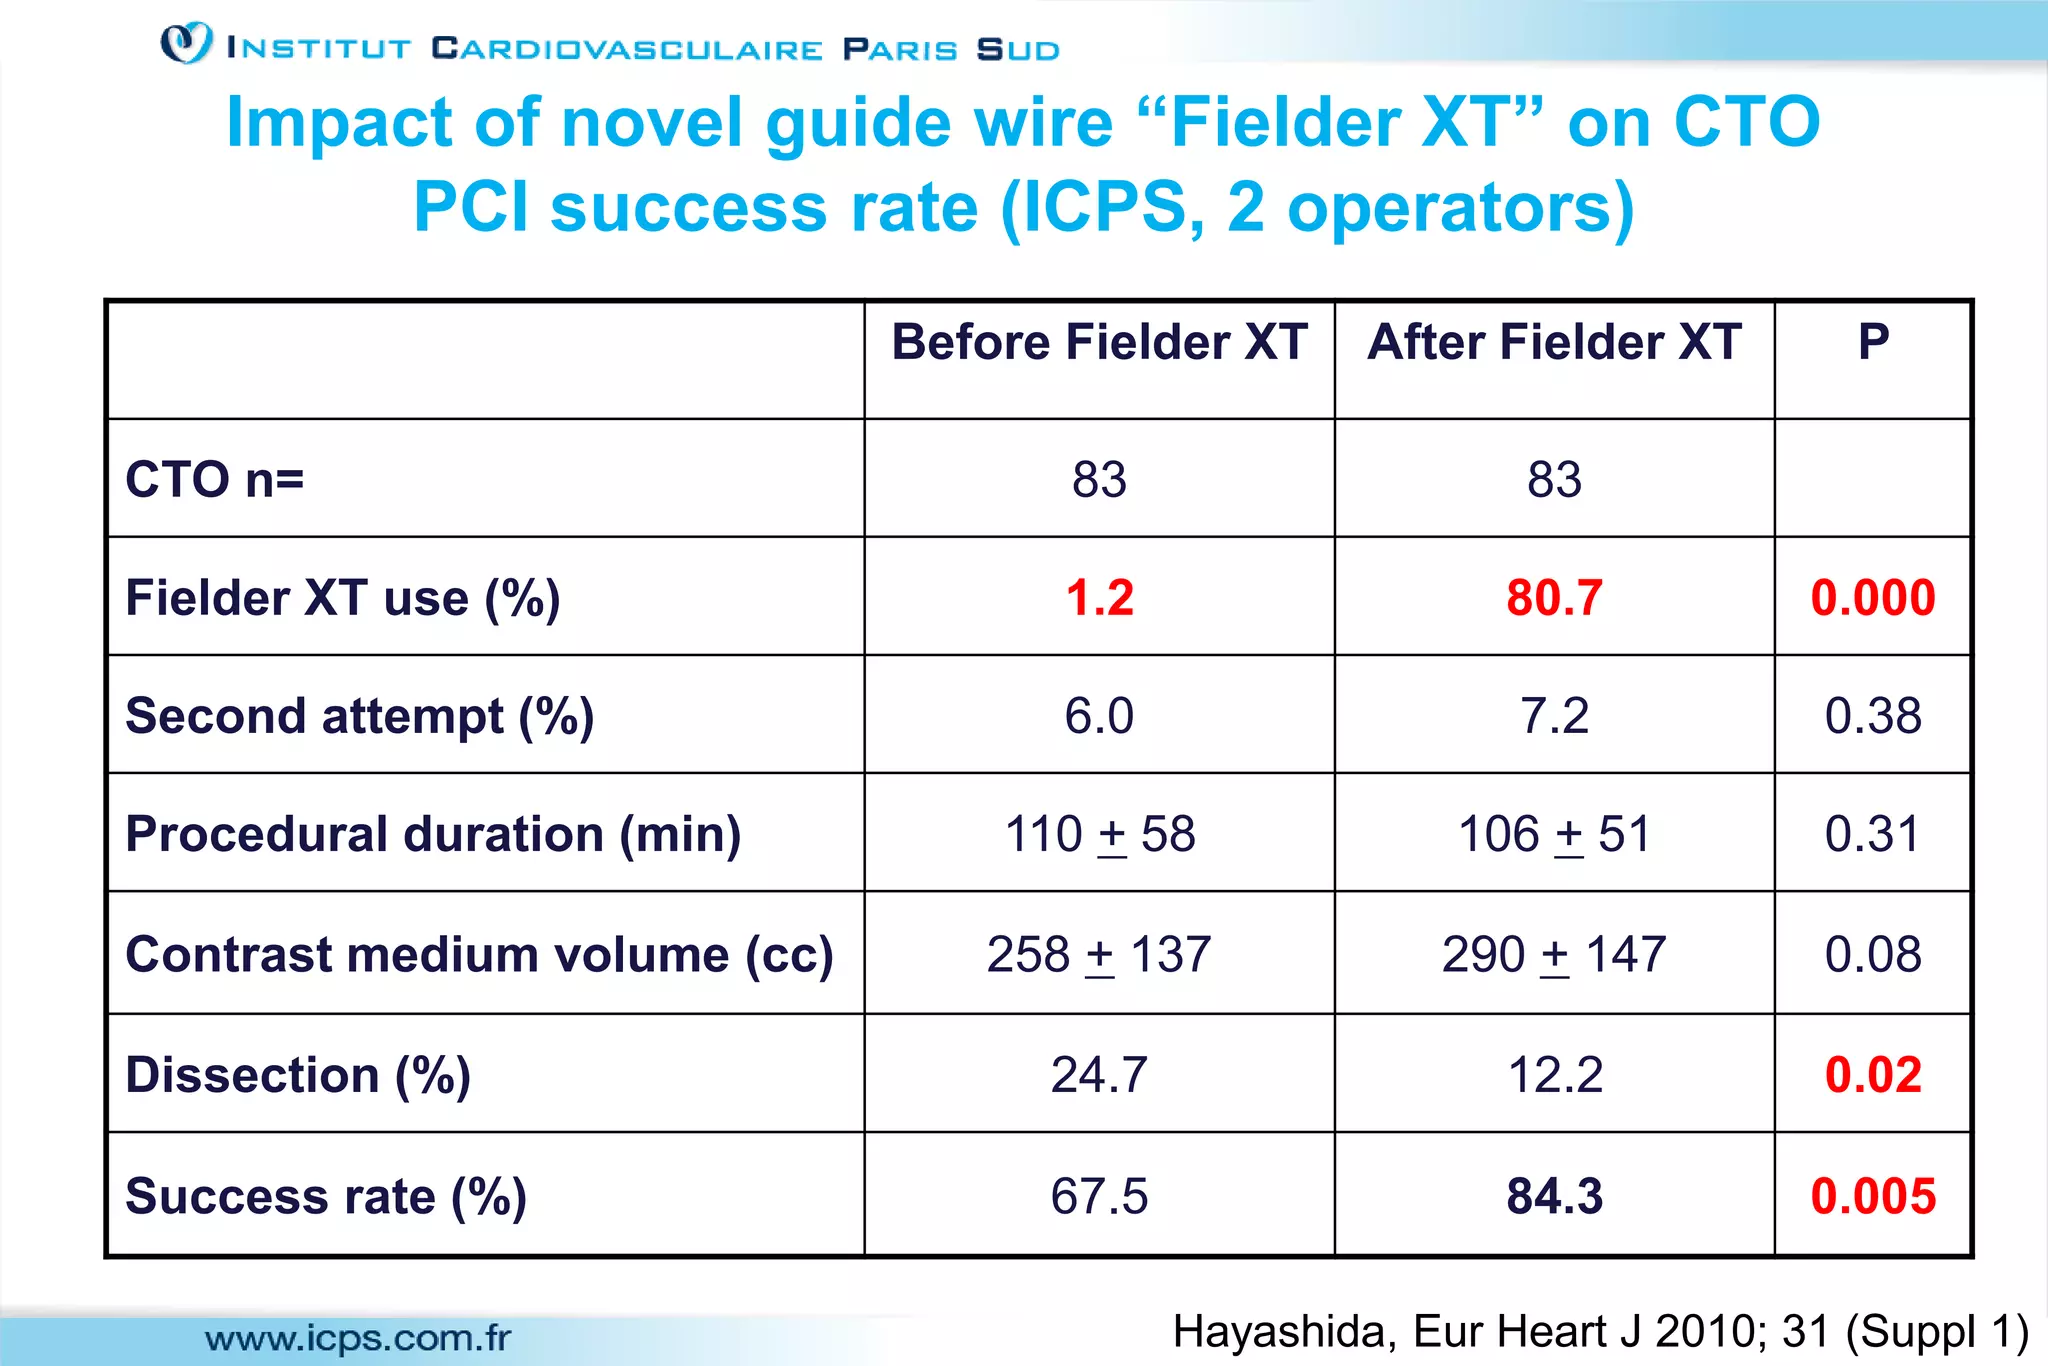
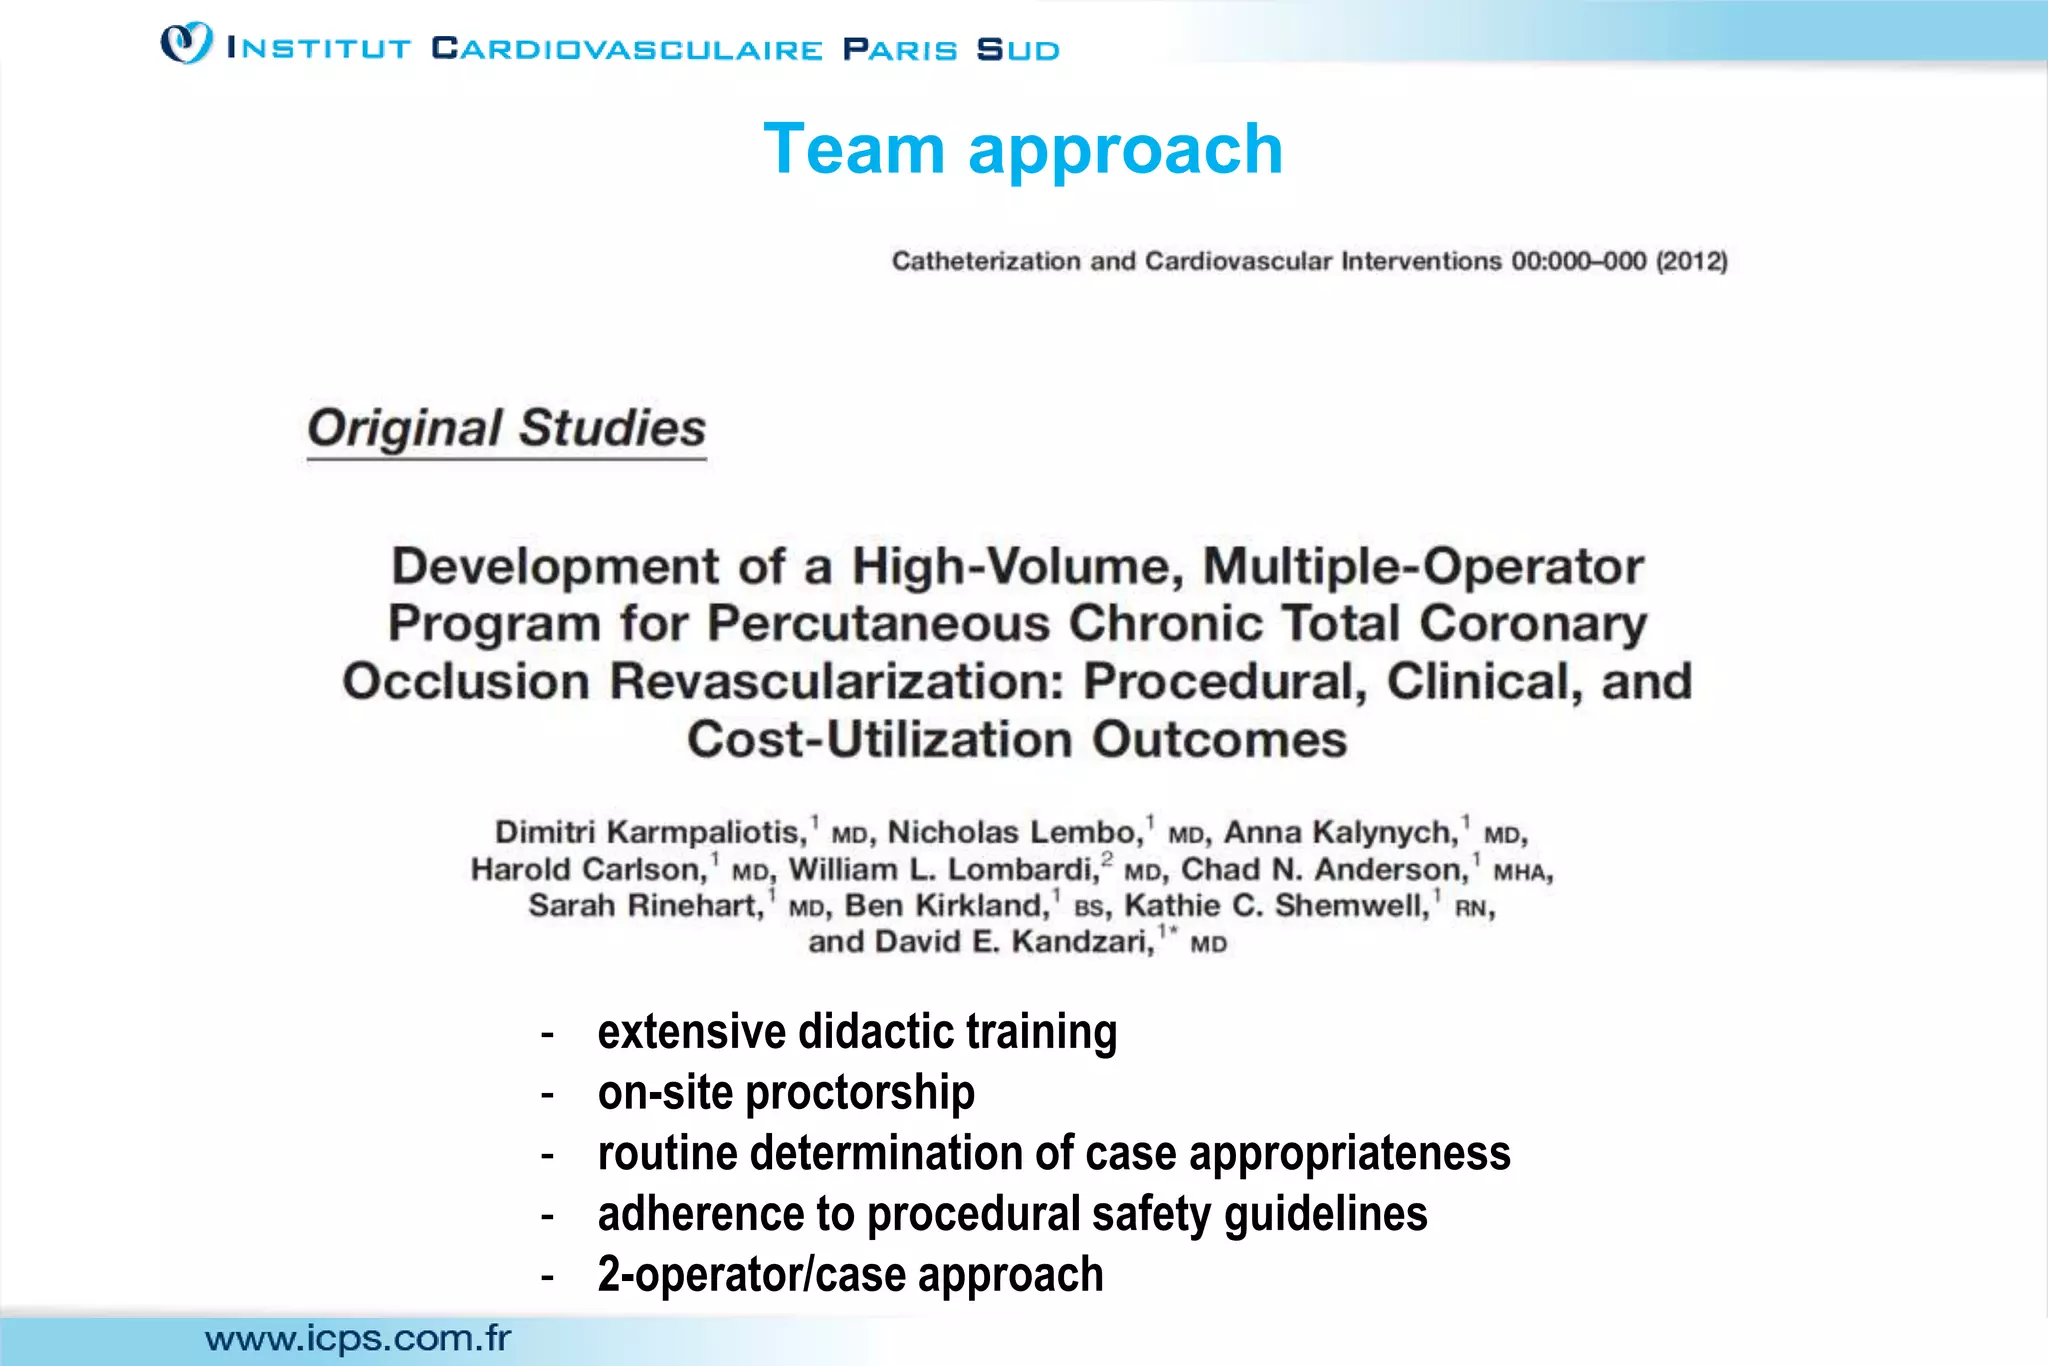
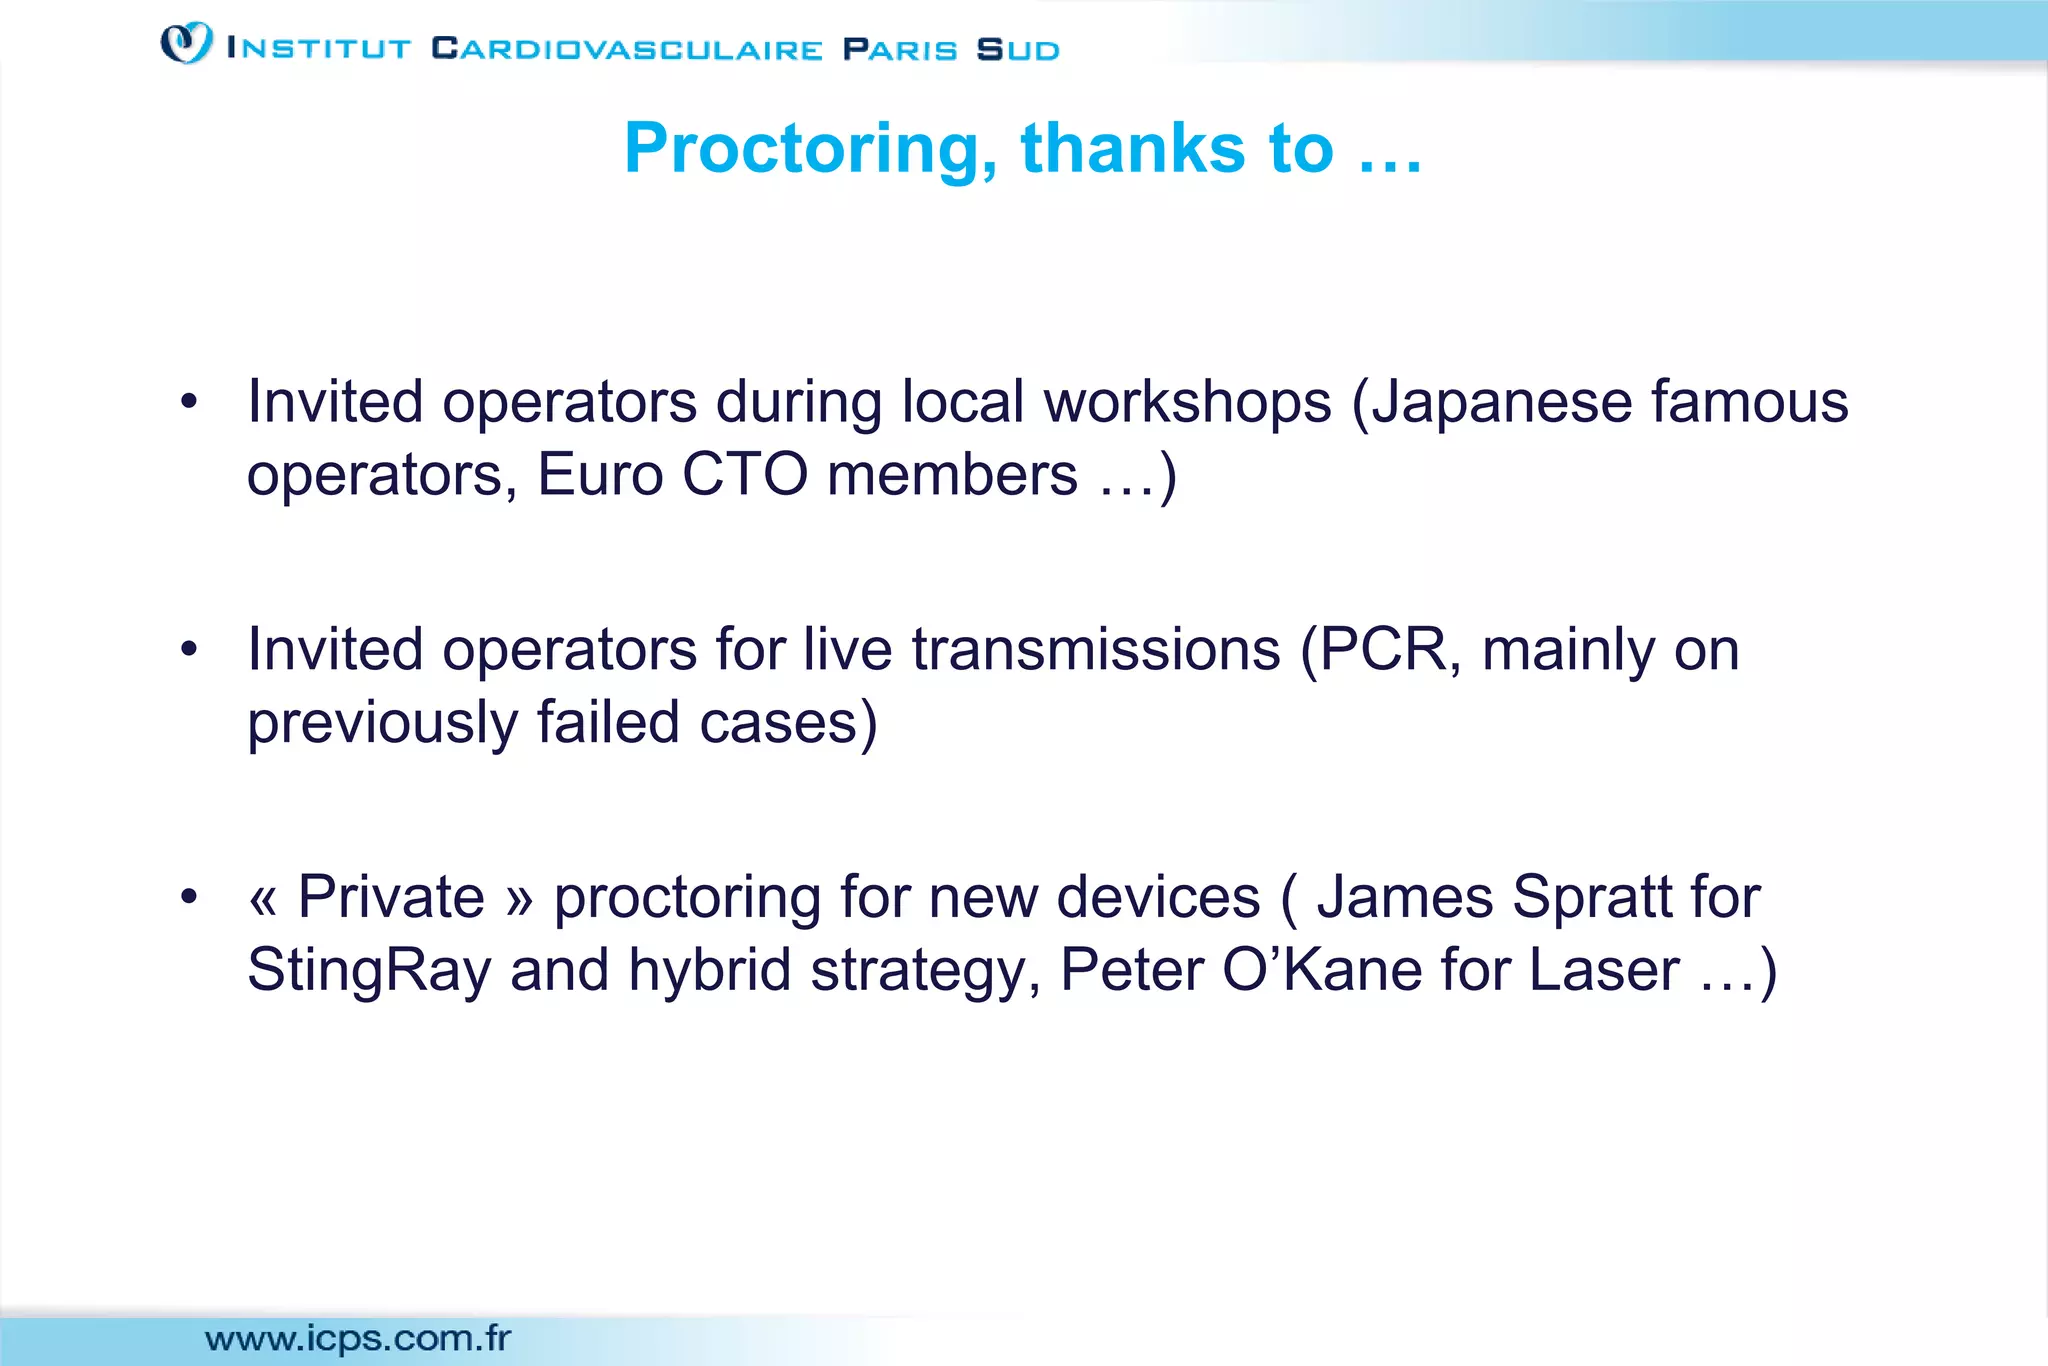
2) A team-based approach, use of new devices and techniques, individual case volumes, and proctoring can help improve CTO PCI success rates.
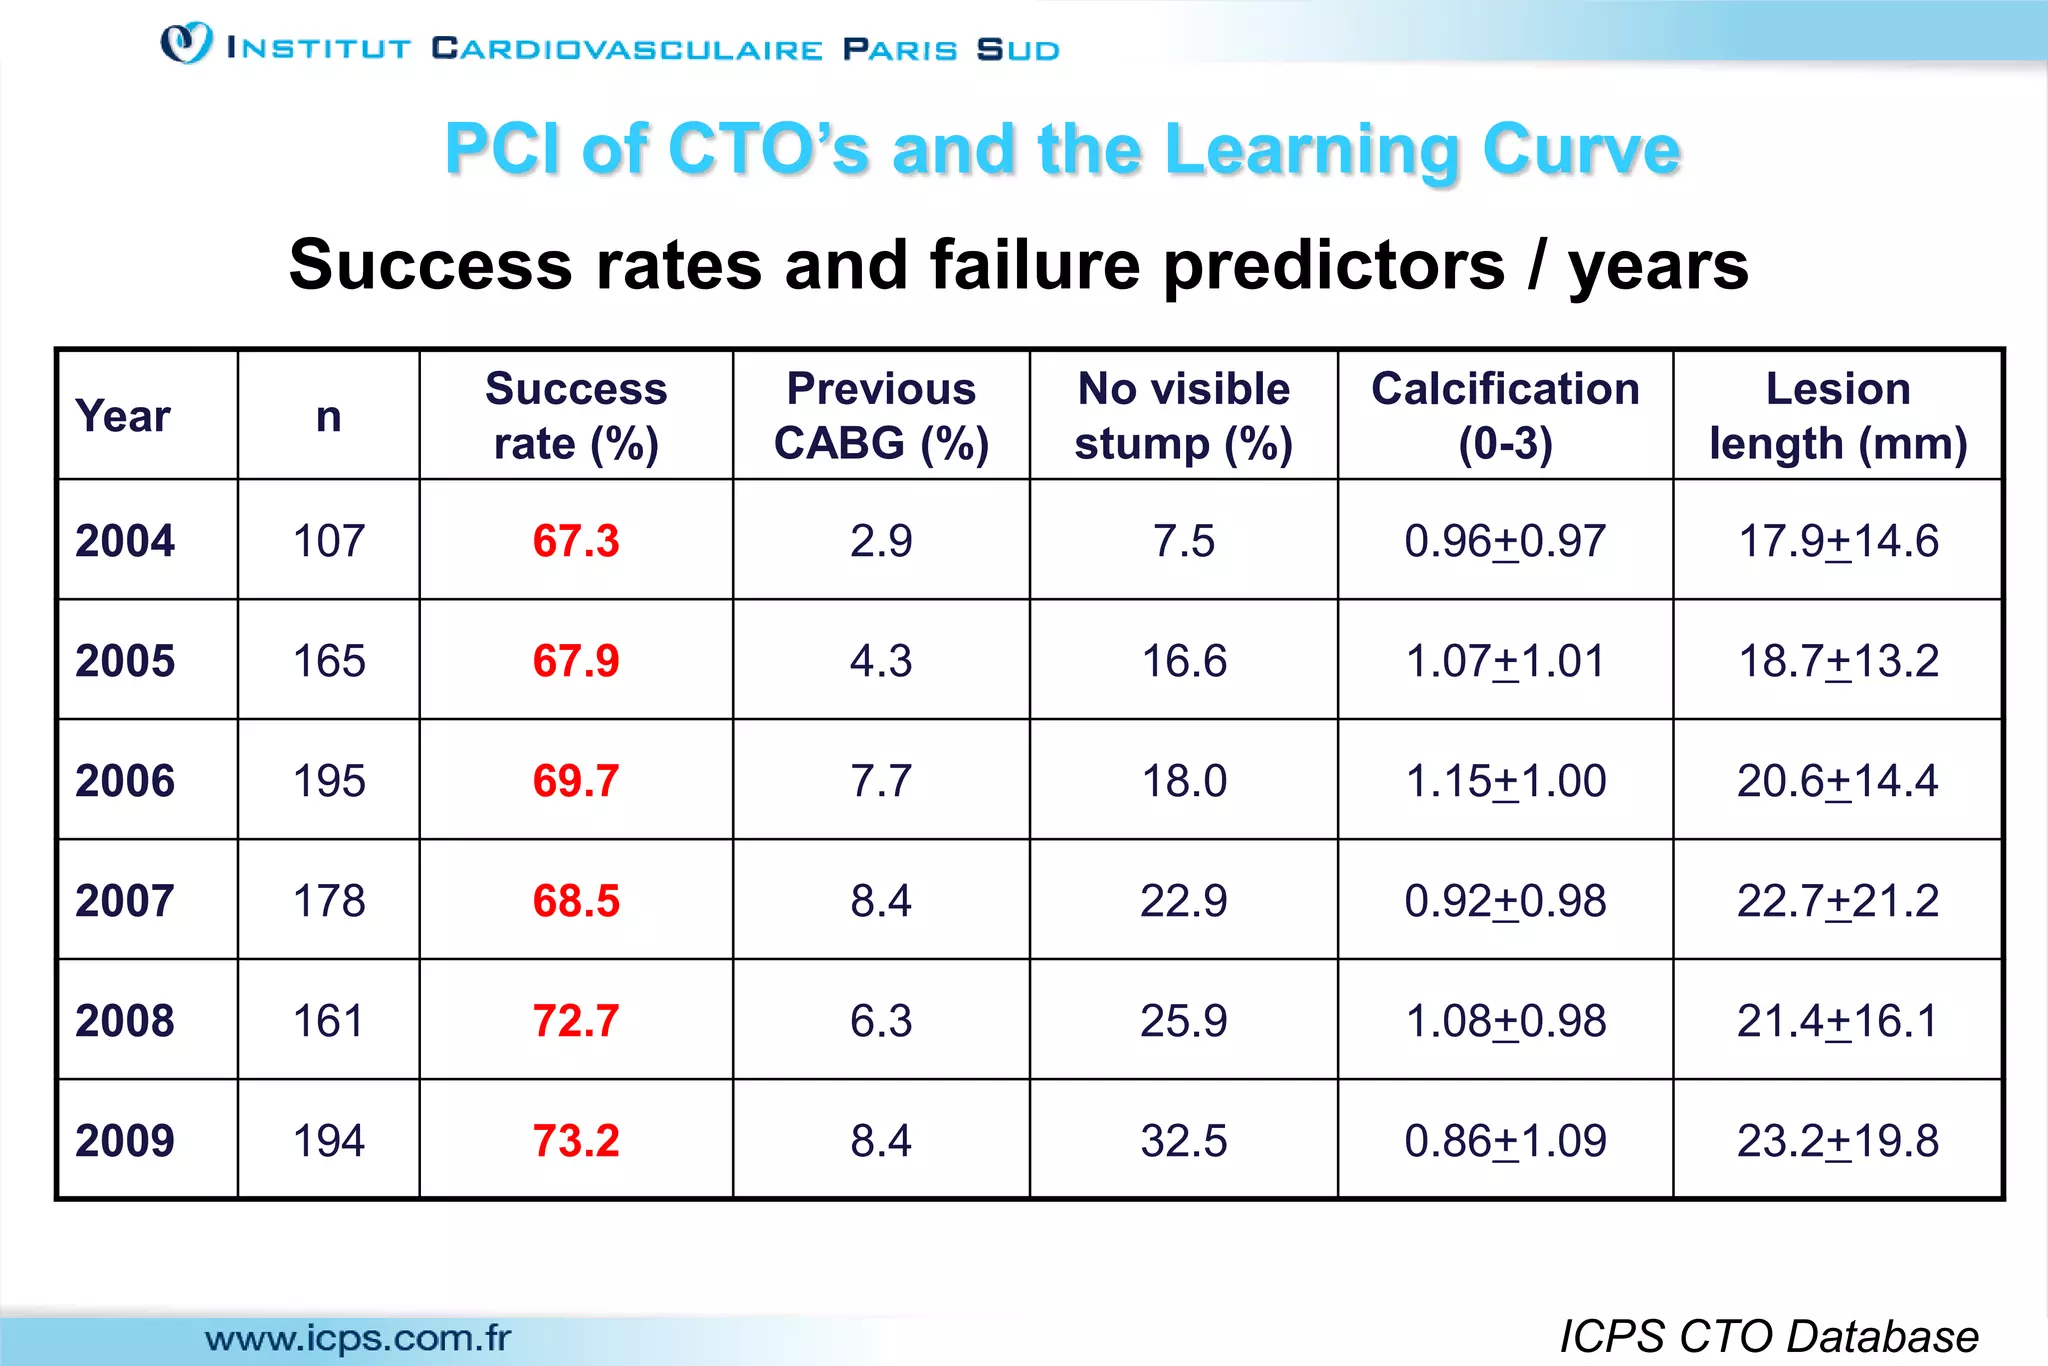
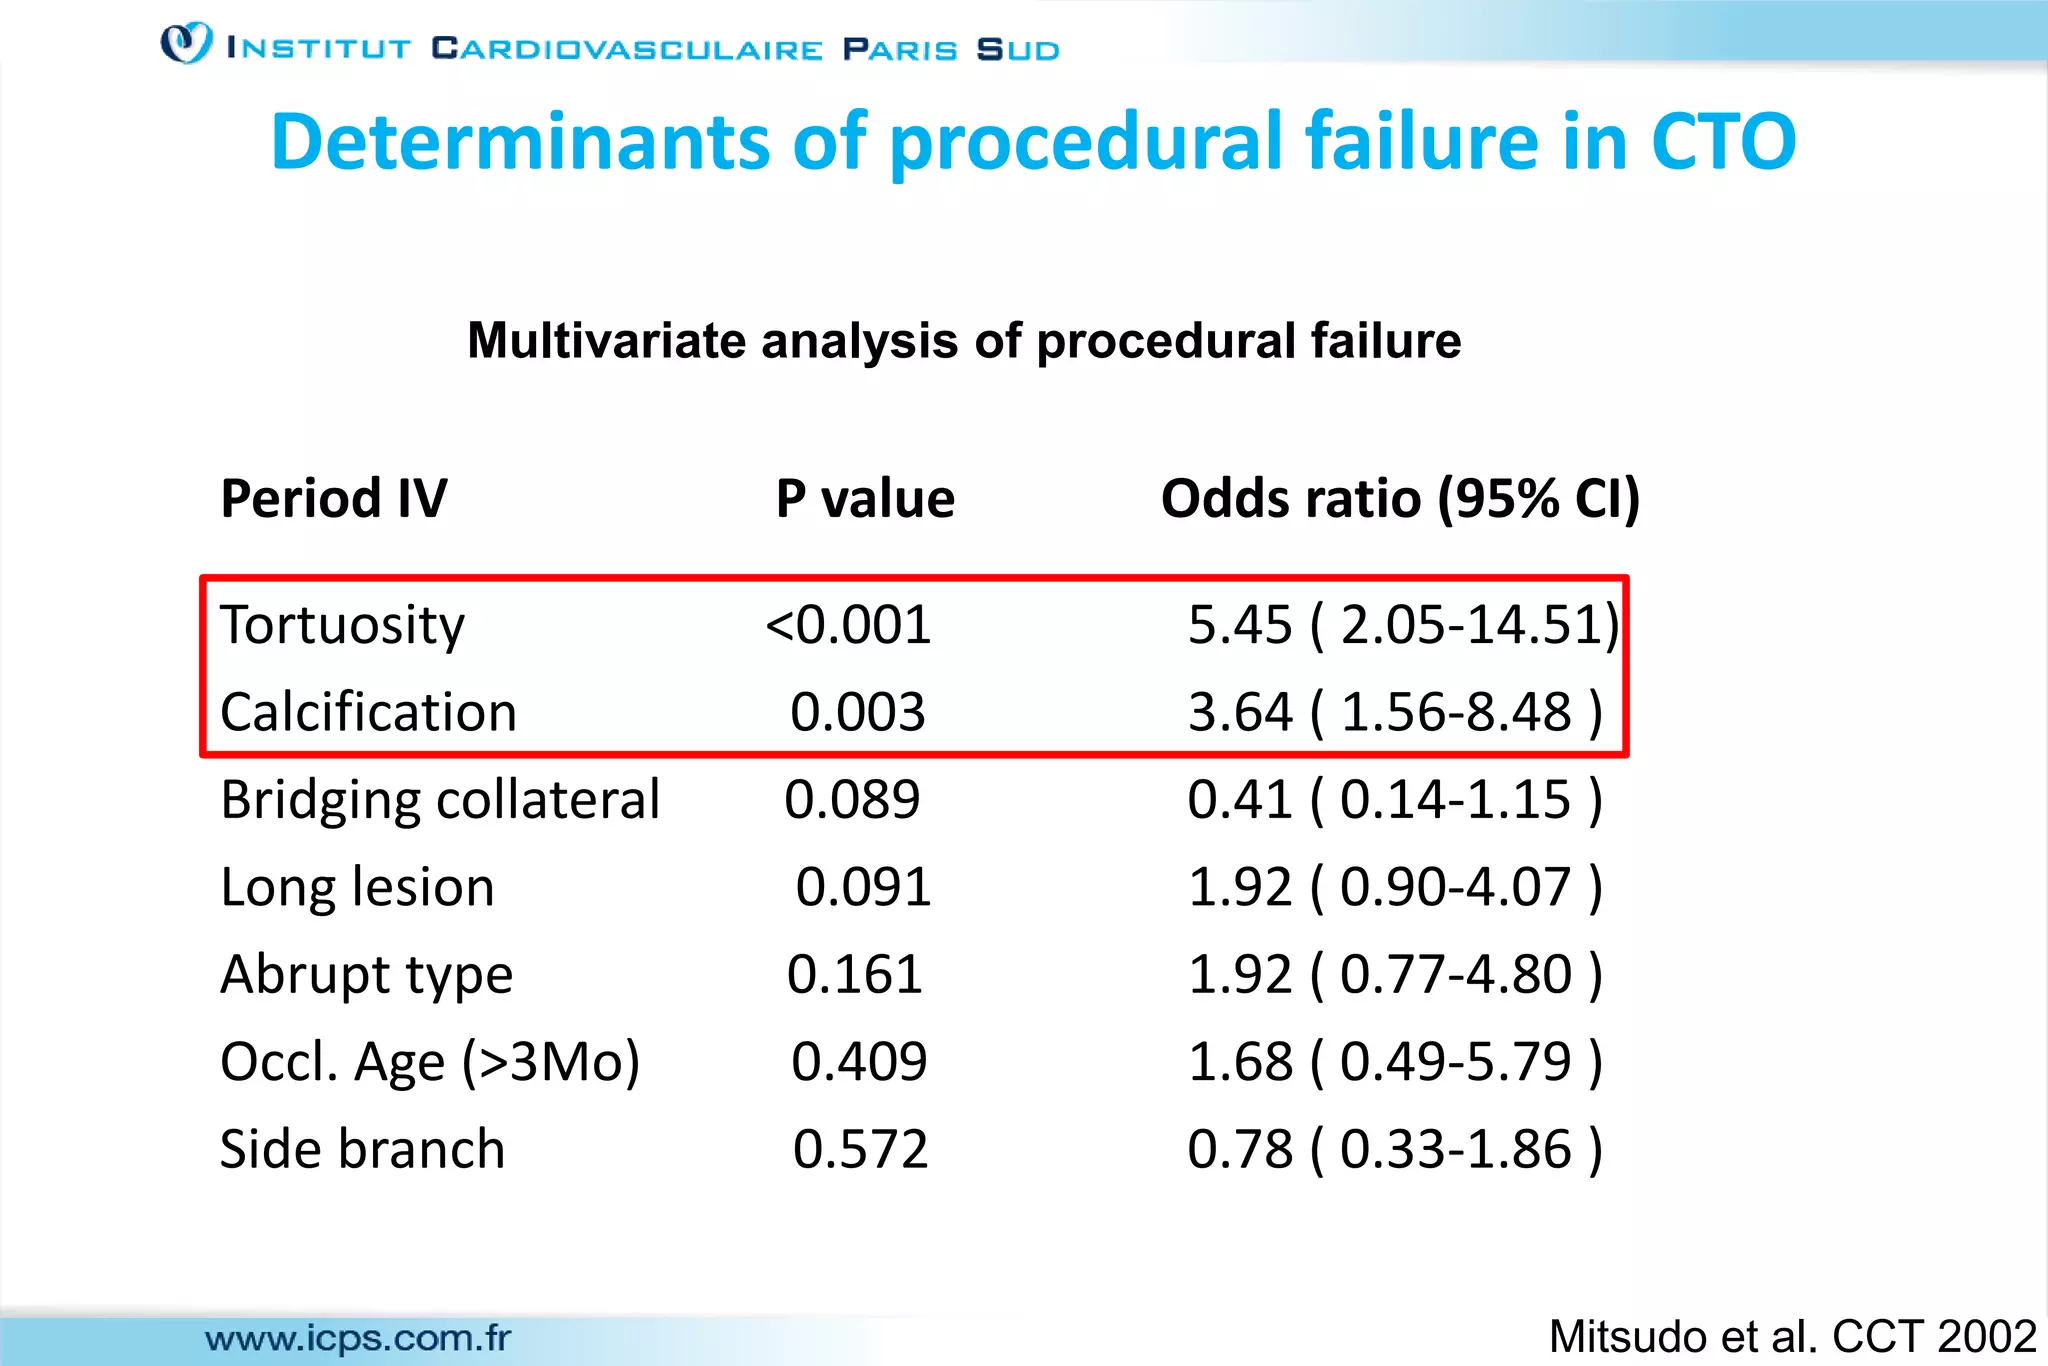
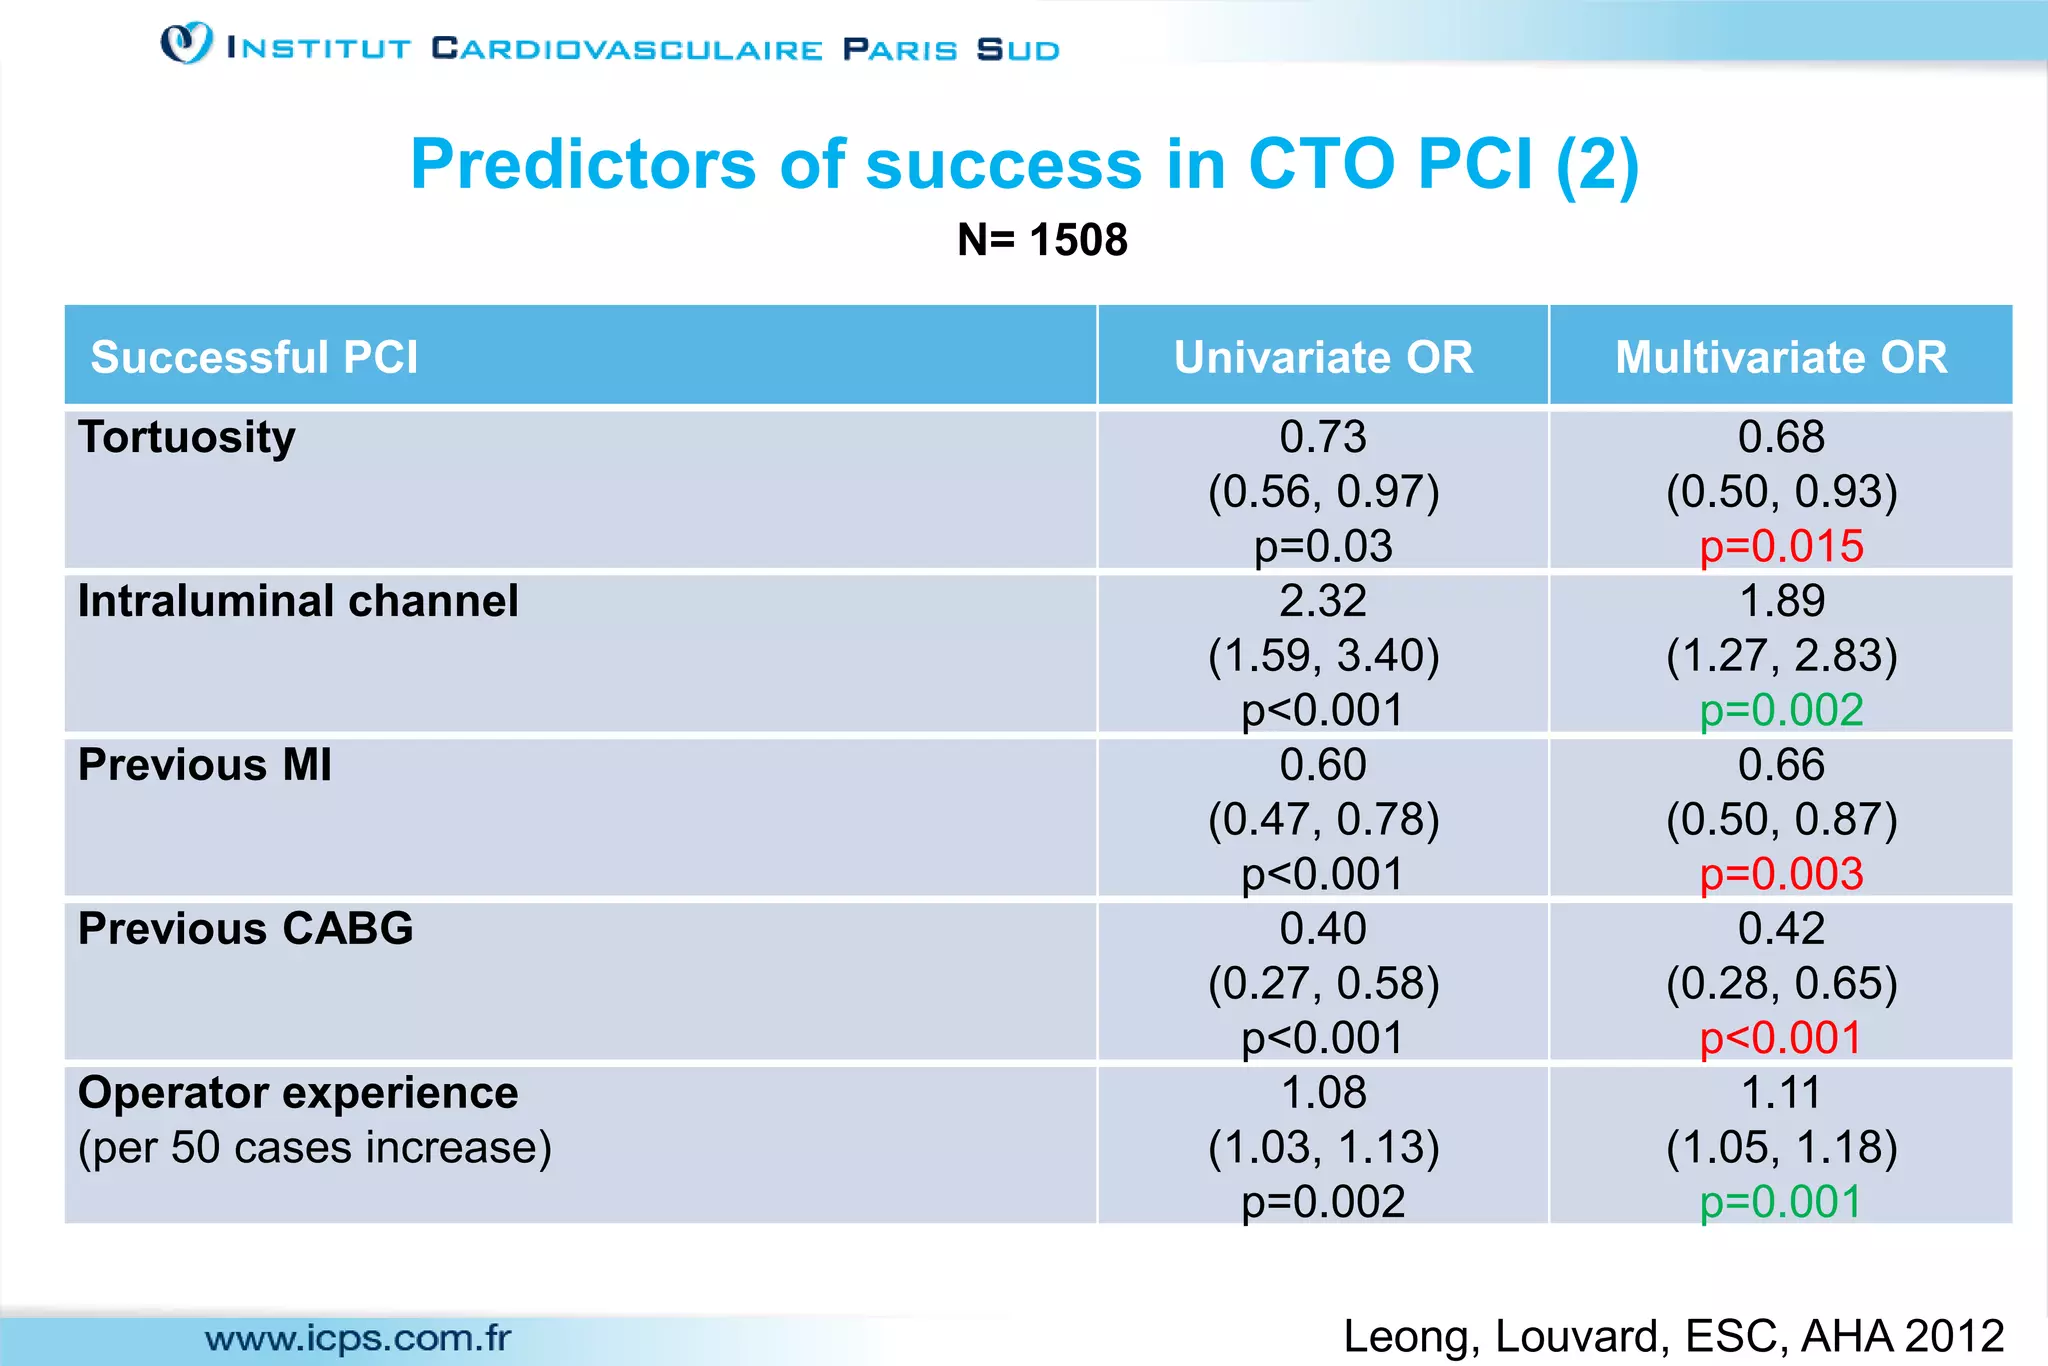
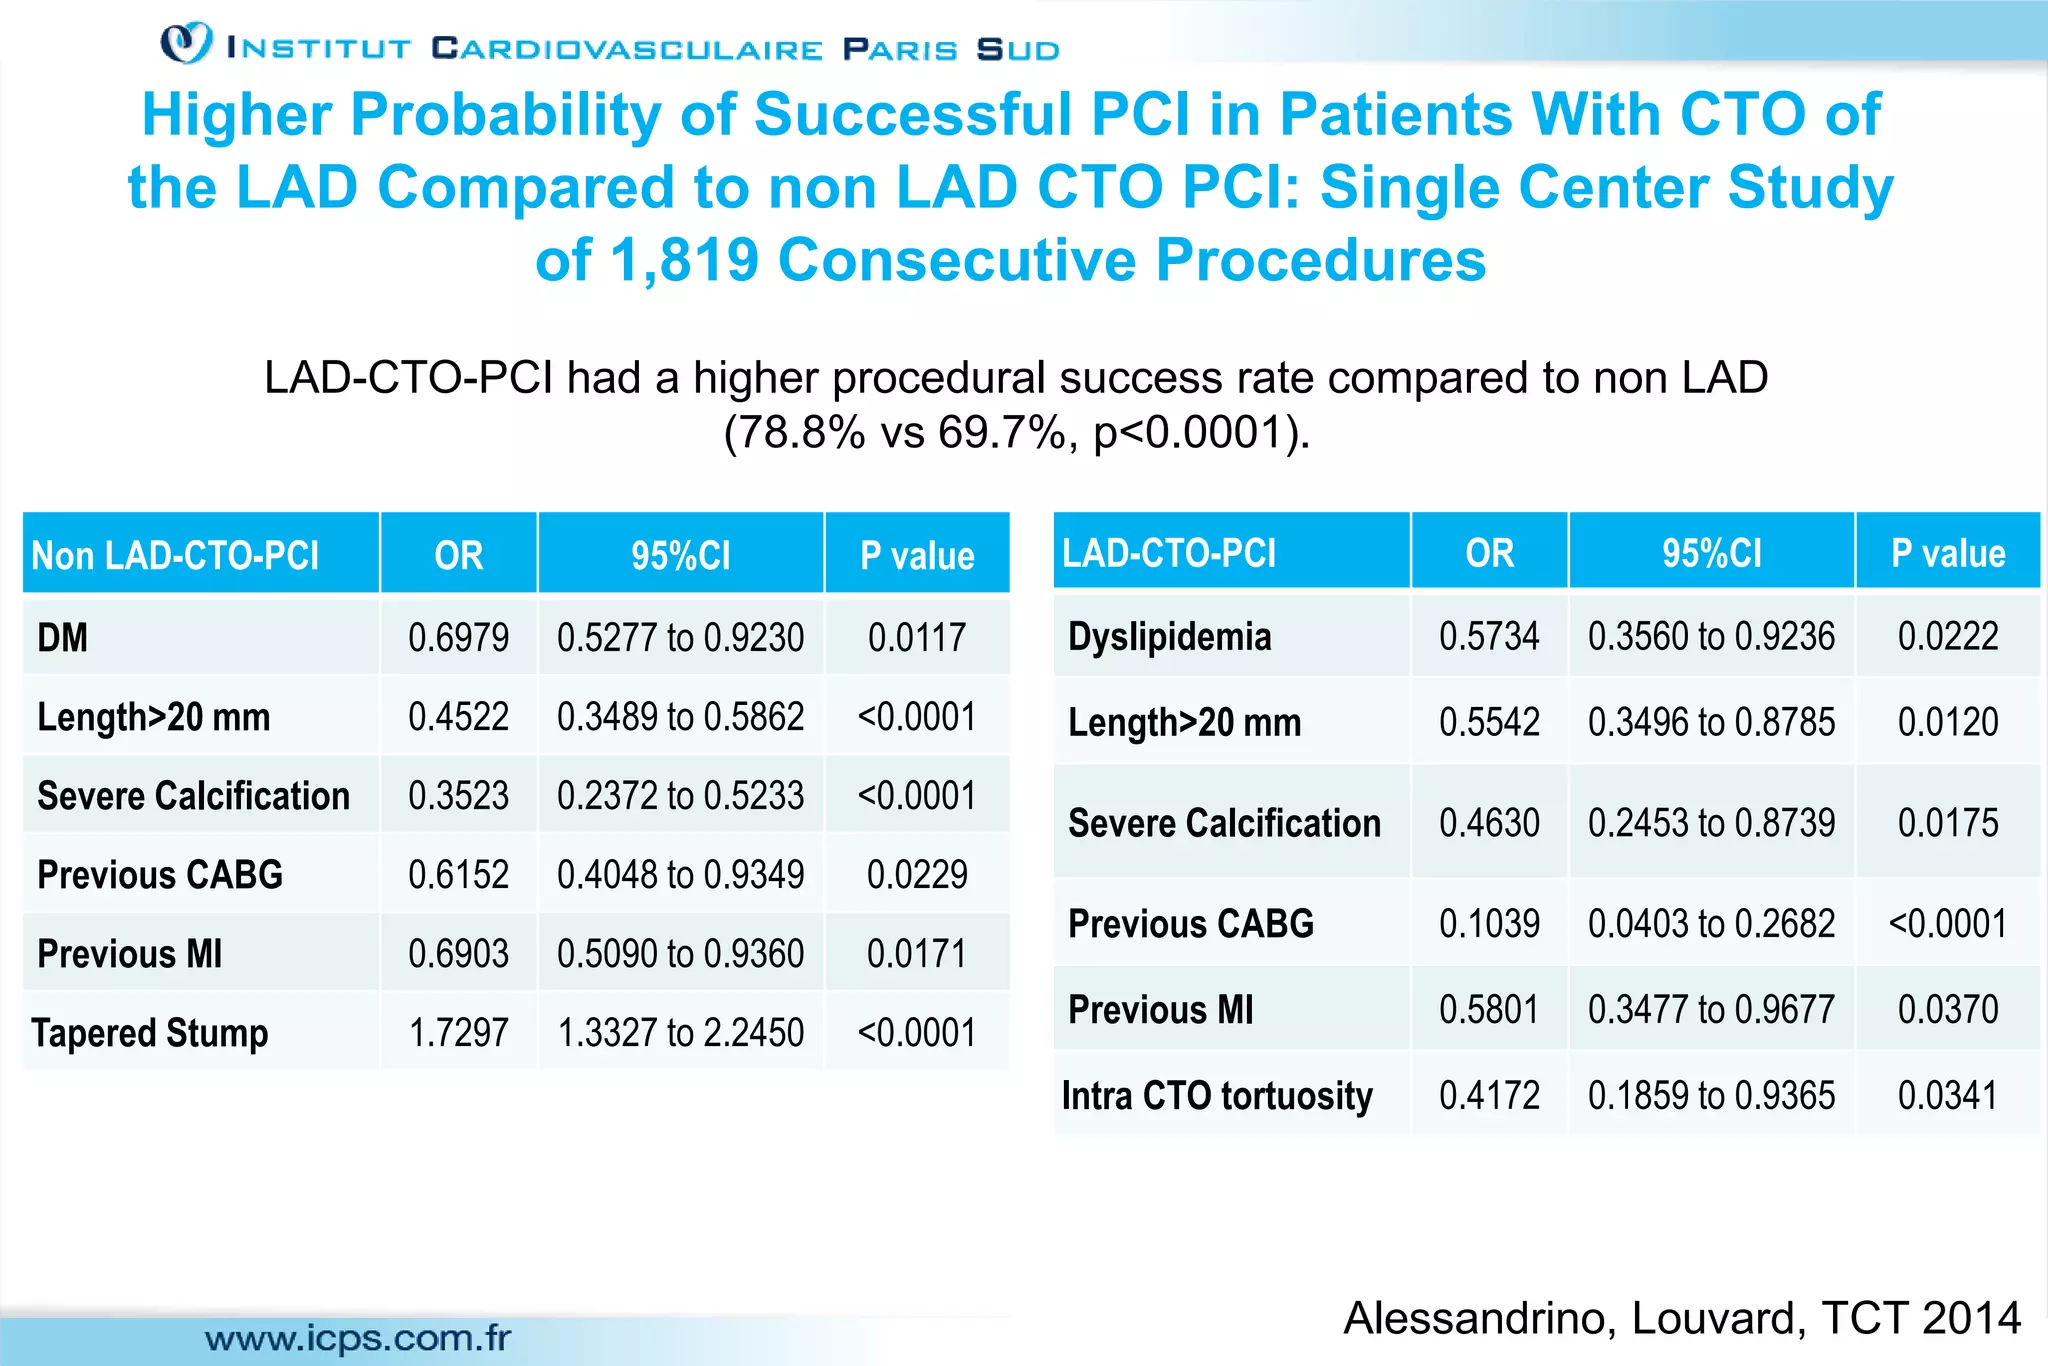
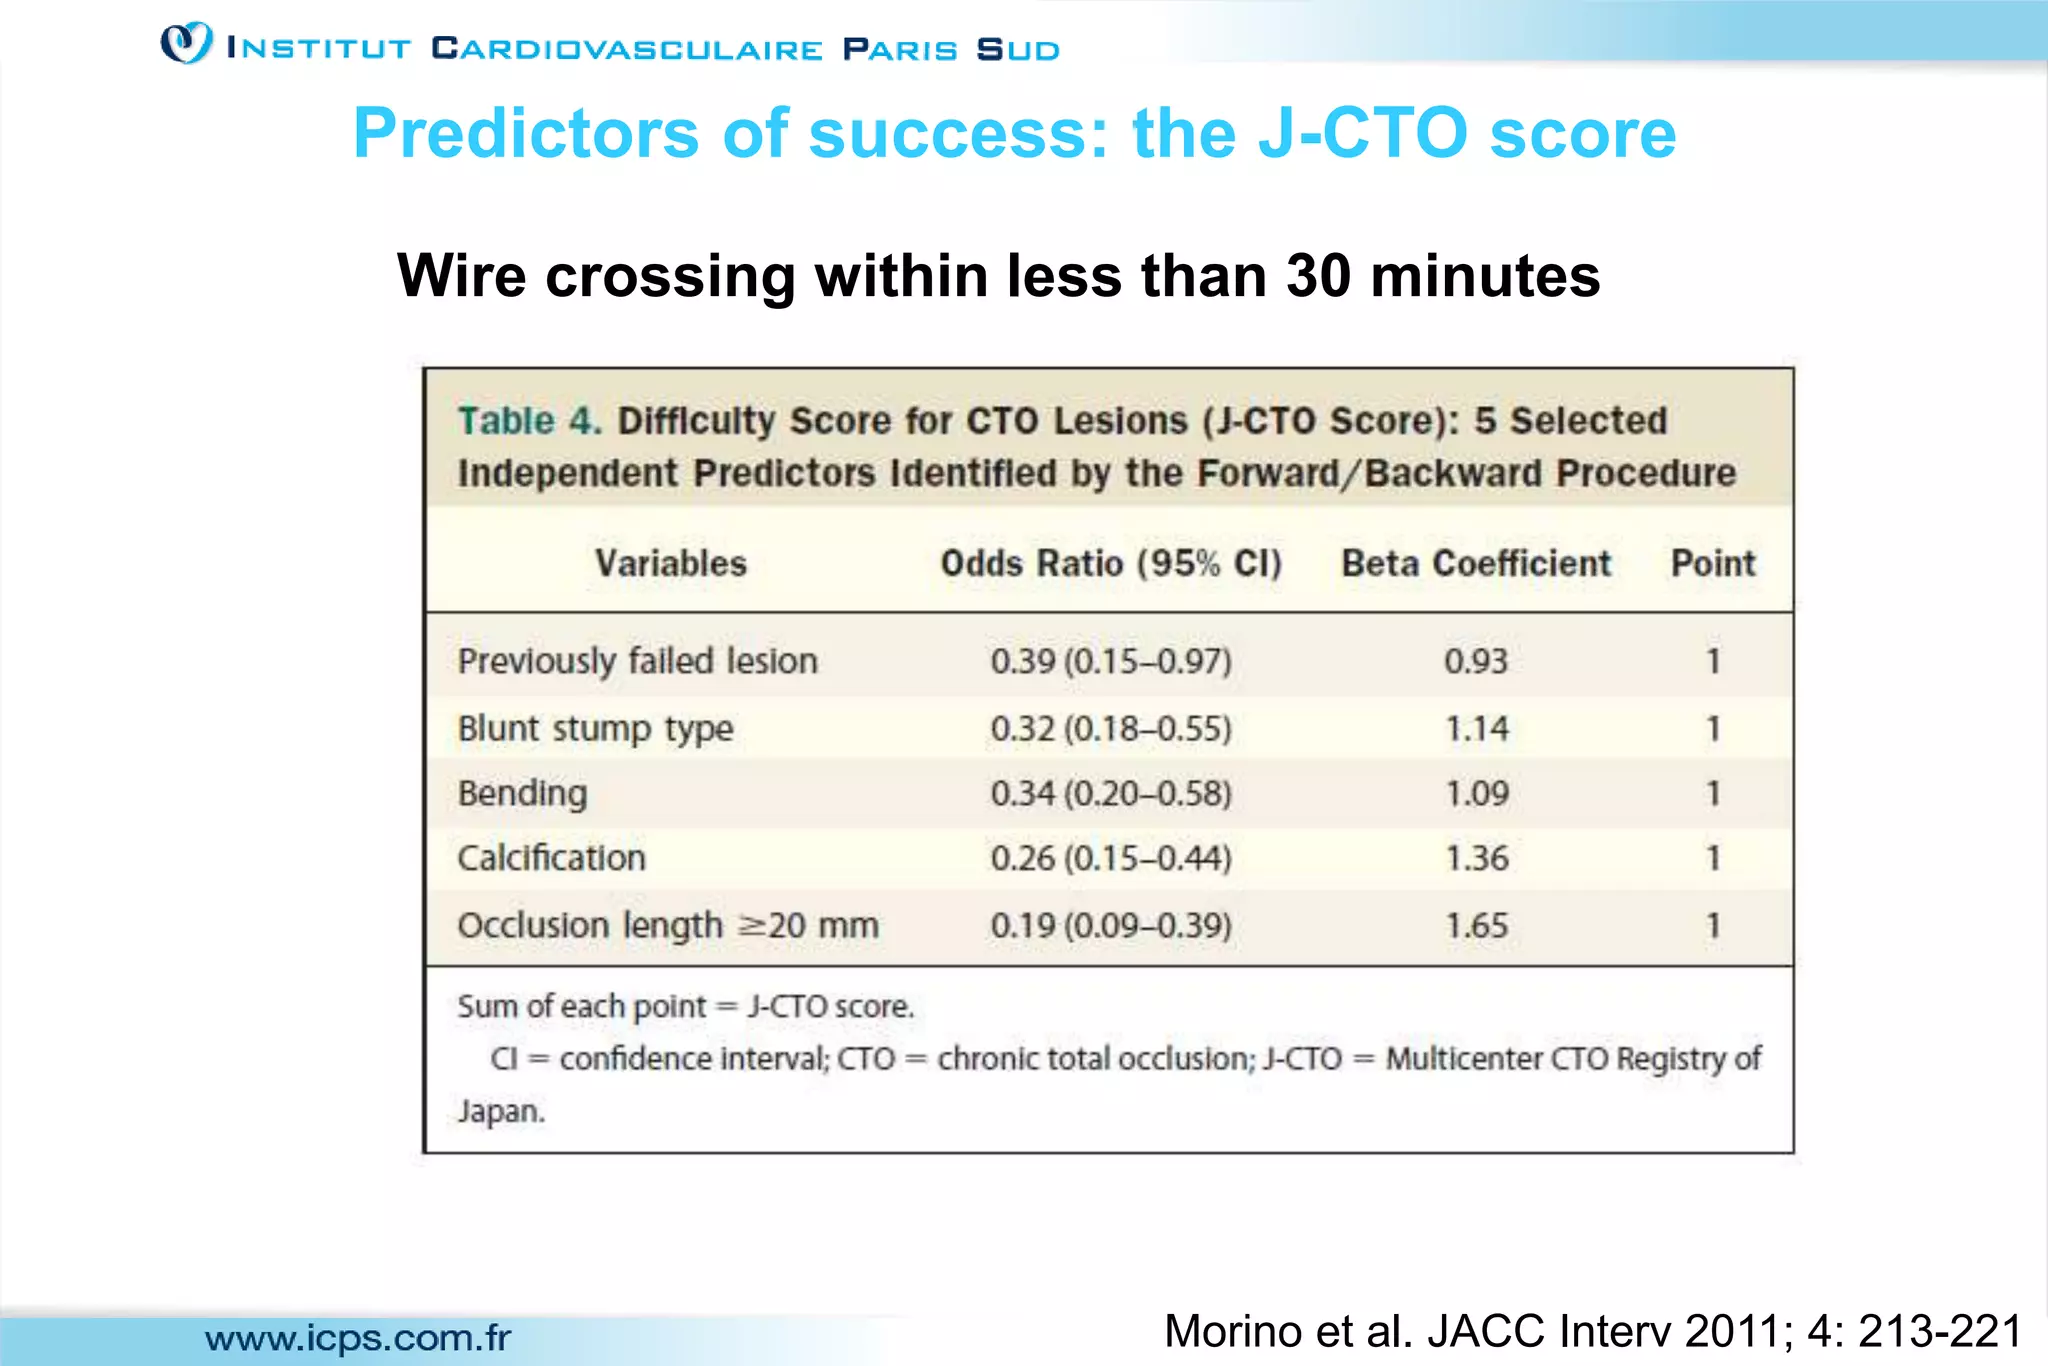
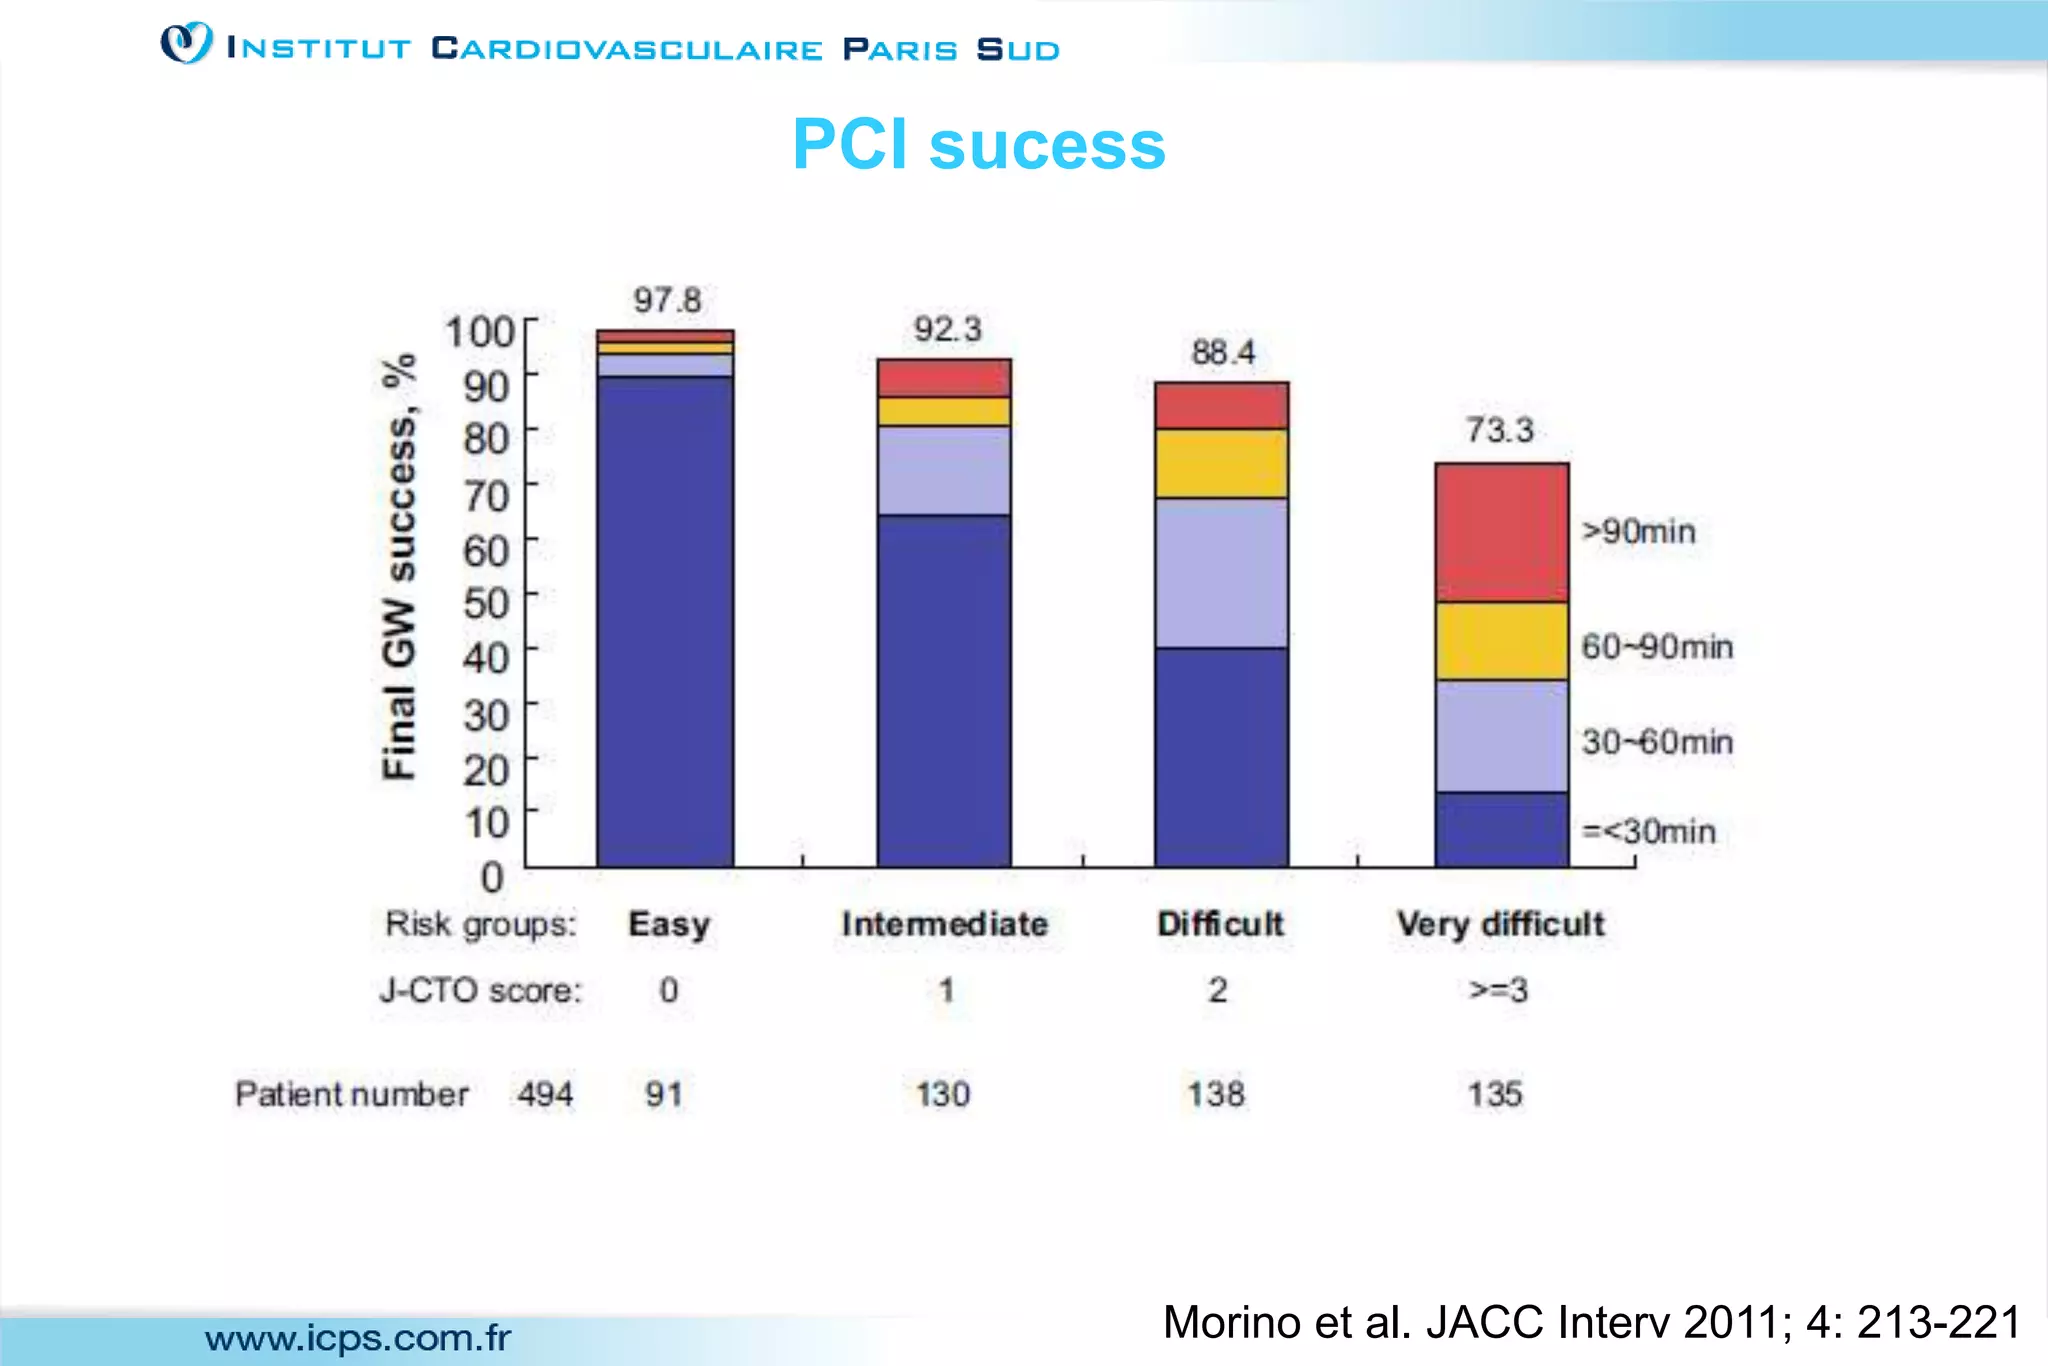
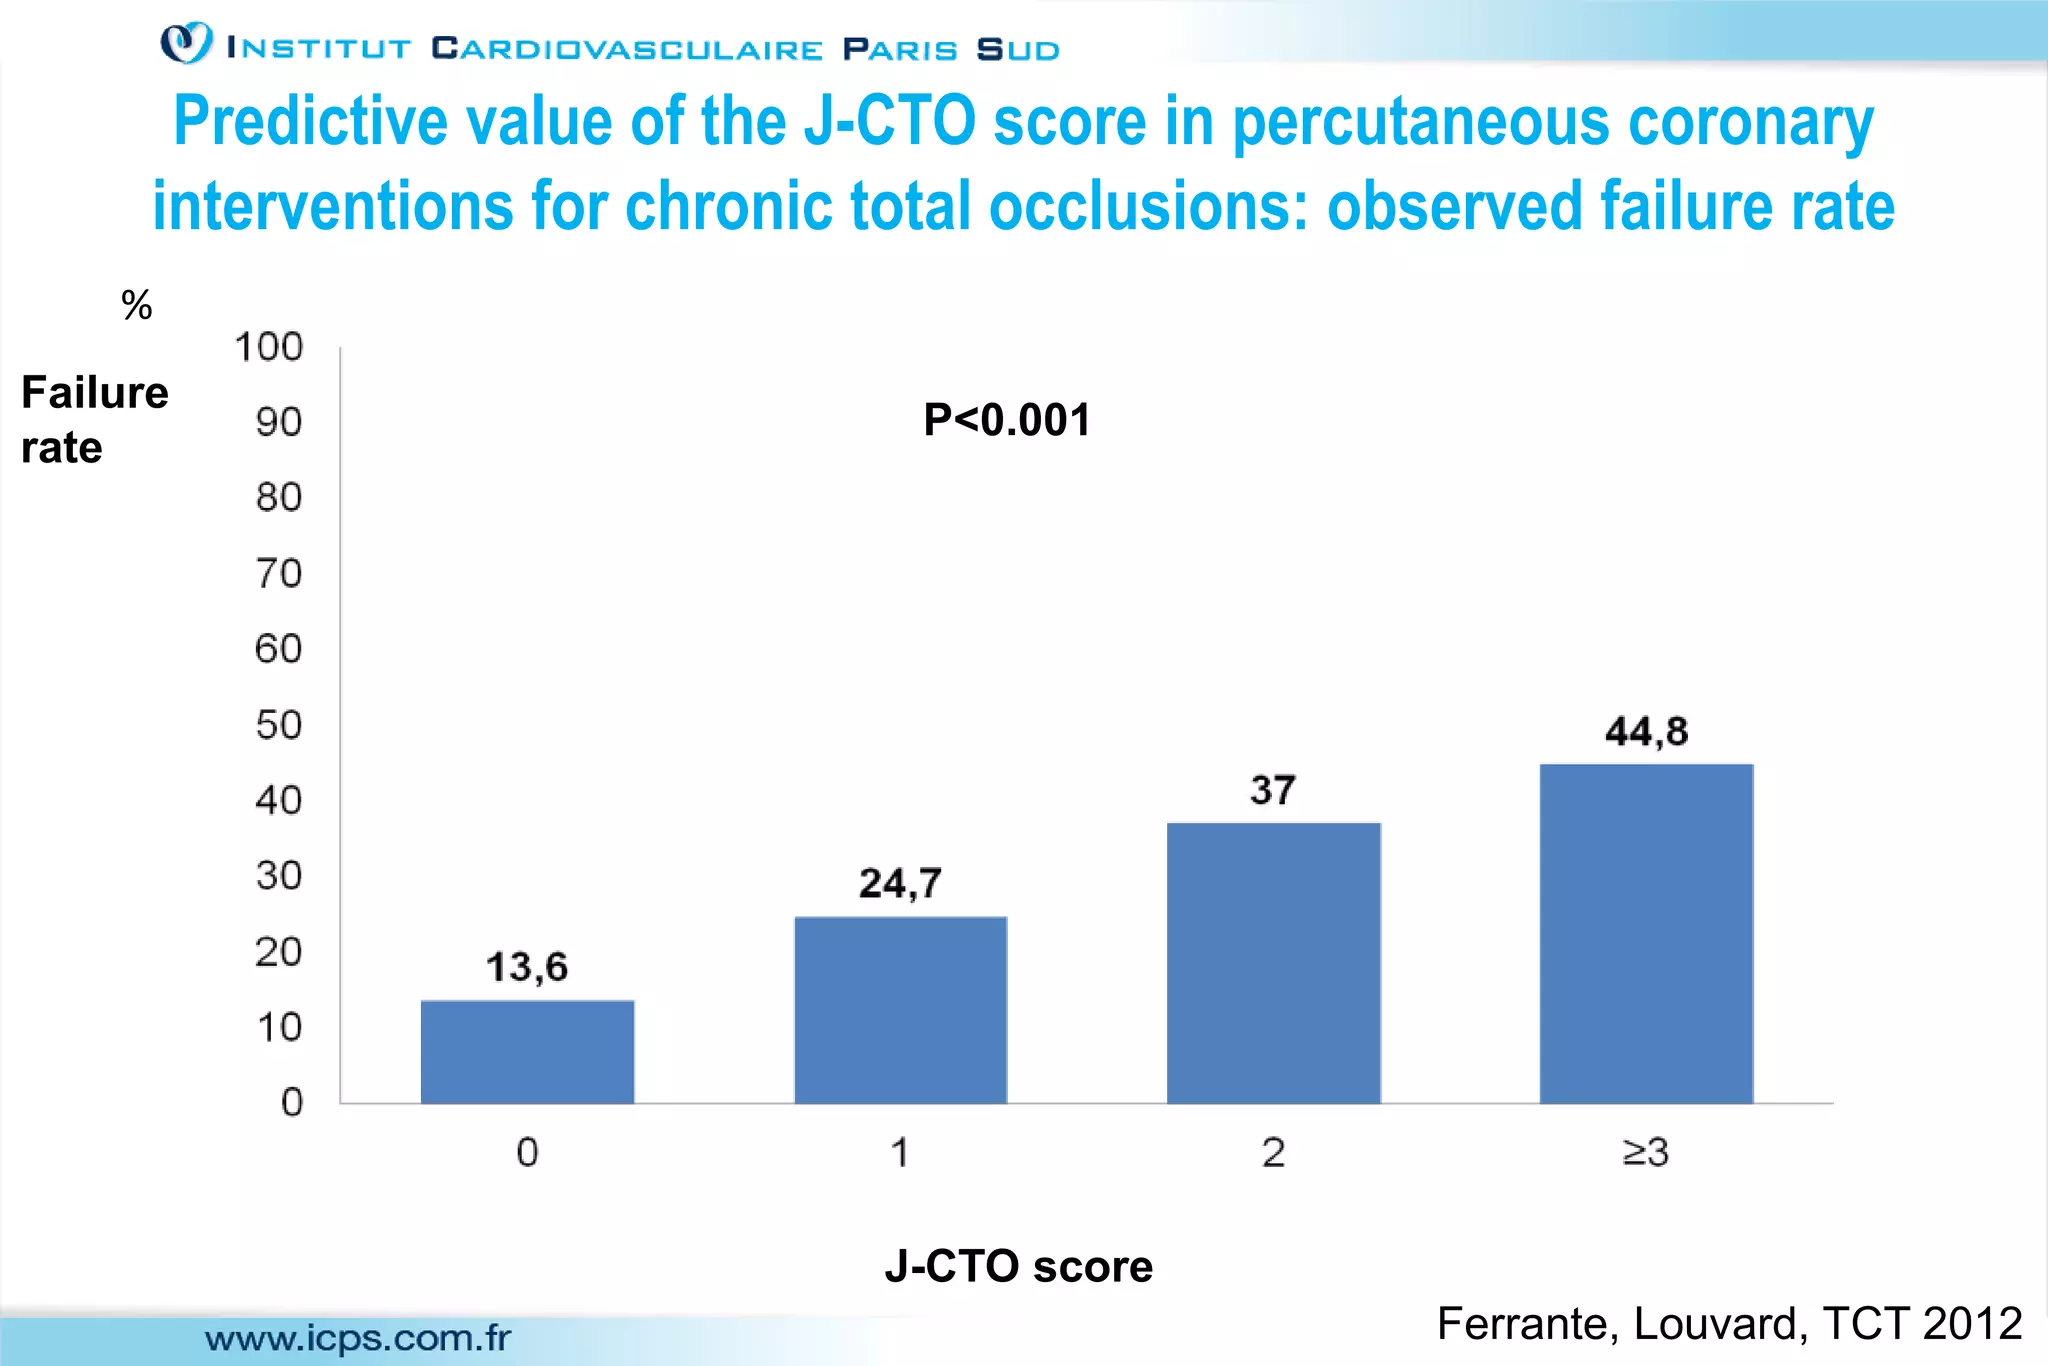
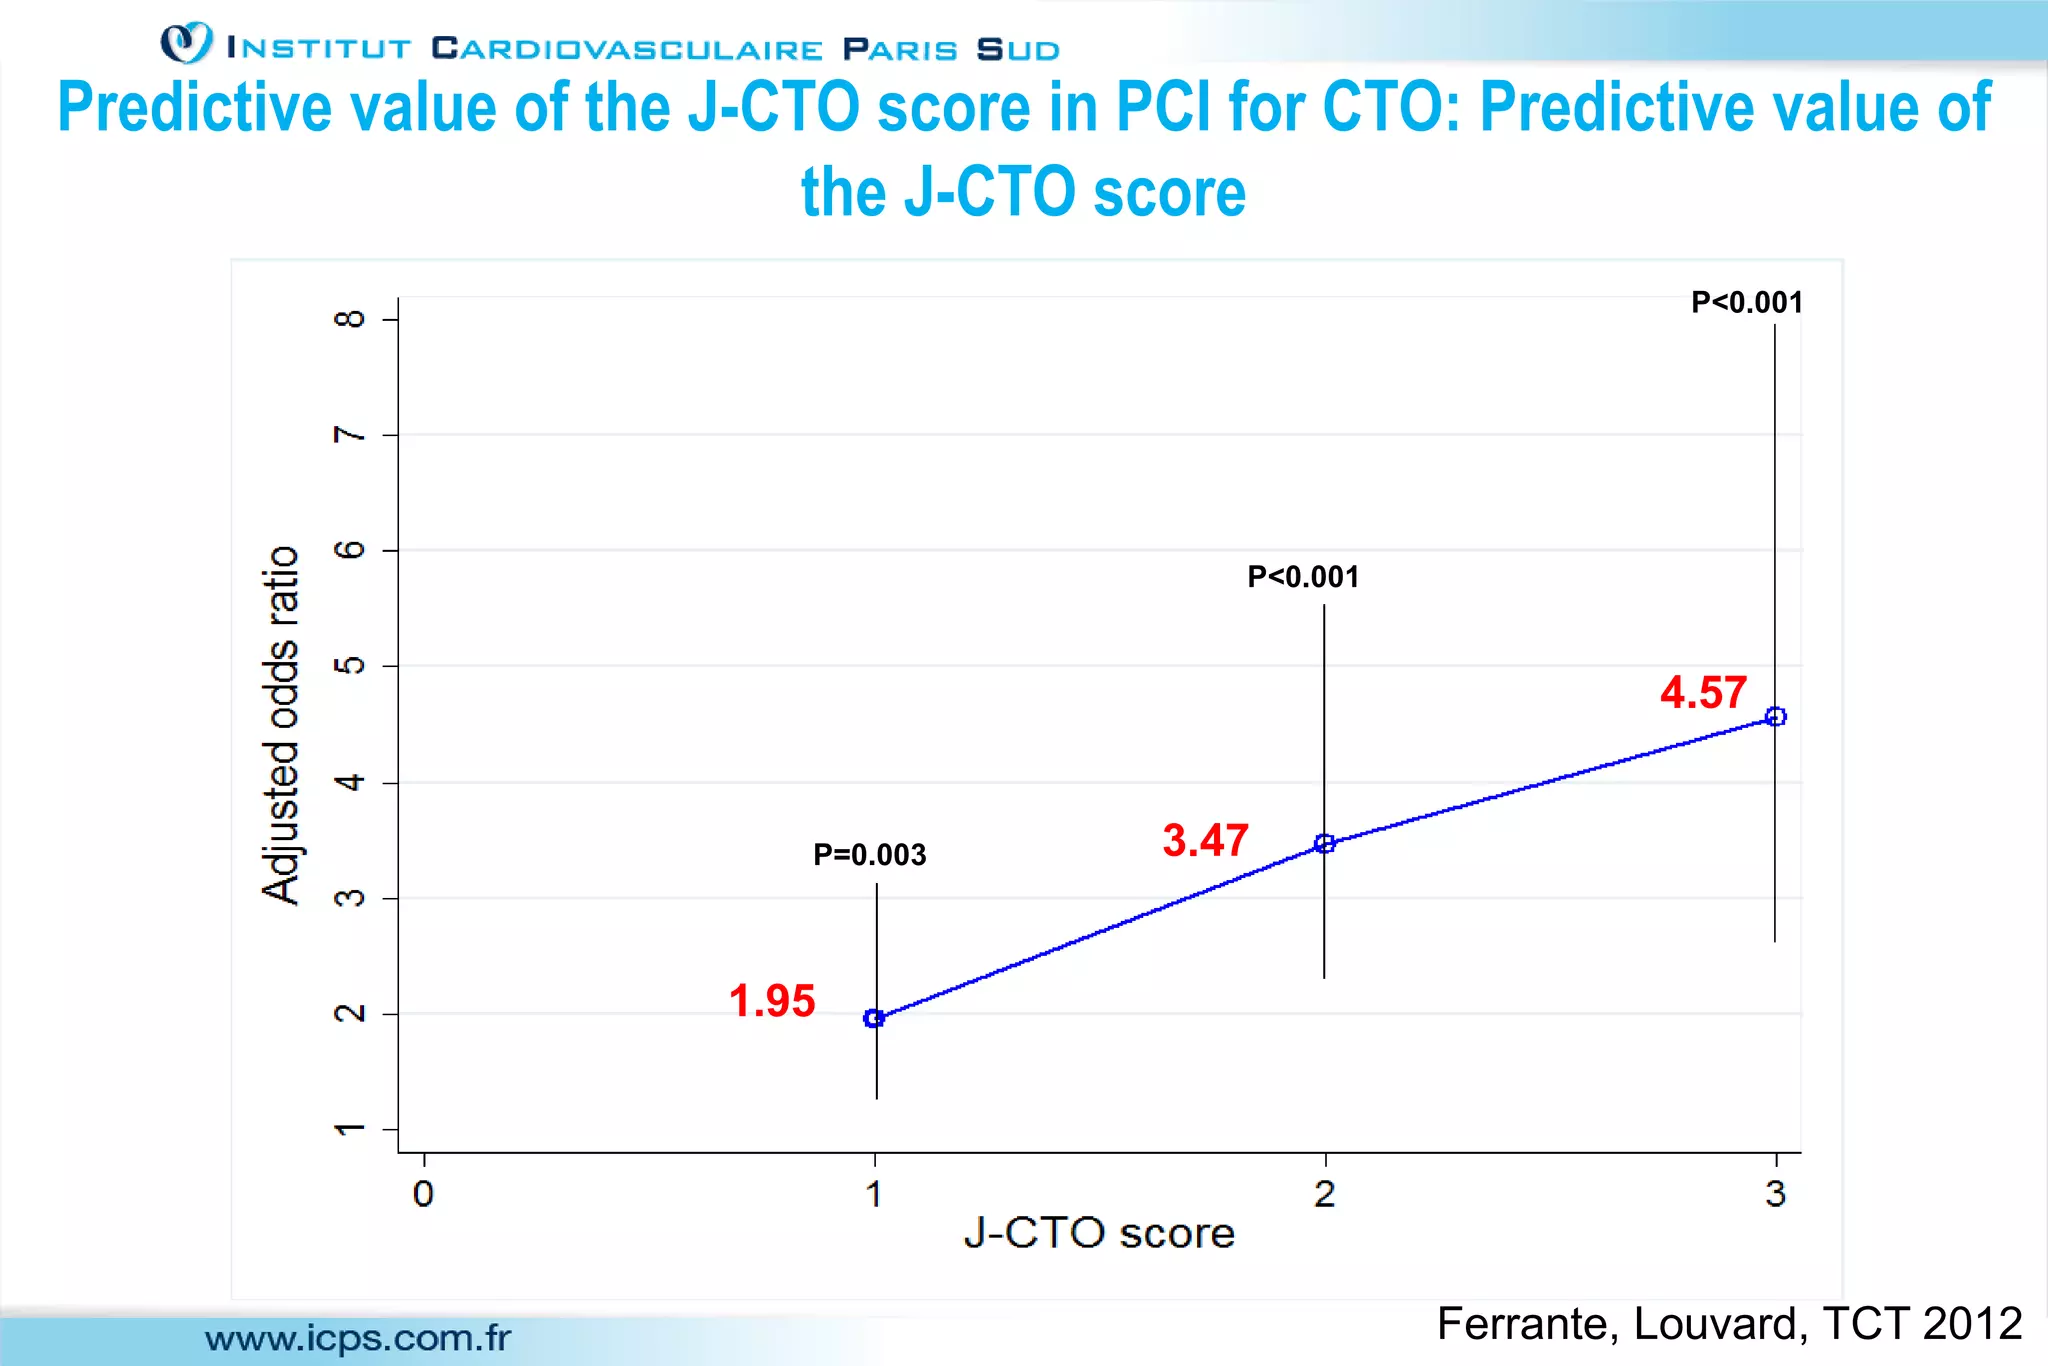
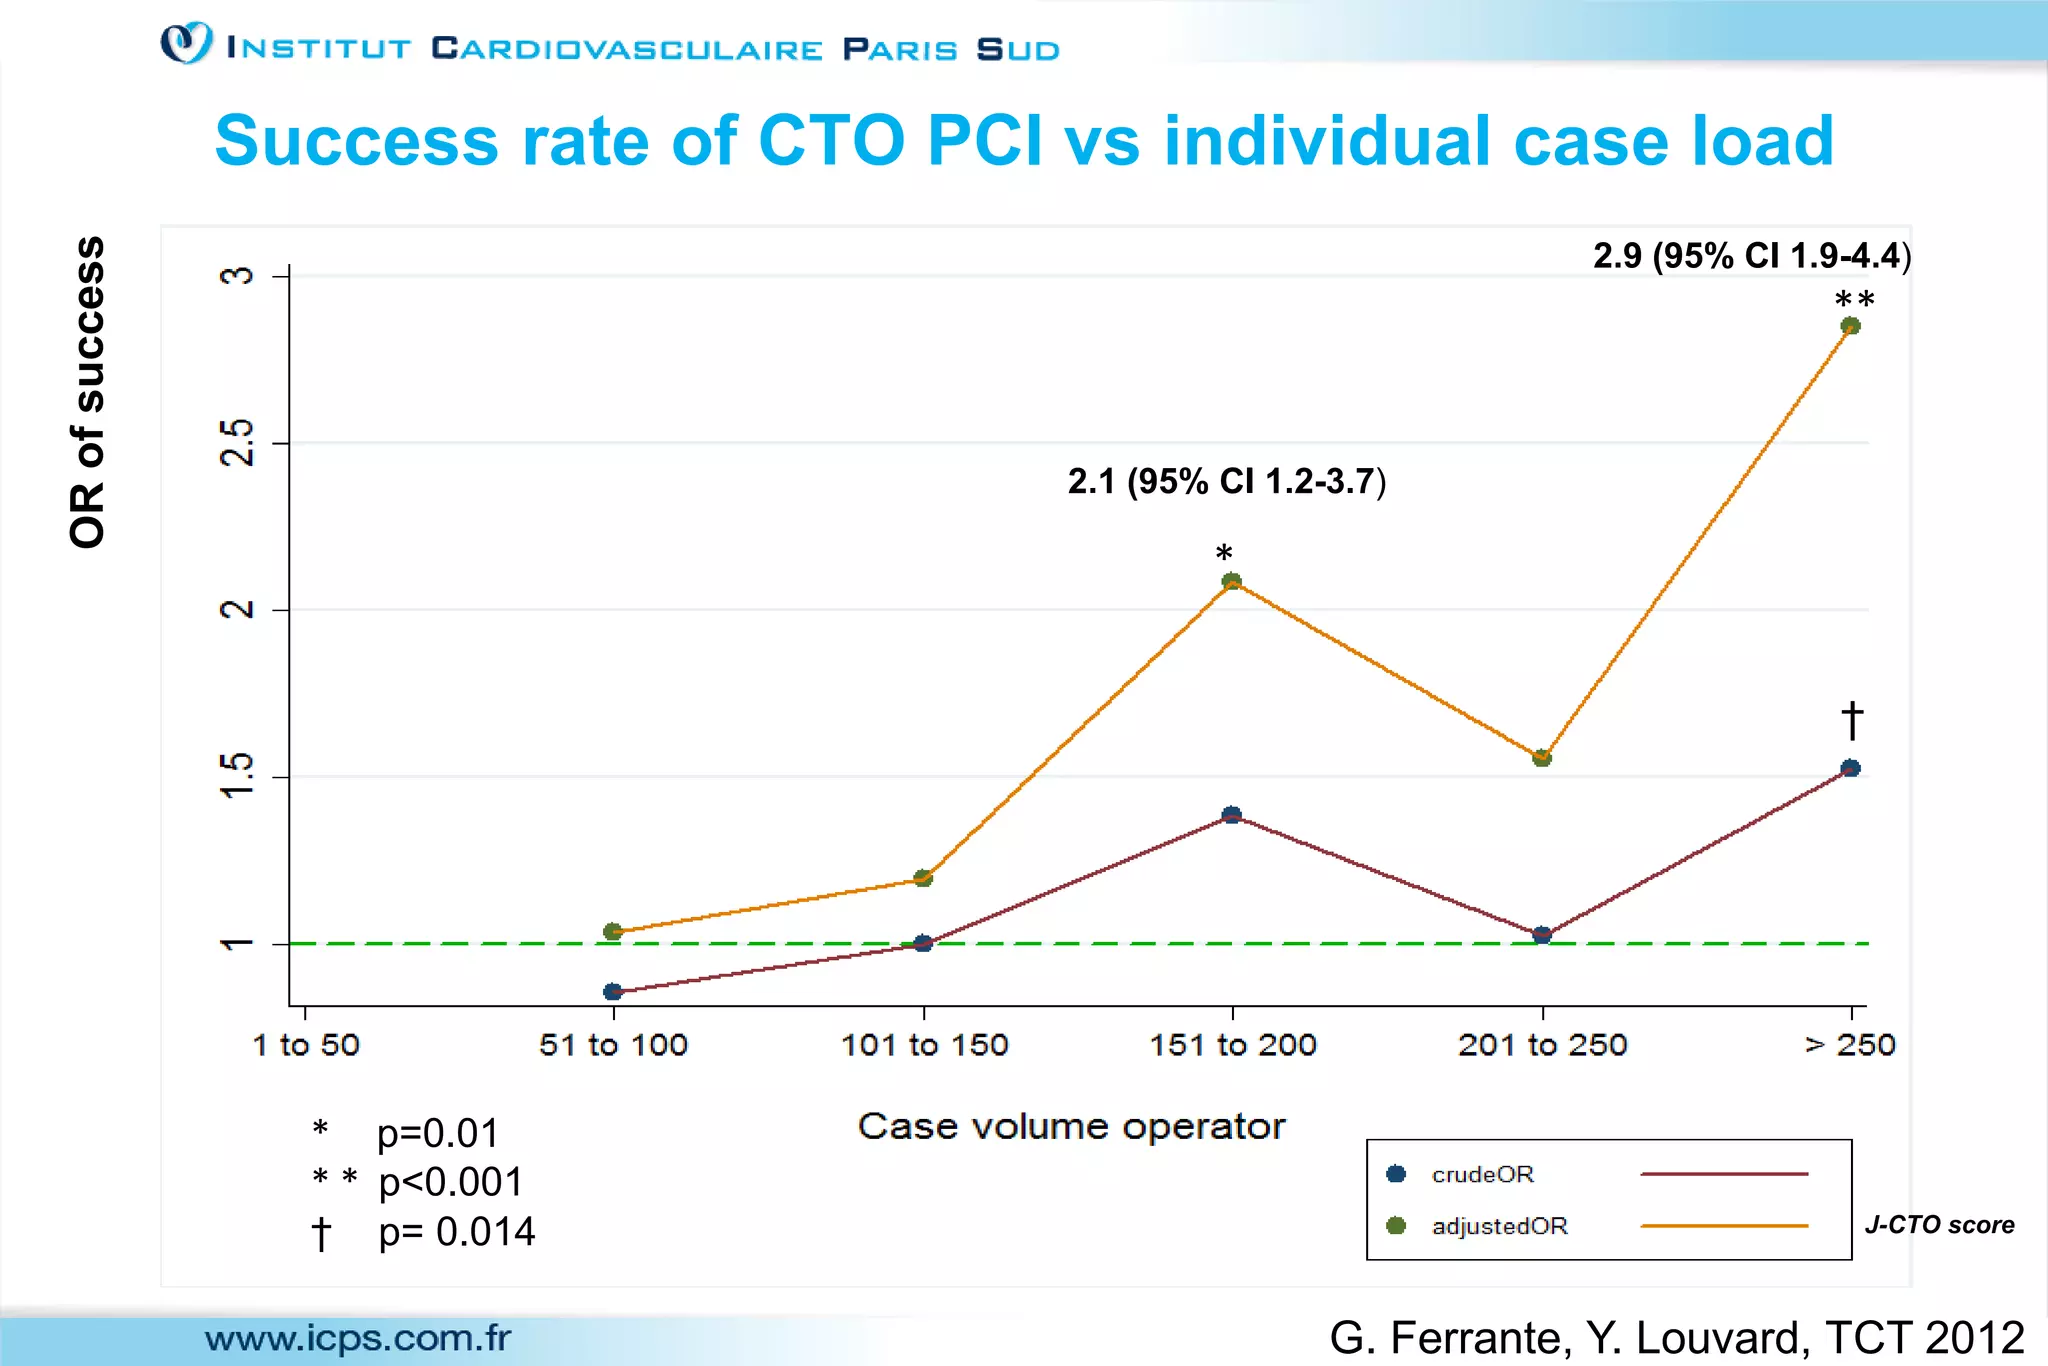
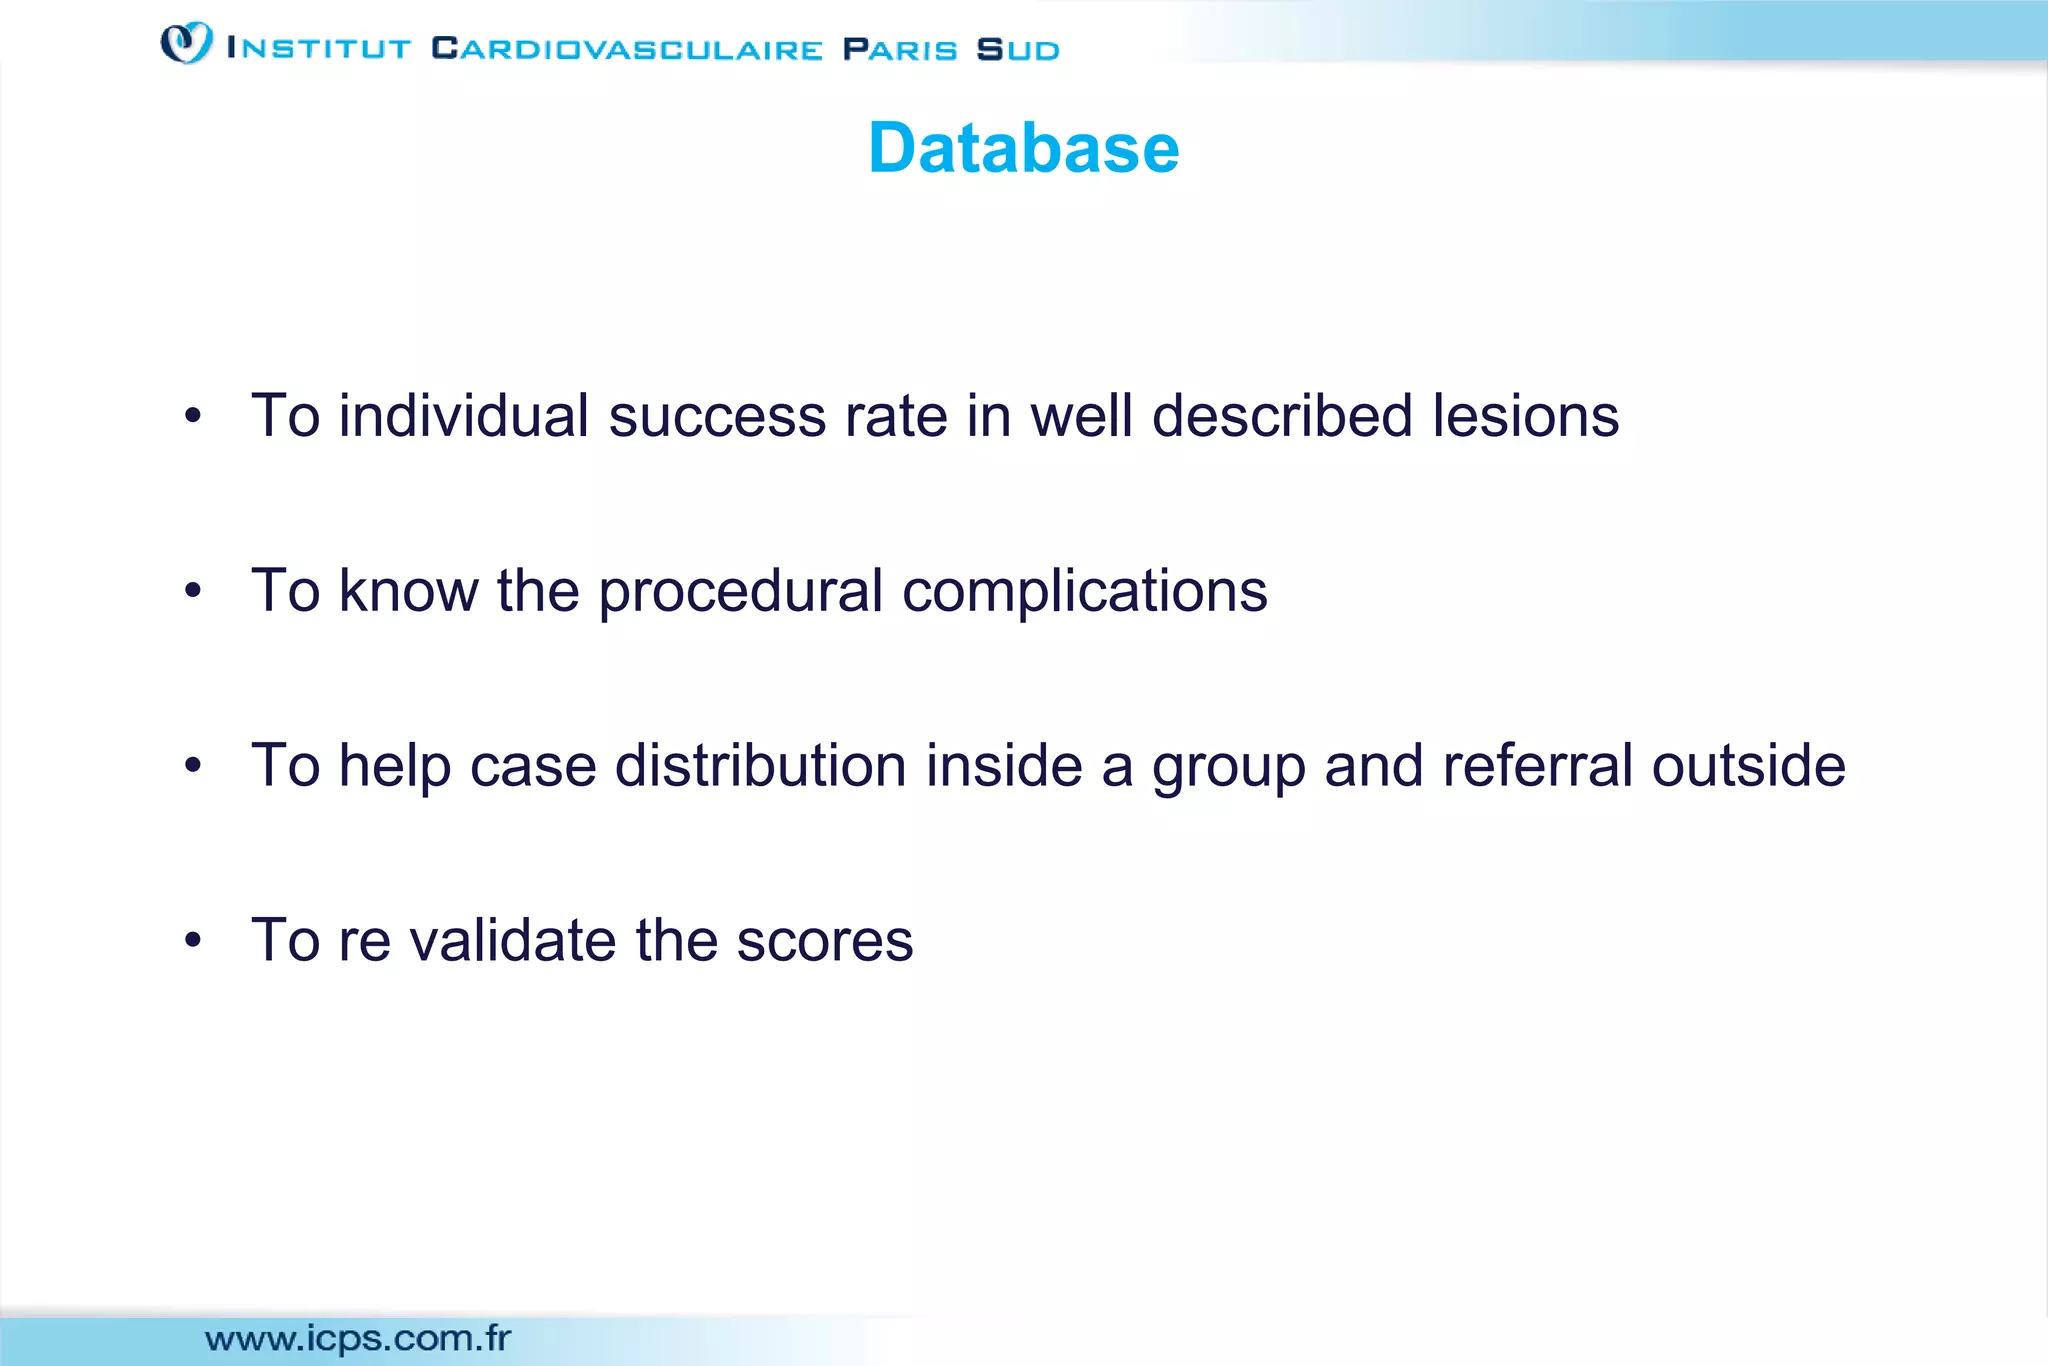
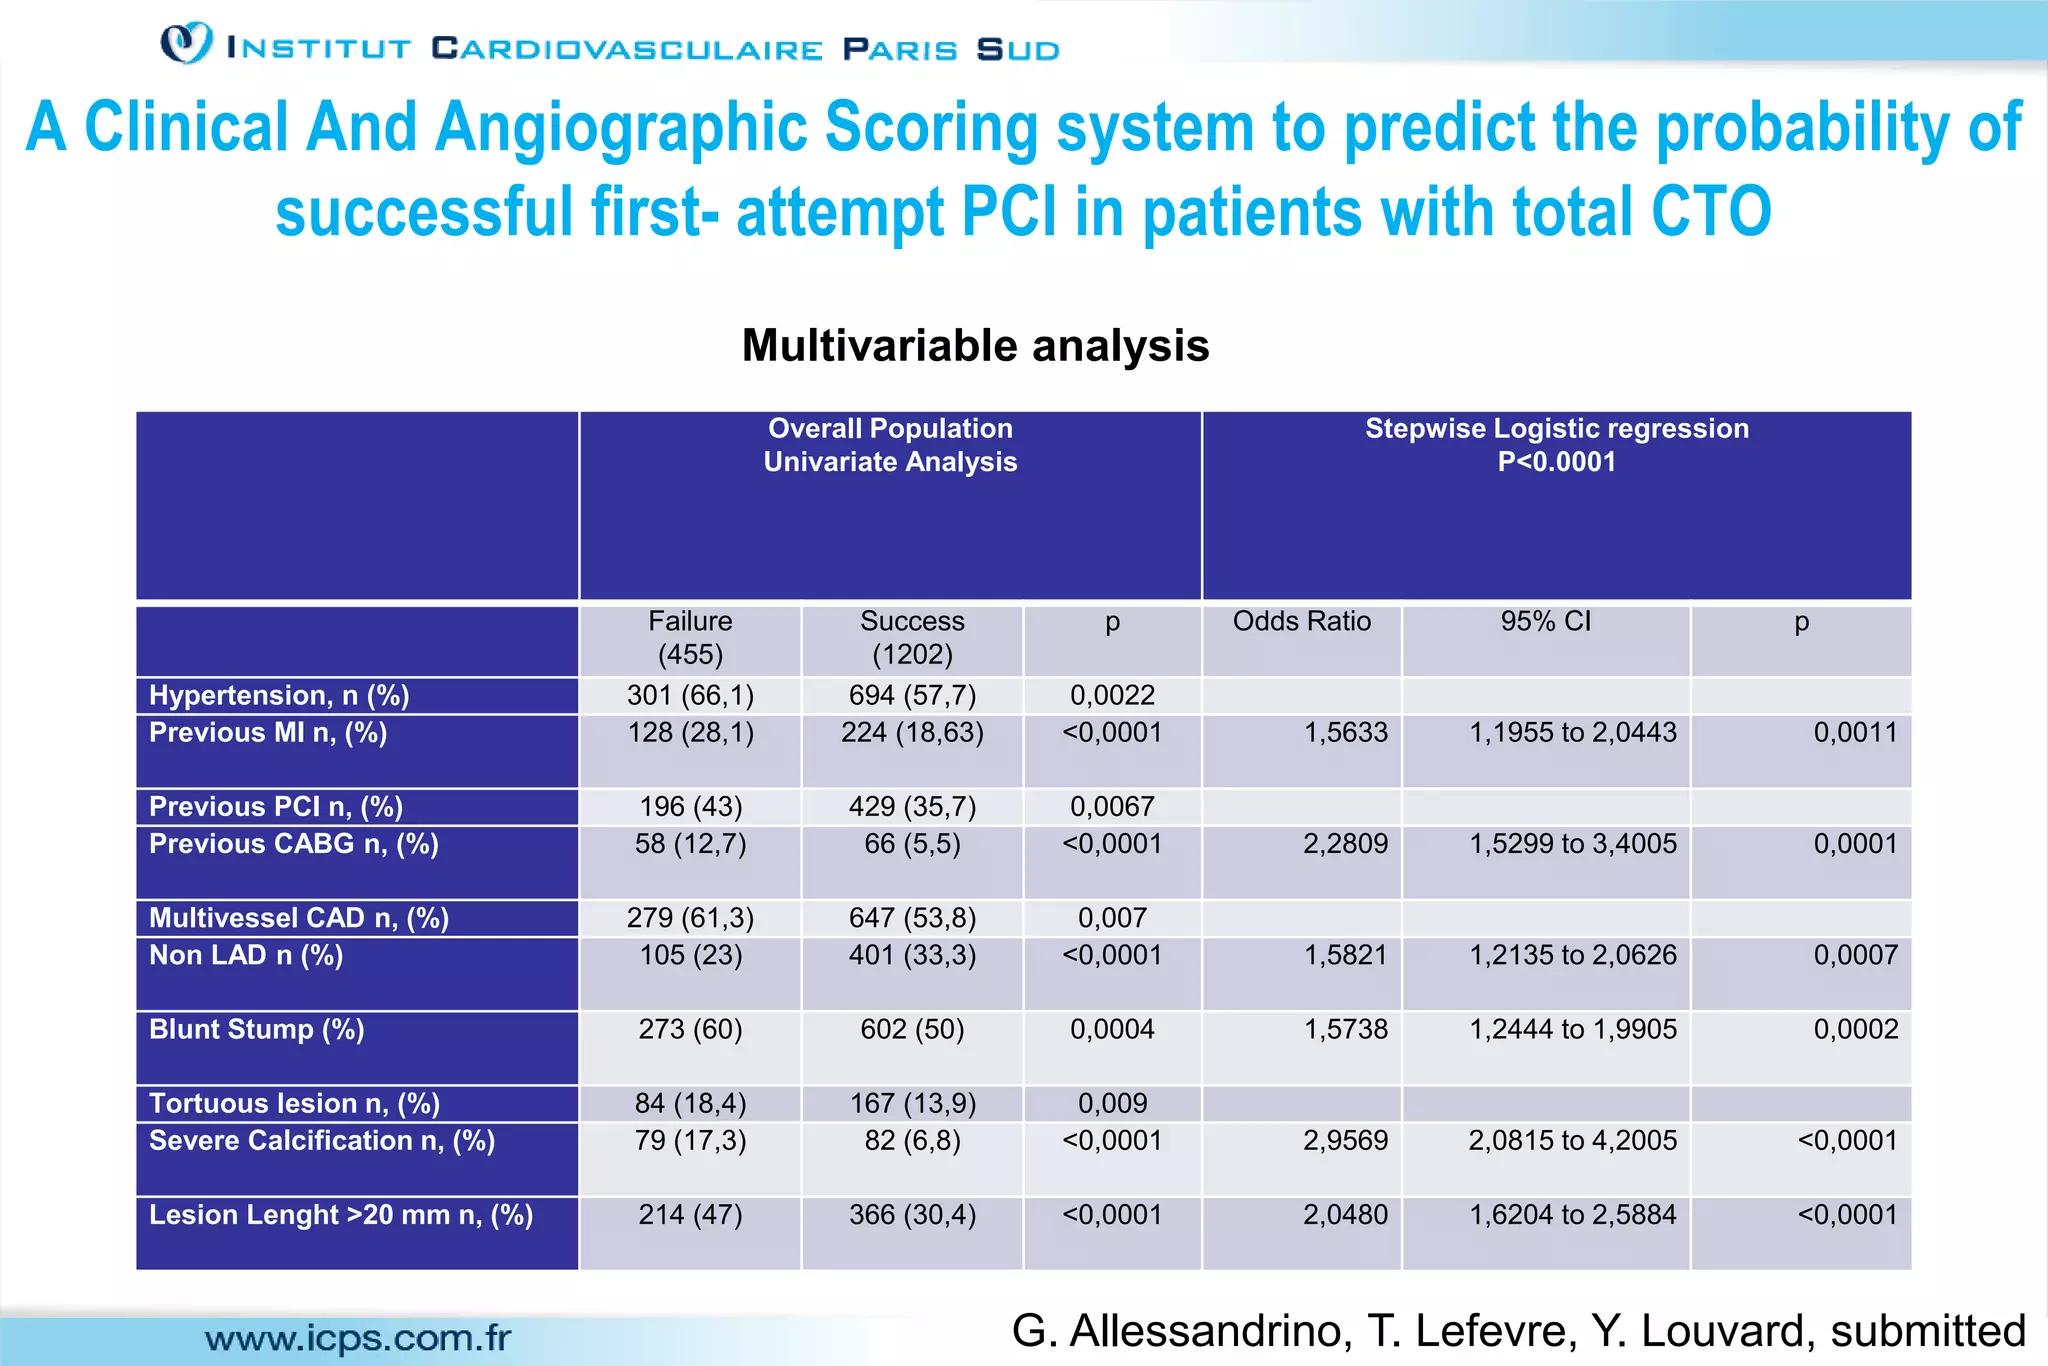
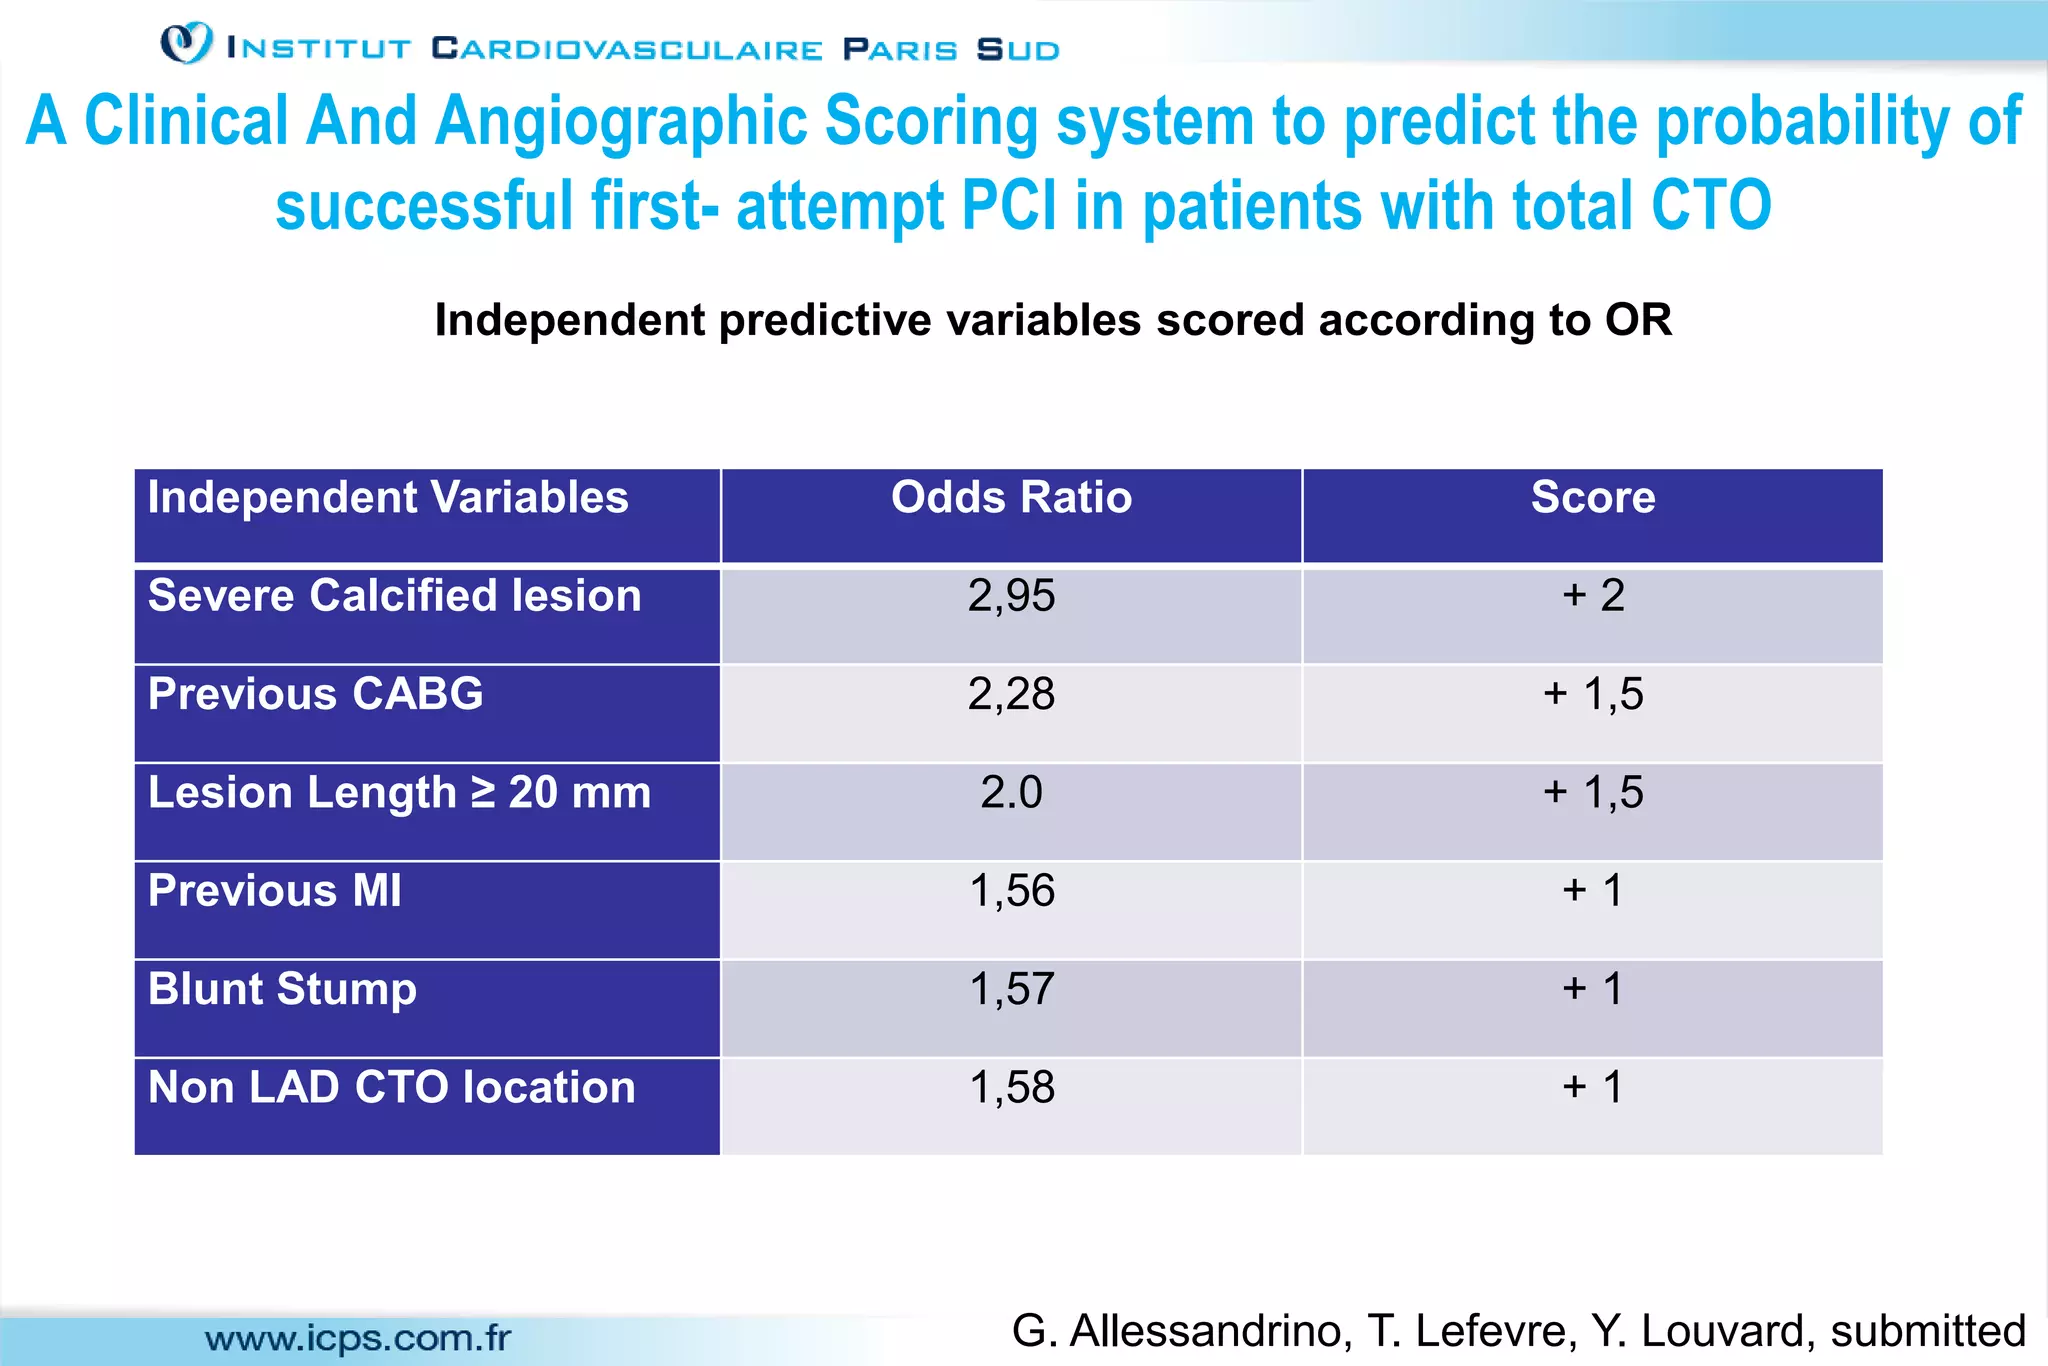
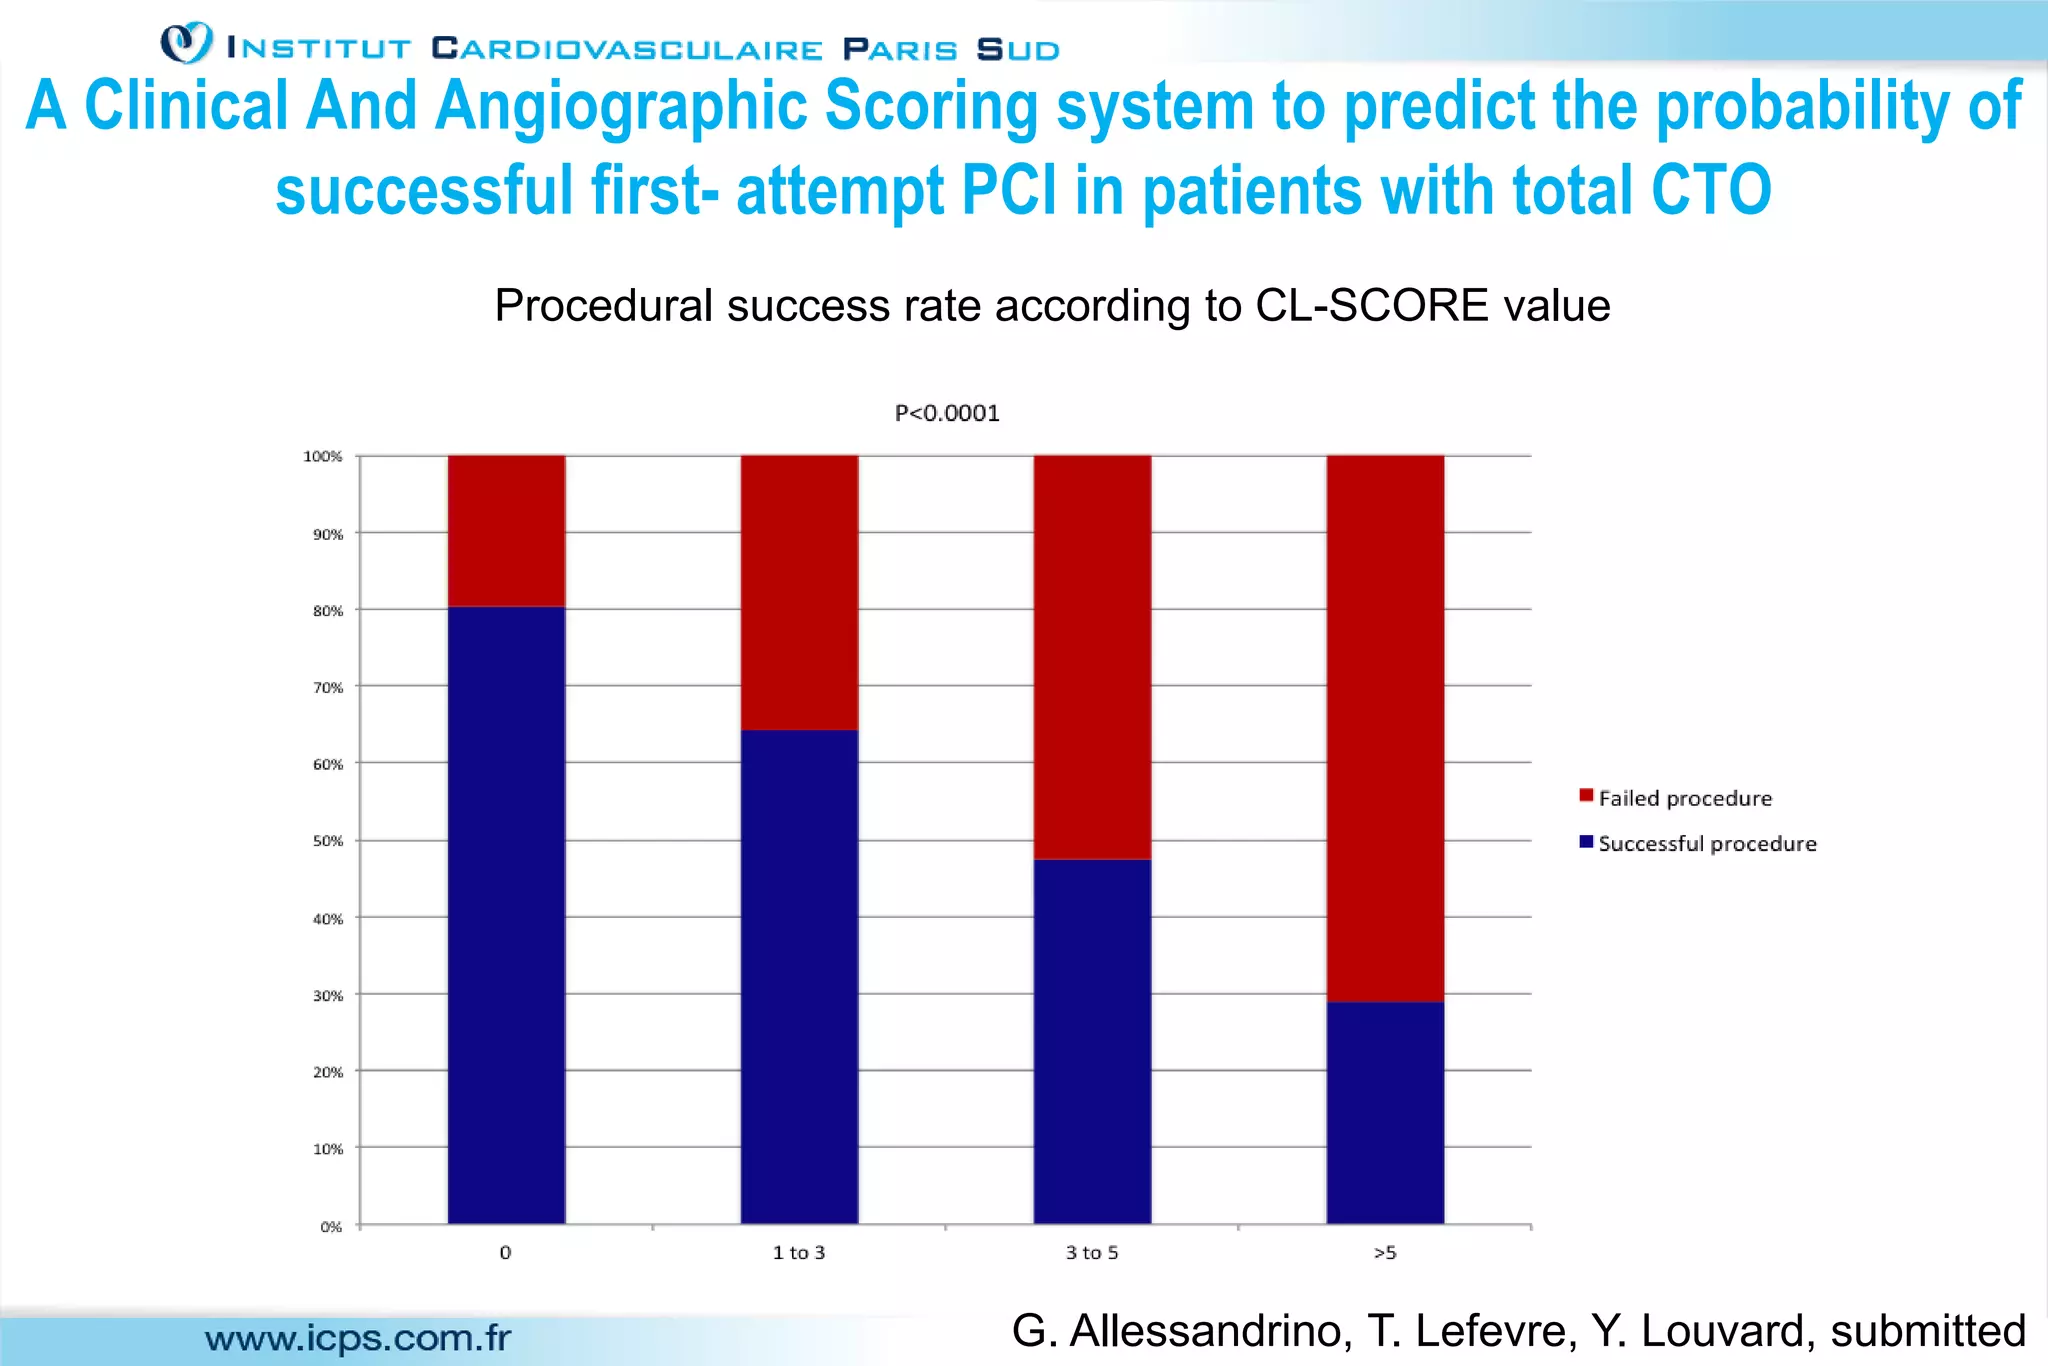
3) Scores like the J-CTO score and the new CL-SCORE can help predict procedural success and guide patient selection and referral. Maintaining a database is useful for monitoring outcomes and individual operator success.