
Recommended
More Related Content
What's hot
What's hot (20)
Viewers also liked
Viewers also liked (16)
Similar to 11 soril 31_dungiin jagsaalt
Similar to 11 soril 31_dungiin jagsaalt (12)
More from Baasandorj Baatarhuyag
More from Baasandorj Baatarhuyag (20)
11 soril 31_dungiin jagsaalt
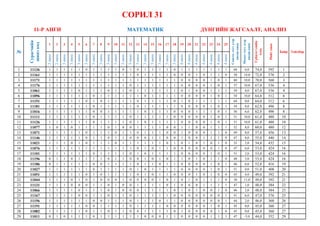
- 1. 1 2 3 4 5 6 7 8 9 10 11 12 13 14 15 16 17 18 19 20 21 22 23 24 25 2оноо 2оноо 3оноо 3оноо 3оноо 3оноо 3оноо 3оноо 3оноо 3оноо 3оноо 3оноо 3оноо 3оноо 3оноо 3оноо 3оноо 3оноо 4оноо 4оноо 4оноо 4оноо 4оноо 4оноо 4оноо 1 11136 1 1 1 1 1 0 1 1 1 1 0 1 0 1 1 1 1 0 1 1 1 1 1 1 1 68 6,0 74,0 592 1 2 11161 1 1 1 1 1 1 1 1 1 1 1 1 0 1 1 1 1 0 0 0 1 0 1 1 0 58 14,0 72,0 576 2 3 11171 1 1 1 1 1 1 1 1 1 1 1 1 1 1 1 1 1 1 0 0 0 0 1 0 1 60 10,0 70,0 560 3 4 11176 1 1 1 1 1 1 1 1 1 1 1 0 1 1 1 1 1 1 0 0 0 0 1 0 1 57 10,0 67,0 536 4 5 11061 1 1 1 1 0 1 1 1 0 1 1 0 1 1 1 1 1 1 0 1 0 0 1 1 1 59 8,0 67,0 536 4 6 11096 1 1 1 1 1 1 0 1 1 1 1 1 1 0 1 1 1 1 0 0 0 0 1 0 1 54 10,0 64,0 512 6 7 11151 1 1 1 1 1 0 1 0 1 1 1 1 0 1 1 1 1 0 1 0 1 1 1 1 1 64 0,0 64,0 512 6 8 11181 1 1 1 1 1 1 0 1 1 1 1 1 0 1 1 1 1 1 0 0 0 0 1 0 1 54 8,0 62,0 496 8 9 11016 1 1 1 1 1 1 0 0 1 1 1 1 1 0 1 1 1 0 0 0 1 1 1 0 1 56 6,0 62,0 496 8 10 11111 1 1 1 1 1 1 0 1 1 1 1 0 1 1 1 1 1 0 0 0 0 0 1 0 1 51 10,0 61,0 488 10 11 11126 1 1 1 1 1 1 0 1 1 1 1 0 1 0 1 1 1 1 0 0 0 0 1 0 1 51 10,0 61,0 488 10 12 11077 1 0 1 0 1 1 1 1 0 1 0 0 1 1 1 1 0 0 1 1 0 0 1 1 1 52 8,0 60,0 480 12 13 11071 1 1 1 1 1 0 1 1 1 0 1 1 0 1 1 1 0 0 1 0 0 0 1 1 0 49 8,0 57,0 456 13 14 11146 1 1 1 1 1 0 1 1 0 1 1 0 0 0 1 1 0 0 1 0 0 1 1 1 0 47 8,0 55,0 440 14 15 11021 1 1 1 0 1 0 1 1 1 0 1 1 1 1 1 1 0 1 0 1 0 1 0 1 0 52 2,0 54,0 432 15 16 11076 1 1 1 1 1 1 1 1 1 1 1 1 0 1 0 1 1 0 0 0 0 0 0 1 0 47 6,0 53,0 424 16 17 11101 1 1 1 1 1 1 0 1 1 1 1 0 1 0 1 1 1 1 0 0 0 0 1 0 1 51 2,0 53,0 424 16 18 11196 0 1 1 0 1 1 1 1 0 1 1 0 0 1 0 1 0 1 1 0 1 0 1 1 0 48 5,0 53,0 424 16 19 11186 0 1 1 1 1 1 0 0 1 1 1 1 0 1 1 0 1 1 0 0 0 0 1 0 1 46 6,0 52,0 416 19 20 11027 1 1 1 1 1 1 0 1 1 1 1 0 1 0 1 1 1 1 0 0 0 0 1 0 1 51 0,0 51,0 408 20 21 11051 1 1 1 1 1 0 1 0 1 1 1 1 0 1 0 1 1 0 0 0 1 0 1 0 0 45 4,0 49,0 392 21 22 11044 1 1 1 0 1 0 1 0 0 0 1 0 0 0 0 1 0 1 0 1 0 1 1 1 0 38 11,0 49,0 392 21 23 11131 1 1 1 0 0 0 1 1 0 1 0 0 1 1 1 1 0 1 0 0 0 1 1 1 1 47 1,0 48,0 384 23 24 11066 1 1 1 1 0 1 1 1 0 1 0 0 0 1 1 1 1 0 1 0 1 0 0 1 0 46 2,0 48,0 384 23 25 11167 1 1 1 1 0 0 1 1 0 1 1 0 1 1 1 1 1 0 0 0 0 0 0 0 1 41 6,0 47,0 376 25 26 11156 1 1 1 1 1 1 0 0 1 1 1 0 1 1 1 0 1 1 0 0 0 0 0 0 1 44 2,0 46,0 368 26 27 11191 1 1 1 1 1 0 0 1 1 1 1 0 1 1 1 1 0 0 0 0 0 0 1 0 1 45 0,0 45,0 360 27 28 11082 1 1 1 1 1 0 1 1 0 1 1 0 0 1 1 1 1 0 1 0 0 0 0 1 0 45 0,0 45,0 360 27 29 11011 0 1 0 1 1 1 0 1 1 1 1 1 1 0 0 0 1 1 0 0 0 0 1 1 1 47 -3,0 44,0 352 29 СОРИЛ 31 11-Р АНГИ МАТЕМАТИК ДҮНГИЙН ЖАГСААЛТ, АНАЛИЗ № Сурагчийн шинэкод Гүйцэтгэлийн хувь Тайлбар Сонгохтестдээр авсаноноо Нөхөхтестдээр авсаноноо Нийтоноо Байр
- 2. 30 11117 1 1 1 0 1 1 1 1 1 1 1 0 0 1 1 1 0 1 0 1 0 0 0 0 0 44 0,0 44,0 352 29 31 11172 1 1 1 1 1 0 1 0 0 1 1 0 1 0 1 0 0 0 0 1 1 1 0 1 0 44 0,0 44,0 352 29 32 11121 1 1 1 0 1 0 1 1 0 1 1 0 1 0 1 1 0 0 0 0 1 1 0 1 0 43 0,0 43,0 344 32 33 11147 1 1 1 0 1 0 1 1 0 1 0 0 0 1 1 1 0 1 1 0 0 0 1 1 0 43 0,0 43,0 344 32 34 11006 1 1 0 1 0 1 0 1 1 0 1 0 0 0 1 1 1 0 0 0 0 1 1 0 1 40 0,0 40,0 320 34 35 11056 1 1 1 1 0 1 0 0 1 1 0 0 0 0 0 1 1 1 0 0 0 0 1 1 1 40 0,0 40,0 320 34 36 11122 1 1 1 0 1 0 1 0 0 1 1 1 1 1 0 1 0 0 0 0 1 0 0 0 1 39 1,0 40,0 320 34 37 11192 1 1 1 1 0 1 0 1 0 1 1 1 1 1 0 1 0 0 0 0 0 1 0 0 0 38 2,0 40,0 320 34 38 11037 0 1 1 1 1 0 1 1 1 1 1 1 1 0 1 0 0 0 0 0 0 0 0 0 1 39 0,0 39,0 312 38 39 11080 1 0 0 0 1 0 0 0 0 1 1 1 1 1 1 0 1 0 0 1 0 1 0 1 0 38 0,0 38,0 304 39 40 11141 1 1 1 0 0 0 0 0 1 1 0 1 0 1 1 1 0 0 0 0 0 1 1 1 0 37 1,0 38,0 304 39 41 11002 0 1 1 0 1 0 0 1 0 1 0 0 1 0 1 0 1 0 0 0 0 1 1 1 0 35 2,0 37,0 296 41 42 11026 1 1 1 0 1 0 0 1 1 1 0 0 0 1 0 0 1 0 0 0 0 0 0 1 1 33 4,0 37,0 296 41 43 11127 1 1 1 0 1 0 1 0 0 1 1 0 0 1 1 0 0 0 1 0 0 0 0 1 0 33 4,0 37,0 296 41 44 11166 0 1 0 1 1 0 0 1 1 1 0 0 1 0 0 1 0 0 1 1 0 0 0 0 0 31 5,0 36,0 288 44 Код!!! 45 11036 1 1 1 0 1 1 0 1 0 1 1 0 1 1 0 1 0 0 1 0 0 0 0 0 0 35 0,0 35,0 280 45 46 11004 0 1 0 1 0 1 1 1 0 1 0 0 1 1 1 1 0 1 0 0 0 0 0 0 0 32 2,0 34,0 272 46 47 11104 1 1 1 1 1 0 0 1 1 1 0 0 1 1 0 0 0 0 0 0 0 0 0 0 1 32 2,0 34,0 272 46 48 11007 1 0 1 0 1 0 1 0 1 0 1 0 0 1 1 1 0 0 1 0 0 0 0 0 0 30 3,0 33,0 264 48 49 11014 1 1 1 1 0 0 1 1 0 1 0 0 1 1 1 1 0 0 0 0 0 0 0 0 0 31 2,0 33,0 264 48 50 11048 1 1 1 0 1 0 1 0 0 1 1 0 0 1 1 1 0 0 1 0 0 0 0 0 0 32 1,0 33,0 264 48 51 11017 1 1 1 1 0 1 0 0 1 1 0 0 1 0 0 0 1 1 1 0 0 0 0 0 0 32 0,0 32 256 51 52 11038 1 1 1 0 1 0 1 0 0 1 1 0 0 1 0 1 0 1 0 0 1 0 0 0 0 32 0,0 32,0 256 51 53 11057 0 1 0 0 1 0 1 0 1 1 0 0 0 1 1 0 1 0 0 1 0 0 0 0 0 27 5,0 32,0 256 51 54 11149 1 0 1 0 0 0 0 0 1 0 1 0 0 0 0 0 1 0 0 1 0 0 0 1 0 22 10,0 32,0 256 51 55 11187 1 0 1 0 0 1 0 0 0 1 0 0 0 0 0 1 1 0 0 0 1 0 0 1 0 25 7,0 32,0 256 51 56 11035 0 0 0 0 1 1 0 0 0 1 0 0 0 0 0 1 1 0 1 0 1 1 0 1 0 31 0,0 31,0 248 56 57 11041 1 1 0 1 0 0 0 0 1 1 0 1 0 0 0 0 0 0 0 1 0 0 1 0 1 28 3,0 31,0 248 56 58 11109 0 0 1 0 0 0 1 0 0 1 0 0 1 1 1 0 1 0 0 0 0 0 1 1 0 29 2,0 31,0 248 56 59 11190 0 0 1 1 1 0 0 0 0 1 0 0 1 0 1 0 0 0 0 0 1 1 0 1 0 30 1,0 31,0 248 56 60 11046 1 0 0 0 1 1 1 0 0 1 0 1 0 0 1 1 0 1 0 0 0 0 0 1 0 30 0,0 30,0 240 60 61 11177 1 1 1 1 0 1 0 0 0 0 1 1 0 0 1 1 0 0 0 0 0 0 1 0 0 29 1,0 30,0 240 60 62 11189 1 0 0 0 0 0 0 0 1 0 1 1 0 0 1 1 1 0 0 0 1 0 0 1 0 28 2,0 30,0 240 60 63 11059 1 1 1 1 1 1 0 0 1 1 0 0 0 0 0 0 0 0 0 1 0 0 1 0 0 30 0,0 30,0 240 60 64 11052 0 0 1 0 0 0 1 0 0 1 1 0 0 0 0 0 0 0 1 1 0 0 1 1 0 28 1,0 29,0 232 64 65 11089 0 0 1 0 0 0 1 0 0 1 0 1 0 1 0 1 1 0 1 0 1 0 0 0 0 29 0,0 29,0 232 64 66 11090 1 0 1 0 1 0 0 0 0 1 0 1 0 0 1 1 0 0 0 1 0 0 0 1 0 28 1,0 29,0 232 64 67 11050 0 0 1 1 0 1 1 1 0 0 0 0 0 0 1 1 0 1 0 0 0 0 0 1 0 28 0,0 28,0 224 67 68 11155 1 0 1 1 0 0 1 1 0 0 1 0 1 1 0 1 0 0 0 0 0 0 0 0 0 26 2,0 28,0 224 67 69 11182 1 1 0 1 0 1 0 0 1 1 0 0 0 1 0 1 0 0 0 1 0 0 0 0 0 26 2,0 28,0 224 67 70 11058 1 0 0 0 0 0 1 0 1 1 0 0 0 0 1 0 0 1 0 0 0 0 0 1 1 25 2,0 27,0 216 70
- 3. 71 11113 1 1 0 0 1 0 0 0 1 0 0 0 1 1 0 1 0 0 0 1 1 0 0 0 0 27 0,0 27,0 216 70 72 11063 1 0 1 0 0 0 0 1 0 1 0 0 0 0 0 1 0 0 0 0 1 0 1 1 0 26 0,0 26,0 208 72 73 11083 0 0 1 1 0 0 1 0 0 1 0 0 0 0 0 1 1 0 0 0 0 0 0 1 0 22 4,0 26,0 208 72 74 11102 1 1 1 1 0 0 0 0 1 1 0 0 1 1 0 1 0 0 0 0 0 0 0 0 0 25 1,0 26,0 208 72 75 11157 1 1 1 1 1 1 0 0 1 1 0 0 0 0 0 0 0 0 0 0 0 0 0 1 0 26 0,0 26,0 208 72 76 11193 1 1 0 1 0 0 1 1 0 1 0 0 0 0 0 0 0 0 1 0 0 0 0 1 24 2,0 26,0 208 72 77 11070 0 0 0 1 0 0 1 0 1 0 0 0 1 0 0 0 0 0 0 1 0 0 1 1 0 24 1,0 25,0 200 77 78 11087 0 0 1 1 1 0 0 0 0 1 0 0 1 0 0 1 1 0 0 0 0 0 0 0 0 21 4,0 25,0 200 77 79 11118 1 0 0 0 0 0 1 1 1 0 1 0 0 0 0 1 0 0 0 0 1 0 0 1 0 25 0,0 25,0 200 77 80 11144 0 0 0 0 0 0 0 0 1 1 0 1 0 1 0 1 1 1 0 1 0 0 0 0 0 25 0,0 25,0 200 77 81 11008 0 0 1 0 0 0 0 0 1 0 1 0 1 0 1 0 0 1 0 0 0 0 0 0 1 22 2,0 24,0 192 81 82 11012 1 0 1 0 0 0 0 0 0 0 0 1 0 1 1 1 1 0 0 0 0 0 0 1 0 24 0,0 24,0 192 81 83 11018 0 0 0 1 0 0 1 0 1 0 1 0 0 1 0 0 0 1 1 0 0 0 0 0 0 22 2,0 24,0 192 81 84 11068 0 0 0 1 1 1 1 0 1 0 0 0 0 0 0 0 0 1 0 0 0 1 0 0 0 22 2,0 24,0 192 81 85 11142 1 1 1 0 0 0 0 1 0 1 0 0 0 0 0 0 1 0 0 0 0 1 0 1 0 24 0,0 24,0 192 81 86 11158 0 0 0 0 1 0 0 0 1 0 0 0 1 0 0 0 0 0 1 0 1 1 0 0 0 21 3,0 24,0 192 81 87 11092 1 1 0 1 0 0 0 0 0 1 0 0 0 0 0 1 1 1 0 0 0 0 0 1 0 23 0,0 23,0 184 87 88 11159 1 1 1 1 0 1 0 0 1 0 0 0 0 0 1 0 0 0 0 0 0 0 0 0 1 23 0,0 23,0 184 87 89 11022 0 0 0 0 0 0 0 0 0 0 0 0 1 1 0 1 1 0 0 0 0 0 0 1 0 16 6,0 22,0 176 89 90 11024 1 0 0 0 0 0 0 0 0 0 0 0 0 0 0 0 0 0 0 0 1 1 1 1 1 22 0,0 22,0 176 89 91 11047 1 1 1 0 0 0 0 1 1 0 0 0 1 0 0 0 0 0 0 0 0 0 0 0 1 20 2,0 22,0 176 89 92 11072 1 1 0 0 0 0 0 0 1 0 0 0 0 0 0 1 0 0 0 0 1 0 1 0 1 22 0,0 22,0 176 89 93 11145 1 0 1 1 0 0 0 0 1 0 0 0 0 0 0 1 0 0 0 0 0 1 1 0 0 22 0,0 22,0 176 89 94 11184 0 0 0 0 0 0 0 0 0 0 0 1 1 1 0 0 0 1 0 1 0 0 0 0 1 20 2,0 22,0 176 89 95 11300 1 1 1 1 1 1 1 22 0,0 22 176 89 96 11043 1 0 0 0 1 0 0 0 1 0 0 0 0 1 1 0 1 0 0 0 1 0 0 0 0 21 0,0 21,0 168 96 Код!!! 97 11062 0 1 0 1 0 0 1 0 0 0 1 1 0 0 0 0 1 0 0 0 0 0 1 0 0 21 0,0 21,0 168 96 98 11098 0 0 0 0 0 0 1 0 0 0 1 0 0 0 1 0 0 0 0 1 0 1 0 1 0 21 0,0 21,0 168 96 99 11112 1 0 0 0 0 1 1 1 1 0 0 0 0 0 0 1 0 0 0 1 0 0 0 0 0 21 0,0 21,0 168 96 100 11197 1 0 1 1 0 0 0 0 0 0 0 0 1 0 1 0 1 0 0 1 0 0 0 0 0 21 0,0 21,0 168 96 101 11137 1 1 1 0 1 1 0 0 0 1 0 0 0 0 0 0 0 0 0 1 0 0 0 0 0 20 1,0 21,0 168 96 102 11033 0 0 0 0 0 0 0 0 1 1 0 0 0 1 0 1 0 0 0 1 1 0 0 0 0 20 0,0 20,0 160 102 103 11163 0 0 0 0 0 0 0 1 0 0 0 0 0 1 1 0 1 1 0 1 0 0 0 0 0 19 1,0 20,0 160 102 104 11019 0 0 1 0 1 0 0 0 0 0 1 0 1 0 0 0 1 0 0 0 0 0 1 0 0 19 0,0 19,0 152 104 105 11073 1 0 1 1 0 1 0 0 1 0 0 0 0 1 0 0 0 0 0 0 0 0 0 0 0 17 2,0 19,0 152 104 106 11088 0 0 0 0 0 1 0 0 0 0 1 0 1 0 1 0 1 0 0 0 0 0 0 1 0 19 0,0 19,0 152 104 107 11125 1 0 0 0 0 0 1 0 0 0 0 0 0 0 0 0 1 1 0 0 1 0 0 0 1 19 0,0 19,0 152 104 108 11053 0 0 1 1 0 1 0 1 0 0 1 0 0 0 0 1 0 0 0 0 0 0 0 0 0 18 0,0 18,0 144 108 109 11094 0 0 0 0 0 0 0 0 0 0 0 0 1 0 0 1 0 0 1 0 0 1 1 0 0 18 0,0 18,0 144 108 110 11188 1 0 1 0 1 1 0 0 0 1 0 0 0 0 0 0 0 0 0 0 1 0 0 0 0 18 0,0 18,0 144 108 111 11195 1 0 0 0 0 0 0 1 1 0 0 1 1 0 0 0 0 0 0 0 0 0 0 1 0 18 0,0 18,0 144 108
- 4. 112 11042 0 0 1 1 0 0 0 0 0 0 0 0 0 0 0 1 0 1 0 0 1 0 0 0 0 16 1,0 17,0 136 112 113 11169 0 0 1 0 0 0 0 0 0 1 0 0 0 0 1 0 1 0 0 0 0 0 0 0 1 16 1,0 17,0 136 112 114 11183 1 0 1 1 0 1 0 0 1 0 0 0 0 0 0 1 0 0 0 0 0 0 0 0 0 17 0,0 17,0 136 112 115 11054 0 0 1 0 0 0 0 0 0 0 0 0 0 0 0 0 0 0 1 0 1 0 0 0 1 15 1,0 16,0 128 115 116 11165 0 0 1 0 0 1 0 1 0 0 1 0 0 0 0 0 0 0 0 0 1 0 0 0 0 16 0,0 16,0 128 115 117 11173 0 0 0 0 1 0 0 0 1 0 0 0 0 1 0 0 1 0 0 0 0 0 0 0 1 16 0,0 16,0 128 115 118 11198 0 0 0 0 1 0 0 1 0 1 0 0 0 0 0 1 0 0 0 0 0 0 0 0 1 16 0,0 16,0 128 115 119 11170 0 0 0 0 0 0 0 1 0 0 0 0 0 0 1 0 0 0 1 1 0 0 0 0 0 14 0,0 14,0 112 119 120 11119 0 0 1 0 0 0 0 0 1 0 0 0 0 0 0 0 0 0 0 0 1 0 0 0 0 10 3,0 13,0 104 120 121 11153 1 1 0 0 0 1 0 1 0 0 0 0 0 0 0 0 1 0 0 0 0 0 0 0 0 13 0,0 13,0 104 120 122 11160 0 0 0 1 0 0 0 0 0 0 0 1 0 0 0 0 1 0 0 0 0 0 1 0 0 13 0,0 13,0 104 120 123 11034 0 0 1 0 0 0 0 0 0 0 1 0 0 1 1 0 0 0 0 0 0 0 0 0 0 12 0,0 12,0 96 123 124 11103 1 0 0 0 0 0 0 0 0 0 0 1 0 0 0 1 0 0 0 0 1 0 0 0 0 12 0,0 12,0 96 123 125 11154 0 1 0 0 0 0 0 0 0 1 0 0 0 0 0 0 0 0 0 0 1 0 0 0 0 9 3,0 12,0 96 123 126 11009 0 0 1 0 0 0 0 0 1 0 0 0 0 0 0 0 0 0 0 0 0 0 0 0 0 6 0,0 6,0 48 126 Код!!! 127 11001 0 0 0 0 0 0 0 0 0 0 0 0 0 0 0 0 0 0 0 0 0 0 0 0 0 0 0,0 0 127 тасалсан 128 11003 0 0 0 0 0 0 0 0 0 0 0 0 0 0 0 0 0 0 0 0 0 0 0 0 0 0 0,0 0 127 тасалсан 129 11010 0 0 0 0 0 0 0 0 0 0 0 0 0 0 0 0 0 0 0 0 0 0 0 0 0 0 0,0 0 127 тасалсан 130 11013 0 0 0 0 0 0 0 0 0 0 0 0 0 0 0 0 0 0 0 0 0 0 0 0 0 0 0,0 0 127 тасалсан 131 11015 0 0 0 0 0 0 0 0 0 0 0 0 0 0 0 0 0 0 0 0 0 0 0 0 0 0 0,0 0 127 тасалсан 132 11017 0 0 0 0 0 0 0 0 0 0 0 0 0 0 0 0 0 0 0 0 0 0 0 0 0 0 0,0 0 127 тасалсан 133 11020 0 0 0 0 0 0 0 0 0 0 0 0 0 0 0 0 0 0 0 0 0 0 0 0 0 0 0,0 0 127 тасалсан 134 11025 0 0 0 0 0 0 0 0 0 0 0 0 0 0 0 0 0 0 0 0 0 0 0 0 0 0 0,0 0 127 тасалсан 135 11028 0 0 0 0 0 0 0 0 0 0 0 0 0 0 0 0 0 0 0 0 0 0 0 0 0 0 0,0 0 127 тасалсан 136 11029 0 0 0 0 0 0 0 0 0 0 0 0 0 0 0 0 0 0 0 0 0 0 0 0 0 0 0,0 0 127 тасалсан 137 11030 0 0 0 0 0 0 0 0 0 0 0 0 0 0 0 0 0 0 0 0 0 0 0 0 0 0 0,0 0 127 тасалсан 138 11031 0 0 0 0 0 0 0 0 0 0 0 0 0 0 0 0 0 0 0 0 0 0 0 0 0 0 0,0 0 127 тасалсан 139 11032 0 0 0 0 0 0 0 0 0 0 0 0 0 0 0 0 0 0 0 0 0 0 0 0 0 0 0,0 0 127 тасалсан 140 11039 0 0 0 0 0 0 0 0 0 0 0 0 0 0 0 0 0 0 0 0 0 0 0 0 0 0 0,0 0 127 тасалсан 141 11040 0 0 0 0 0 0 0 0 0 0 0 0 0 0 0 0 0 0 0 0 0 0 0 0 0 0 0,0 0 127 тасалсан 142 11045 0 0 0 0 0 0 0 0 0 0 0 0 0 0 0 0 0 0 0 0 0 0 0 0 0 0 0,0 0 127 тасалсан 143 11049 0 0 0 0 0 0 0 0 0 0 0 0 0 0 0 0 0 0 0 0 0 0 0 0 0 0 0,0 0 127 тасалсан 144 11055 0 0 0 0 0 0 0 0 0 0 0 0 0 0 0 0 0 0 0 0 0 0 0 0 0 0 0,0 0 127 тасалсан 145 11060 0 0 0 0 0 0 0 0 0 0 0 0 0 0 0 0 0 0 0 0 0 0 0 0 0 0 0,0 0 127 тасалсан 146 11064 0 0 0 0 0 0 0 0 0 0 0 0 0 0 0 0 0 0 0 0 0 0 0 0 0 0 0,0 0 127 тасалсан 147 11065 0 0 0 0 0 0 0 0 0 0 0 0 0 0 0 0 0 0 0 0 0 0 0 0 0 0 0,0 0 127 тасалсан 148 11067 0 0 0 0 0 0 0 0 0 0 0 0 0 0 0 0 0 0 0 0 0 0 0 0 0 0 0,0 0 127 тасалсан 149 11069 0 0 0 0 0 0 0 0 0 0 0 0 0 0 0 0 0 0 0 0 0 0 0 0 0 0 0,0 0 127 тасалсан 150 11074 0 0 0 0 0 0 0 0 0 0 0 0 0 0 0 0 0 0 0 0 0 0 0 0 0 0 0,0 0 127 тасалсан 151 11075 0 0 0 0 0 0 0 0 0 0 0 0 0 0 0 0 0 0 0 0 0 0 0 0 0 0 0,0 0 127 тасалсан 152 11078 0 0 0 0 0 0 0 0 0 0 0 0 0 0 0 0 0 0 0 0 0 0 0 0 0 0 0,0 0 127 тасалсан
- 5. 153 11079 0 0 0 0 0 0 0 0 0 0 0 0 0 0 0 0 0 0 0 0 0 0 0 0 0 0 0,0 0 127 тасалсан 154 11081 0 0 0 0 0 0 0 0 0 0 0 0 0 0 0 0 0 0 0 0 0 0 0 0 0 0 0,0 0 127 тасалсан 155 11084 0 0 0 0 0 0 0 0 0 0 0 0 0 0 0 0 0 0 0 0 0 0 0 0 0 0 0,0 0 127 тасалсан 156 11085 0 0 0 0 0 0 0 0 0 0 0 0 0 0 0 0 0 0 0 0 0 0 0 0 0 0 0,0 0 127 тасалсан 157 11086 0 0 0 0 0 0 0 0 0 0 0 0 0 0 0 0 0 0 0 0 0 0 0 0 0 0 0,0 0 127 тасалсан 158 11091 0 0 0 0 0 0 0 0 0 0 0 0 0 0 0 0 0 0 0 0 0 0 0 0 0 0 0,0 0 127 тасалсан 159 11093 0 0 0 0 0 0 0 0 0 0 0 0 0 0 0 0 0 0 0 0 0 0 0 0 0 0 0,0 0 127 тасалсан 160 11095 0 0 0 0 0 0 0 0 0 0 0 0 0 0 0 0 0 0 0 0 0 0 0 0 0 0 0,0 0 127 тасалсан 161 11097 0 0 0 0 0 0 0 0 0 0 0 0 0 0 0 0 0 0 0 0 0 0 0 0 0 0 0,0 0 127 тасалсан 162 11099 0 0 0 0 0 0 0 0 0 0 0 0 0 0 0 0 0 0 0 0 0 0 0 0 0 0 0,0 0 127 тасалсан 163 11100 0 0 0 0 0 0 0 0 0 0 0 0 0 0 0 0 0 0 0 0 0 0 0 0 0 0 0,0 0 127 тасалсан 164 11105 0 0 0 0 0 0 0 0 0 0 0 0 0 0 0 0 0 0 0 0 0 0 0 0 0 0 0,0 0 127 тасалсан 165 11106 0 0 0 0 0 0 0 0 0 0 0 0 0 0 0 0 0 0 0 0 0 0 0 0 0 0 0,0 0 127 тасалсан 166 11107 0 0 0 0 0 0 0 0 0 0 0 0 0 0 0 0 0 0 0 0 0 0 0 0 0 0 0,0 0 127 тасалсан 167 11108 0 0 0 0 0 0 0 0 0 0 0 0 0 0 0 0 0 0 0 0 0 0 0 0 0 0 0,0 0 127 тасалсан 168 11110 0 0 0 0 0 0 0 0 0 0 0 0 0 0 0 0 0 0 0 0 0 0 0 0 0 0 0,0 0 127 тасалсан 169 11114 0 0 0 0 0 0 0 0 0 0 0 0 0 0 0 0 0 0 0 0 0 0 0 0 0 0 0,0 0 127 тасалсан 170 11115 0 0 0 0 0 0 0 0 0 0 0 0 0 0 0 0 0 0 0 0 0 0 0 0 0 0 0,0 0 127 тасалсан 171 11116 0 0 0 0 0 0 0 0 0 0 0 0 0 0 0 0 0 0 0 0 0 0 0 0 0 0 0,0 0 127 тасалсан 172 11120 0 0 0 0 0 0 0 0 0 0 0 0 0 0 0 0 0 0 0 0 0 0 0 0 0 0 0,0 0 127 тасалсан 173 11123 0 0 0 0 0 0 0 0 0 0 0 0 0 0 0 0 0 0 0 0 0 0 0 0 0 0 0,0 0 127 тасалсан 174 11124 0 0 0 0 0 0 0 0 0 0 0 0 0 0 0 0 0 0 0 0 0 0 0 0 0 0 0,0 0 127 тасалсан 175 11128 0 0 0 0 0 0 0 0 0 0 0 0 0 0 0 0 0 0 0 0 0 0 0 0 0 0 0,0 0 127 тасалсан 176 11129 0 0 0 0 0 0 0 0 0 0 0 0 0 0 0 0 0 0 0 0 0 0 0 0 0 0 0,0 0 127 тасалсан 177 11130 0 0 0 0 0 0 0 0 0 0 0 0 0 0 0 0 0 0 0 0 0 0 0 0 0 0 0,0 0 127 тасалсан 178 11132 0 0 0 0 0 0 0 0 0 0 0 0 0 0 0 0 0 0 0 0 0 0 0 0 0 0 0,0 0 127 тасалсан 179 11133 0 0 0 0 0 0 0 0 0 0 0 0 0 0 0 0 0 0 0 0 0 0 0 0 0 0 0,0 0 127 тасалсан 180 11134 0 0 0 0 0 0 0 0 0 0 0 0 0 0 0 0 0 0 0 0 0 0 0 0 0 0 0,0 0 127 тасалсан 181 11135 0 0 0 0 0 0 0 0 0 0 0 0 0 0 0 0 0 0 0 0 0 0 0 0 0 0 0,0 0 127 тасалсан 182 11138 0 0 0 0 0 0 0 0 0 0 0 0 0 0 0 0 0 0 0 0 0 0 0 0 0 0 0,0 0 127 тасалсан 183 11139 0 0 0 0 0 0 0 0 0 0 0 0 0 0 0 0 0 0 0 0 0 0 0 0 0 0 0,0 0 127 тасалсан 184 11140 0 0 0 0 0 0 0 0 0 0 0 0 0 0 0 0 0 0 0 0 0 0 0 0 0 0 0,0 0 127 тасалсан 185 11143 0 0 0 0 0 0 0 0 0 0 0 0 0 0 0 0 0 0 0 0 0 0 0 0 0 0 0,0 0 127 тасалсан 186 11148 0 0 0 0 0 0 0 0 0 0 0 0 0 0 0 0 0 0 0 0 0 0 0 0 0 0 0,0 0 127 тасалсан 187 11150 0 0 0 0 0 0 0 0 0 0 0 0 0 0 0 0 0 0 0 0 0 0 0 0 0 0 0,0 0 127 тасалсан 188 11152 0 0 0 0 0 0 0 0 0 0 0 0 0 0 0 0 0 0 0 0 0 0 0 0 0 0 0,0 0 127 тасалсан 189 11162 0 0 0 0 0 0 0 0 0 0 0 0 0 0 0 0 0 0 0 0 0 0 0 0 0 0 0,0 0 127 тасалсан 190 11164 0 0 0 0 0 0 0 0 0 0 0 0 0 0 0 0 0 0 0 0 0 0 0 0 0 0 0,0 0 127 тасалсан 191 11168 0 0 0 0 0 0 0 0 0 0 0 0 0 0 0 0 0 0 0 0 0 0 0 0 0 0 0,0 0 127 тасалсан 192 11174 0 0 0 0 0 0 0 0 0 0 0 0 0 0 0 0 0 0 0 0 0 0 0 0 0 0 0,0 0 127 тасалсан 193 11175 0 0 0 0 0 0 0 0 0 0 0 0 0 0 0 0 0 0 0 0 0 0 0 0 0 0 0,0 0 127 тасалсан
- 6. 194 11178 0 0 0 0 0 0 0 0 0 0 0 0 0 0 0 0 0 0 0 0 0 0 0 0 0 0 0,0 0 127 тасалсан 195 11179 0 0 0 0 0 0 0 0 0 0 0 0 0 0 0 0 0 0 0 0 0 0 0 0 0 0 0,0 0 127 тасалсан 196 11180 0 0 0 0 0 0 0 0 0 0 0 0 0 0 0 0 0 0 0 0 0 0 0 0 0 0 0,0 0 127 тасалсан 197 11185 0 0 0 0 0 0 0 0 0 0 0 0 0 0 0 0 0 0 0 0 0 0 0 0 0 0 0,0 0 127 тасалсан 198 11194 0 0 0 0 0 0 0 0 0 0 0 0 0 0 0 0 0 0 0 0 0 0 0 0 0 0 0,0 0 127 тасалсан 199 11199 0 0 0 0 0 0 0 0 0 0 0 0 0 0 0 0 0 0 0 0 0 0 0 0 0 0 0,0 0 127 тасалсан 200 11200 0 0 0 0 0 0 0 0 0 0 0 0 0 0 0 0 0 0 0 0 0 0 0 0 0 0 0,0 0 127 тасалсан