Download to read offline


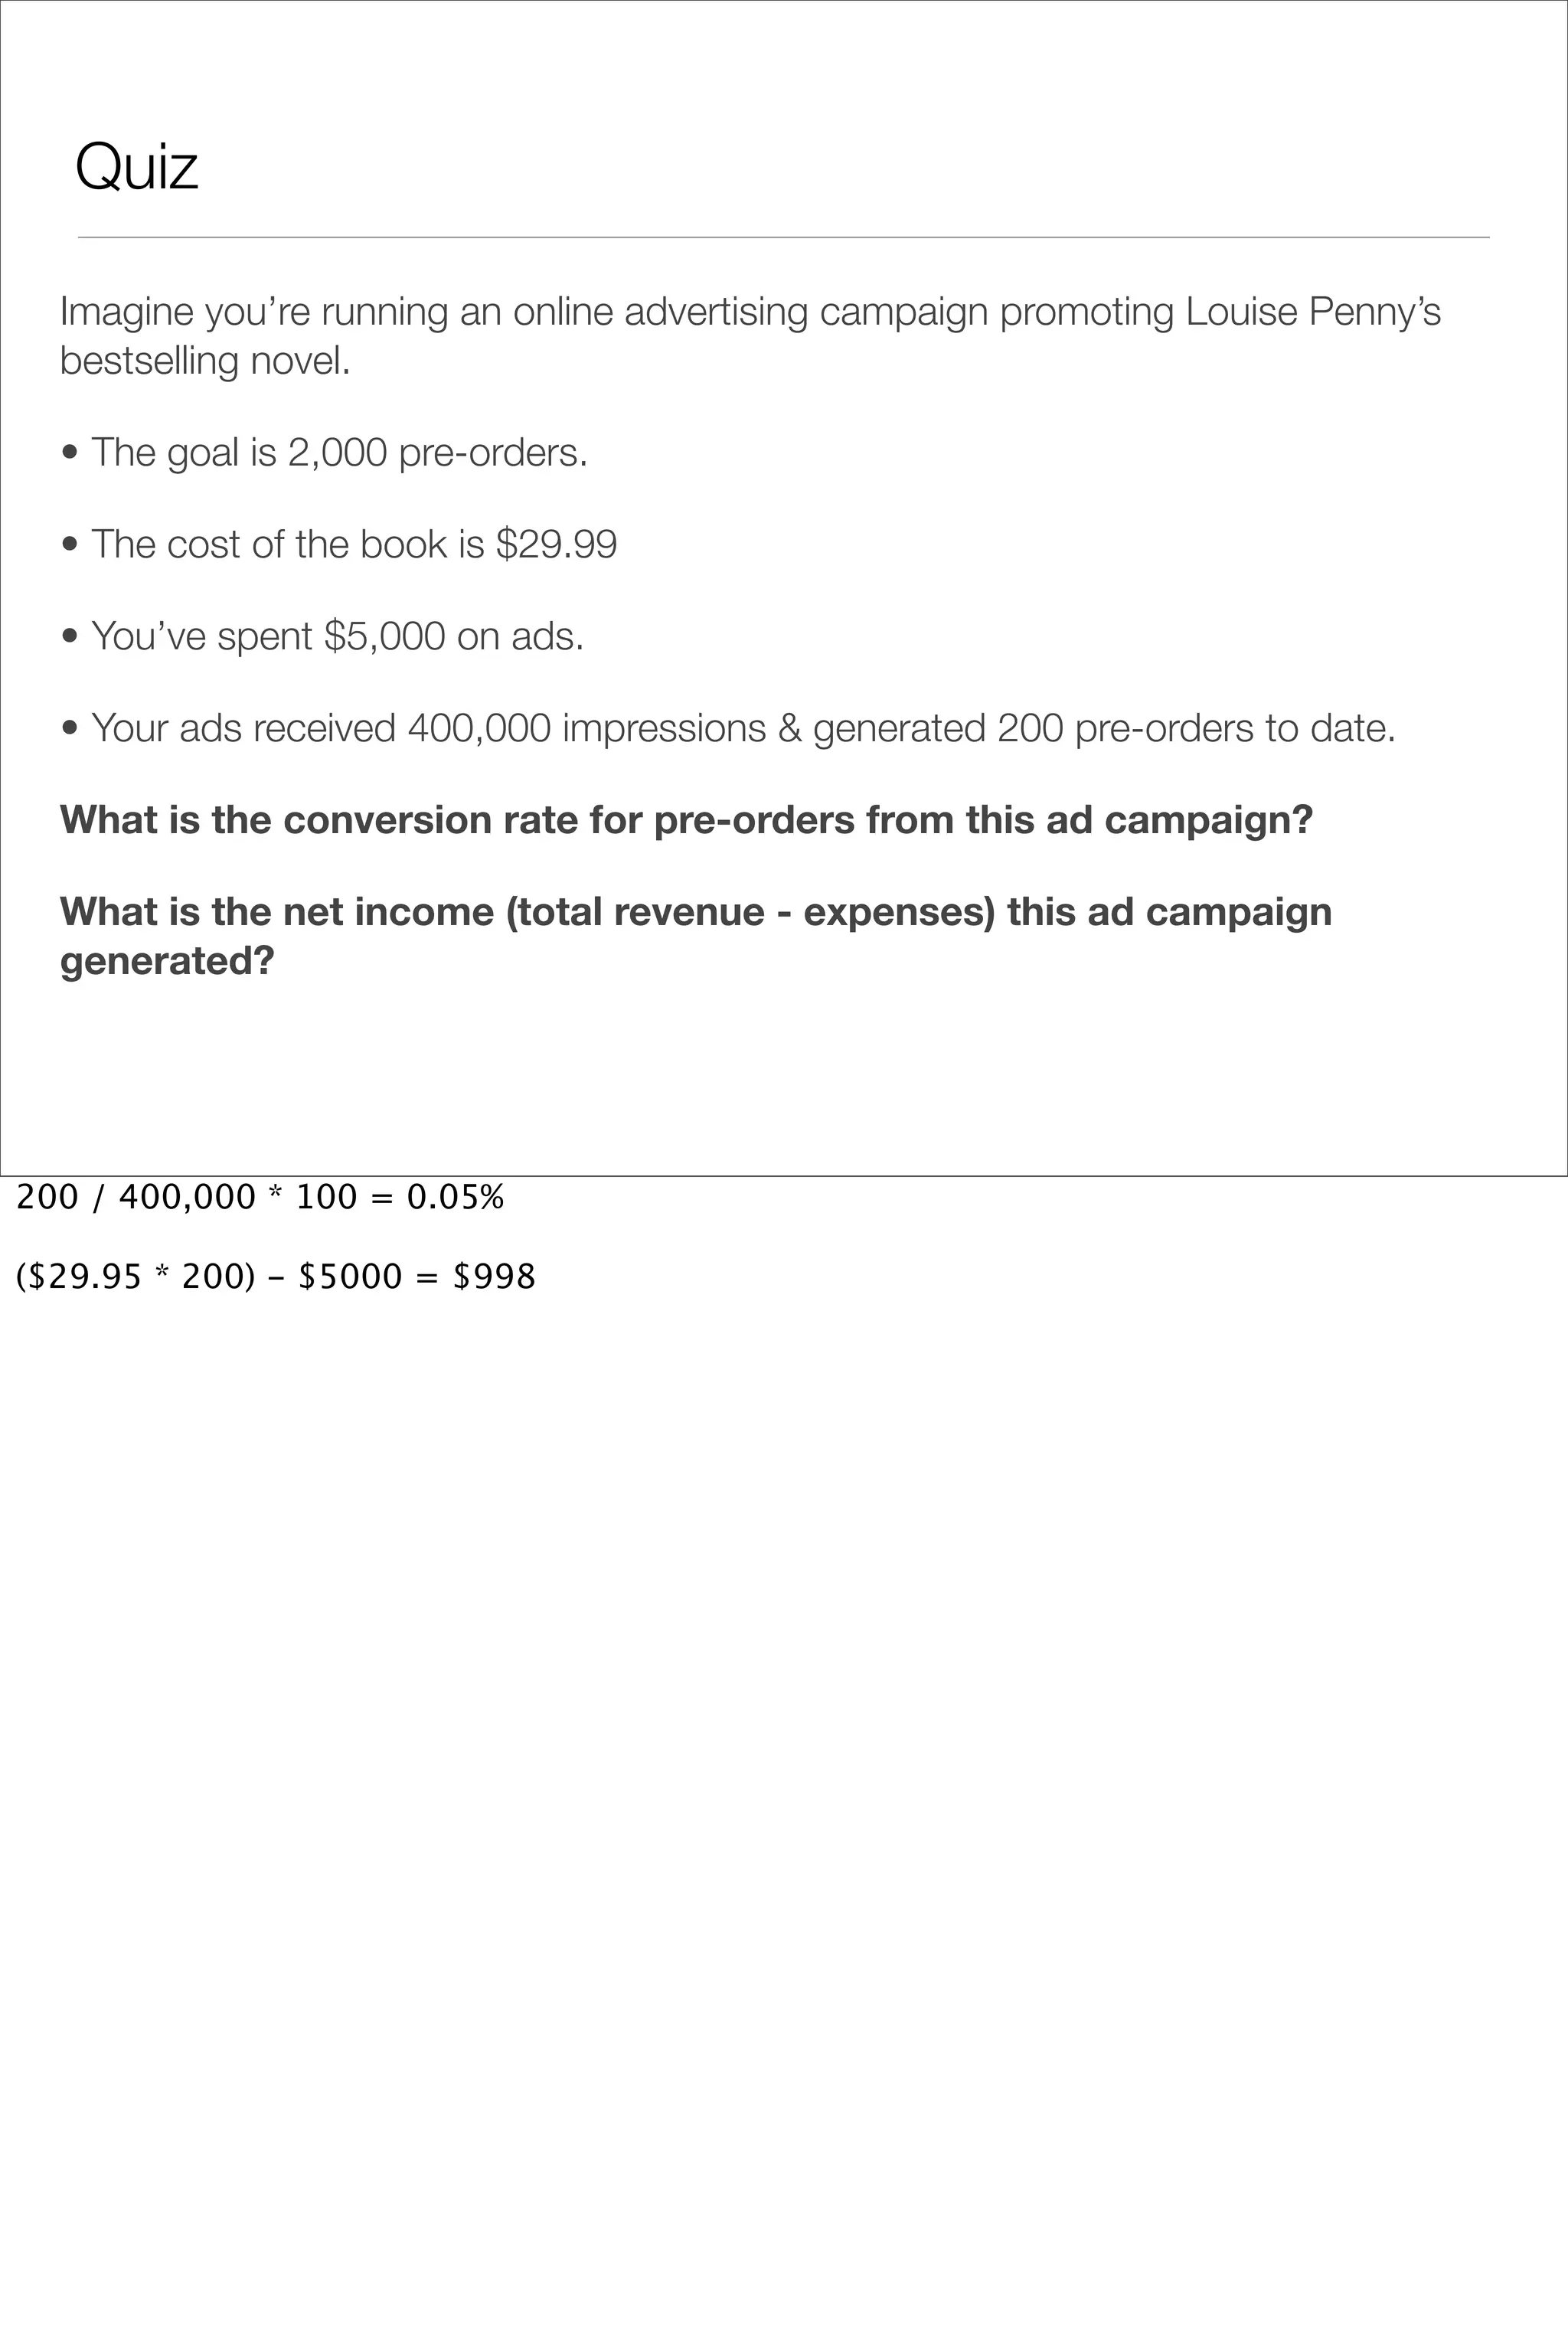

Okay, here are the steps to solve this: 1) Conversion rate = Number of conversions / Number of impressions x 100 = 200 pre-orders / 400,000 impressions x 100 = 0.05% or 0.0005 2) Revenue from pre-orders = Number of pre-orders x Price per book = 200 x $29.99 = $5,998 3) Expenses from ads = $5,000 4) Net income = Revenue - Expenses = $5,998 - $5,000 = $998 So the conversion rate is 0.05% and the net income is $998.