SlideShare a Scribd company logo
1 of 101
10 Energy and Environmental Policy Externalities and Interests
Public Choice and the Environment
All human activity produces waste. We can no more “stop
polluting” than we can halt our natural body functions. As soon
as we come to understand that we cannot outlaw pollution and
come to see pollution as a cost of human activity, we can begin
to devise creative environmental policies.
Environmental Externalities.
Public choice theory views pollution as a “problem” when it is
not a cost to its producer—that is, when producers can ignore
the costs of their pollution and shift them onto others or society
in general. An “externality” occurs when one individual, firm,
or government undertakes an activity that imposes unwanted
costs on others. A manufacturing firm or local government that
discharges waste into a river shifts its own costs to individuals,
firms, or local governments downstream, who must forgo using
the river for recreation and water supply or else undertake the
costs of cleaning it up themselves. A coal-burning electricity-
generating plant that discharges waste into the air shifts its
costs to others, who must endure irritating smog. By shifting
these costs to others, polluting firms lower their production
costs, which allows them to lower their prices to customers
and/or increase their own profits. Polluting governments have
lower costs of disposing their community’s waste, which allows
them to lower taxes for their own citizens. As long as these
costs of production can be shifted to others, polluting
individuals, firms, and governments have no incentive to
minimize waste or develop alternative techniques of production.
Costs of Regulation.
Environmental policies are costly. These costs are often ignored
when environmental regulations are considered. Direct spending
by business and government for pollution abatement and control
has grown rapidly over recent years. Yet governments
themselves—federal, state, and local governments combined—
pay less than one-quarter of the environmental bill. Businesses
and consumers pay over three-quarters of the environmental
bill. Governments can shift the costs of their policies onto
private individuals and firms by enacting regulations requiring
pollution control. A government’s own budget is unaffected by
these regulations, but the costs are paid by society.
FIGURE 10–1 Cost Benefit Ratio in Environmental Protection
Costs rise exponentially as society tries to eliminate the last
measure of pollution.
Benefits in Relation to Costs.
Public choice theory requires that environmental policies be
evaluated in terms of their net benefits to society; that is, the
costs of environmental policies should not exceed their benefits
to society. It is much less costly to reduce the first 50 to 75
percent of any environmental pollutant or hazard than to
eliminate all (100 percent) of it (see Figure 10–1). As any
pollutant or hazard is reduced, the cost of further reductions
rises and the net benefits to society of additional reductions
decline. As the limit of zero pollution or zero environmental
risk is approached, additional benefits are minuscule but
additional costs are astronomical. Ignoring these economic
realities simply wastes the resources of society, lowers our
standard of living, and in the long run impairs our ability to
deal effectively with any societal problem, including
environmental protection.
Environmental Externalities
The air and water in the United States are far cleaner today than
in previous decades. This is true despite growth in population
and even greater growth in waste products. Nonetheless,
genuine concern for environmental externalities centers on the
disposal of solid waste (especially hazardous wastes), water
pollution, and air pollution.
Solid Waste Disposal.
Every American produces about 4.5 pounds of solid waste per
day (see Table 10–1). The annual load of waste dumped on the
environment includes 82 million tons of paper, 48 billion cans,
26 billion bottles and jars, 2 billion disposable razors, 16 billion
disposable diapers, and 4 million automobiles and trucks. The
nation spends billions of dollars annually on hauling all this
away from homes and businesses.
TABLE 10–1 Growth in Solid Wastes Each day the average
American produces more than four pounds of waste; about 30
percent of waste can be recycled.
There are three methods of disposing of solid wastes—landfills,
incineration, and recycling. Modern landfills have nearly
everywhere replaced town dumps. Landfills are usually lined
with clay so that potentially toxic wastes do not seep into the
water system. Even so, hazardous wastes are separated from
those that are not hazardous and handled separately. Given a
reasonable site, there is nothing especially wrong with a landfill
that contains no hazardous wastes. However, landfill sites need
to meet strict standards and people do not want landfills near
their residences. These conditions combine to make it difficult
to develop new landfills.
Contrary to popular rhetoric, there is no “landfill crisis”; the
nation is not “running out of land.” However, both government
agencies and private waste disposal firms are frequently
stymied by the powerful, organized NIMBYs (“not in my back
yard”). Landfill sites are plentiful but local opposition is always
strong. Timid politicians cannot confront the NIMBYs, so they
end up overusing old landfills or trying to ship their garbage
elsewhere.
Another alternative is to burn the garbage. Modern incinerators
are special plants, usually equipped with machinery to separate
the garbage into different types, with scrubbers to reduce air
pollution from the burning and often with electrical generators
powered by heat from the garbage fire. Garbage is put through a
shredder to promote even burning; metal is separated out by
magnets, and the garbage is passed over screens that separate it
further. At this point about half the garbage has been removed
and hauled to a landfill. The remaining garbage is shredded still
further into what is called fluff, or perhaps it is compressed into
pellets or briquets. This material is then burned, usually at
another site and perhaps together with coal, to produce
electricity. The ash is handled by the public utility as it would
handle any other ash, which often means selling it to towns to
use on roads. One problem with this method is the substances
emitted from the chimney of the incinerator or the utility that is
burning the garbage. Another problem: because the garbage
separated during the screening phase still has to be disposed of,
the need for landfill sites is only reduced, not eliminated.
A third method of reducing the amount of solid waste is
recycling. Recycling is the conversion of wastes into useful
products. Most of the time, waste cannot be recycled into the
same product it was originally but rather into some other form.
Newspapers are recycled into cardboard, insulation, animal
bedding, and cat litter, but in an exception to the general rule,
some are recycled into newsprint.
(Dye 210-213)
Overall, about 30 percent of all solid waste in the United States
is recovered for reuse.1 This is a notable improvement over the
mere 10 percent that was recycled 30 years ago. Some materials
lend themselves fairly well to recycling (e.g., aluminum cans,
paper products), but other materials do not (e.g., plastics). At
present there is more material available for recycling than
plants can effectively use; millions of tons of recycled
newspapers are either piled up as excess inventory in paper
mills or dumped or burned. Nonetheless, recycling does have an
effect in reducing the load on incinerators and landfills.
Hazardous Waste.
Hazardous (toxic) wastes are those that pose a significant threat
to public health or the environment because of their “quantity,
concentration, or physical, chemical, or infectious
characteristics.”2 The Resource Conservation and Recovery Act
of 1976 gave the Environmental Protection Agency (EPA) the
authority to determine which substances are toxic and the EPA
has so classified several hundred substances. Releases of more
than a specified amount must be reported to the National
Response Center. Substances are considered hazardous if they
easily catch fire, are corrosive, or react easily with other
chemicals. Many substances are declared toxic by the EPA
because massive daily doses administered to laboratory animals
cause cancers to develop. Toxic chemical releases must also be
reported annually. These reports show that toxic releases have
been reduced by more than half over the last decade.3 Thus far,
the United States has avoided any toxic releases comparable to
the accident in Bhopal, India, in 1984, which killed almost
3,000 people.
Nuclear wastes create special problems. These are the wastes
from nuclear fission reactors and nuclear weapons plants. Some
have been in existence for 50 years. Because the waste is
radioactive and some of it stays radioactive for thousands of
years, it has proven very difficult to dispose of. Current plans to
store some wastes in deep, stable, underground sites have run
into local opposition. Most nuclear waste in the United States is
stored at the site where it was generated, pending some long-
term plan for handling it.
Hazardous wastes from old sites also constitute an
environmental problem. These wastes need to be moved to more
secure landfills. Otherwise, they can affect the health of people
living near the waste site, often by seeping into the water
supply. The EPA is committed to cleaning up such sites under
the Superfund laws of 1980 and 1986. As a first step, it
developed a National Priority List of sites that needs attention,
based on a hazard ranking system. The EPA listed about 1,300
hazardous waste sites. Cleanups have been done by the EPA
itself, other federal state or local government agencies, or the
company or party responsible for the contamination.
Water Pollution.
Debris and sludge, organic wastes, and chemical effluents are
the three major types of water pollutants. These pollutants come
from (1) domestic sewage, (2) industrial waste, (3) agricultural
runoff of fertilizers and pesticides, and (4) “natural” processes,
including silt deposits and sedimentation, which may be
increased by nearby construction. A common standard for
measuring water pollution is biochemical oxygen demand
(BOD), which identifies the amount of oxygen consumed by
wastes. This measure, however, does not consider chemical
substances that may be toxic to humans or fish. It is estimated
that domestic sewage accounts for 30 percent of BOD, and
industrial and agricultural wastes for 70 percent.
Primary sewage treatment—which uses screens and settling
chambers, where filth falls out of the water as sludge—is fairly
common. Secondary sewage treatment is designed to remove
organic wastes, usually by trickling water through a bed of
rocks 3 to 10 feet deep, where bacteria consume the organic
matter. Remaining germs are killed by chlorination. Tertiary
sewage treatment uses mechanical and chemical filtration
processes to remove almost all contaminants from water. Some
cities dump sewage sludge into the ocean after only primary
treatment or no treatment at all. Although federal law prohibits
dumping raw sewage into the ocean, it has proven difficult to
secure compliance from coastal cities. Federal water pollution
abatement goals call for the establishment of secondary
treatment in all American communities. In most industrial
plants, tertiary treatment ultimately will be required to deal
with the flow of chemical pollutants. But tertiary treatment is
expensive; it costs two or three times as much to build and
operate a tertiary sewage treatment plant as it does a secondary
plant.
Phosphates are major water pollutants that overstimulate plant
life in water, which in turn kills fish. Phosphates run off from
fertilized farm land. Farming is the major source of water
pollution in the United States.
Waterfronts and seashores are natural resources. The growing
numbers of waterfront homes, amusement centers, marinas, and
pleasure boats are altering the environment of the nation’s
coastal areas. Marshes and estuaries at the water’s edge are
essential to the production of seafood and shellfish, yet they are
steadily shrinking with the growth of residential-commercial-
industrial development. Oil spills are unsightly. Although
pollution is much greater in Europe than in America, America’s
coastal areas still require protection. Federal law makes
petroleum companies liable for the cleanup costs of oil spills
and outlaws flushing of raw sewage from boat toilets. The
EXXON Valdez oil spill in Alaska in 1989 focused attention on
the environmental risks of transporting billions of barrels of
foreign and domestic oil each year in the United States.
The federal government has provided financial assistance to
states and cities to build sewage treatment plants ever since the
1930s. Efforts to establish national standards for water quality
began in the 1960s and culminated in the Water Pollution
Control Act of 1972. This “Clean Water Act” set “national
goals” for elimination of all discharges of all pollutants into
navigable waters; it required industries and municipalities to
install “the best available technology”; it gave the EPA
authority to initiate legal actions against pollution caused by
firms and governments; it increased federal funds available to
municipalities for the construction of sewage treatment plants.
The EPA is authorized by the Safe Drinking Water Act of 1974
to set minimum standards for water quality throughout the
nation. The EPA does not set a zero standard for fecal bacteria
or phosphate or other pollutants; to do so would commit the
nation to astronomical cost projections for “clean” water and
would never be possible to attain anyway. The EPA has
considerable power to raise or lower standards, and hence to
increase or reduce costs.
Water quality in the United States has improved significantly
over the years (see Table 10–2). The problem, of course, is that
removing all pollutants is neither cost-effective nor possible.
Air Pollution.
The air we breathe is about one-fifth oxygen and a little less
than four-fifths nitrogen, with traces of other gases, water
vapor, and the waste products we put into it. Air pollution is
caused, first of all, by the gasoline-powered internal combustion
engines of cars, trucks, and buses. The largest industrial
polluters are petroleum refineries, smelters (aluminum, copper,
lead, and zinc), and iron foundries. Electrical power plants also
contribute to total air pollutants by burning coal or oil for
electric power. Heating is also a major source of pollution;
homes, apartments, and offices use coal, gas, and oil for heat.
Another source of pollution is the incineration of garbage,
trash, metal, glass, and other refuse by both governments and
industries.
TABLE 10–2 Improvements in Water Quality Water quality has
improved dramatically over the last three decades.
NOTE: Figures are violations rates—the proportion of measures
that violate the EPA standards.
SOURCE: Environmental Protection Agency, National Water
Quality Inventory, 2002.
Air pollutants fall into two major types: particles and gases.
The particles include ashes, soot, and lead, the unburnable
additive in gasoline. Often the brilliant red sunsets we admire
are caused by large particles in the air. Less obvious but more
damaging are the gases: (1) sulfur dioxide, which in
combination with moisture can form sulfuric acid; (2)
hydrocarbons—any combination of hydrogen and carbon; (3)
nitrogen oxide, which can combine with hydrocarbons and the
sun’s ultraviolet rays to form smog; and (4) carbon monoxide,
which is produced when gasoline is burned.
The EPA sets limits on fine particulate matter (soot, dust) in the
air. But many large cities, for example New York, Los Angeles,
Chicago, and Washington, DC, exceed these limits. A recent
federally financed study reported that “the risk of dying from
lung cancer as well as heart disease in the most polluted cities
was comparable to the risk associated with non-smokers being
exposed to second-hand smoke over a long period of time.”
FIGURE 10–2 Improvements in Air Quality
Contrary to much popular opinion, the air is much cleaner today
than in prior years.
SOURCE: www.epa.gov/air/airtrends.
The air we breathe is significantly cleaner today than thirty
years ago (see Figure 10–2). Federal clean air legislation
(described later in this chapter) is generally credited with
causing these improvements. The Environmental Protection
Agency claims that the Clean Air Act of 1970 and subsequent
amendments to it have resulted in an overall reduction in
principal pollutants since 1970 of 57 percent. This improvement
in air quality has come about despite increases in the gross
domestic product (207 percent), vehicle miles traveled (179
percent), energy consumption (49 percent), and population
growth (47 percent). (See Figure 10–3.)
Interest Group Effects
Americans live longer and healthier lives today than at any time
in their country’s history. Life expectancy at birth is now 78.5
years (75.6 for males; 81.4 for females), up eight full years
since 1970. Cancer deaths are up slightly but not because of
environmental hazards. The primary causes of premature death
are what they have always been: smoking, diets rich in fat and
lean in fiber, lack of exercise, and alcohol abuse. Yet public
opinion generally perceives the environment as increasingly
contaminated and dangerous, and this perception drives public
policy.
Interest Group Economics.
Organized environmental interests must recruit memberships
and contributions (see Table 10–3). They must justify their
activities by publicizing and dramatizing environmental threats.
When Greenpeace boats disrupt a U.S. Navy exercise, they are
attracting the publicity required for a successful direct-mail
fund-raising drive. The mass media, especially the television
networks, welcome stories that capture and hold audiences’
attention. Stories are chosen for their emotional impact, and
threats to personal life and safety satisfy the need for drama in
the news. Statistics that indicate negligible risks or scientific
testimony that minimizes threats or presents ambiguous findings
do not make good news stories. Politicians wish to be perceived
as acting aggressively to protect citizens from any risk, however
minor. Politicians want to be seen as “clean” defenders of the
pristine wilderness. And government bureaucrats understand
that the greater the public fear of environmental threat, the
easier it is to justify expanded powers and budgets.
Shaping Public Opinion.
TABLE 10–3 Leading Environmental Organizations
Environmental politics in Washington are heavily influenced by
environmental interest groups.
Interest group activity and media coverage of environmental
threats have succeeded in convincing most Americans that
environmental pollution is getting worse. Evidence that the
nation’s air and water are measurably cleaner today than in the
1970s is ignored. Opinion polls report that 57 percent of
Americans agree with this statement: “Protecting the
environment is so important that requirements and standards
cannot be too high and continued environmental improvements
must be made regardless of cost.”5 If taken seriously, such an
attitude would prevent either scientific or economic
considerations from guiding policy. Environmentalism threatens
to become a moral crusade that dismisses science and
economics as irrelevant or even wicked. In such a climate of
opinion, moral absolutism replaces rational public policy. (Dye
216-217)
FIGURE 10–3 Comparison of Growth and Emissions
Air pollution has decreased even while the economy has grown,
the population has grown, more miles are traveled, and more
energy is consumed.
SORUCE: Environmental Protection Agency, “Six Common Air
Pollutants,” www.epa.gov.
Interest Group Politics.
Everyone is opposed to pollution. It is difficult publicly to
oppose clean air or clean water laws—who wants to stand up for
dirt? Thus the environmentalists begin with a psychological and
political advantage: they are “clean” and their opponents are
“dirty.” The news media, Congress, and executive agencies can
be moved to support environmental protection measures with
little consideration of their costs—in job loss, price increases,
unmet consumer demands, increased dependence on foreign
sources of energy. Industry—notably the electric power
companies, oil and gas companies, chemical companies,
automakers, and coal companies—must fight a rearguard action,
continually seeking delays, amendments, and adjustments in
federal standards. They must endeavor to point out the
increased costs to society of unreasonably high standards in
environmental protection legislation. But industry is suspect;
the environmentalists can charge that industry opposition to
environmental protection is motivated by greed for higher
profits. And the charge is partially true, although most of the
cost of antipollution efforts is passed on to the consumer in the
form of higher prices.
The environmentalists are generally upper-middle-class or
upper-class individuals whose income and wealth are secure.
Their aesthetic preferences for a no-growth, clean, unpolluted
environment take precedence over jobs and income, which new
industries can produce. Workers and small business people
whose jobs or income depend on energy production, oil
refining, forestry, mining, smelting, or manufacturing are
unlikely to be ardent environmentalists. But there is a
psychological impulse in all of us to preserve scenic beauty,
protect wildlife, and conserve natural resources. It is easy to
perceive industry and technology as the villain, and “man
against technology” has a humanistic appeal.
NIMBY Power.
Environmental groups have powerful allies in the nation’s
NIMBYs—local residents who feel inconvenienced or
threatened by specific projects. Even people who otherwise
recognize the general need for new commercial or industrial
developments, highways, airports, power plants, pipelines, or
waste disposal sites, nonetheless voice the protest “not in my
back yard,” earning them the NIMBY label. Although they may
constitute only a small group in a community, they become very
active participants in policymaking—meeting, organizing,
petitioning, parading, and demonstrating. NIMBYs are
frequently the most powerful interests opposing specific
developmental projects and are found nearly everywhere. They
frequently take up environmental interests, using environmental
arguments to protect their own property investments.
Radical Environmentalism.
At the extreme fringe of the environmental movement one finds
strong opposition to economic development, to scientific
advancement, and even to humanity. According to the Club of
Rome (a radical environmental organization), “The real enemy,
then, is humanity itself.”6 The “green” movement is
international, with well-organized interest groups and even
political parties in Western European nations. Its program to
“Save the Planet” includes the deindustrialization of Western
nations; reduction of the human population; elimination of all
uses of fossil fuels, including automobiles; the elimination of
nuclear power; an end to cattle raising, logging, land clearance,
and so on; and the transfer of existing wealth from the
industrialized nations to underdeveloped countries.7
Global Warming/Climate Change
Gloomy predictions about catastrophic warming of the Earth’s
surface have been issued by the media and environmental
interest groups in support of massive new regulatory efforts.
Global warming is theorized to be a result of emissions of
carbon dioxide and other gases that trap the sun’s heat in the
atmosphere. As carbon dioxide increases in the atmosphere as a
result of increased human activity, more heat is trapped.
Deforestation contributes to increased carbon dioxide by
removing trees, which absorb carbon dioxide and produce
oxygen. The dire predictions of greenhouse effects include
droughts and crop destruction, melting of the polar ice caps, and
ocean flooding.
Climate Change.
It is true that the Earth’s atmosphere creates a greenhouse
effect; if not, temperatures on the Earth’s surface would be like
those on the moon—unbearably cold (–270°F) at night and
unbearably hot (+212°F) during the day. The greenhouse gases,
including carbon dioxide, moderate the Earth’s surface
temperature. And it is true that carbon dioxide is increasing in
the atmosphere, an increase of about 25 percent since the
beginning of the Industrial Revolution in 1850, and 13 percent
since 1970 (see Figure 10–4).
It is also true that the Earth has been warming over the past
century, since the beginning of the Industrial Revolution.
Global average temperatures have risen about 1.4°F. Average
sea levels have risen and the northern hemispheric snow cover
has diminished. Various computer simulations of the effect of
increased dioxides in the atmosphere have predicted future
increases in temperature ranging from 1° (not significant) to 8°
(significant if it occurs rapidly).8
Global climate change is caused by a variety of factors: slight
changes in the Earth’s orbit, causing ice ages over millennia
(the last ice age, when average temperatures were 9° cooler,
ended 15,000 years ago.); solar activity including sun flares (a
“little” ice age between 1500–1850 is estimated to have cooled
the Earth by about 2°F); and volcanic activity, which tends to
block sunlight and contribute to short-term cooling (a volcano
in Indonesia in 1815 lowered global temperatures by 5°F and
historical accounts in New England described 1816 as “the year
without a summer”).
Is human activity contributing to global warming? Fossil fuels
emit carbon dioxide (CO2) into the atmosphere. Since the
beginning of the Industrial Revolution atmospheric carbon
dioxide concentrations have increased by about 25 percent. This
increase corresponds to an increase in average global
temperature (see Figure 10–4). This correspondence does not
prove causation, but it underlies the fundamental argument of
global warming theory.
International Panel on Climate Change.
A UN-sponsored International Panel on Climate Change (IPCC)
reported with “very high confidence” that human activity since
the Industrial Revolution has contributed to increases in
atmospheric concentrations of carbon dioxide, methane, and
nitrous oxide.9 The IPCC does not do its own research but
rather assesses scientific reports from other bodies. Its Fourth
Assessment Report: Climate Change 2007 is widely cited by
environmentalists: “Most of the observed increase in global
average temperatures since the mid-20th century is very likely
due to the observed increase in anthropogenic [caused by human
activity] greenhouse gas concentrations.” The popularity of the
report was reflected in the awarding of a Nobel Prize to the
IPCC and to its principal publicist, Al Gore. Gore’s movie, An
Inconvenient Truth dramatizes the effects of global warming.
(Dye 217-220)
FIGURE 10–4 Trends in Atmospheric Carbon Dioxide and
Global Surface Temperature
Recent increases in atmospheric concentrations of carbon
dioxide (CO2) have corresponded with increases in average
surface temperatures on Earth. The sharpest rises in CO2 and
temperatures have occurred since 1970.
SOURCE: Pew Center on Global Climate Change,
www.pewclimate.org.
Greenhouse Gases.
Carbon dioxide (CO2) contributes about three-quarters of total
greenhouse gas emissions; methane and nitrous oxide are also
classified as greenhouse gases. The principal source of CO2
emissions are power plants (30 percent), industrial processes
(21 percent), transportation (19 percent), residential (13
percent), land use (9 percent), and other fossil fuel uses (8
percent). Any serious effort to reduce overall greenhouse gas
emissions must deal with electric utilities, waste disposal
facilities, natural gas producers, petroleum refineries, smelters,
and motor vehicle emissions, among other sources.
Recently China surpassed the United States as the largest single
national contributor of atmospheric pollutants. Both nations
together currently produce about 50 percent of the world’s
output of greenhouse gases. But China, together with India and
Indonesia, contributes to the largest annual increases in
greenhouse emissions. Whatever policies the United States
adopts to limit its own emissions, the Earth’s atmosphere will
continue to be polluted by other nations. Environmentalists
argue that the United States must act first in order to set an
example for the world.
The Rio Treaty.
Environmentalists argue that “drastic action” is required now to
avert “catastrophic” global warming. Former Vice President Al
Gore is a leading exponent of the view that governments cannot
afford to wait until the scientific evidence demonstrates
conclusively that human activity contributes to global warming.
Rather, governments must immediately impose a system of
“global environmental regulations” in order to “save the
planet.”10 Inasmuch as Third World nations are just beginning
to industrialize, they pose the greatest threat of new sources of
global pollution. But the industrialized nations are responsible
for “undermining the Earth’s life support system” (the United
States is usually singled out as the primary culprit), and
therefore they must compensate poorer nations in exchange for
their pledge not to add to global pollution. The international
environmental agenda includes massive transfers of wealth from
industrialized nations to less developed countries.
The Rio Treaty incorporates these ideas. It is a product of the
“Earth Summit,” officially the United Nations Conference on
Environment and Development held in Rio de Janeiro, Brazil, in
1992. It was attended by 178 nations as well as hundreds of
environmental interest groups, officially sanctioned as
“nongovernmental organizations” or “NGOs.” The conference
produced a Global Climate Change Treaty, signed by President
George H.W. Bush, but not ratified by the U.S. Senate, which
declares, among other things, that “lack of scientific certainty
shall not be used as a reason for postponing cost-effective
measures to prevent environmental degradation”! The statement
is, of course, a contradiction: without scientific information, it
is impossible to determine cost-effectiveness.12
Copenhagen Conference.
Governments and non-governmental organizations have been
meeting in Copenhagen Denmark with the goal of developing a
legally binding treaty to reduce world-wide carbon emissions.
The negotiations are sponsored by the UN Framework
Convention on Climate Change. The United States is among the
192 countries participating in the Conference; the United States
favors the development of nonbinding pledges regarding carbon
emissions, rather than legally binding emissions cuts. Less
developed nations have demanded compensation from the
developed nations in exchange for limiting growth in their
emissions. At present the prospects for agreement appear dim.
The Kyoto Protocol.
In 1997, a far-reaching amendment to the Rio Treaty, known as
the Kyoto Protocol, was negotiated under the United Nations
Convention on Global Climate Change. Whereas the Rio Treaty
set voluntary national goals for reducing greenhouse gases, the
Kyoto agreement required the United States and other developed
nations to reduce their emissions below 1990 levels sometime
between 2008 and 2012. Reductions by developed nations were
designed to offset expected increases in emissions by
developing nations. The reduction mandated for the United
States was 7 percent below its 1990 level—a reduction that
would entail approximately a 40 percent reduction in fossil fuel
use. The Clinton administration supported the Kyoto Protocol,
but declined to submit it for ratification to the U.S. Senate in
view of its likely defeat in that body. The Bush administration
opposed the Protocol.
Energy Policy
Environmental policy and energy policy are closely intertwined.
Currently America gets most of its energy from fossil fuels—
oil, natural gas, and coal (see Figure 10–5). These sources
produce pollutants, including carbon dioxide emissions that
appear related to global climate change. Despite heavy
subsidization by the federal government, “renewable” energy
sources—hydroelectric, geothermal, solar, wind, and biomass—
account for only about 7 percent of the energy used in the
United States.
Energy Consumption.
Electric power plants account for the greatest share of energy
produced in the United States (see Figure 10–5). About half of
all electric generating plants are powered by coal; almost 20
percent are nuclear powered; most of the remainder are powered
from oil or natural gas; less than 10 percent of electric power is
derived from renewable energy sources. Transportation accounts
for nearly 30 percent of total energy use in America, almost all
of it from oil.
Energy consumption per person in United States has stabilized
over the last thirty years. Growth in overall energy consumption
has matched population growth. Energy consumption has
actually declined relative to the gross national product,
suggesting that America is becoming more efficient over time in
energy use. And energy expenditures have declined as a share of
the GDP. This good news is not widely reported in the mass
media.
FIGURE 10–5 Energy Sources and Uses
The U.S. gets most of its energy from oil, gas, and coal, all of
which produce greenhouse gases. Clean nuclear and renewable
sources provide relatively little energy for the country. Electric
power plants and motor vehicles together use nearly 70 percent
of the energy generated.
SOURCE: Data from Energy Information Administration, U.S.
Department of Energy, www.eia.doe.gov.
Energy Supply.
Supply-side energy policies emphasize the search for more
sources of energy. Domestic oil production can be increased
through exploration and drilling in public lands and offshore
waters. (“Drill, baby, drill” became a popular slogan at
Republican campaign stops in 2008.) Drilling in the Alaska
National Wildlife Refuge (ANWR) in Alaska is an especially
controversial option. Natural gas is more plentiful than
petroleum, but its widespread use would require a complete
overhaul of the nation’s automobile and truck fleets to run on
natural gas rather than gasoline. Nuclear power promises a
clean source of energy for electrical power plants, but to date
political struggles have effectively foreclosed the nuclear option
(see “Nuclear Industry Meltdown” later in this chapter). The
federal government heavily subsidizes research and
development into “renewable” energy sources—land, solar,
geothermal, and biomass (including ethanol production from
corn). But none of these sources appear to be commercially
feasible on any significant scale. Nevertheless the call for
greater reliance on these sources of energy remains politically
very popular.
Fuel Efficiency.
The federal government requires automobile manufacturers to
maintain corporate average fuel efficiency (CAFE) standards in
the production of automobiles and light trucks. These averages
are calculated from highway miles-per-gallon figures for all
models of cars and light trucks produced by each manufacturer.
(In recent years, the CAFE standards for cars has been 27.5
miles per gallon, and for light trucks, vans, and sports utility
vehicles, 22.2 miles per gallon.) Determining CAFE standards
engenders near constant political conflict in Washington, pitting
auto manufacturers and auto workers’ unions against
environmental and consumer groups. The popularity of pickup
trucks, minivans, and sports utility vehicles means that overall
fuel efficiency on the roads is difficult to improve. Alternative
fuel vehicles and hybrids—cars powered entirely or in part by
electricity, natural gas, hydrogen, ethanol, etc.—constitute less
than 5 percent of new vehicle sales.
Projections.
The U.S. Department of Energy annually produces an “Energy
Outlook” that projects energy use in greenhouse gas emissions
to 2030. Among its current projections:11
•Growth in energy consumption in greenhouse gas emissions is
likely to moderate as a result of government policies and high
energy prices.
•Fossil fuels will continue to provide nearly 80 percent of total
energy use.
•Energy efficiencies will cause declines in per capita energy use
and declines in energy use per dollar of GDP.
•Hybrid motor vehicles—partly powered by electricity—are
projected to increase significantly in numbers.
•Growth in electrical use will moderate with improved
efficiency in homes and industry.
•Nonrenewable energy sources will increase, but remain less
than 10 percent of total energy supply.
•Growth in energy-related carbon dioxide emissions will slow
along with slowing growth in energy use.
Cap and Trade
In his first budget message to Congress, President Barack
Obama recommended an innovative approach to energy policy.
In addition to pledging federal subsidies for research and
development in “clean energy technologies,” he proposed a new
carbon emissions trading program known as “cap and trade.”
A Ceiling on Carbon Emissions.
The cap and trade program envisions the federal government
setting overall national ceilings on carbon emissions. The
government would then hold a national auction in which
polluting industries and firms could purchase tradable emission
allowances. The total amount of emission allowances auctioned
off would not exceed the cap. In effect, industries would be
purchasing allowances to pollute. These allowances could be
traded on an open market, allowing polluting industries to keep
polluting but at a price, and at the same time, encouraging
industries to invest dollars in reducing carbon emissions. An
industry that succeeded in reducing emissions below its
allowance could then sell its allowance to other industries.
Relying in Part on the Market Mechanism.
The cap and trade approach to reducing carbon emissions is
recommended over direct regulatory control. Because it relies in
part on a market mechanism, it is sometimes labeled free-market
environmentalism. Setting the overall cap is a regulatory
measure, but individual firms are free to choose how or if they
will reduce their emissions. The system encourages innovation
by individual firms. If they are successful in reducing their
emissions, they can sell their allowances to other firms.
Costs to Consumers.
The cost of the cap and trade program would be borne by all
energy users. The federal government would actually make
money from auction revenues. The costs to energy consumers
would be largely invisible, passed on by industries in the form
of price increases. Everything from gasoline prices to electric
bills would incorporate the prices industries paid for emission
allowances at auction or in trades.
Enforcement.
The federal government would put in place a vast new
bureaucracy to oversee the carbon emissions of individual
industries and firms. It will be necessary to measure the “carbon
footprint” of industries and firms to ensure that they are
operating within the emission allowances purchased at auction
or in trade.
The Nuclear Industry Meltdown
Nuclear power is the cleanest and safest form of energy
available. But the political struggle over nuclear power has all
but destroyed early hopes that nuclear power could reduce U.S.
dependence on fossil fuels. Nuclear power once provided about
20 percent of the nation’s total energy. Many early studies
recommended that the United States strive for 50 percent
nuclear electric generation. But under current policies it is
unlikely that nuclear power will ever be able to supply any more
energy than it does today—less than ten percent (see Figure 10–
5). The nuclear industry itself has been in a state of
“meltdown,” and the cause of the meltdown is political, not
technological.
History of Regulation.
In its developmental stages, nuclear power was a government
monopoly. The Atomic Energy Act of 1946 created the Atomic
Energy Commission (AEC), which established civilian rather
than military control over nuclear energy. The AEC was
responsible for the research, development, and production of
nuclear weapons, as well as the development of the peaceful
uses of nuclear energy. The AEC contracted with the
Westinghouse Corporation to build a reactor and with the
Duquesne Light Company to operate the world’s first nuclear
power plant at Shippingport, Pennsylvania, in 1957. Under the
Atomic Energy Act of 1954 the AEC granted permits to build,
and licenses to operate, nuclear plants; the AEC also retained
control over nuclear fuel.
The AEC promoted the growth of the nuclear industry for over
20 years. But opponents of nuclear power succeeded in the
Energy Reorganization Act of 1974 in separating the nuclear
regulatory function from the research and development function.
Today a separate agency, the Nuclear Regulatory Commission
(NRC), regulates all aspects of nuclear power. Only 104 nuclear
power plants are currently in the United States today.
“No-nukes.”
Nuclear power has long been under attack by a wide assortment
of “nonuke” groups. The core opposition is found among
environmental activist groups. But fear plays the most important
role in nuclear politics. The mushroom cloud image of the
devastation of Japanese cities at the end of World War II is still
with us. The mass media cannot resist dramatic accounts of
nuclear accidents. The public is captivated by the “China
syndrome” story—an overheated nuclear core melts down the
containing vessels and the plant itself and releases radioactivity
that kills millions.
Nuclear power offers a means of generating electricity without
discharging any pollutants into the air or water. It is the
cleanest form of energy production. It does not diminish the
world’s supply of oil, gas, or coal. However, used reactor fuel
remains radioactive for hundreds of years and there are
potential problems in burying this radioactive waste. Spent fuel
is now piling up in storage areas in specially designed pools of
water at nuclear power sites. When these existing storage places
are filled to capacity, spent fuel will have to be transported
somewhere else, adding to new complaints about the dangers of
radioactive waste. There are many technical alternatives in
dealing with waste, but there is no political consensus about
which alternative to choose.
Safety.
The nuclear power industry in the United States has a 60-year
record of safety. No one has ever died or been seriously harmed
by radioactivity from a nuclear power plant in the United States.
This record includes more than 100 nuclear power plants
operated in the United States and hundreds of nuclear-powered
surface and submarine ships operated by the U.S. Navy. Despite
sensational media coverage, the failure of the nuclear reactor at
Three Mile Island, Pennsylvania, in 1979 did not result in injury
to anyone or cause damage beyond the plant. There are about
450 nuclear power plants operating outside of the United States.
France generates 76 percent of its electricity by nuclear means.
The worst nuclear accident in history occurred at Chernobyl in
the Ukraine in 1986; it resulted in 31 immediate-term deaths
from radiation.
Zero risk is an impossible standard, and the costs of efforts to
approach zero risk are astronomical. Under popular pressure to
achieve near-zero risk, the NRC has imposed licensing
requirements that now make nuclear plants the most expensive
means of generating electricity. No new nuclear plants have
been built in over two decades, and private utilities have
canceled dozens of planned nuclear plants.
The stated policy of the national government may be to keep
open the nuclear power option, but the actual effect of nuclear
regulatory policy has been to foreclose that option.
The Future of Nuclear Power.
What are the prospects for a “nuclear renaissance”? A variety of
factors suggest a reexamination of the utility of nuclear power:
the U.S. Department of Energy projects that electricity demand
will rise 25 percent by 2030, requiring the construction of
hundreds of new power plants; oil price increases make nuclear
power generation more competitive; concerns over global
warming and pollution from fossil fuel use drive a new interest
in nuclear power; and national security concerns regarding U.S.
dependence on foreign oil suggests the need to develop reliable
domestic power sources.
But reviving the nuclear energy industry will require, first of
all, a streamlined and cost-conscious regulatory environment,
one that encourages private companies to make the long-term
capital investments required to bring new nuclear plants into
operation. Secondly, the federal government must decide on,
finance, and implement a nuclear waste management program,
one that includes spent nuclear materials from both military and
private power uses. Finally, nuclear power cannot be revived
without federal subsidies and loan guarantees for private power
companies to encourage them to move forward building new
nuclear plants. Yet even if Washington responded favorably to
nuclear industry requirements, new plants are not likely to
begin producing power in the United States for another ten
years.
Politicians and Bureaucrats: Regulating the Environment
Federal environmental policymaking began in earnest in the
1970s with the creation of the Environmental Protection Agency
(EPA) and the passage of clean air and water acts. Potentially,
the EPA is the most powerful and far-reaching bureaucracy in
Washington today, with legal authority over any activity in the
nation that affects the air, water, or ground.
The Environmental Protection Agency.
The EPA was created in an executive order by President Richard
Nixon in 1970 to reorganize the federal bureaucracy to
consolidate responsibility for (1) water pollution, (2) air
pollution, (3) solid waste management, (4) radiation control,
and (5) hazardous and toxic substance control. The EPA is a
regulatory agency with power to establish and enforce policy.
The National Environmental Protection Act.
In 1970 Congress created the Council on Environmental Quality
(CEQ) to advise the president and Congress on environmental
matters. The CEQ is an advisory agency. However, the act
requires all federal agencies as well as state, local, and private
organizations receiving federal monies to file lengthy
“environmental impact statements.” If the CEQ wants to delay
or obstruct a project, it can ask for endless revisions, changes,
or additions in the statement. The CEQ cannot by itself halt a
project, but it can conduct public hearings for the press,
pressure other governmental agencies, and make
recommendations to the president. The courts have ruled that
the requirement for an environmental impact statement is
judicially enforceable.
The Clean Air Act of 1970.
The Clean Air Act of 1970 authorized the EPA to identify air
pollutants that cause a health threat and to establish and enforce
standards of emission. The EPA began by focusing on
automobile emissions, requiring the installation of pollution
equipment on all new cars. The EPA ordered lead removed from
auto fuel and engines redesigned for lead-free gasoline. It also
ordered the installation of emission controls in automobiles.
More radical solutions advanced by the EPA (for example, to
halt driving in certain cities) were blocked by courts and
Congress. The EPA was even more aggressive in pursuing
stationary sources of air pollution with requirements for
“smokestack scrubbers,” low-sulfur coal, and other costly
devices.
The Water Pollution Control Act of 1972.
This act stiffened early antipollution laws, but set an unrealistic
goal: “that the discharge of pollutants into the navigable waters
be eliminated by 1985.” After a flood of lawsuits the EPA was
forced to abandon the zero-discharge standard. Forcing
municipal governments to clean up their discharges proved more
difficult than forcing industry to do so. Many municipalities
remain in violation of federal water quality standards.
Endangered Species Act of 1973.
This legislation authorizes the U.S. Fish and Wildlife Service to
designate endangered species for federal protection and to
regulate activities in their “critical habitat.” Initially the law
was widely praised as at least partially responsible for the
survival of nationally symbolic species such as the bald eagle;
but increasingly the law has been used to prevent landowners
from using their property in order to protect obscure varieties of
rodents, birds, and insects. Today more than 1,000 species are
on the endangered species list, and there is virtually no land in
the United States on which an endangered species does not live.
The U.S. Fish and Wildlife Service has the potential to control
any land in the nation under the Endangered Species Act.
Wetlands.
In 1975 a federal court ruled that the Clean Water Act of 1972
also applied to “wetlands” adjacent to navigable waters. This
gave the EPA control over millions of acres of land, estimated
to be the equivalent of Ohio, Indiana, and Illinois combined.
The result has been a bureaucratic nightmare for owners of land
that is classified as wetlands.
Resource Conservation and Recovery Act of 1976.
The act authorizes EPA to oversee the nation’s solid waste
removal and disposal, including the regulation of landfills,
incinerators, industrial waste, hazardous waste, and recycling
programs.
Toxic Substances Control Act of 1976.
The Toxic Substances Control Act authorized the EPA to
designate hazardous and toxic substances and to establish
standards for their release into the environment.
The Comprehensive Environmental Response Act of 1980.
The Comprehensive Environmental Response Act established a
“Superfund” for cleaning up old toxic and hazardous waste
sites. Out of 20,000 potential sites, the EPA has placed more
than 1,200 on its National Priority List. The act specifies that
EPA oversee the cleanup of these sites, assessing costs to the
parties responsible for the pollution. If these parties cannot be
found or have no money, then the government’s Superfund is to
be used. But over the years, cleanup efforts have been seriously
hampered by EPA’s overly rigid site orders (for example, dirt
must be cleaned to the point where it can be safely eaten daily
by small children), lengthy lawsuits against previous owners
and users (including Little League teams) that divert funds to
legal fees, and complicated negotiations with local government
over the cleanup of old landfill sites. EPA also enforces
“retroactive liability,” holding owners liable for waste dumped
legally before the law was enacted in 1980. Under current EPA
policies, full cleanup of all hazardous waste sites on the
National Priority List would cost many billions of dollars, far
more than presidents or Congresses are likely to appropriate.
Clean Air Act of 1990.
The Clean Air Act Amendments of 1990 enacted many new
regulations aimed at a variety of perceived threats to the
environment:
Acid rain. Sulfur dioxide emissions must be cut from 20 to 10
million tons annually, and nitrogen oxide emissions must be cut
by 2 million tons. Midwestern coal-burning utilities must burn
low-sulphur coal and install added smoke-scrubbing equipment
at increased costs to their consumers.
Ozone hole. Production of chlorofluorocarbons and
hydrochlorofluorocarbons (aerosol sprays, insulating materials)
is outlawed, and new regulations are placed on chemicals used
in air conditioners and refrigerators.
Urban smog. Additional mandated pollution control equipment
is required on new automobiles. Oil companies must produce
cleaner-burning fuel. There is also a special requirement that
automobile companies produce an experimental fleet of cars to
be sold in southern California.
Toxic air pollutants. New definitions and regulations govern
more than 200 substances as “toxic air pollutants” released into
the air from a wide variety of sources, from gas stations to dry
cleaners. The EPA is given authority to require all of these
sources to install “the best available control technology” and to
provide “an ample margin of safety” for nearby residents.
EPA Regulation of Carbon Dioxide, 2009.
The Environmental Protection Agency issued an official finding
in 2009 that carbon dioxide is a danger to human health and the
environment and therefore subject to EPA regulation under the
Clean Air Act. This “endangerment finding” potentially allows
the EPA to draw up regulations governing greenhouse gas
emissions from electric power plants, refineries, chemical
plants, motor vehicles and other sources of emissions, including
schools, hospitals, homes and apartment buildings.
Encouraged by the Obama Administration, and relying heavily
on studies cited by the International Panel on Climate Change
(see above), the EPA issued its finding. Earlier in 2007 the US
Supreme Court had held that the Clean Air Act “expressly
authorized” the EPA to regulate air “pollutants” and that the
EPA itself did not challenge the contention that carbon dioxide
was a pollutant.12
The threat of EPA regulation of all carbon emissions provides
an incentive for Congress itself to act on “cap and trade.” The
EPA is busy constructing a comprehensive system for reporting
emissions of carbon dioxide and other greenhouse gases
produced by major sources in the United States. This reporting
system may provide the data for comprehensive regulation
envisioned by cap and trade.
SUMMARY
Public choice theory views environmental pollution as an
externality of human activity. Individuals, firms, and
governments frequently impose unwanted costs on others. The
environment, especially air and water, is a common-pool
resource: access is unrestricted; there are no clearly defined
property rights to it; no one has the individual responsibility of
caring for it; individuals, firms, and governments tend to use it
to carry off waste materials, thus generating unwanted costs or
externalities on everyone else. The government has a legitimate
interest in managing environmental externalities. Public choice
theory offers valuable guidelines in dealing with them.
1.Economic growth is not incompatible with environmental
protection. On the contrary, increases in wealth and advances in
technology provide the best hope for a cleaner environment.
2.Effective pollution control and risk reduction must be
balanced against its costs. Environmental policies whose costs
exceed benefits will impair society’s ability to deal effectively
with environmental problems.
3.The costs of removing additional environmental pollutants and
risks rise as we approach zero tolerance. Total elimination of
pollutants from air, water, or ground involves astronomical
costs and wastes the resources of society.
4.Rational determination of benefits and costs requires
scientific evidence. The deliberate rejection of scientific
evidence on environmental issues, and the ideological or
emotional inspiration to act even in the absence of scientific
information, renders cost-effective policymaking impossible.
5.Traditional command and control approaches to environmental
protection are less effective than market incentives.
Legislatures and bureaucrats that endeavor to devise laws and
regulations to reduce pollution are less effective than
individuals, firms, and local governments with strong market
incentives to reduce pollution in a cost-effective manner.
6.The air and water in the United States are significantly
cleaner today than in 1970, when the first major environmental
policies were enacted. Improvements in air and water quality
have occurred despite growth in the population and growth in
waste products.
7.Nonetheless, most Americans believe that pollution is
growing worse. Interest group activity and media coverage of
environmental “crises,” have pushed environmental issues to the
forefront of American politics. Predictions of global doom
create a climate of opinion that precludes rational analyses of
the benefits and costs of environmental policies.
8.Current policy initiatives focus on sulfur dioxide and nitrogen
oxide from coal-burning utilities, emissions of ozone and
carbon monoxide from automobiles and stationary sources, and
toxic air pollutants released from a wide variety of sources.
9.If firms were taxed on the basis of the pollutants they emit, a
strong market incentive would be created for a reduction in
pollution. A pollution tax would capture the externalities and
force producers and consumers to incorporate the full
environmental costs of products in the price. It would encourage
polluters to find ways themselves to reduce pollution rather than
simply comply with government regulations. Waste charges
would encourage consumers to reduce their use of waste-
producing goods.
Dye, Thomas R. Understanding Public Policy Vitalsource eBook
for Ashford University, 13th Edition. Pearson Learning
Solution
s. VitalBook file.
Nordhaus, R. & Danish, K. W. (2005). Assessing the options
for designing a mandatory U. S. greenhouse gas reduction
program. Boston College Environmental Affairs Law Review,
32(1), 97-163.
With the United States accounting for over one-fifth of global
emissions of greenhouse gases, the U.S. government is facing
pressures-from both domestic and international sources-to
establish a comprehensive mandatory reduction program to
address the risk of global climate change. If Congress decides to
move forward with such a program, it could be creating an
environmental regulatory regime of unprecedented scope and
impact. Many policymakers are considering innovative market-
based approaches to regulation, including a multibillion dollar
economy-wide "cap-and-trade" program. The authors evaluate
four models for a domestic program against a set of several
criteria, including environmental effectiveness, cost,
administrative feasibility, distributional equity, and political
acceptability.
INTRODUCTION
Until now, U.S. climate change policy at the federal level has
consisted of voluntary greenhouse gas (GHG) mitigation
programs, research and development, and a subset of energy
policies that focus on energy efficiency and renewable energy.
However, the U.S. government is facing pressures-from both
domestic and international sources-to establish a federal
mandatory reduction program to address the risk of global
climate change. If Congress decides to move forward with such
a program, it could be creating an environmental regulatory
regime of unprecedented scope and impact. Sources of
greenhouse gases range from electric power plants to every car
on the road. In addition, many policymakers are considering
innovative market-based approaches to regulation, including a
multi-billion dollar economy-wide cap-and-trade program.
This Article identifies issues that must be addressed in the
design of a mandatory domestic GHG reduction program. The
Article then evaluates a number of proposals, including (1)
comprehensive capand-trade programs; (2) a GHG tax; and (3) a
"sectoral hybrid" program that combines elements of a cap-and-
trade program with product efficiency standards for automobiles
and consumer products.
While there is a substantial body of opinion, particularly among
economists, that an economy-wide cap-aiicl-trade or GHG tax
program may be optimal from a cost-effectiveness point of
view, it is possible that a GHG regulatory program will be
developed from discrete familiar elements, such as existing
Corporate Average Fuel Economy (CAFE) and appliance
efficiency standards, plus large stationary source controls
modeled on the acid-rain control program. Rather than creating
a whole new system, Congress may choose the latter approach
because of both familiarity and political sensitivity regarding
program designs that result in overt increases in prices for
gasoline and home heating fuels. We review the implications of
these two fundamentally different approaches.
While this Article focuses on options for federal regulatory
policies, it is important to note that a domestic climate change
program could enhance its regulatory policies with a range of
non-regulatory measures, such as funding for research and
development into new technologies, financial and other
incentives, public education, and changes in infrastructure and
land-use policies. In addition, state and local governments may
supplement a federal regulatory program with their own policy
initiatives.1
I. U.S. GREENHOUSE GAS EMISSIONS PROFILE
Domestic climate change policy will likely focus on reductions
or sequestration of emissions of six GHGs: carbon dioxide
(CO2), methane (CH^sub 4^), nitrous oxide (N^sub 2^O), and
what have been called the "synthetic gases," hydrofluorocarbons
(HFCs), perfluorocarbons (PFCs), and sulfur hexafluoride
(SF^sub 6^).2
Because GHGs have long lifetimes in the atmosphere, it matters
little where or exactly when GHG emission reductions are
made.3 For example, one ton emitted in the United States has
the same impact as one ton emitted in Malaysia, and reducing
one ton of GHG emissions now, rather than five years from
now, will make little difference in atmospheric GHG
concentrations in 2050.4 This means that an effective regulatory
program can allow flexibility as to where emission reductions
occur and substantial but not unlimited flexibility as to when
they occur.
Different GHGs vary as to their residence lives in the
atmosphere and their heat-trapping, or "radiative forcing,"
effects.5 Some GHGs have very long atmospheric lifetimes.6
The Kyoto Protocol adopts a weighting formula called "Global
Warming Potential" (GWP), which measures the impact of one
ton of any GHG with reference to one ton of CO2.7 With such
an agreed-upon "exchange rate," policymakers can develop a
unitary program objective in terms of "CO2-equivalent" units,
which allows regulated firms to pick whatever mix of reductions
of different GHGs they believe is most cost-effective.8
A. Carbon Dioxide
Carbon dioxide emissions, resulting almost entirely from
combustion of fossil fuels, dominate GHG emissions in the
United States and are likely to be among the principal initial
targets of any domestic GHG regulatory program. In 2001,
energy-related COo emissions accounted for approximately
eighty-one percent of U.S. GWP-weighted emissions.9
Within the energy sector, the principal means of abating CO2
emissions are switching from energy sources with high carbon
content to those with low or zero carbon content, such as
renewables; improving the efficiency of energy conversion or
use; reducing energy use; and developing carbon capture and
sequestration technologies.10
Annual U.S. CO2 emissions also are affected by land use, land-
use change, and forestry (LULUCF) activities.11 Plants and
certain other biotic matter remove CO2 from the atmosphere
and store or "sequester" it as carbon, at least temporarily,
through the process of photosynthesis.12 Hence, forests and
agricultural lands are "reservoirs" of carbon and a range of
activities can enhance their sequestration potential.13
Conversely, certain land use changes, such as deforestation, can
oxidize the carbon stored in biotic matter, thereby leading to
CO2 emissions.14
B. Other GHGs
Methane is the second-largest contributor to U.S. GHG
emissions, constituting 8.7% of total U.S. GWP-weighted
emissions in 2001.15 Methane is emitted from landfills; natural
gas and petroleum production, transportation, and processing;
agricultural activities; coal mining; stationary and mobile
combustion; wastewater treatment; and certain industrial
processes.16
Nitrous oxide is a GHG with heat-trapping potential that
exceeds that of COo by an order of magnitude.17 Emissions of
nitrons oxide made up 6.1% of U.S. GWP-weighted emissions in
2001.18 The primary human activities resulting in emissions of
nitrous oxide are agricultural soil management, fuel combustion
in motor vehicles, and production processes for adipic and nitric
acid.19
Emissions of HFCs and PFCs are primarily associated with their
use as substitutes for ozone depleting substances banned under
the Montreal Protocol treaty.20 Emissions of HFCs, PFCs, and
SF^sub 6^ also result from certain other industrial processes,
including production of primary aluminum, certain steps in the
manufacture of products in the semiconductor industry, and
activities related to the operation of electrical transmission and
distribution equipment.21 These gases have very powerful heat-
trapping effects.22 They constituted 1.6% of U.S. GWP-
weighted emissions in 2001.23
C. U.S. GHG Emission Trends
Eventual stabilization of atmospheric concentrations of GHGs
will require very large reductions in GHG emissions worldwide.
Notwithstanding a slight decline in 2001,24 U.S. emissions are
projected to increase. As discussed above, U.S. emissions were
11.9% higher in 2001 than they were in 1990.25 Between 1990
and 2000, the GHG "intensity" of the U.S. economy-the ratio of
total GHG emissions to economic output-declined by 17.5%.26
In a report submitted to the United Nations in 2002, the U.S.
government projected that by 2020, U.S. GHG emissions will
rise 42.7% from year-2000 levels.27
II. DOMESTIC CLIMATE POLICY FRAMEWORK
The existing federal framework for addressing climate change in
the United States is a combination of voluntary programs, tax
incentives, energy efficiency standards, and research and
development. These programs, and certain Clean Air Act
provisions, are described below.
A. Voluntary Prograins
Since 1993, the federal government has established a number of
voluntary GHG emission reduction programs to encourage
businesses to undertake GHG mitigation actions. This approach
began with the Clinton Administration's "Climate Change
Action Plan" (CCAP).28 The Bush Administration has adopted a
similar voluntary strategy.29 A key supporting element of both
the Clinton and Bush Administrations' voluntary programs is the
Department of Energy's (DOE) voluntary GHG reporting
program under § 1605(b) of the Energy Policy Act of 1992.30
The § 1605(b) program authorizes DOE to develop a system to
document voluntary GHG mitigation actions reported by firms
and others participating in various voluntary programs.31
Electrie utilities, in particular, have reported numerous projects
under the § 1605(b) program.32
While the various voluntary programs have led to a significant
number of emission reduction projects, overall emission levels
have continued to increase.33 Several factors have contributed
to the limited effectiveness of voluntary programs.34 First,
while some participants in these programs have committed to
taking particular mitigation actions, they have not in many
cases committed to limiting their company-wide emissions
below a particular baseline; for many, total system emissions
increased substantially in response to increased market demand
for products and services.35 Second, some participants
committed to actions that they might have implemented anyway
for business reasons.36 In particular, commentators have
asserted that the § 1605 (b) program lacks rigorous reporting
standards and verification requirements, and concerns have been
raised that some reductions reported under the program have
been double-counted.37 The Bush Administration has pledged
to address these shortcomings in a planned upgrade to the
program to be completed by the end of 2004.38 However, any
voluntary program remains subject to a fundamental limitation-
it only addresses the emissions of those firms that volunteer to
participate.39
For these reasons, current U.S. voluntary programs-while
helpful in building awareness, encouraging experimentation,
and achieving some company-level emission reductions-are not
expected to reduce or even stabilize U.S. GHG emissions in the
next decade relative to current levels.40
In addition to the voluntary GHG programs described above, the
U.S. government has established a number of non-regulatory
programs aimed at increasing energy efficiency.41 Because
energy-related GHG emissions make up over eighty percent of
total U.S. emissions, these programs contribute to reducing
GHG emissions.42 However, like the voluntary GHG reduction
programs, they do not impose actual limits on emissions and are
incapable of achieving substantial emission reductions with a
high degree of certainty.43
Finally, federal tax law provides a range of tax credits and other
incentives to encourage use of renewable energy and fuel-
efficient vehicles.44 These include: a deduction for a portion of
the purchase cost of a "clean-fuel" vehicle, defined to include
hybrids;45 a credit for the purchase of an electric vehicle;46 an
investment credit for solar or geothermal energy equipment47
and favorable depreciation rates for such equipment;48 and a
credit for production of electricity from wind, certain types of
biomass, or poultry waste.49 Congress is considering a number
of additional tax incentives and modifications to existing tax
programs in the context of proposed federal energy
legislation.50
B. Product Efficiency Standards
1. Corporate Average Fuel Economy
Existing federal law includes two major mandatory energy
efficiency programs: one for automobiles,51 and the other for
consumer products other than automobiles.52 Both were
established in 1975 under the Energy Policy and Conservation
Act (EPCA).53 The program for motor vehicles-known as
Corporate Average Fuel Economy or "CAFE"-requires each
automobile manufacturer or importer to meet average fuel
economy standards for the fleet of new vehicles it manufactures
or imports in each model year.54 These standards are expressed
in miles per gallon (mpg).55 Separate standards are set for
passenger automobiles and "light-duty trucks"-including sport
utility vehicles (SUVs) and minivans-currently at 27.5 mpg and
20.7 mpg respectively.56
The statute applies only to new vehicles and does not regulate
inuse consumption of fuel.57 More stringent standards improve
on-the-road fuel economy only to the extent that new vehicles
replace less efficient existing vehicles.58 In addition, for new
vehicles, if vehicle miles traveled (VMT) increase faster than
average fuel economy, overall fuel use will go up
notwithstanding the CAFE requirements.59
The statute contains a number of idiosyncratic features that
increase its complexity, while decreasing its effectiveness.60
Trucks and SUVs are subject to far less stringent standards than
cars.61 Compliance with the standard is determined separately
for vehicles manufactured in the United States, Canada, or
Mexico, and those vehicles manufactured elsewhere but used in
the United States.62 Special credit is given to electric vehicles
and to alternative fuel-capable vehicles.63
While the CAFE program made a significant contribution to
moderating U.S. fuel use in the first years after its enactment,
its impact has declined over time for a number of reasons.64
First, the standards were frozen for many years. Therefore, the
standards have not taken into account the increasing proportions
of truck, SUV, and niinivan sales. Starting in 2001, such "light-
duty trucks" made up over fifty percent of vehicles sold.65
Congress's decision to freeze the standards throughout most of
the 1990s, combined with the change in product mix, has had
the effect of decreasing the ability of the program to moderate
fuel use.66 Second, real gasoline prices have declined,
encouraging more driving and dampening incentives for drivers
to demand more efficient vehicles. Accordingly, even though
fuel economy for cars has improved since the enactment of
CAFE, overall fuel use-and, therefore, GHG emissions-has risen
steadily.67
Of course, policymakers did not design CAFE as a domestic
GHG regulatory program, and to function as one it would need
not only to have the features noted above corrected-removing
the freeze on more stringent standards and modifying the
electric vehicle and alternative fuel credits68-but also the mpg
standard would have to be translated into terms of pounds of
CO2 per mile to take into account the carbon content of fuel.69
Additionally, as discussed below, a number of other changes
would be needed to integrate such a program into a domestic
cap-and-trade program for GHGs.
2. Appliance Standards
EPCA also established an energy efficiency program for
consumer products other than autos-usually referred to as the
"appliance efficiency program."70 It includes mandatory energy
labeling and energy efficiency standards for a wide range of
consumer products, including air conditioners, washers, dryers,
kitchen ranges, and furnaces.71 Standards also cover some
equipment used in industrial applications, such as most
industrial motors.72 According to DOE, the standards program
has resulted in a greater than one quad reduction of en erg)' use
annually, equivalent to roughly one percent of energy use or
about seventy-five million tons of CO2.73 It aims at requiring
for each type of consumer product the maximum energy
efficiency that is technologically feasible and economically
justified; but its complex regulatory framework makes prompt
action to promulgate stringent new standards quite difficult.74
While the standards program in its present form could be used
for GHG regulatory purposes, it would be better adapted to that
purpose if the standards were expressed in the form of direct or
indirect GHG emissions per unit of output, and if a trading
feature could link it to GHG regulation in other sectors.75
C. Clean Air Act
Aside from a requirement that electricity generators, who
account for about one-third of U.S. GHG emissions, monitor
and report their CO2 emissions, the Clean Air Act (CAA)76
does not directly address control of GHG emissions, much less
explicitly authorize GHG regulation. The question of whether
EPA has implied authority under the CAA to regulate GHGs-by
virtue of its CAA authority to regulate "air pollutants"-is the
subject of vigorous debate.77
This debate is beyond the scope of this Article, which
contemplates action by Congress to establish a GHG regulatory
program by statute, rather than action by EPA using its existing
CAA authorities. Nevertheless, it is worth observing that the
acid rain provisions of the CAA present a useful model for a
cap-and-trade program applicable to CO2 emissions from
electricity generators-which is one of the models for GHG
regulation considered below.78 The acid rain program imposes
a national limit on SOo emissions from electricity generators-
currently set at 8.9 million tons per year-allocates allowances to
existing sources to emit specified quantities of SO^sub 2^, and
allows sources to trade and bank allowances, so that they can
pursue least-cost compliance strategies.79
D. Options for a Domestic Program to Secure Greenhouse Gas
Reductions
While voluntary programs, the CAFE program, tax incentives,
and product efficiency standards have contributed to reductions
in GHGs that would not otherwise have occurred, they neither
individually nor collectively are likely to achieve significant
economy-wide reductions in GHG emissions from current
levels.80 Substantial attention has been given to formulating
and evaluating a range of alternative mechanisms for
controlling U.S. GHG emissions.81 For example, several bills
have been introduced that would establish a CO2 cap-and-trade
program for electric utilities, modeled on the SO^sub 2^
program under Title IV of the CAA.82 In January 2003,
Senators John McCain (R-AZ) and Joseph Lieberman (D-CT)
introduced legislation that would establish an economy-wide
GHG cap-and-trade program.83 In March 2004, a companion
version of the McCain-Lieberman bill was introduced in the
House.84
The principal options for a mandatory GHG reduction program,
and the ones evaluated below, are:
Cap-and-Trade: A comprehensive cap-and-trade program,
similar in many respects to the acid rain program, that allocates
or auctions a fixed number of tradable allowances to emitters
and requires them to surrender allowances equal to their
emissions in a particular compliance period-known as
"downstream" cap-and-trade.85 A variant of this program
requires firms to surrender allowances equal to the carbon
content of the fuel and the GHG content of certain other
products they sell each year-known as "upstream" cap-and-
trade.86
GHG tax: A tax either on GHG emissions or on the carbon
content of fuel and the GHG content of certain other
products.87
Sectoral Hybrid: A program that combines a large-source cap-
and-trade program with product efficiency standards, that is,
standards for consumer products and equipment that prescribe
emissions per unit of output-pounds of CO2 per mile, for
example-or energy efficiency levels.88
This Article also discusses in general terms additional options
such as stationary source emission standards, stand-alone
product efficiency standards, and a stand-alone large-source
cap-and-trade program.
III. DESIGN CRITERIA FOR A DOMESTIC GHG
REGULATORY PROGRAM
Evaluating different GHG regulatory program options involves
a number of considerations. The first design decision is
establishing the program's emissions reduction objective. Once
an emissions reduction objective is set, policymakers have to
design a regulatory program to meet it. Key design criteria
include environmental effectiveness, cost, administrative
feasibility, distributional equity, and political acceptability. The
sections that follow elaborate on each of these criteria.
The emissions reduction target for a domestic program
establishes the level and timing of reductions at the national
level. The target can be set for purposes of compliance with an
international obligation or could be established as a matter of
domestic policy, independent of any international obligations.
Moreover, it could take the form of a cap on domestic GHG
emissions or a limit on GHG emissions per unit of output, also
referred to as an "emissions intensity" target. It could establish
a GHG reduction target for an initial compliance period, or it
could establish a long-term emissions reduction path, phasing in
progressively more stringent targets over an extended period of
time. This Article does not address the issues of whether or how
to set a target, or what target to set. Instead, it evaluates
different designs for a program that will meet whatever target is
decided upon.89
The criteria for evaluating design options are described below.
A. Environmental Effectiveness: How Effective Is the Program
in Meeting Its Emissions Reduction Target?
A regulatory program's effectiveness in meeting its target is a
function of a number of factors, including its coverage of
sources throughout the economy, its certainty in meeting a
particular emissions target, and its provisions for enforcement.
1. Coverage: Are All Sources and Gases Covered?
A program's coverage refers to the extent to which it directly or
indirectly regulates sources of GHG emissions throughout the
U.S. economy and applies to the full range of GHGs. Broad
coverage is preferable from an environmental perspective, but
may have to be balanced by considerations of administrative
cost. Compared to a program with full coverage, a program with
only partial coverage either will reduce emissions less, or will
attain the same emission reductions at much higher cost because
it excludes opportunities for inexpensive reductions in
uncovered sectors or gases. Programs with only partial coverage
also risk "leakage."90 Leakage occurs when a regulatory
program encourages shifting of emission-generating activities
from regulated to non-regulated firms.91
2. Environmental Certainty: Will the Program Ensure That the
Emissions Reduction Target Will Be Met?
Some program designs provide greater certainty that total
emissions from regulated firms will not exceed a particular
level. For example, a "quantity-based" approach, such as a
conventional cap-and-trade program, enforces an overall limit
on emissions from the covered firms.92 By contrast, "price-
based" approaches, such as emission taxes or trading programs
with a safety valve, do not place a precise limit on total
emissions, but instead impose a particular price or price limits
per ton of emissions.93 While establishing an emissions charge
or tax has the effect of reducing emissions, the approach does
not ensure that emissions will be reduced to a precise level.94
In addition, as explained below, a standards approach that limits
emissions per unit of output, as opposed to tons per year-often
referred to as a "carbon intensity" approach-will not achieve a
particular emissions reduction target with certainty.95 However,
because it is cumulative rather than annual emissions that are
important, taxes or standards should be able to provide almost
equivalent environmental certainty if there is political will to
adjust them over time.
3. Enforcement: Is the Program Enforceable?
Any regulatory program's overall success in reducing emissions
also is a function of its enforcement mechanisms. Enforcement
is, in turn, a function of clear rules, precise and effective
measurement of emissions, pursuit of violators, and having non-
compliance penalties high enough to exceed any benefits
associated with non-compliance.96
B. Cost-Effectiveness: Will the Program Design Allow Cost-
Effective Compliance?
A key consideration in evaluating a GHG regulatory program is
whether it permits compliance with the program's target at the
least cost to the U.S. economy-what is referred to as "cost-
effective" compliance. The first cost-related issue is the direct
cost of complying with the program. A program designed to
meet a particular target minimizes compliance costs to the
extent that it maximizes flexibility to adopt a least-cost
compliance strategy-that is, flexibility as to what, where, and
when emission reductions are attained. In addition, some
program designs can cap compliance costs, but do so at the risk
of missing the program's target. Another key cost-related
consideration is administrative cost. Finally, some program
designs raise revenue, which, as explained below, could be used
to offset part of the overall cost of the program by reducing
"distortionary" taxes on capital and labor.
1. Flexibility: Will the Program Provide Flexibility as to How,
Where, and When Emission Reductions Are Attained?
A cost-effective program will provide wide flexibility to
regulated firms in determining how to reduce emissions to meet
the program target ("what" flexibility), where to reduce them
("where" flexibility), and within limits, when to reduce them
("when" flexibility).97 "What" flexibility' implies that a firm
can comply by implementing any of the full range of GHG
mitigation measures, including increasing energy efficiency;
switching fuels; reducing consumption; adopting LULUCF
measures, including agriculture; or taking other action to reduce
or sequester GHGs. Second, it implies that firms can comply
through reductions in any of the major GHGs. Third, it implies
that firms that can achieve low-cost reductions will undertake a
greater proportion of emission reductions than firms that
achieve reductions at higher costs. Many different kinds of
firms and activities generate emissions of different GHGs; their
costs of reducing those emissions and the means of reduction
available to them vary widely. A program with maximum
"what" flexibility has the effect of equating marginal costs of
mitigation across all firms subject to the program, thereby
generating the lowest-cost distribution of abatement activities
throughout the economy.98
The other critical benefit of building "what" flexibility into the
U.S. climate policy architecture from the beginning is that it
spurs technological innovation. Achieving the long-term aim of
stabilizing atmospheric concentrations will not be possible
without the development and widespread deployment of a range
of next-generation approaches to climate protection, including
new clean energy technologies. Policy approaches that prescribe
the use of particular technologies, such as design standards,
provide little incentive for developing such next-generation
approaches. By contrast, approaches that specify environmental
outcomes or place a price on environmental damage without
prescribing the means of compliance can stimulate the kind of
innovation that ultimately will be needed to achieve deeper
emission reductions over time.
"Where" flexibility implies that the program will recognize
reductions achieved throughout the world. A domestic GHG
program that is integrated with the emerging international
market in GHG emission reductions almost certainly will have
lower compliance costs than a program that credits only
reductions made within the United States.99 Studies have
suggested that opening up a U.S. climate program to trading
even with just the industrialized countries that are subject to
Kyoto Protocol emission limits could reduce a U.S. program's
marginal abatement cost by anywhere between thirteen percent
and sixty-eight percent.100 Gains from trade would be far
greater if the U.S. program credited reductions achieved in
developing countries, where low-cost abatement options are in
abundant supply.101 For these reasons, the ultimate cost of a
U.S. climate change program will depend in great measure on
the extent to which it provides for international emissions
trading.
"When" flexibility provides the regulated firm with choices as
to the timing of emission reductions. Even before the regulatory
program becomes binding, policymakers can establish a "credit
for early action" policy to assure firms that any pre-program
efforts to reduce emissions will be recognized. Such early
reduction efforts would have the same environmental value as
reductions made after the regulatory program has
commenced.102 Policymakers also can set an ultimate
compliance deadline for the regulatory program that gives firms
sufficient lead time to develop cost-effective control strategies
and that allows a market for emission reductions to evolve.
Further, in establishing a program's emissions target,
consideration can be given to determining compliance on the
basis of a multi-year emissions average, rather than the level of
emissions in a single year. A multi-year approach gives firms
the flexibility to manage their emissions over time and avoids
penalizing them for emission changes caused by difficult-to-
control fluctuations in business cycles and weather.
Other "when" flexibility measures include "banking" and
"borrowing."103 Programs can be designed so that firms that
over-comply can "bank" emission credits and use them in a
subsequent compliance period or sell them at a later date when
prices in the trading market might be higher. A "borrowing"
provision would allow a firm to comply with its obligations in
one compliance period in part by committing to even deeper-
than-required reductions in the subsequent compliance period.
With a limited borrowing provision, a regulatory program could
obtain a greater overall level of emission reductions from those
firms that could benefit from additional time to modify their
operations or invest in new technologies. A multi-year
compliance period approach would offer similar temporal
flexibility as a borrowing provision. A firm's ability to borrow
has to be limited, however, lest it become a means of simply
avoiding reductions.
2. Cost Predictability: Are Costs of Compliance Reasonably
Predictable?
A regulatory program also can be designed so that total
compliance costs are capped.104 As discussed above, "price-
based" approaches, such as emission taxes, do not provide
assurances that a particular level of emission reductions will be
achieved. On the other hand, such programs do provide
assurances that the costs of compliance will not rise above a
particular per-ton level. This kind of certainty about costs
generally is not possible with a quantity-based program, such as
a traditional cap-and-trade program, where it is implied that the
quantitative limit on emissions will be enforced regardless of
compliance costs. To address the risk of spiraling compliance
costs associated with a cap-andtrade program, some have
proposed a "safety valve" mechanism, in which additional
allowances would be made available at a pre-set price
representing the maximum acceptable cost.105
3. Raising Revenue: Will the Program Raise Revenues That Can
Be Used to Offset a Portion of Its Costs?
Some program designs that raise revenue, such as GHG taxes or
allowance auctions, offer an opportunity to offset economic
costs of the program borne by particular sectors through
financial assistance programs or reduce the overall cost of the
program through a reduction in federal taxes.106 Economic
analysis indicates that programs that recycle the revenue to
reduce distortionary taxes on capital, labor, or income have
significant potential to reduce overall costs of a GHG regulatory
program to the economy.107 However, it may prove politically
difficult to implement tax cuts that increase economic
efficiency. The revenues raised could just as easily be spent on
activities that reduce or have no impact on economic efficiency
as on activities that improve it.
4. Long-Term Incentives: Will the Program Induce Key Sectors
to Begin Investing in Low-Emission Technologies and
Practices?
Most climate change analysts agree that moderating the increase
in atmospheric concentrations of GHGs ultimately will require a
substantial transformation in the way that industrialized
countries like the United States produce and use energy.108
Near-term policy choices will have a major impact on the cost
of such a long-term effort. The reason is that energy-producing
and energy-using technologies involve long-term capital
investments that are not readily converted to other uses.
Therefore, a domestic program needs to send a credible long-
term signal to key sectors of the economy that encourages a
shift toward lower-carbon technologies and lower-emitting
practices. A domestic program that leaves certain sectors
uncovered could result in those sectors "locking in" higher-
emitting technologies and practices, potentially increasing the
cost of achieving more substantial economy-wide GHG
reductions in the future.109
C. Administrative Feasibility: Can the Program Be
Administered and Docs It Minimize Administrative and
Transaction Costs?
A key consideration in designing any regulatory program is
whether it is feasible to administer. A program that is infeasible
to administer will be both environmentally ineffective and
economically inefficient. One key feasibility consideration is
minimizing administrative costs-including the costs of
designing the program and the costs of implementing it, both for
the regulated firm, which must bear reporting or other costs,
and for the regulator. Administrative costs are a function of the
number of regulated firms, the availability of needed data about
those firms, and the complexity of the regulatory program.110
In addition, program designs that build upon existing and
familiar programs will impose smaller implementation costs and
less difficulty for the regulator and the firms to be regulated
than programs that represent a new departure. Finally, in
designing market-based regulatory programs, careful attention
needs to be given to avoiding unnecessary program complexities
and uncertainties that run up participants' transaction costs.111
Another particularly important administrative criterion for a
climate change policy is adaptability, given the necessary
duration of any effort to stabilize concentrations of GHGs in the
atmosphere. A U.S. climate change policy framework needs to
be able to evolve over time to accommodate adjustments in the
emission reduction commitments as new information becomes
available and as the U.S. economy changes. In addition, because
stabilization of GHG concentrations ultimately will require
global efforts, the policy framework will have to be flexible
enough to provide for coordination with other countries.
D. Distributional Equity: Is the Burden of Compliance with the
Program Fairly Apportioned ?
Another consideration in designing a regulatory program is how
its costs are distributed across society.112 Even the most cost-
effective program design may be unacceptable if its costs are
distributed in such a way that is perceived to be unfair.
All other things being equal, a regulatory program that aims to
reduce GHG emissions will tend to impose its largest costs on
firms and households that produce fossil fuels or are heavily
dependent on them.113 A GHG regulatory program also will
tend to be relatively more costly for low-income individuals
because they spend a greater proportion of their total income on
energy.114
Some regulatory programs provide opportunities for modifying
these distributional impacts. For example, in an emissions
trading program, the government could allocate allowances on a
cost-free basis to firms that would bear the brunt of regulatory
compliance costs. Alternatively, the government could auction
allowances and use the revenue to compensate those particularly
burdened by the regulatory program through targeted tax breaks
or lump-sum payments. Emission tax programs hold similar
revenue recycling potential.
E. Political Acceptability: Are There Elements of Program
Design that Affect Its Political Acceptability ?
Program designs that promise relatively greater environmental
effectiveness, lower costs, and a more equitable distribution of
regulatory burdens will be more likely to obtain political
support than other designs. However, the U.S. experience with
environmental and energy policy suggests that other factors also
affect a program's political acceptability. Indeed, considerations
of political acceptability may lead policymakers away from
what could otherwise be an optimal program design with respect
to environmental effectiveness, cost, and equity.115
For example, twenty-five years of environmental and energy
policy experience suggests that it is difficult to gain public
support for a program that relies principally on direct increases
in the price of energy-either through taxes or regulatory
measures-even where such a program arguably is more cost-
effective or will result in a more equitable distribution of
regulatory burdens than other approaches.116 Even in times of
most compelling national circumstances, such as the 1973 Arab
oil embargo, Congress was unwilling to vise energy price
increases to rein in consumer demand.117 On the other hand,
program designs involving emissions trading or emission
charges offer the opportunity to develop what may be a
politically attractive policy package-using the revenue raised
from regulation of GHG emissions as a basis for reducing taxes
on income.118
IV. EVALUATING DIFFERENT APPROACHES TO
REGULATING DOMESTIC GHG EMISSIONS
Using the criteria developed above, we evaluate three principal
approaches to regulating domestic GHG emissions: (1) an
emissions trading-or cap-and-trade-program; (2) a GHG tax
program; or (3) a sectoral hybrid program combining a large-
source cap-and-trade program with product efficiency standards.
Each approach presents its own design choices, For example, a
cap-and-trade program could be upstream or downstream.
A. Emission Trading (Cap-and-Trade) Programs
1. Overview of Emission Trading Programs
A conventional cap-and-trade program establishes an economy-
wide or sectoral "cap" on emissions in terms of tons per year or
other compliance period, and allocates or auctions tradable
allowances, such as the right to emit one ton of GHGs, to GHG
emission sources or to fuel suppliers.119 The total number of
allowances is equal to the cap. A downstream cap-and-trade
program applies to sources of GHG emissions and requires them
to surrender allowances equal to their emissions.120 An
upstream program applies to fuel suppliers and requires them to
surrender allowances equivalent to the carbon content of fossil
fuels they supply.121 Cap-and-trade programs are best suited to
regulation of emission sources that can be readily measured and
monitored, hi the GHG context, such sources include almost all
sources of CO2 emissions from fossil-fuel combustion as well
as many sources of other GHG emissions.122 Other types of
sources can be regulated on an "opt in" or project basis, or
through supplemental regulation.123 The trading feature of a
cap-and-trade program authorizes regulated firms-and anyone
else-to buy, sell, or hold allowances.
In a well-functioning emissions trading market, allowances will
end up distributed among firms that need them in a way that
minimizes the cost of reducing emissions. For example, in a
conventional downstream cap-and-trade program, firms subject
to the program buy allowances if their costs of reducing
emissions-referred to as their costs of "abatement"-exceed the
allowance price.124 Firms sell allowances if their abatement
costs are lower than the allowance price.125 Trades continue in
this way until firms are indifferent between buying and selling
allowances-or, in other words, between abating one more ton of
CO2 or emitting an additional ton.126 At this point, the
program has equalized marginal abatement costs across the
economy, and, in theory, the final distribution of allowances
and abatement throughout the economy reflects the least-cost
outcome.127
A GHG emissions trading program could incorporate all forms
of "what," "where," and "when" flexibility, discussed above.
Each firm affected by a GHG emissions trading program could
reduce its need for allowances or exposure to higher energy
costs by adopting its lowest-cost means of abatement. Firms
also would have an incentive to develop new technologies or
practices to reduce emissions or increase their energy
efficiency. A U.S. domestic cap-and-trade program also could
be integrated with emerging cap-and-trade programs in other
countries and, if the parties so provided, with an international
regime such as the Kyoto Protocol.128
A cap-and-trade program can be extended beyond energy-related
sources of CO2 emissions by directly regulating: (1) sources of
nonCO2 GHGs and/or (2) LULUCF activities that emit or
remove CO2. Some GHG sources and sinks, however, may not
be amenable to regulation through such an approach because
their emissions may be too difficult to measure for purposes of
setting a cap and allocating allowances, or to monitor for
purposes of enforcement.
In some cases, these sources and sinks could be incorporated
into the cap-and-trade program on a project-by-project basis,
known as "project-based crediting." Under project-based
crediting, a firm could earn emission credits by undertaking a
climate change mitigation project at a source or sink not
10 Energy and Environmental Policy Externalities and InterestsPu.docx

More Related Content

Similar to 10 Energy and Environmental Policy Externalities and InterestsPu.docx

Review literate licture christinejoy,ecology
Review literate licture christinejoy,ecologyReview literate licture christinejoy,ecology
Review literate licture christinejoy,ecologyChristine Joy Ruiz
 
Why Effective Waste Disposal is Important.pdf
Why Effective Waste Disposal is Important.pdfWhy Effective Waste Disposal is Important.pdf
Why Effective Waste Disposal is Important.pdfIsabella Barry
 
Report on solid waste management
Report on solid waste managementReport on solid waste management
Report on solid waste managementKalashAggarwal3
 
l̂̂̂ î;The environmental revolution has been almost.docx
l̂̂̂ î;The environmental revolution has been almost.docxl̂̂̂ î;The environmental revolution has been almost.docx
l̂̂̂ î;The environmental revolution has been almost.docxSHIVA101531
 
Chapt13 Lecture
Chapt13 LectureChapt13 Lecture
Chapt13 Lecturerpieper
 

Similar to 10 Energy and Environmental Policy Externalities and InterestsPu.docx (10)

Review literate licture christinejoy,ecology
Review literate licture christinejoy,ecologyReview literate licture christinejoy,ecology
Review literate licture christinejoy,ecology
 
Review literate licture
Review literate lictureReview literate licture
Review literate licture
 
Why Effective Waste Disposal is Important.pdf
Why Effective Waste Disposal is Important.pdfWhy Effective Waste Disposal is Important.pdf
Why Effective Waste Disposal is Important.pdf
 
Report on solid waste management
Report on solid waste managementReport on solid waste management
Report on solid waste management
 
l̂̂̂ î;The environmental revolution has been almost.docx
l̂̂̂ î;The environmental revolution has been almost.docxl̂̂̂ î;The environmental revolution has been almost.docx
l̂̂̂ î;The environmental revolution has been almost.docx
 
Chapter 4
Chapter 4Chapter 4
Chapter 4
 
Environmenatl Pollution
Environmenatl Pollution Environmenatl Pollution
Environmenatl Pollution
 
Chapt13 Lecture
Chapt13 LectureChapt13 Lecture
Chapt13 Lecture
 
Garbage work
Garbage workGarbage work
Garbage work
 
Garbage work
Garbage workGarbage work
Garbage work
 

More from hyacinthshackley2629

Your company nameYour nameInstruction Page1. O.docx
Your company nameYour nameInstruction Page1. O.docxYour company nameYour nameInstruction Page1. O.docx
Your company nameYour nameInstruction Page1. O.docxhyacinthshackley2629
 
Your Company NameYour Company NameBudget Proposalfor[ent.docx
Your Company NameYour Company NameBudget Proposalfor[ent.docxYour Company NameYour Company NameBudget Proposalfor[ent.docx
Your Company NameYour Company NameBudget Proposalfor[ent.docxhyacinthshackley2629
 
Your company recently reviewed the results of a penetration test.docx
Your company recently reviewed the results of a penetration test.docxYour company recently reviewed the results of a penetration test.docx
Your company recently reviewed the results of a penetration test.docxhyacinthshackley2629
 
Your company wants to explore moving much of their data and info.docx
Your company wants to explore moving much of their data and info.docxYour company wants to explore moving much of their data and info.docx
Your company wants to explore moving much of their data and info.docxhyacinthshackley2629
 
Your company plans to establish MNE manufacturing operations in Sout.docx
Your company plans to establish MNE manufacturing operations in Sout.docxYour company plans to establish MNE manufacturing operations in Sout.docx
Your company plans to establish MNE manufacturing operations in Sout.docxhyacinthshackley2629
 
Your company just purchased a Dell server MD1420 DAS to use to store.docx
Your company just purchased a Dell server MD1420 DAS to use to store.docxYour company just purchased a Dell server MD1420 DAS to use to store.docx
Your company just purchased a Dell server MD1420 DAS to use to store.docxhyacinthshackley2629
 
your company is moving to a new HRpayroll system that is sponsored .docx
your company is moving to a new HRpayroll system that is sponsored .docxyour company is moving to a new HRpayroll system that is sponsored .docx
your company is moving to a new HRpayroll system that is sponsored .docxhyacinthshackley2629
 
Your company is considering the implementation of a technology s.docx
Your company is considering the implementation of a technology s.docxYour company is considering the implementation of a technology s.docx
Your company is considering the implementation of a technology s.docxhyacinthshackley2629
 
Your company is a security service contractor that consults with bus.docx
Your company is a security service contractor that consults with bus.docxYour company is a security service contractor that consults with bus.docx
Your company is a security service contractor that consults with bus.docxhyacinthshackley2629
 
Your company has just sent you to a Project Management Conference on.docx
Your company has just sent you to a Project Management Conference on.docxYour company has just sent you to a Project Management Conference on.docx
Your company has just sent you to a Project Management Conference on.docxhyacinthshackley2629
 
Your company has designed an information system for a library.  The .docx
Your company has designed an information system for a library.  The .docxYour company has designed an information system for a library.  The .docx
Your company has designed an information system for a library.  The .docxhyacinthshackley2629
 
Your company has had embedded HR generalists in business units for t.docx
Your company has had embedded HR generalists in business units for t.docxYour company has had embedded HR generalists in business units for t.docx
Your company has had embedded HR generalists in business units for t.docxhyacinthshackley2629
 
Your company You are a new Supply Chain Analyst with the ACME.docx
Your company   You are a new Supply Chain Analyst with the ACME.docxYour company   You are a new Supply Chain Analyst with the ACME.docx
Your company You are a new Supply Chain Analyst with the ACME.docxhyacinthshackley2629
 
Your company has asked that you create a survey to collect data .docx
Your company has asked that you create a survey to collect data .docxYour company has asked that you create a survey to collect data .docx
Your company has asked that you create a survey to collect data .docxhyacinthshackley2629
 
Your Communications PlanDescriptionA.What is your .docx
Your Communications PlanDescriptionA.What is your .docxYour Communications PlanDescriptionA.What is your .docx
Your Communications PlanDescriptionA.What is your .docxhyacinthshackley2629
 
Your community includes people from diverse backgrounds. Answer .docx
Your community includes people from diverse backgrounds. Answer .docxYour community includes people from diverse backgrounds. Answer .docx
Your community includes people from diverse backgrounds. Answer .docxhyacinthshackley2629
 
Your Communications Plan Please respond to the following.docx
Your Communications Plan Please respond to the following.docxYour Communications Plan Please respond to the following.docx
Your Communications Plan Please respond to the following.docxhyacinthshackley2629
 
Your Communication InvestigationFor your mission after reading y.docx
Your Communication InvestigationFor your mission after reading y.docxYour Communication InvestigationFor your mission after reading y.docx
Your Communication InvestigationFor your mission after reading y.docxhyacinthshackley2629
 
Your Communications PlanFirst step Choose a topic. Revi.docx
Your Communications PlanFirst step Choose a topic. Revi.docxYour Communications PlanFirst step Choose a topic. Revi.docx
Your Communications PlanFirst step Choose a topic. Revi.docxhyacinthshackley2629
 
Your coffee franchise cleared for business in both countries (Mexico.docx
Your coffee franchise cleared for business in both countries (Mexico.docxYour coffee franchise cleared for business in both countries (Mexico.docx
Your coffee franchise cleared for business in both countries (Mexico.docxhyacinthshackley2629
 

More from hyacinthshackley2629 (20)

Your company nameYour nameInstruction Page1. O.docx
Your company nameYour nameInstruction Page1. O.docxYour company nameYour nameInstruction Page1. O.docx
Your company nameYour nameInstruction Page1. O.docx
 
Your Company NameYour Company NameBudget Proposalfor[ent.docx
Your Company NameYour Company NameBudget Proposalfor[ent.docxYour Company NameYour Company NameBudget Proposalfor[ent.docx
Your Company NameYour Company NameBudget Proposalfor[ent.docx
 
Your company recently reviewed the results of a penetration test.docx
Your company recently reviewed the results of a penetration test.docxYour company recently reviewed the results of a penetration test.docx
Your company recently reviewed the results of a penetration test.docx
 
Your company wants to explore moving much of their data and info.docx
Your company wants to explore moving much of their data and info.docxYour company wants to explore moving much of their data and info.docx
Your company wants to explore moving much of their data and info.docx
 
Your company plans to establish MNE manufacturing operations in Sout.docx
Your company plans to establish MNE manufacturing operations in Sout.docxYour company plans to establish MNE manufacturing operations in Sout.docx
Your company plans to establish MNE manufacturing operations in Sout.docx
 
Your company just purchased a Dell server MD1420 DAS to use to store.docx
Your company just purchased a Dell server MD1420 DAS to use to store.docxYour company just purchased a Dell server MD1420 DAS to use to store.docx
Your company just purchased a Dell server MD1420 DAS to use to store.docx
 
your company is moving to a new HRpayroll system that is sponsored .docx
your company is moving to a new HRpayroll system that is sponsored .docxyour company is moving to a new HRpayroll system that is sponsored .docx
your company is moving to a new HRpayroll system that is sponsored .docx
 
Your company is considering the implementation of a technology s.docx
Your company is considering the implementation of a technology s.docxYour company is considering the implementation of a technology s.docx
Your company is considering the implementation of a technology s.docx
 
Your company is a security service contractor that consults with bus.docx
Your company is a security service contractor that consults with bus.docxYour company is a security service contractor that consults with bus.docx
Your company is a security service contractor that consults with bus.docx
 
Your company has just sent you to a Project Management Conference on.docx
Your company has just sent you to a Project Management Conference on.docxYour company has just sent you to a Project Management Conference on.docx
Your company has just sent you to a Project Management Conference on.docx
 
Your company has designed an information system for a library.  The .docx
Your company has designed an information system for a library.  The .docxYour company has designed an information system for a library.  The .docx
Your company has designed an information system for a library.  The .docx
 
Your company has had embedded HR generalists in business units for t.docx
Your company has had embedded HR generalists in business units for t.docxYour company has had embedded HR generalists in business units for t.docx
Your company has had embedded HR generalists in business units for t.docx
 
Your company You are a new Supply Chain Analyst with the ACME.docx
Your company   You are a new Supply Chain Analyst with the ACME.docxYour company   You are a new Supply Chain Analyst with the ACME.docx
Your company You are a new Supply Chain Analyst with the ACME.docx
 
Your company has asked that you create a survey to collect data .docx
Your company has asked that you create a survey to collect data .docxYour company has asked that you create a survey to collect data .docx
Your company has asked that you create a survey to collect data .docx
 
Your Communications PlanDescriptionA.What is your .docx
Your Communications PlanDescriptionA.What is your .docxYour Communications PlanDescriptionA.What is your .docx
Your Communications PlanDescriptionA.What is your .docx
 
Your community includes people from diverse backgrounds. Answer .docx
Your community includes people from diverse backgrounds. Answer .docxYour community includes people from diverse backgrounds. Answer .docx
Your community includes people from diverse backgrounds. Answer .docx
 
Your Communications Plan Please respond to the following.docx
Your Communications Plan Please respond to the following.docxYour Communications Plan Please respond to the following.docx
Your Communications Plan Please respond to the following.docx
 
Your Communication InvestigationFor your mission after reading y.docx
Your Communication InvestigationFor your mission after reading y.docxYour Communication InvestigationFor your mission after reading y.docx
Your Communication InvestigationFor your mission after reading y.docx
 
Your Communications PlanFirst step Choose a topic. Revi.docx
Your Communications PlanFirst step Choose a topic. Revi.docxYour Communications PlanFirst step Choose a topic. Revi.docx
Your Communications PlanFirst step Choose a topic. Revi.docx
 
Your coffee franchise cleared for business in both countries (Mexico.docx
Your coffee franchise cleared for business in both countries (Mexico.docxYour coffee franchise cleared for business in both countries (Mexico.docx
Your coffee franchise cleared for business in both countries (Mexico.docx
 

Recently uploaded

_Math 4-Q4 Week 5.pptx Steps in Collecting Data
_Math 4-Q4 Week 5.pptx Steps in Collecting Data_Math 4-Q4 Week 5.pptx Steps in Collecting Data
_Math 4-Q4 Week 5.pptx Steps in Collecting DataJhengPantaleon
 
EPANDING THE CONTENT OF AN OUTLINE using notes.pptx
EPANDING THE CONTENT OF AN OUTLINE using notes.pptxEPANDING THE CONTENT OF AN OUTLINE using notes.pptx
EPANDING THE CONTENT OF AN OUTLINE using notes.pptxRaymartEstabillo3
 
SOCIAL AND HISTORICAL CONTEXT - LFTVD.pptx
SOCIAL AND HISTORICAL CONTEXT - LFTVD.pptxSOCIAL AND HISTORICAL CONTEXT - LFTVD.pptx
SOCIAL AND HISTORICAL CONTEXT - LFTVD.pptxiammrhaywood
 
Software Engineering Methodologies (overview)
Software Engineering Methodologies (overview)Software Engineering Methodologies (overview)
Software Engineering Methodologies (overview)eniolaolutunde
 
Biting mechanism of poisonous snakes.pdf
Biting mechanism of poisonous snakes.pdfBiting mechanism of poisonous snakes.pdf
Biting mechanism of poisonous snakes.pdfadityarao40181
 
Call Girls in Dwarka Mor Delhi Contact Us 9654467111
Call Girls in Dwarka Mor Delhi Contact Us 9654467111Call Girls in Dwarka Mor Delhi Contact Us 9654467111
Call Girls in Dwarka Mor Delhi Contact Us 9654467111Sapana Sha
 
Final demo Grade 9 for demo Plan dessert.pptx
Final demo Grade 9 for demo Plan dessert.pptxFinal demo Grade 9 for demo Plan dessert.pptx
Final demo Grade 9 for demo Plan dessert.pptxAvyJaneVismanos
 
The Most Excellent Way | 1 Corinthians 13
The Most Excellent Way | 1 Corinthians 13The Most Excellent Way | 1 Corinthians 13
The Most Excellent Way | 1 Corinthians 13Steve Thomason
 
“Oh GOSH! Reflecting on Hackteria's Collaborative Practices in a Global Do-It...
“Oh GOSH! Reflecting on Hackteria's Collaborative Practices in a Global Do-It...“Oh GOSH! Reflecting on Hackteria's Collaborative Practices in a Global Do-It...
“Oh GOSH! Reflecting on Hackteria's Collaborative Practices in a Global Do-It...Marc Dusseiller Dusjagr
 
Presiding Officer Training module 2024 lok sabha elections
Presiding Officer Training module 2024 lok sabha electionsPresiding Officer Training module 2024 lok sabha elections
Presiding Officer Training module 2024 lok sabha electionsanshu789521
 
How to Make a Pirate ship Primary Education.pptx
How to Make a Pirate ship Primary Education.pptxHow to Make a Pirate ship Primary Education.pptx
How to Make a Pirate ship Primary Education.pptxmanuelaromero2013
 
internship ppt on smartinternz platform as salesforce developer
internship ppt on smartinternz platform as salesforce developerinternship ppt on smartinternz platform as salesforce developer
internship ppt on smartinternz platform as salesforce developerunnathinaik
 
Mastering the Unannounced Regulatory Inspection
Mastering the Unannounced Regulatory InspectionMastering the Unannounced Regulatory Inspection
Mastering the Unannounced Regulatory InspectionSafetyChain Software
 
Science lesson Moon for 4th quarter lesson
Science lesson Moon for 4th quarter lessonScience lesson Moon for 4th quarter lesson
Science lesson Moon for 4th quarter lessonJericReyAuditor
 
Kisan Call Centre - To harness potential of ICT in Agriculture by answer farm...
Kisan Call Centre - To harness potential of ICT in Agriculture by answer farm...Kisan Call Centre - To harness potential of ICT in Agriculture by answer farm...
Kisan Call Centre - To harness potential of ICT in Agriculture by answer farm...Krashi Coaching
 
Sanyam Choudhary Chemistry practical.pdf
Sanyam Choudhary Chemistry practical.pdfSanyam Choudhary Chemistry practical.pdf
Sanyam Choudhary Chemistry practical.pdfsanyamsingh5019
 
Solving Puzzles Benefits Everyone (English).pptx
Solving Puzzles Benefits Everyone (English).pptxSolving Puzzles Benefits Everyone (English).pptx
Solving Puzzles Benefits Everyone (English).pptxOH TEIK BIN
 

Recently uploaded (20)

_Math 4-Q4 Week 5.pptx Steps in Collecting Data
_Math 4-Q4 Week 5.pptx Steps in Collecting Data_Math 4-Q4 Week 5.pptx Steps in Collecting Data
_Math 4-Q4 Week 5.pptx Steps in Collecting Data
 
Model Call Girl in Bikash Puri Delhi reach out to us at 🔝9953056974🔝
Model Call Girl in Bikash Puri  Delhi reach out to us at 🔝9953056974🔝Model Call Girl in Bikash Puri  Delhi reach out to us at 🔝9953056974🔝
Model Call Girl in Bikash Puri Delhi reach out to us at 🔝9953056974🔝
 
EPANDING THE CONTENT OF AN OUTLINE using notes.pptx
EPANDING THE CONTENT OF AN OUTLINE using notes.pptxEPANDING THE CONTENT OF AN OUTLINE using notes.pptx
EPANDING THE CONTENT OF AN OUTLINE using notes.pptx
 
SOCIAL AND HISTORICAL CONTEXT - LFTVD.pptx
SOCIAL AND HISTORICAL CONTEXT - LFTVD.pptxSOCIAL AND HISTORICAL CONTEXT - LFTVD.pptx
SOCIAL AND HISTORICAL CONTEXT - LFTVD.pptx
 
Software Engineering Methodologies (overview)
Software Engineering Methodologies (overview)Software Engineering Methodologies (overview)
Software Engineering Methodologies (overview)
 
Model Call Girl in Tilak Nagar Delhi reach out to us at 🔝9953056974🔝
Model Call Girl in Tilak Nagar Delhi reach out to us at 🔝9953056974🔝Model Call Girl in Tilak Nagar Delhi reach out to us at 🔝9953056974🔝
Model Call Girl in Tilak Nagar Delhi reach out to us at 🔝9953056974🔝
 
Biting mechanism of poisonous snakes.pdf
Biting mechanism of poisonous snakes.pdfBiting mechanism of poisonous snakes.pdf
Biting mechanism of poisonous snakes.pdf
 
Call Girls in Dwarka Mor Delhi Contact Us 9654467111
Call Girls in Dwarka Mor Delhi Contact Us 9654467111Call Girls in Dwarka Mor Delhi Contact Us 9654467111
Call Girls in Dwarka Mor Delhi Contact Us 9654467111
 
Staff of Color (SOC) Retention Efforts DDSD
Staff of Color (SOC) Retention Efforts DDSDStaff of Color (SOC) Retention Efforts DDSD
Staff of Color (SOC) Retention Efforts DDSD
 
Final demo Grade 9 for demo Plan dessert.pptx
Final demo Grade 9 for demo Plan dessert.pptxFinal demo Grade 9 for demo Plan dessert.pptx
Final demo Grade 9 for demo Plan dessert.pptx
 
The Most Excellent Way | 1 Corinthians 13
The Most Excellent Way | 1 Corinthians 13The Most Excellent Way | 1 Corinthians 13
The Most Excellent Way | 1 Corinthians 13
 
“Oh GOSH! Reflecting on Hackteria's Collaborative Practices in a Global Do-It...
“Oh GOSH! Reflecting on Hackteria's Collaborative Practices in a Global Do-It...“Oh GOSH! Reflecting on Hackteria's Collaborative Practices in a Global Do-It...
“Oh GOSH! Reflecting on Hackteria's Collaborative Practices in a Global Do-It...
 
Presiding Officer Training module 2024 lok sabha elections
Presiding Officer Training module 2024 lok sabha electionsPresiding Officer Training module 2024 lok sabha elections
Presiding Officer Training module 2024 lok sabha elections
 
How to Make a Pirate ship Primary Education.pptx
How to Make a Pirate ship Primary Education.pptxHow to Make a Pirate ship Primary Education.pptx
How to Make a Pirate ship Primary Education.pptx
 
internship ppt on smartinternz platform as salesforce developer
internship ppt on smartinternz platform as salesforce developerinternship ppt on smartinternz platform as salesforce developer
internship ppt on smartinternz platform as salesforce developer
 
Mastering the Unannounced Regulatory Inspection
Mastering the Unannounced Regulatory InspectionMastering the Unannounced Regulatory Inspection
Mastering the Unannounced Regulatory Inspection
 
Science lesson Moon for 4th quarter lesson
Science lesson Moon for 4th quarter lessonScience lesson Moon for 4th quarter lesson
Science lesson Moon for 4th quarter lesson
 
Kisan Call Centre - To harness potential of ICT in Agriculture by answer farm...
Kisan Call Centre - To harness potential of ICT in Agriculture by answer farm...Kisan Call Centre - To harness potential of ICT in Agriculture by answer farm...
Kisan Call Centre - To harness potential of ICT in Agriculture by answer farm...
 
Sanyam Choudhary Chemistry practical.pdf
Sanyam Choudhary Chemistry practical.pdfSanyam Choudhary Chemistry practical.pdf
Sanyam Choudhary Chemistry practical.pdf
 
Solving Puzzles Benefits Everyone (English).pptx
Solving Puzzles Benefits Everyone (English).pptxSolving Puzzles Benefits Everyone (English).pptx
Solving Puzzles Benefits Everyone (English).pptx
 

10 Energy and Environmental Policy Externalities and InterestsPu.docx

  • 1. 10 Energy and Environmental Policy Externalities and Interests Public Choice and the Environment All human activity produces waste. We can no more “stop polluting” than we can halt our natural body functions. As soon as we come to understand that we cannot outlaw pollution and come to see pollution as a cost of human activity, we can begin to devise creative environmental policies. Environmental Externalities. Public choice theory views pollution as a “problem” when it is not a cost to its producer—that is, when producers can ignore the costs of their pollution and shift them onto others or society in general. An “externality” occurs when one individual, firm, or government undertakes an activity that imposes unwanted costs on others. A manufacturing firm or local government that discharges waste into a river shifts its own costs to individuals, firms, or local governments downstream, who must forgo using the river for recreation and water supply or else undertake the costs of cleaning it up themselves. A coal-burning electricity- generating plant that discharges waste into the air shifts its costs to others, who must endure irritating smog. By shifting these costs to others, polluting firms lower their production costs, which allows them to lower their prices to customers and/or increase their own profits. Polluting governments have lower costs of disposing their community’s waste, which allows them to lower taxes for their own citizens. As long as these costs of production can be shifted to others, polluting individuals, firms, and governments have no incentive to minimize waste or develop alternative techniques of production. Costs of Regulation. Environmental policies are costly. These costs are often ignored when environmental regulations are considered. Direct spending by business and government for pollution abatement and control has grown rapidly over recent years. Yet governments themselves—federal, state, and local governments combined—
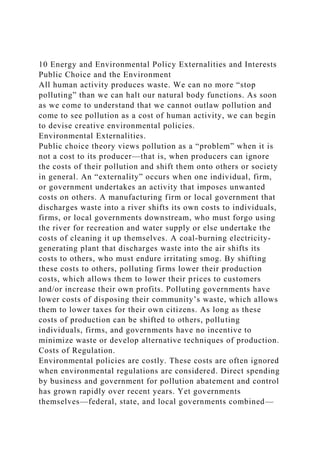
  • 2. pay less than one-quarter of the environmental bill. Businesses and consumers pay over three-quarters of the environmental bill. Governments can shift the costs of their policies onto private individuals and firms by enacting regulations requiring pollution control. A government’s own budget is unaffected by these regulations, but the costs are paid by society. FIGURE 10–1 Cost Benefit Ratio in Environmental Protection Costs rise exponentially as society tries to eliminate the last measure of pollution. Benefits in Relation to Costs. Public choice theory requires that environmental policies be evaluated in terms of their net benefits to society; that is, the costs of environmental policies should not exceed their benefits to society. It is much less costly to reduce the first 50 to 75 percent of any environmental pollutant or hazard than to eliminate all (100 percent) of it (see Figure 10–1). As any pollutant or hazard is reduced, the cost of further reductions rises and the net benefits to society of additional reductions decline. As the limit of zero pollution or zero environmental risk is approached, additional benefits are minuscule but additional costs are astronomical. Ignoring these economic realities simply wastes the resources of society, lowers our standard of living, and in the long run impairs our ability to deal effectively with any societal problem, including environmental protection. Environmental Externalities The air and water in the United States are far cleaner today than in previous decades. This is true despite growth in population and even greater growth in waste products. Nonetheless, genuine concern for environmental externalities centers on the disposal of solid waste (especially hazardous wastes), water pollution, and air pollution. Solid Waste Disposal. Every American produces about 4.5 pounds of solid waste per day (see Table 10–1). The annual load of waste dumped on the
  • 3. environment includes 82 million tons of paper, 48 billion cans, 26 billion bottles and jars, 2 billion disposable razors, 16 billion disposable diapers, and 4 million automobiles and trucks. The nation spends billions of dollars annually on hauling all this away from homes and businesses. TABLE 10–1 Growth in Solid Wastes Each day the average American produces more than four pounds of waste; about 30 percent of waste can be recycled. There are three methods of disposing of solid wastes—landfills, incineration, and recycling. Modern landfills have nearly everywhere replaced town dumps. Landfills are usually lined with clay so that potentially toxic wastes do not seep into the water system. Even so, hazardous wastes are separated from those that are not hazardous and handled separately. Given a reasonable site, there is nothing especially wrong with a landfill that contains no hazardous wastes. However, landfill sites need to meet strict standards and people do not want landfills near their residences. These conditions combine to make it difficult to develop new landfills. Contrary to popular rhetoric, there is no “landfill crisis”; the nation is not “running out of land.” However, both government agencies and private waste disposal firms are frequently stymied by the powerful, organized NIMBYs (“not in my back yard”). Landfill sites are plentiful but local opposition is always strong. Timid politicians cannot confront the NIMBYs, so they end up overusing old landfills or trying to ship their garbage elsewhere. Another alternative is to burn the garbage. Modern incinerators are special plants, usually equipped with machinery to separate the garbage into different types, with scrubbers to reduce air pollution from the burning and often with electrical generators powered by heat from the garbage fire. Garbage is put through a shredder to promote even burning; metal is separated out by magnets, and the garbage is passed over screens that separate it further. At this point about half the garbage has been removed and hauled to a landfill. The remaining garbage is shredded still
  • 4. further into what is called fluff, or perhaps it is compressed into pellets or briquets. This material is then burned, usually at another site and perhaps together with coal, to produce electricity. The ash is handled by the public utility as it would handle any other ash, which often means selling it to towns to use on roads. One problem with this method is the substances emitted from the chimney of the incinerator or the utility that is burning the garbage. Another problem: because the garbage separated during the screening phase still has to be disposed of, the need for landfill sites is only reduced, not eliminated. A third method of reducing the amount of solid waste is recycling. Recycling is the conversion of wastes into useful products. Most of the time, waste cannot be recycled into the same product it was originally but rather into some other form. Newspapers are recycled into cardboard, insulation, animal bedding, and cat litter, but in an exception to the general rule, some are recycled into newsprint. (Dye 210-213) Overall, about 30 percent of all solid waste in the United States is recovered for reuse.1 This is a notable improvement over the mere 10 percent that was recycled 30 years ago. Some materials lend themselves fairly well to recycling (e.g., aluminum cans, paper products), but other materials do not (e.g., plastics). At present there is more material available for recycling than plants can effectively use; millions of tons of recycled newspapers are either piled up as excess inventory in paper mills or dumped or burned. Nonetheless, recycling does have an effect in reducing the load on incinerators and landfills. Hazardous Waste. Hazardous (toxic) wastes are those that pose a significant threat to public health or the environment because of their “quantity, concentration, or physical, chemical, or infectious characteristics.”2 The Resource Conservation and Recovery Act of 1976 gave the Environmental Protection Agency (EPA) the authority to determine which substances are toxic and the EPA has so classified several hundred substances. Releases of more
  • 5. than a specified amount must be reported to the National Response Center. Substances are considered hazardous if they easily catch fire, are corrosive, or react easily with other chemicals. Many substances are declared toxic by the EPA because massive daily doses administered to laboratory animals cause cancers to develop. Toxic chemical releases must also be reported annually. These reports show that toxic releases have been reduced by more than half over the last decade.3 Thus far, the United States has avoided any toxic releases comparable to the accident in Bhopal, India, in 1984, which killed almost 3,000 people. Nuclear wastes create special problems. These are the wastes from nuclear fission reactors and nuclear weapons plants. Some have been in existence for 50 years. Because the waste is radioactive and some of it stays radioactive for thousands of years, it has proven very difficult to dispose of. Current plans to store some wastes in deep, stable, underground sites have run into local opposition. Most nuclear waste in the United States is stored at the site where it was generated, pending some long- term plan for handling it. Hazardous wastes from old sites also constitute an environmental problem. These wastes need to be moved to more secure landfills. Otherwise, they can affect the health of people living near the waste site, often by seeping into the water supply. The EPA is committed to cleaning up such sites under the Superfund laws of 1980 and 1986. As a first step, it developed a National Priority List of sites that needs attention, based on a hazard ranking system. The EPA listed about 1,300 hazardous waste sites. Cleanups have been done by the EPA itself, other federal state or local government agencies, or the company or party responsible for the contamination. Water Pollution. Debris and sludge, organic wastes, and chemical effluents are the three major types of water pollutants. These pollutants come from (1) domestic sewage, (2) industrial waste, (3) agricultural runoff of fertilizers and pesticides, and (4) “natural” processes,
  • 6. including silt deposits and sedimentation, which may be increased by nearby construction. A common standard for measuring water pollution is biochemical oxygen demand (BOD), which identifies the amount of oxygen consumed by wastes. This measure, however, does not consider chemical substances that may be toxic to humans or fish. It is estimated that domestic sewage accounts for 30 percent of BOD, and industrial and agricultural wastes for 70 percent. Primary sewage treatment—which uses screens and settling chambers, where filth falls out of the water as sludge—is fairly common. Secondary sewage treatment is designed to remove organic wastes, usually by trickling water through a bed of rocks 3 to 10 feet deep, where bacteria consume the organic matter. Remaining germs are killed by chlorination. Tertiary sewage treatment uses mechanical and chemical filtration processes to remove almost all contaminants from water. Some cities dump sewage sludge into the ocean after only primary treatment or no treatment at all. Although federal law prohibits dumping raw sewage into the ocean, it has proven difficult to secure compliance from coastal cities. Federal water pollution abatement goals call for the establishment of secondary treatment in all American communities. In most industrial plants, tertiary treatment ultimately will be required to deal with the flow of chemical pollutants. But tertiary treatment is expensive; it costs two or three times as much to build and operate a tertiary sewage treatment plant as it does a secondary plant. Phosphates are major water pollutants that overstimulate plant life in water, which in turn kills fish. Phosphates run off from fertilized farm land. Farming is the major source of water pollution in the United States. Waterfronts and seashores are natural resources. The growing numbers of waterfront homes, amusement centers, marinas, and pleasure boats are altering the environment of the nation’s coastal areas. Marshes and estuaries at the water’s edge are essential to the production of seafood and shellfish, yet they are
  • 7. steadily shrinking with the growth of residential-commercial- industrial development. Oil spills are unsightly. Although pollution is much greater in Europe than in America, America’s coastal areas still require protection. Federal law makes petroleum companies liable for the cleanup costs of oil spills and outlaws flushing of raw sewage from boat toilets. The EXXON Valdez oil spill in Alaska in 1989 focused attention on the environmental risks of transporting billions of barrels of foreign and domestic oil each year in the United States. The federal government has provided financial assistance to states and cities to build sewage treatment plants ever since the 1930s. Efforts to establish national standards for water quality began in the 1960s and culminated in the Water Pollution Control Act of 1972. This “Clean Water Act” set “national goals” for elimination of all discharges of all pollutants into navigable waters; it required industries and municipalities to install “the best available technology”; it gave the EPA authority to initiate legal actions against pollution caused by firms and governments; it increased federal funds available to municipalities for the construction of sewage treatment plants. The EPA is authorized by the Safe Drinking Water Act of 1974 to set minimum standards for water quality throughout the nation. The EPA does not set a zero standard for fecal bacteria or phosphate or other pollutants; to do so would commit the nation to astronomical cost projections for “clean” water and would never be possible to attain anyway. The EPA has considerable power to raise or lower standards, and hence to increase or reduce costs. Water quality in the United States has improved significantly over the years (see Table 10–2). The problem, of course, is that removing all pollutants is neither cost-effective nor possible. Air Pollution. The air we breathe is about one-fifth oxygen and a little less than four-fifths nitrogen, with traces of other gases, water vapor, and the waste products we put into it. Air pollution is caused, first of all, by the gasoline-powered internal combustion
  • 8. engines of cars, trucks, and buses. The largest industrial polluters are petroleum refineries, smelters (aluminum, copper, lead, and zinc), and iron foundries. Electrical power plants also contribute to total air pollutants by burning coal or oil for electric power. Heating is also a major source of pollution; homes, apartments, and offices use coal, gas, and oil for heat. Another source of pollution is the incineration of garbage, trash, metal, glass, and other refuse by both governments and industries. TABLE 10–2 Improvements in Water Quality Water quality has improved dramatically over the last three decades. NOTE: Figures are violations rates—the proportion of measures that violate the EPA standards. SOURCE: Environmental Protection Agency, National Water Quality Inventory, 2002. Air pollutants fall into two major types: particles and gases. The particles include ashes, soot, and lead, the unburnable additive in gasoline. Often the brilliant red sunsets we admire are caused by large particles in the air. Less obvious but more damaging are the gases: (1) sulfur dioxide, which in combination with moisture can form sulfuric acid; (2) hydrocarbons—any combination of hydrogen and carbon; (3) nitrogen oxide, which can combine with hydrocarbons and the sun’s ultraviolet rays to form smog; and (4) carbon monoxide, which is produced when gasoline is burned. The EPA sets limits on fine particulate matter (soot, dust) in the air. But many large cities, for example New York, Los Angeles, Chicago, and Washington, DC, exceed these limits. A recent federally financed study reported that “the risk of dying from lung cancer as well as heart disease in the most polluted cities was comparable to the risk associated with non-smokers being exposed to second-hand smoke over a long period of time.” FIGURE 10–2 Improvements in Air Quality Contrary to much popular opinion, the air is much cleaner today
  • 9. than in prior years. SOURCE: www.epa.gov/air/airtrends. The air we breathe is significantly cleaner today than thirty years ago (see Figure 10–2). Federal clean air legislation (described later in this chapter) is generally credited with causing these improvements. The Environmental Protection Agency claims that the Clean Air Act of 1970 and subsequent amendments to it have resulted in an overall reduction in principal pollutants since 1970 of 57 percent. This improvement in air quality has come about despite increases in the gross domestic product (207 percent), vehicle miles traveled (179 percent), energy consumption (49 percent), and population growth (47 percent). (See Figure 10–3.) Interest Group Effects Americans live longer and healthier lives today than at any time in their country’s history. Life expectancy at birth is now 78.5 years (75.6 for males; 81.4 for females), up eight full years since 1970. Cancer deaths are up slightly but not because of environmental hazards. The primary causes of premature death are what they have always been: smoking, diets rich in fat and lean in fiber, lack of exercise, and alcohol abuse. Yet public opinion generally perceives the environment as increasingly contaminated and dangerous, and this perception drives public policy. Interest Group Economics. Organized environmental interests must recruit memberships and contributions (see Table 10–3). They must justify their activities by publicizing and dramatizing environmental threats. When Greenpeace boats disrupt a U.S. Navy exercise, they are attracting the publicity required for a successful direct-mail fund-raising drive. The mass media, especially the television networks, welcome stories that capture and hold audiences’ attention. Stories are chosen for their emotional impact, and threats to personal life and safety satisfy the need for drama in the news. Statistics that indicate negligible risks or scientific testimony that minimizes threats or presents ambiguous findings
  • 10. do not make good news stories. Politicians wish to be perceived as acting aggressively to protect citizens from any risk, however minor. Politicians want to be seen as “clean” defenders of the pristine wilderness. And government bureaucrats understand that the greater the public fear of environmental threat, the easier it is to justify expanded powers and budgets. Shaping Public Opinion. TABLE 10–3 Leading Environmental Organizations Environmental politics in Washington are heavily influenced by environmental interest groups. Interest group activity and media coverage of environmental threats have succeeded in convincing most Americans that environmental pollution is getting worse. Evidence that the nation’s air and water are measurably cleaner today than in the 1970s is ignored. Opinion polls report that 57 percent of Americans agree with this statement: “Protecting the environment is so important that requirements and standards cannot be too high and continued environmental improvements must be made regardless of cost.”5 If taken seriously, such an attitude would prevent either scientific or economic considerations from guiding policy. Environmentalism threatens to become a moral crusade that dismisses science and economics as irrelevant or even wicked. In such a climate of opinion, moral absolutism replaces rational public policy. (Dye 216-217) FIGURE 10–3 Comparison of Growth and Emissions Air pollution has decreased even while the economy has grown, the population has grown, more miles are traveled, and more energy is consumed. SORUCE: Environmental Protection Agency, “Six Common Air Pollutants,” www.epa.gov. Interest Group Politics. Everyone is opposed to pollution. It is difficult publicly to oppose clean air or clean water laws—who wants to stand up for
  • 11. dirt? Thus the environmentalists begin with a psychological and political advantage: they are “clean” and their opponents are “dirty.” The news media, Congress, and executive agencies can be moved to support environmental protection measures with little consideration of their costs—in job loss, price increases, unmet consumer demands, increased dependence on foreign sources of energy. Industry—notably the electric power companies, oil and gas companies, chemical companies, automakers, and coal companies—must fight a rearguard action, continually seeking delays, amendments, and adjustments in federal standards. They must endeavor to point out the increased costs to society of unreasonably high standards in environmental protection legislation. But industry is suspect; the environmentalists can charge that industry opposition to environmental protection is motivated by greed for higher profits. And the charge is partially true, although most of the cost of antipollution efforts is passed on to the consumer in the form of higher prices. The environmentalists are generally upper-middle-class or upper-class individuals whose income and wealth are secure. Their aesthetic preferences for a no-growth, clean, unpolluted environment take precedence over jobs and income, which new industries can produce. Workers and small business people whose jobs or income depend on energy production, oil refining, forestry, mining, smelting, or manufacturing are unlikely to be ardent environmentalists. But there is a psychological impulse in all of us to preserve scenic beauty, protect wildlife, and conserve natural resources. It is easy to perceive industry and technology as the villain, and “man against technology” has a humanistic appeal. NIMBY Power. Environmental groups have powerful allies in the nation’s NIMBYs—local residents who feel inconvenienced or threatened by specific projects. Even people who otherwise recognize the general need for new commercial or industrial developments, highways, airports, power plants, pipelines, or
  • 12. waste disposal sites, nonetheless voice the protest “not in my back yard,” earning them the NIMBY label. Although they may constitute only a small group in a community, they become very active participants in policymaking—meeting, organizing, petitioning, parading, and demonstrating. NIMBYs are frequently the most powerful interests opposing specific developmental projects and are found nearly everywhere. They frequently take up environmental interests, using environmental arguments to protect their own property investments. Radical Environmentalism. At the extreme fringe of the environmental movement one finds strong opposition to economic development, to scientific advancement, and even to humanity. According to the Club of Rome (a radical environmental organization), “The real enemy, then, is humanity itself.”6 The “green” movement is international, with well-organized interest groups and even political parties in Western European nations. Its program to “Save the Planet” includes the deindustrialization of Western nations; reduction of the human population; elimination of all uses of fossil fuels, including automobiles; the elimination of nuclear power; an end to cattle raising, logging, land clearance, and so on; and the transfer of existing wealth from the industrialized nations to underdeveloped countries.7 Global Warming/Climate Change Gloomy predictions about catastrophic warming of the Earth’s surface have been issued by the media and environmental interest groups in support of massive new regulatory efforts. Global warming is theorized to be a result of emissions of carbon dioxide and other gases that trap the sun’s heat in the atmosphere. As carbon dioxide increases in the atmosphere as a result of increased human activity, more heat is trapped. Deforestation contributes to increased carbon dioxide by removing trees, which absorb carbon dioxide and produce oxygen. The dire predictions of greenhouse effects include droughts and crop destruction, melting of the polar ice caps, and ocean flooding.
  • 13. Climate Change. It is true that the Earth’s atmosphere creates a greenhouse effect; if not, temperatures on the Earth’s surface would be like those on the moon—unbearably cold (–270°F) at night and unbearably hot (+212°F) during the day. The greenhouse gases, including carbon dioxide, moderate the Earth’s surface temperature. And it is true that carbon dioxide is increasing in the atmosphere, an increase of about 25 percent since the beginning of the Industrial Revolution in 1850, and 13 percent since 1970 (see Figure 10–4). It is also true that the Earth has been warming over the past century, since the beginning of the Industrial Revolution. Global average temperatures have risen about 1.4°F. Average sea levels have risen and the northern hemispheric snow cover has diminished. Various computer simulations of the effect of increased dioxides in the atmosphere have predicted future increases in temperature ranging from 1° (not significant) to 8° (significant if it occurs rapidly).8 Global climate change is caused by a variety of factors: slight changes in the Earth’s orbit, causing ice ages over millennia (the last ice age, when average temperatures were 9° cooler, ended 15,000 years ago.); solar activity including sun flares (a “little” ice age between 1500–1850 is estimated to have cooled the Earth by about 2°F); and volcanic activity, which tends to block sunlight and contribute to short-term cooling (a volcano in Indonesia in 1815 lowered global temperatures by 5°F and historical accounts in New England described 1816 as “the year without a summer”). Is human activity contributing to global warming? Fossil fuels emit carbon dioxide (CO2) into the atmosphere. Since the beginning of the Industrial Revolution atmospheric carbon dioxide concentrations have increased by about 25 percent. This increase corresponds to an increase in average global temperature (see Figure 10–4). This correspondence does not prove causation, but it underlies the fundamental argument of global warming theory.
  • 14. International Panel on Climate Change. A UN-sponsored International Panel on Climate Change (IPCC) reported with “very high confidence” that human activity since the Industrial Revolution has contributed to increases in atmospheric concentrations of carbon dioxide, methane, and nitrous oxide.9 The IPCC does not do its own research but rather assesses scientific reports from other bodies. Its Fourth Assessment Report: Climate Change 2007 is widely cited by environmentalists: “Most of the observed increase in global average temperatures since the mid-20th century is very likely due to the observed increase in anthropogenic [caused by human activity] greenhouse gas concentrations.” The popularity of the report was reflected in the awarding of a Nobel Prize to the IPCC and to its principal publicist, Al Gore. Gore’s movie, An Inconvenient Truth dramatizes the effects of global warming. (Dye 217-220) FIGURE 10–4 Trends in Atmospheric Carbon Dioxide and Global Surface Temperature Recent increases in atmospheric concentrations of carbon dioxide (CO2) have corresponded with increases in average surface temperatures on Earth. The sharpest rises in CO2 and temperatures have occurred since 1970. SOURCE: Pew Center on Global Climate Change, www.pewclimate.org. Greenhouse Gases. Carbon dioxide (CO2) contributes about three-quarters of total greenhouse gas emissions; methane and nitrous oxide are also classified as greenhouse gases. The principal source of CO2 emissions are power plants (30 percent), industrial processes (21 percent), transportation (19 percent), residential (13 percent), land use (9 percent), and other fossil fuel uses (8 percent). Any serious effort to reduce overall greenhouse gas emissions must deal with electric utilities, waste disposal facilities, natural gas producers, petroleum refineries, smelters, and motor vehicle emissions, among other sources.
  • 15. Recently China surpassed the United States as the largest single national contributor of atmospheric pollutants. Both nations together currently produce about 50 percent of the world’s output of greenhouse gases. But China, together with India and Indonesia, contributes to the largest annual increases in greenhouse emissions. Whatever policies the United States adopts to limit its own emissions, the Earth’s atmosphere will continue to be polluted by other nations. Environmentalists argue that the United States must act first in order to set an example for the world. The Rio Treaty. Environmentalists argue that “drastic action” is required now to avert “catastrophic” global warming. Former Vice President Al Gore is a leading exponent of the view that governments cannot afford to wait until the scientific evidence demonstrates conclusively that human activity contributes to global warming. Rather, governments must immediately impose a system of “global environmental regulations” in order to “save the planet.”10 Inasmuch as Third World nations are just beginning to industrialize, they pose the greatest threat of new sources of global pollution. But the industrialized nations are responsible for “undermining the Earth’s life support system” (the United States is usually singled out as the primary culprit), and therefore they must compensate poorer nations in exchange for their pledge not to add to global pollution. The international environmental agenda includes massive transfers of wealth from industrialized nations to less developed countries. The Rio Treaty incorporates these ideas. It is a product of the “Earth Summit,” officially the United Nations Conference on Environment and Development held in Rio de Janeiro, Brazil, in 1992. It was attended by 178 nations as well as hundreds of environmental interest groups, officially sanctioned as “nongovernmental organizations” or “NGOs.” The conference produced a Global Climate Change Treaty, signed by President George H.W. Bush, but not ratified by the U.S. Senate, which declares, among other things, that “lack of scientific certainty
  • 16. shall not be used as a reason for postponing cost-effective measures to prevent environmental degradation”! The statement is, of course, a contradiction: without scientific information, it is impossible to determine cost-effectiveness.12 Copenhagen Conference. Governments and non-governmental organizations have been meeting in Copenhagen Denmark with the goal of developing a legally binding treaty to reduce world-wide carbon emissions. The negotiations are sponsored by the UN Framework Convention on Climate Change. The United States is among the 192 countries participating in the Conference; the United States favors the development of nonbinding pledges regarding carbon emissions, rather than legally binding emissions cuts. Less developed nations have demanded compensation from the developed nations in exchange for limiting growth in their emissions. At present the prospects for agreement appear dim. The Kyoto Protocol. In 1997, a far-reaching amendment to the Rio Treaty, known as the Kyoto Protocol, was negotiated under the United Nations Convention on Global Climate Change. Whereas the Rio Treaty set voluntary national goals for reducing greenhouse gases, the Kyoto agreement required the United States and other developed nations to reduce their emissions below 1990 levels sometime between 2008 and 2012. Reductions by developed nations were designed to offset expected increases in emissions by developing nations. The reduction mandated for the United States was 7 percent below its 1990 level—a reduction that would entail approximately a 40 percent reduction in fossil fuel use. The Clinton administration supported the Kyoto Protocol, but declined to submit it for ratification to the U.S. Senate in view of its likely defeat in that body. The Bush administration opposed the Protocol. Energy Policy Environmental policy and energy policy are closely intertwined. Currently America gets most of its energy from fossil fuels— oil, natural gas, and coal (see Figure 10–5). These sources
  • 17. produce pollutants, including carbon dioxide emissions that appear related to global climate change. Despite heavy subsidization by the federal government, “renewable” energy sources—hydroelectric, geothermal, solar, wind, and biomass— account for only about 7 percent of the energy used in the United States. Energy Consumption. Electric power plants account for the greatest share of energy produced in the United States (see Figure 10–5). About half of all electric generating plants are powered by coal; almost 20 percent are nuclear powered; most of the remainder are powered from oil or natural gas; less than 10 percent of electric power is derived from renewable energy sources. Transportation accounts for nearly 30 percent of total energy use in America, almost all of it from oil. Energy consumption per person in United States has stabilized over the last thirty years. Growth in overall energy consumption has matched population growth. Energy consumption has actually declined relative to the gross national product, suggesting that America is becoming more efficient over time in energy use. And energy expenditures have declined as a share of the GDP. This good news is not widely reported in the mass media. FIGURE 10–5 Energy Sources and Uses The U.S. gets most of its energy from oil, gas, and coal, all of which produce greenhouse gases. Clean nuclear and renewable sources provide relatively little energy for the country. Electric power plants and motor vehicles together use nearly 70 percent of the energy generated. SOURCE: Data from Energy Information Administration, U.S. Department of Energy, www.eia.doe.gov. Energy Supply. Supply-side energy policies emphasize the search for more sources of energy. Domestic oil production can be increased through exploration and drilling in public lands and offshore
  • 18. waters. (“Drill, baby, drill” became a popular slogan at Republican campaign stops in 2008.) Drilling in the Alaska National Wildlife Refuge (ANWR) in Alaska is an especially controversial option. Natural gas is more plentiful than petroleum, but its widespread use would require a complete overhaul of the nation’s automobile and truck fleets to run on natural gas rather than gasoline. Nuclear power promises a clean source of energy for electrical power plants, but to date political struggles have effectively foreclosed the nuclear option (see “Nuclear Industry Meltdown” later in this chapter). The federal government heavily subsidizes research and development into “renewable” energy sources—land, solar, geothermal, and biomass (including ethanol production from corn). But none of these sources appear to be commercially feasible on any significant scale. Nevertheless the call for greater reliance on these sources of energy remains politically very popular. Fuel Efficiency. The federal government requires automobile manufacturers to maintain corporate average fuel efficiency (CAFE) standards in the production of automobiles and light trucks. These averages are calculated from highway miles-per-gallon figures for all models of cars and light trucks produced by each manufacturer. (In recent years, the CAFE standards for cars has been 27.5 miles per gallon, and for light trucks, vans, and sports utility vehicles, 22.2 miles per gallon.) Determining CAFE standards engenders near constant political conflict in Washington, pitting auto manufacturers and auto workers’ unions against environmental and consumer groups. The popularity of pickup trucks, minivans, and sports utility vehicles means that overall fuel efficiency on the roads is difficult to improve. Alternative fuel vehicles and hybrids—cars powered entirely or in part by electricity, natural gas, hydrogen, ethanol, etc.—constitute less than 5 percent of new vehicle sales. Projections. The U.S. Department of Energy annually produces an “Energy
  • 19. Outlook” that projects energy use in greenhouse gas emissions to 2030. Among its current projections:11 •Growth in energy consumption in greenhouse gas emissions is likely to moderate as a result of government policies and high energy prices. •Fossil fuels will continue to provide nearly 80 percent of total energy use. •Energy efficiencies will cause declines in per capita energy use and declines in energy use per dollar of GDP. •Hybrid motor vehicles—partly powered by electricity—are projected to increase significantly in numbers. •Growth in electrical use will moderate with improved efficiency in homes and industry. •Nonrenewable energy sources will increase, but remain less than 10 percent of total energy supply. •Growth in energy-related carbon dioxide emissions will slow along with slowing growth in energy use. Cap and Trade In his first budget message to Congress, President Barack Obama recommended an innovative approach to energy policy. In addition to pledging federal subsidies for research and development in “clean energy technologies,” he proposed a new carbon emissions trading program known as “cap and trade.” A Ceiling on Carbon Emissions. The cap and trade program envisions the federal government setting overall national ceilings on carbon emissions. The government would then hold a national auction in which polluting industries and firms could purchase tradable emission allowances. The total amount of emission allowances auctioned off would not exceed the cap. In effect, industries would be purchasing allowances to pollute. These allowances could be traded on an open market, allowing polluting industries to keep polluting but at a price, and at the same time, encouraging industries to invest dollars in reducing carbon emissions. An industry that succeeded in reducing emissions below its allowance could then sell its allowance to other industries.
  • 20. Relying in Part on the Market Mechanism. The cap and trade approach to reducing carbon emissions is recommended over direct regulatory control. Because it relies in part on a market mechanism, it is sometimes labeled free-market environmentalism. Setting the overall cap is a regulatory measure, but individual firms are free to choose how or if they will reduce their emissions. The system encourages innovation by individual firms. If they are successful in reducing their emissions, they can sell their allowances to other firms. Costs to Consumers. The cost of the cap and trade program would be borne by all energy users. The federal government would actually make money from auction revenues. The costs to energy consumers would be largely invisible, passed on by industries in the form of price increases. Everything from gasoline prices to electric bills would incorporate the prices industries paid for emission allowances at auction or in trades. Enforcement. The federal government would put in place a vast new bureaucracy to oversee the carbon emissions of individual industries and firms. It will be necessary to measure the “carbon footprint” of industries and firms to ensure that they are operating within the emission allowances purchased at auction or in trade. The Nuclear Industry Meltdown Nuclear power is the cleanest and safest form of energy available. But the political struggle over nuclear power has all but destroyed early hopes that nuclear power could reduce U.S. dependence on fossil fuels. Nuclear power once provided about 20 percent of the nation’s total energy. Many early studies recommended that the United States strive for 50 percent nuclear electric generation. But under current policies it is unlikely that nuclear power will ever be able to supply any more energy than it does today—less than ten percent (see Figure 10– 5). The nuclear industry itself has been in a state of “meltdown,” and the cause of the meltdown is political, not
  • 21. technological. History of Regulation. In its developmental stages, nuclear power was a government monopoly. The Atomic Energy Act of 1946 created the Atomic Energy Commission (AEC), which established civilian rather than military control over nuclear energy. The AEC was responsible for the research, development, and production of nuclear weapons, as well as the development of the peaceful uses of nuclear energy. The AEC contracted with the Westinghouse Corporation to build a reactor and with the Duquesne Light Company to operate the world’s first nuclear power plant at Shippingport, Pennsylvania, in 1957. Under the Atomic Energy Act of 1954 the AEC granted permits to build, and licenses to operate, nuclear plants; the AEC also retained control over nuclear fuel. The AEC promoted the growth of the nuclear industry for over 20 years. But opponents of nuclear power succeeded in the Energy Reorganization Act of 1974 in separating the nuclear regulatory function from the research and development function. Today a separate agency, the Nuclear Regulatory Commission (NRC), regulates all aspects of nuclear power. Only 104 nuclear power plants are currently in the United States today. “No-nukes.” Nuclear power has long been under attack by a wide assortment of “nonuke” groups. The core opposition is found among environmental activist groups. But fear plays the most important role in nuclear politics. The mushroom cloud image of the devastation of Japanese cities at the end of World War II is still with us. The mass media cannot resist dramatic accounts of nuclear accidents. The public is captivated by the “China syndrome” story—an overheated nuclear core melts down the containing vessels and the plant itself and releases radioactivity that kills millions. Nuclear power offers a means of generating electricity without discharging any pollutants into the air or water. It is the cleanest form of energy production. It does not diminish the
  • 22. world’s supply of oil, gas, or coal. However, used reactor fuel remains radioactive for hundreds of years and there are potential problems in burying this radioactive waste. Spent fuel is now piling up in storage areas in specially designed pools of water at nuclear power sites. When these existing storage places are filled to capacity, spent fuel will have to be transported somewhere else, adding to new complaints about the dangers of radioactive waste. There are many technical alternatives in dealing with waste, but there is no political consensus about which alternative to choose. Safety. The nuclear power industry in the United States has a 60-year record of safety. No one has ever died or been seriously harmed by radioactivity from a nuclear power plant in the United States. This record includes more than 100 nuclear power plants operated in the United States and hundreds of nuclear-powered surface and submarine ships operated by the U.S. Navy. Despite sensational media coverage, the failure of the nuclear reactor at Three Mile Island, Pennsylvania, in 1979 did not result in injury to anyone or cause damage beyond the plant. There are about 450 nuclear power plants operating outside of the United States. France generates 76 percent of its electricity by nuclear means. The worst nuclear accident in history occurred at Chernobyl in the Ukraine in 1986; it resulted in 31 immediate-term deaths from radiation. Zero risk is an impossible standard, and the costs of efforts to approach zero risk are astronomical. Under popular pressure to achieve near-zero risk, the NRC has imposed licensing requirements that now make nuclear plants the most expensive means of generating electricity. No new nuclear plants have been built in over two decades, and private utilities have canceled dozens of planned nuclear plants. The stated policy of the national government may be to keep open the nuclear power option, but the actual effect of nuclear regulatory policy has been to foreclose that option. The Future of Nuclear Power.
  • 23. What are the prospects for a “nuclear renaissance”? A variety of factors suggest a reexamination of the utility of nuclear power: the U.S. Department of Energy projects that electricity demand will rise 25 percent by 2030, requiring the construction of hundreds of new power plants; oil price increases make nuclear power generation more competitive; concerns over global warming and pollution from fossil fuel use drive a new interest in nuclear power; and national security concerns regarding U.S. dependence on foreign oil suggests the need to develop reliable domestic power sources. But reviving the nuclear energy industry will require, first of all, a streamlined and cost-conscious regulatory environment, one that encourages private companies to make the long-term capital investments required to bring new nuclear plants into operation. Secondly, the federal government must decide on, finance, and implement a nuclear waste management program, one that includes spent nuclear materials from both military and private power uses. Finally, nuclear power cannot be revived without federal subsidies and loan guarantees for private power companies to encourage them to move forward building new nuclear plants. Yet even if Washington responded favorably to nuclear industry requirements, new plants are not likely to begin producing power in the United States for another ten years. Politicians and Bureaucrats: Regulating the Environment Federal environmental policymaking began in earnest in the 1970s with the creation of the Environmental Protection Agency (EPA) and the passage of clean air and water acts. Potentially, the EPA is the most powerful and far-reaching bureaucracy in Washington today, with legal authority over any activity in the nation that affects the air, water, or ground. The Environmental Protection Agency. The EPA was created in an executive order by President Richard Nixon in 1970 to reorganize the federal bureaucracy to consolidate responsibility for (1) water pollution, (2) air pollution, (3) solid waste management, (4) radiation control,
  • 24. and (5) hazardous and toxic substance control. The EPA is a regulatory agency with power to establish and enforce policy. The National Environmental Protection Act. In 1970 Congress created the Council on Environmental Quality (CEQ) to advise the president and Congress on environmental matters. The CEQ is an advisory agency. However, the act requires all federal agencies as well as state, local, and private organizations receiving federal monies to file lengthy “environmental impact statements.” If the CEQ wants to delay or obstruct a project, it can ask for endless revisions, changes, or additions in the statement. The CEQ cannot by itself halt a project, but it can conduct public hearings for the press, pressure other governmental agencies, and make recommendations to the president. The courts have ruled that the requirement for an environmental impact statement is judicially enforceable. The Clean Air Act of 1970. The Clean Air Act of 1970 authorized the EPA to identify air pollutants that cause a health threat and to establish and enforce standards of emission. The EPA began by focusing on automobile emissions, requiring the installation of pollution equipment on all new cars. The EPA ordered lead removed from auto fuel and engines redesigned for lead-free gasoline. It also ordered the installation of emission controls in automobiles. More radical solutions advanced by the EPA (for example, to halt driving in certain cities) were blocked by courts and Congress. The EPA was even more aggressive in pursuing stationary sources of air pollution with requirements for “smokestack scrubbers,” low-sulfur coal, and other costly devices. The Water Pollution Control Act of 1972. This act stiffened early antipollution laws, but set an unrealistic goal: “that the discharge of pollutants into the navigable waters be eliminated by 1985.” After a flood of lawsuits the EPA was forced to abandon the zero-discharge standard. Forcing municipal governments to clean up their discharges proved more
  • 25. difficult than forcing industry to do so. Many municipalities remain in violation of federal water quality standards. Endangered Species Act of 1973. This legislation authorizes the U.S. Fish and Wildlife Service to designate endangered species for federal protection and to regulate activities in their “critical habitat.” Initially the law was widely praised as at least partially responsible for the survival of nationally symbolic species such as the bald eagle; but increasingly the law has been used to prevent landowners from using their property in order to protect obscure varieties of rodents, birds, and insects. Today more than 1,000 species are on the endangered species list, and there is virtually no land in the United States on which an endangered species does not live. The U.S. Fish and Wildlife Service has the potential to control any land in the nation under the Endangered Species Act. Wetlands. In 1975 a federal court ruled that the Clean Water Act of 1972 also applied to “wetlands” adjacent to navigable waters. This gave the EPA control over millions of acres of land, estimated to be the equivalent of Ohio, Indiana, and Illinois combined. The result has been a bureaucratic nightmare for owners of land that is classified as wetlands. Resource Conservation and Recovery Act of 1976. The act authorizes EPA to oversee the nation’s solid waste removal and disposal, including the regulation of landfills, incinerators, industrial waste, hazardous waste, and recycling programs. Toxic Substances Control Act of 1976. The Toxic Substances Control Act authorized the EPA to designate hazardous and toxic substances and to establish standards for their release into the environment. The Comprehensive Environmental Response Act of 1980. The Comprehensive Environmental Response Act established a “Superfund” for cleaning up old toxic and hazardous waste sites. Out of 20,000 potential sites, the EPA has placed more than 1,200 on its National Priority List. The act specifies that
  • 26. EPA oversee the cleanup of these sites, assessing costs to the parties responsible for the pollution. If these parties cannot be found or have no money, then the government’s Superfund is to be used. But over the years, cleanup efforts have been seriously hampered by EPA’s overly rigid site orders (for example, dirt must be cleaned to the point where it can be safely eaten daily by small children), lengthy lawsuits against previous owners and users (including Little League teams) that divert funds to legal fees, and complicated negotiations with local government over the cleanup of old landfill sites. EPA also enforces “retroactive liability,” holding owners liable for waste dumped legally before the law was enacted in 1980. Under current EPA policies, full cleanup of all hazardous waste sites on the National Priority List would cost many billions of dollars, far more than presidents or Congresses are likely to appropriate. Clean Air Act of 1990. The Clean Air Act Amendments of 1990 enacted many new regulations aimed at a variety of perceived threats to the environment: Acid rain. Sulfur dioxide emissions must be cut from 20 to 10 million tons annually, and nitrogen oxide emissions must be cut by 2 million tons. Midwestern coal-burning utilities must burn low-sulphur coal and install added smoke-scrubbing equipment at increased costs to their consumers. Ozone hole. Production of chlorofluorocarbons and hydrochlorofluorocarbons (aerosol sprays, insulating materials) is outlawed, and new regulations are placed on chemicals used in air conditioners and refrigerators. Urban smog. Additional mandated pollution control equipment is required on new automobiles. Oil companies must produce cleaner-burning fuel. There is also a special requirement that automobile companies produce an experimental fleet of cars to be sold in southern California. Toxic air pollutants. New definitions and regulations govern more than 200 substances as “toxic air pollutants” released into the air from a wide variety of sources, from gas stations to dry
  • 27. cleaners. The EPA is given authority to require all of these sources to install “the best available control technology” and to provide “an ample margin of safety” for nearby residents. EPA Regulation of Carbon Dioxide, 2009. The Environmental Protection Agency issued an official finding in 2009 that carbon dioxide is a danger to human health and the environment and therefore subject to EPA regulation under the Clean Air Act. This “endangerment finding” potentially allows the EPA to draw up regulations governing greenhouse gas emissions from electric power plants, refineries, chemical plants, motor vehicles and other sources of emissions, including schools, hospitals, homes and apartment buildings. Encouraged by the Obama Administration, and relying heavily on studies cited by the International Panel on Climate Change (see above), the EPA issued its finding. Earlier in 2007 the US Supreme Court had held that the Clean Air Act “expressly authorized” the EPA to regulate air “pollutants” and that the EPA itself did not challenge the contention that carbon dioxide was a pollutant.12 The threat of EPA regulation of all carbon emissions provides an incentive for Congress itself to act on “cap and trade.” The EPA is busy constructing a comprehensive system for reporting emissions of carbon dioxide and other greenhouse gases produced by major sources in the United States. This reporting system may provide the data for comprehensive regulation envisioned by cap and trade. SUMMARY Public choice theory views environmental pollution as an externality of human activity. Individuals, firms, and governments frequently impose unwanted costs on others. The environment, especially air and water, is a common-pool resource: access is unrestricted; there are no clearly defined property rights to it; no one has the individual responsibility of caring for it; individuals, firms, and governments tend to use it to carry off waste materials, thus generating unwanted costs or externalities on everyone else. The government has a legitimate
  • 28. interest in managing environmental externalities. Public choice theory offers valuable guidelines in dealing with them. 1.Economic growth is not incompatible with environmental protection. On the contrary, increases in wealth and advances in technology provide the best hope for a cleaner environment. 2.Effective pollution control and risk reduction must be balanced against its costs. Environmental policies whose costs exceed benefits will impair society’s ability to deal effectively with environmental problems. 3.The costs of removing additional environmental pollutants and risks rise as we approach zero tolerance. Total elimination of pollutants from air, water, or ground involves astronomical costs and wastes the resources of society. 4.Rational determination of benefits and costs requires scientific evidence. The deliberate rejection of scientific evidence on environmental issues, and the ideological or emotional inspiration to act even in the absence of scientific information, renders cost-effective policymaking impossible. 5.Traditional command and control approaches to environmental protection are less effective than market incentives. Legislatures and bureaucrats that endeavor to devise laws and regulations to reduce pollution are less effective than individuals, firms, and local governments with strong market incentives to reduce pollution in a cost-effective manner. 6.The air and water in the United States are significantly cleaner today than in 1970, when the first major environmental policies were enacted. Improvements in air and water quality have occurred despite growth in the population and growth in waste products. 7.Nonetheless, most Americans believe that pollution is growing worse. Interest group activity and media coverage of environmental “crises,” have pushed environmental issues to the forefront of American politics. Predictions of global doom create a climate of opinion that precludes rational analyses of the benefits and costs of environmental policies. 8.Current policy initiatives focus on sulfur dioxide and nitrogen
  • 29. oxide from coal-burning utilities, emissions of ozone and carbon monoxide from automobiles and stationary sources, and toxic air pollutants released from a wide variety of sources. 9.If firms were taxed on the basis of the pollutants they emit, a strong market incentive would be created for a reduction in pollution. A pollution tax would capture the externalities and force producers and consumers to incorporate the full environmental costs of products in the price. It would encourage polluters to find ways themselves to reduce pollution rather than simply comply with government regulations. Waste charges would encourage consumers to reduce their use of waste- producing goods. Dye, Thomas R. Understanding Public Policy Vitalsource eBook for Ashford University, 13th Edition. Pearson Learning Solution s. VitalBook file. Nordhaus, R. & Danish, K. W. (2005). Assessing the options for designing a mandatory U. S. greenhouse gas reduction program. Boston College Environmental Affairs Law Review, 32(1), 97-163. With the United States accounting for over one-fifth of global emissions of greenhouse gases, the U.S. government is facing pressures-from both domestic and international sources-to establish a comprehensive mandatory reduction program to address the risk of global climate change. If Congress decides to
  • 30. move forward with such a program, it could be creating an environmental regulatory regime of unprecedented scope and impact. Many policymakers are considering innovative market- based approaches to regulation, including a multibillion dollar economy-wide "cap-and-trade" program. The authors evaluate four models for a domestic program against a set of several criteria, including environmental effectiveness, cost, administrative feasibility, distributional equity, and political acceptability. INTRODUCTION Until now, U.S. climate change policy at the federal level has consisted of voluntary greenhouse gas (GHG) mitigation programs, research and development, and a subset of energy policies that focus on energy efficiency and renewable energy. However, the U.S. government is facing pressures-from both domestic and international sources-to establish a federal mandatory reduction program to address the risk of global climate change. If Congress decides to move forward with such a program, it could be creating an environmental regulatory regime of unprecedented scope and impact. Sources of greenhouse gases range from electric power plants to every car on the road. In addition, many policymakers are considering innovative market-based approaches to regulation, including a multi-billion dollar economy-wide cap-and-trade program. This Article identifies issues that must be addressed in the
  • 31. design of a mandatory domestic GHG reduction program. The Article then evaluates a number of proposals, including (1) comprehensive capand-trade programs; (2) a GHG tax; and (3) a "sectoral hybrid" program that combines elements of a cap-and- trade program with product efficiency standards for automobiles and consumer products. While there is a substantial body of opinion, particularly among economists, that an economy-wide cap-aiicl-trade or GHG tax program may be optimal from a cost-effectiveness point of view, it is possible that a GHG regulatory program will be developed from discrete familiar elements, such as existing Corporate Average Fuel Economy (CAFE) and appliance efficiency standards, plus large stationary source controls modeled on the acid-rain control program. Rather than creating a whole new system, Congress may choose the latter approach because of both familiarity and political sensitivity regarding program designs that result in overt increases in prices for gasoline and home heating fuels. We review the implications of these two fundamentally different approaches. While this Article focuses on options for federal regulatory policies, it is important to note that a domestic climate change program could enhance its regulatory policies with a range of non-regulatory measures, such as funding for research and development into new technologies, financial and other incentives, public education, and changes in infrastructure and
  • 32. land-use policies. In addition, state and local governments may supplement a federal regulatory program with their own policy initiatives.1 I. U.S. GREENHOUSE GAS EMISSIONS PROFILE Domestic climate change policy will likely focus on reductions or sequestration of emissions of six GHGs: carbon dioxide (CO2), methane (CH^sub 4^), nitrous oxide (N^sub 2^O), and what have been called the "synthetic gases," hydrofluorocarbons (HFCs), perfluorocarbons (PFCs), and sulfur hexafluoride (SF^sub 6^).2 Because GHGs have long lifetimes in the atmosphere, it matters little where or exactly when GHG emission reductions are made.3 For example, one ton emitted in the United States has the same impact as one ton emitted in Malaysia, and reducing one ton of GHG emissions now, rather than five years from now, will make little difference in atmospheric GHG concentrations in 2050.4 This means that an effective regulatory program can allow flexibility as to where emission reductions occur and substantial but not unlimited flexibility as to when they occur. Different GHGs vary as to their residence lives in the atmosphere and their heat-trapping, or "radiative forcing," effects.5 Some GHGs have very long atmospheric lifetimes.6 The Kyoto Protocol adopts a weighting formula called "Global Warming Potential" (GWP), which measures the impact of one
  • 33. ton of any GHG with reference to one ton of CO2.7 With such an agreed-upon "exchange rate," policymakers can develop a unitary program objective in terms of "CO2-equivalent" units, which allows regulated firms to pick whatever mix of reductions of different GHGs they believe is most cost-effective.8 A. Carbon Dioxide Carbon dioxide emissions, resulting almost entirely from combustion of fossil fuels, dominate GHG emissions in the United States and are likely to be among the principal initial targets of any domestic GHG regulatory program. In 2001, energy-related COo emissions accounted for approximately eighty-one percent of U.S. GWP-weighted emissions.9 Within the energy sector, the principal means of abating CO2 emissions are switching from energy sources with high carbon content to those with low or zero carbon content, such as renewables; improving the efficiency of energy conversion or use; reducing energy use; and developing carbon capture and sequestration technologies.10 Annual U.S. CO2 emissions also are affected by land use, land- use change, and forestry (LULUCF) activities.11 Plants and certain other biotic matter remove CO2 from the atmosphere and store or "sequester" it as carbon, at least temporarily, through the process of photosynthesis.12 Hence, forests and agricultural lands are "reservoirs" of carbon and a range of activities can enhance their sequestration potential.13
  • 34. Conversely, certain land use changes, such as deforestation, can oxidize the carbon stored in biotic matter, thereby leading to CO2 emissions.14 B. Other GHGs Methane is the second-largest contributor to U.S. GHG emissions, constituting 8.7% of total U.S. GWP-weighted emissions in 2001.15 Methane is emitted from landfills; natural gas and petroleum production, transportation, and processing; agricultural activities; coal mining; stationary and mobile combustion; wastewater treatment; and certain industrial processes.16 Nitrous oxide is a GHG with heat-trapping potential that exceeds that of COo by an order of magnitude.17 Emissions of nitrons oxide made up 6.1% of U.S. GWP-weighted emissions in 2001.18 The primary human activities resulting in emissions of nitrous oxide are agricultural soil management, fuel combustion in motor vehicles, and production processes for adipic and nitric acid.19 Emissions of HFCs and PFCs are primarily associated with their use as substitutes for ozone depleting substances banned under the Montreal Protocol treaty.20 Emissions of HFCs, PFCs, and SF^sub 6^ also result from certain other industrial processes, including production of primary aluminum, certain steps in the manufacture of products in the semiconductor industry, and activities related to the operation of electrical transmission and
  • 35. distribution equipment.21 These gases have very powerful heat- trapping effects.22 They constituted 1.6% of U.S. GWP- weighted emissions in 2001.23 C. U.S. GHG Emission Trends Eventual stabilization of atmospheric concentrations of GHGs will require very large reductions in GHG emissions worldwide. Notwithstanding a slight decline in 2001,24 U.S. emissions are projected to increase. As discussed above, U.S. emissions were 11.9% higher in 2001 than they were in 1990.25 Between 1990 and 2000, the GHG "intensity" of the U.S. economy-the ratio of total GHG emissions to economic output-declined by 17.5%.26 In a report submitted to the United Nations in 2002, the U.S. government projected that by 2020, U.S. GHG emissions will rise 42.7% from year-2000 levels.27 II. DOMESTIC CLIMATE POLICY FRAMEWORK The existing federal framework for addressing climate change in the United States is a combination of voluntary programs, tax incentives, energy efficiency standards, and research and development. These programs, and certain Clean Air Act provisions, are described below. A. Voluntary Prograins Since 1993, the federal government has established a number of voluntary GHG emission reduction programs to encourage businesses to undertake GHG mitigation actions. This approach began with the Clinton Administration's "Climate Change
  • 36. Action Plan" (CCAP).28 The Bush Administration has adopted a similar voluntary strategy.29 A key supporting element of both the Clinton and Bush Administrations' voluntary programs is the Department of Energy's (DOE) voluntary GHG reporting program under § 1605(b) of the Energy Policy Act of 1992.30 The § 1605(b) program authorizes DOE to develop a system to document voluntary GHG mitigation actions reported by firms and others participating in various voluntary programs.31 Electrie utilities, in particular, have reported numerous projects under the § 1605(b) program.32 While the various voluntary programs have led to a significant number of emission reduction projects, overall emission levels have continued to increase.33 Several factors have contributed to the limited effectiveness of voluntary programs.34 First, while some participants in these programs have committed to taking particular mitigation actions, they have not in many cases committed to limiting their company-wide emissions below a particular baseline; for many, total system emissions increased substantially in response to increased market demand for products and services.35 Second, some participants committed to actions that they might have implemented anyway for business reasons.36 In particular, commentators have asserted that the § 1605 (b) program lacks rigorous reporting standards and verification requirements, and concerns have been raised that some reductions reported under the program have
  • 37. been double-counted.37 The Bush Administration has pledged to address these shortcomings in a planned upgrade to the program to be completed by the end of 2004.38 However, any voluntary program remains subject to a fundamental limitation- it only addresses the emissions of those firms that volunteer to participate.39 For these reasons, current U.S. voluntary programs-while helpful in building awareness, encouraging experimentation, and achieving some company-level emission reductions-are not expected to reduce or even stabilize U.S. GHG emissions in the next decade relative to current levels.40 In addition to the voluntary GHG programs described above, the U.S. government has established a number of non-regulatory programs aimed at increasing energy efficiency.41 Because energy-related GHG emissions make up over eighty percent of total U.S. emissions, these programs contribute to reducing GHG emissions.42 However, like the voluntary GHG reduction programs, they do not impose actual limits on emissions and are incapable of achieving substantial emission reductions with a high degree of certainty.43 Finally, federal tax law provides a range of tax credits and other incentives to encourage use of renewable energy and fuel- efficient vehicles.44 These include: a deduction for a portion of the purchase cost of a "clean-fuel" vehicle, defined to include hybrids;45 a credit for the purchase of an electric vehicle;46 an
  • 38. investment credit for solar or geothermal energy equipment47 and favorable depreciation rates for such equipment;48 and a credit for production of electricity from wind, certain types of biomass, or poultry waste.49 Congress is considering a number of additional tax incentives and modifications to existing tax programs in the context of proposed federal energy legislation.50 B. Product Efficiency Standards 1. Corporate Average Fuel Economy Existing federal law includes two major mandatory energy efficiency programs: one for automobiles,51 and the other for consumer products other than automobiles.52 Both were established in 1975 under the Energy Policy and Conservation Act (EPCA).53 The program for motor vehicles-known as Corporate Average Fuel Economy or "CAFE"-requires each automobile manufacturer or importer to meet average fuel economy standards for the fleet of new vehicles it manufactures or imports in each model year.54 These standards are expressed in miles per gallon (mpg).55 Separate standards are set for passenger automobiles and "light-duty trucks"-including sport utility vehicles (SUVs) and minivans-currently at 27.5 mpg and 20.7 mpg respectively.56 The statute applies only to new vehicles and does not regulate inuse consumption of fuel.57 More stringent standards improve on-the-road fuel economy only to the extent that new vehicles
  • 39. replace less efficient existing vehicles.58 In addition, for new vehicles, if vehicle miles traveled (VMT) increase faster than average fuel economy, overall fuel use will go up notwithstanding the CAFE requirements.59 The statute contains a number of idiosyncratic features that increase its complexity, while decreasing its effectiveness.60 Trucks and SUVs are subject to far less stringent standards than cars.61 Compliance with the standard is determined separately for vehicles manufactured in the United States, Canada, or Mexico, and those vehicles manufactured elsewhere but used in the United States.62 Special credit is given to electric vehicles and to alternative fuel-capable vehicles.63 While the CAFE program made a significant contribution to moderating U.S. fuel use in the first years after its enactment, its impact has declined over time for a number of reasons.64 First, the standards were frozen for many years. Therefore, the standards have not taken into account the increasing proportions of truck, SUV, and niinivan sales. Starting in 2001, such "light- duty trucks" made up over fifty percent of vehicles sold.65 Congress's decision to freeze the standards throughout most of the 1990s, combined with the change in product mix, has had the effect of decreasing the ability of the program to moderate fuel use.66 Second, real gasoline prices have declined, encouraging more driving and dampening incentives for drivers to demand more efficient vehicles. Accordingly, even though
  • 40. fuel economy for cars has improved since the enactment of CAFE, overall fuel use-and, therefore, GHG emissions-has risen steadily.67 Of course, policymakers did not design CAFE as a domestic GHG regulatory program, and to function as one it would need not only to have the features noted above corrected-removing the freeze on more stringent standards and modifying the electric vehicle and alternative fuel credits68-but also the mpg standard would have to be translated into terms of pounds of CO2 per mile to take into account the carbon content of fuel.69 Additionally, as discussed below, a number of other changes would be needed to integrate such a program into a domestic cap-and-trade program for GHGs. 2. Appliance Standards EPCA also established an energy efficiency program for consumer products other than autos-usually referred to as the "appliance efficiency program."70 It includes mandatory energy labeling and energy efficiency standards for a wide range of consumer products, including air conditioners, washers, dryers, kitchen ranges, and furnaces.71 Standards also cover some equipment used in industrial applications, such as most industrial motors.72 According to DOE, the standards program has resulted in a greater than one quad reduction of en erg)' use annually, equivalent to roughly one percent of energy use or about seventy-five million tons of CO2.73 It aims at requiring
  • 41. for each type of consumer product the maximum energy efficiency that is technologically feasible and economically justified; but its complex regulatory framework makes prompt action to promulgate stringent new standards quite difficult.74 While the standards program in its present form could be used for GHG regulatory purposes, it would be better adapted to that purpose if the standards were expressed in the form of direct or indirect GHG emissions per unit of output, and if a trading feature could link it to GHG regulation in other sectors.75 C. Clean Air Act Aside from a requirement that electricity generators, who account for about one-third of U.S. GHG emissions, monitor and report their CO2 emissions, the Clean Air Act (CAA)76 does not directly address control of GHG emissions, much less explicitly authorize GHG regulation. The question of whether EPA has implied authority under the CAA to regulate GHGs-by virtue of its CAA authority to regulate "air pollutants"-is the subject of vigorous debate.77 This debate is beyond the scope of this Article, which contemplates action by Congress to establish a GHG regulatory program by statute, rather than action by EPA using its existing CAA authorities. Nevertheless, it is worth observing that the acid rain provisions of the CAA present a useful model for a cap-and-trade program applicable to CO2 emissions from electricity generators-which is one of the models for GHG
  • 42. regulation considered below.78 The acid rain program imposes a national limit on SOo emissions from electricity generators- currently set at 8.9 million tons per year-allocates allowances to existing sources to emit specified quantities of SO^sub 2^, and allows sources to trade and bank allowances, so that they can pursue least-cost compliance strategies.79 D. Options for a Domestic Program to Secure Greenhouse Gas Reductions While voluntary programs, the CAFE program, tax incentives, and product efficiency standards have contributed to reductions in GHGs that would not otherwise have occurred, they neither individually nor collectively are likely to achieve significant economy-wide reductions in GHG emissions from current levels.80 Substantial attention has been given to formulating and evaluating a range of alternative mechanisms for controlling U.S. GHG emissions.81 For example, several bills have been introduced that would establish a CO2 cap-and-trade program for electric utilities, modeled on the SO^sub 2^ program under Title IV of the CAA.82 In January 2003, Senators John McCain (R-AZ) and Joseph Lieberman (D-CT) introduced legislation that would establish an economy-wide GHG cap-and-trade program.83 In March 2004, a companion version of the McCain-Lieberman bill was introduced in the House.84 The principal options for a mandatory GHG reduction program,
  • 43. and the ones evaluated below, are: Cap-and-Trade: A comprehensive cap-and-trade program, similar in many respects to the acid rain program, that allocates or auctions a fixed number of tradable allowances to emitters and requires them to surrender allowances equal to their emissions in a particular compliance period-known as "downstream" cap-and-trade.85 A variant of this program requires firms to surrender allowances equal to the carbon content of the fuel and the GHG content of certain other products they sell each year-known as "upstream" cap-and- trade.86 GHG tax: A tax either on GHG emissions or on the carbon content of fuel and the GHG content of certain other products.87 Sectoral Hybrid: A program that combines a large-source cap- and-trade program with product efficiency standards, that is, standards for consumer products and equipment that prescribe emissions per unit of output-pounds of CO2 per mile, for example-or energy efficiency levels.88 This Article also discusses in general terms additional options such as stationary source emission standards, stand-alone product efficiency standards, and a stand-alone large-source cap-and-trade program. III. DESIGN CRITERIA FOR A DOMESTIC GHG REGULATORY PROGRAM
  • 44. Evaluating different GHG regulatory program options involves a number of considerations. The first design decision is establishing the program's emissions reduction objective. Once an emissions reduction objective is set, policymakers have to design a regulatory program to meet it. Key design criteria include environmental effectiveness, cost, administrative feasibility, distributional equity, and political acceptability. The sections that follow elaborate on each of these criteria. The emissions reduction target for a domestic program establishes the level and timing of reductions at the national level. The target can be set for purposes of compliance with an international obligation or could be established as a matter of domestic policy, independent of any international obligations. Moreover, it could take the form of a cap on domestic GHG emissions or a limit on GHG emissions per unit of output, also referred to as an "emissions intensity" target. It could establish a GHG reduction target for an initial compliance period, or it could establish a long-term emissions reduction path, phasing in progressively more stringent targets over an extended period of time. This Article does not address the issues of whether or how to set a target, or what target to set. Instead, it evaluates different designs for a program that will meet whatever target is decided upon.89 The criteria for evaluating design options are described below. A. Environmental Effectiveness: How Effective Is the Program
  • 45. in Meeting Its Emissions Reduction Target? A regulatory program's effectiveness in meeting its target is a function of a number of factors, including its coverage of sources throughout the economy, its certainty in meeting a particular emissions target, and its provisions for enforcement. 1. Coverage: Are All Sources and Gases Covered? A program's coverage refers to the extent to which it directly or indirectly regulates sources of GHG emissions throughout the U.S. economy and applies to the full range of GHGs. Broad coverage is preferable from an environmental perspective, but may have to be balanced by considerations of administrative cost. Compared to a program with full coverage, a program with only partial coverage either will reduce emissions less, or will attain the same emission reductions at much higher cost because it excludes opportunities for inexpensive reductions in uncovered sectors or gases. Programs with only partial coverage also risk "leakage."90 Leakage occurs when a regulatory program encourages shifting of emission-generating activities from regulated to non-regulated firms.91 2. Environmental Certainty: Will the Program Ensure That the Emissions Reduction Target Will Be Met? Some program designs provide greater certainty that total emissions from regulated firms will not exceed a particular level. For example, a "quantity-based" approach, such as a conventional cap-and-trade program, enforces an overall limit
  • 46. on emissions from the covered firms.92 By contrast, "price- based" approaches, such as emission taxes or trading programs with a safety valve, do not place a precise limit on total emissions, but instead impose a particular price or price limits per ton of emissions.93 While establishing an emissions charge or tax has the effect of reducing emissions, the approach does not ensure that emissions will be reduced to a precise level.94 In addition, as explained below, a standards approach that limits emissions per unit of output, as opposed to tons per year-often referred to as a "carbon intensity" approach-will not achieve a particular emissions reduction target with certainty.95 However, because it is cumulative rather than annual emissions that are important, taxes or standards should be able to provide almost equivalent environmental certainty if there is political will to adjust them over time. 3. Enforcement: Is the Program Enforceable? Any regulatory program's overall success in reducing emissions also is a function of its enforcement mechanisms. Enforcement is, in turn, a function of clear rules, precise and effective measurement of emissions, pursuit of violators, and having non- compliance penalties high enough to exceed any benefits associated with non-compliance.96 B. Cost-Effectiveness: Will the Program Design Allow Cost- Effective Compliance? A key consideration in evaluating a GHG regulatory program is
  • 47. whether it permits compliance with the program's target at the least cost to the U.S. economy-what is referred to as "cost- effective" compliance. The first cost-related issue is the direct cost of complying with the program. A program designed to meet a particular target minimizes compliance costs to the extent that it maximizes flexibility to adopt a least-cost compliance strategy-that is, flexibility as to what, where, and when emission reductions are attained. In addition, some program designs can cap compliance costs, but do so at the risk of missing the program's target. Another key cost-related consideration is administrative cost. Finally, some program designs raise revenue, which, as explained below, could be used to offset part of the overall cost of the program by reducing "distortionary" taxes on capital and labor. 1. Flexibility: Will the Program Provide Flexibility as to How, Where, and When Emission Reductions Are Attained? A cost-effective program will provide wide flexibility to regulated firms in determining how to reduce emissions to meet the program target ("what" flexibility), where to reduce them ("where" flexibility), and within limits, when to reduce them ("when" flexibility).97 "What" flexibility' implies that a firm can comply by implementing any of the full range of GHG mitigation measures, including increasing energy efficiency; switching fuels; reducing consumption; adopting LULUCF measures, including agriculture; or taking other action to reduce
  • 48. or sequester GHGs. Second, it implies that firms can comply through reductions in any of the major GHGs. Third, it implies that firms that can achieve low-cost reductions will undertake a greater proportion of emission reductions than firms that achieve reductions at higher costs. Many different kinds of firms and activities generate emissions of different GHGs; their costs of reducing those emissions and the means of reduction available to them vary widely. A program with maximum "what" flexibility has the effect of equating marginal costs of mitigation across all firms subject to the program, thereby generating the lowest-cost distribution of abatement activities throughout the economy.98 The other critical benefit of building "what" flexibility into the U.S. climate policy architecture from the beginning is that it spurs technological innovation. Achieving the long-term aim of stabilizing atmospheric concentrations will not be possible without the development and widespread deployment of a range of next-generation approaches to climate protection, including new clean energy technologies. Policy approaches that prescribe the use of particular technologies, such as design standards, provide little incentive for developing such next-generation approaches. By contrast, approaches that specify environmental outcomes or place a price on environmental damage without prescribing the means of compliance can stimulate the kind of innovation that ultimately will be needed to achieve deeper
  • 49. emission reductions over time. "Where" flexibility implies that the program will recognize reductions achieved throughout the world. A domestic GHG program that is integrated with the emerging international market in GHG emission reductions almost certainly will have lower compliance costs than a program that credits only reductions made within the United States.99 Studies have suggested that opening up a U.S. climate program to trading even with just the industrialized countries that are subject to Kyoto Protocol emission limits could reduce a U.S. program's marginal abatement cost by anywhere between thirteen percent and sixty-eight percent.100 Gains from trade would be far greater if the U.S. program credited reductions achieved in developing countries, where low-cost abatement options are in abundant supply.101 For these reasons, the ultimate cost of a U.S. climate change program will depend in great measure on the extent to which it provides for international emissions trading. "When" flexibility provides the regulated firm with choices as to the timing of emission reductions. Even before the regulatory program becomes binding, policymakers can establish a "credit for early action" policy to assure firms that any pre-program efforts to reduce emissions will be recognized. Such early reduction efforts would have the same environmental value as reductions made after the regulatory program has
  • 50. commenced.102 Policymakers also can set an ultimate compliance deadline for the regulatory program that gives firms sufficient lead time to develop cost-effective control strategies and that allows a market for emission reductions to evolve. Further, in establishing a program's emissions target, consideration can be given to determining compliance on the basis of a multi-year emissions average, rather than the level of emissions in a single year. A multi-year approach gives firms the flexibility to manage their emissions over time and avoids penalizing them for emission changes caused by difficult-to- control fluctuations in business cycles and weather. Other "when" flexibility measures include "banking" and "borrowing."103 Programs can be designed so that firms that over-comply can "bank" emission credits and use them in a subsequent compliance period or sell them at a later date when prices in the trading market might be higher. A "borrowing" provision would allow a firm to comply with its obligations in one compliance period in part by committing to even deeper- than-required reductions in the subsequent compliance period. With a limited borrowing provision, a regulatory program could obtain a greater overall level of emission reductions from those firms that could benefit from additional time to modify their operations or invest in new technologies. A multi-year compliance period approach would offer similar temporal flexibility as a borrowing provision. A firm's ability to borrow
  • 51. has to be limited, however, lest it become a means of simply avoiding reductions. 2. Cost Predictability: Are Costs of Compliance Reasonably Predictable? A regulatory program also can be designed so that total compliance costs are capped.104 As discussed above, "price- based" approaches, such as emission taxes, do not provide assurances that a particular level of emission reductions will be achieved. On the other hand, such programs do provide assurances that the costs of compliance will not rise above a particular per-ton level. This kind of certainty about costs generally is not possible with a quantity-based program, such as a traditional cap-and-trade program, where it is implied that the quantitative limit on emissions will be enforced regardless of compliance costs. To address the risk of spiraling compliance costs associated with a cap-andtrade program, some have proposed a "safety valve" mechanism, in which additional allowances would be made available at a pre-set price representing the maximum acceptable cost.105 3. Raising Revenue: Will the Program Raise Revenues That Can Be Used to Offset a Portion of Its Costs? Some program designs that raise revenue, such as GHG taxes or allowance auctions, offer an opportunity to offset economic costs of the program borne by particular sectors through financial assistance programs or reduce the overall cost of the
  • 52. program through a reduction in federal taxes.106 Economic analysis indicates that programs that recycle the revenue to reduce distortionary taxes on capital, labor, or income have significant potential to reduce overall costs of a GHG regulatory program to the economy.107 However, it may prove politically difficult to implement tax cuts that increase economic efficiency. The revenues raised could just as easily be spent on activities that reduce or have no impact on economic efficiency as on activities that improve it. 4. Long-Term Incentives: Will the Program Induce Key Sectors to Begin Investing in Low-Emission Technologies and Practices? Most climate change analysts agree that moderating the increase in atmospheric concentrations of GHGs ultimately will require a substantial transformation in the way that industrialized countries like the United States produce and use energy.108 Near-term policy choices will have a major impact on the cost of such a long-term effort. The reason is that energy-producing and energy-using technologies involve long-term capital investments that are not readily converted to other uses. Therefore, a domestic program needs to send a credible long- term signal to key sectors of the economy that encourages a shift toward lower-carbon technologies and lower-emitting practices. A domestic program that leaves certain sectors uncovered could result in those sectors "locking in" higher-
  • 53. emitting technologies and practices, potentially increasing the cost of achieving more substantial economy-wide GHG reductions in the future.109 C. Administrative Feasibility: Can the Program Be Administered and Docs It Minimize Administrative and Transaction Costs? A key consideration in designing any regulatory program is whether it is feasible to administer. A program that is infeasible to administer will be both environmentally ineffective and economically inefficient. One key feasibility consideration is minimizing administrative costs-including the costs of designing the program and the costs of implementing it, both for the regulated firm, which must bear reporting or other costs, and for the regulator. Administrative costs are a function of the number of regulated firms, the availability of needed data about those firms, and the complexity of the regulatory program.110 In addition, program designs that build upon existing and familiar programs will impose smaller implementation costs and less difficulty for the regulator and the firms to be regulated than programs that represent a new departure. Finally, in designing market-based regulatory programs, careful attention needs to be given to avoiding unnecessary program complexities and uncertainties that run up participants' transaction costs.111 Another particularly important administrative criterion for a climate change policy is adaptability, given the necessary
  • 54. duration of any effort to stabilize concentrations of GHGs in the atmosphere. A U.S. climate change policy framework needs to be able to evolve over time to accommodate adjustments in the emission reduction commitments as new information becomes available and as the U.S. economy changes. In addition, because stabilization of GHG concentrations ultimately will require global efforts, the policy framework will have to be flexible enough to provide for coordination with other countries. D. Distributional Equity: Is the Burden of Compliance with the Program Fairly Apportioned ? Another consideration in designing a regulatory program is how its costs are distributed across society.112 Even the most cost- effective program design may be unacceptable if its costs are distributed in such a way that is perceived to be unfair. All other things being equal, a regulatory program that aims to reduce GHG emissions will tend to impose its largest costs on firms and households that produce fossil fuels or are heavily dependent on them.113 A GHG regulatory program also will tend to be relatively more costly for low-income individuals because they spend a greater proportion of their total income on energy.114 Some regulatory programs provide opportunities for modifying these distributional impacts. For example, in an emissions trading program, the government could allocate allowances on a cost-free basis to firms that would bear the brunt of regulatory
  • 55. compliance costs. Alternatively, the government could auction allowances and use the revenue to compensate those particularly burdened by the regulatory program through targeted tax breaks or lump-sum payments. Emission tax programs hold similar revenue recycling potential. E. Political Acceptability: Are There Elements of Program Design that Affect Its Political Acceptability ? Program designs that promise relatively greater environmental effectiveness, lower costs, and a more equitable distribution of regulatory burdens will be more likely to obtain political support than other designs. However, the U.S. experience with environmental and energy policy suggests that other factors also affect a program's political acceptability. Indeed, considerations of political acceptability may lead policymakers away from what could otherwise be an optimal program design with respect to environmental effectiveness, cost, and equity.115 For example, twenty-five years of environmental and energy policy experience suggests that it is difficult to gain public support for a program that relies principally on direct increases in the price of energy-either through taxes or regulatory measures-even where such a program arguably is more cost- effective or will result in a more equitable distribution of regulatory burdens than other approaches.116 Even in times of most compelling national circumstances, such as the 1973 Arab oil embargo, Congress was unwilling to vise energy price
  • 56. increases to rein in consumer demand.117 On the other hand, program designs involving emissions trading or emission charges offer the opportunity to develop what may be a politically attractive policy package-using the revenue raised from regulation of GHG emissions as a basis for reducing taxes on income.118 IV. EVALUATING DIFFERENT APPROACHES TO REGULATING DOMESTIC GHG EMISSIONS Using the criteria developed above, we evaluate three principal approaches to regulating domestic GHG emissions: (1) an emissions trading-or cap-and-trade-program; (2) a GHG tax program; or (3) a sectoral hybrid program combining a large- source cap-and-trade program with product efficiency standards. Each approach presents its own design choices, For example, a cap-and-trade program could be upstream or downstream. A. Emission Trading (Cap-and-Trade) Programs 1. Overview of Emission Trading Programs A conventional cap-and-trade program establishes an economy- wide or sectoral "cap" on emissions in terms of tons per year or other compliance period, and allocates or auctions tradable allowances, such as the right to emit one ton of GHGs, to GHG emission sources or to fuel suppliers.119 The total number of allowances is equal to the cap. A downstream cap-and-trade program applies to sources of GHG emissions and requires them to surrender allowances equal to their emissions.120 An
  • 57. upstream program applies to fuel suppliers and requires them to surrender allowances equivalent to the carbon content of fossil fuels they supply.121 Cap-and-trade programs are best suited to regulation of emission sources that can be readily measured and monitored, hi the GHG context, such sources include almost all sources of CO2 emissions from fossil-fuel combustion as well as many sources of other GHG emissions.122 Other types of sources can be regulated on an "opt in" or project basis, or through supplemental regulation.123 The trading feature of a cap-and-trade program authorizes regulated firms-and anyone else-to buy, sell, or hold allowances. In a well-functioning emissions trading market, allowances will end up distributed among firms that need them in a way that minimizes the cost of reducing emissions. For example, in a conventional downstream cap-and-trade program, firms subject to the program buy allowances if their costs of reducing emissions-referred to as their costs of "abatement"-exceed the allowance price.124 Firms sell allowances if their abatement costs are lower than the allowance price.125 Trades continue in this way until firms are indifferent between buying and selling allowances-or, in other words, between abating one more ton of CO2 or emitting an additional ton.126 At this point, the program has equalized marginal abatement costs across the economy, and, in theory, the final distribution of allowances and abatement throughout the economy reflects the least-cost
  • 58. outcome.127 A GHG emissions trading program could incorporate all forms of "what," "where," and "when" flexibility, discussed above. Each firm affected by a GHG emissions trading program could reduce its need for allowances or exposure to higher energy costs by adopting its lowest-cost means of abatement. Firms also would have an incentive to develop new technologies or practices to reduce emissions or increase their energy efficiency. A U.S. domestic cap-and-trade program also could be integrated with emerging cap-and-trade programs in other countries and, if the parties so provided, with an international regime such as the Kyoto Protocol.128 A cap-and-trade program can be extended beyond energy-related sources of CO2 emissions by directly regulating: (1) sources of nonCO2 GHGs and/or (2) LULUCF activities that emit or remove CO2. Some GHG sources and sinks, however, may not be amenable to regulation through such an approach because their emissions may be too difficult to measure for purposes of setting a cap and allocating allowances, or to monitor for purposes of enforcement. In some cases, these sources and sinks could be incorporated into the cap-and-trade program on a project-by-project basis, known as "project-based crediting." Under project-based crediting, a firm could earn emission credits by undertaking a climate change mitigation project at a source or sink not