Download as PDF, PPTX


![01. Mapping Tools
[Affinity Diagram]](https://image.slidesharecdn.com/10dtobservation-151115225553-lva1-app6891/75/10-dt-observation-15-2048.jpg)

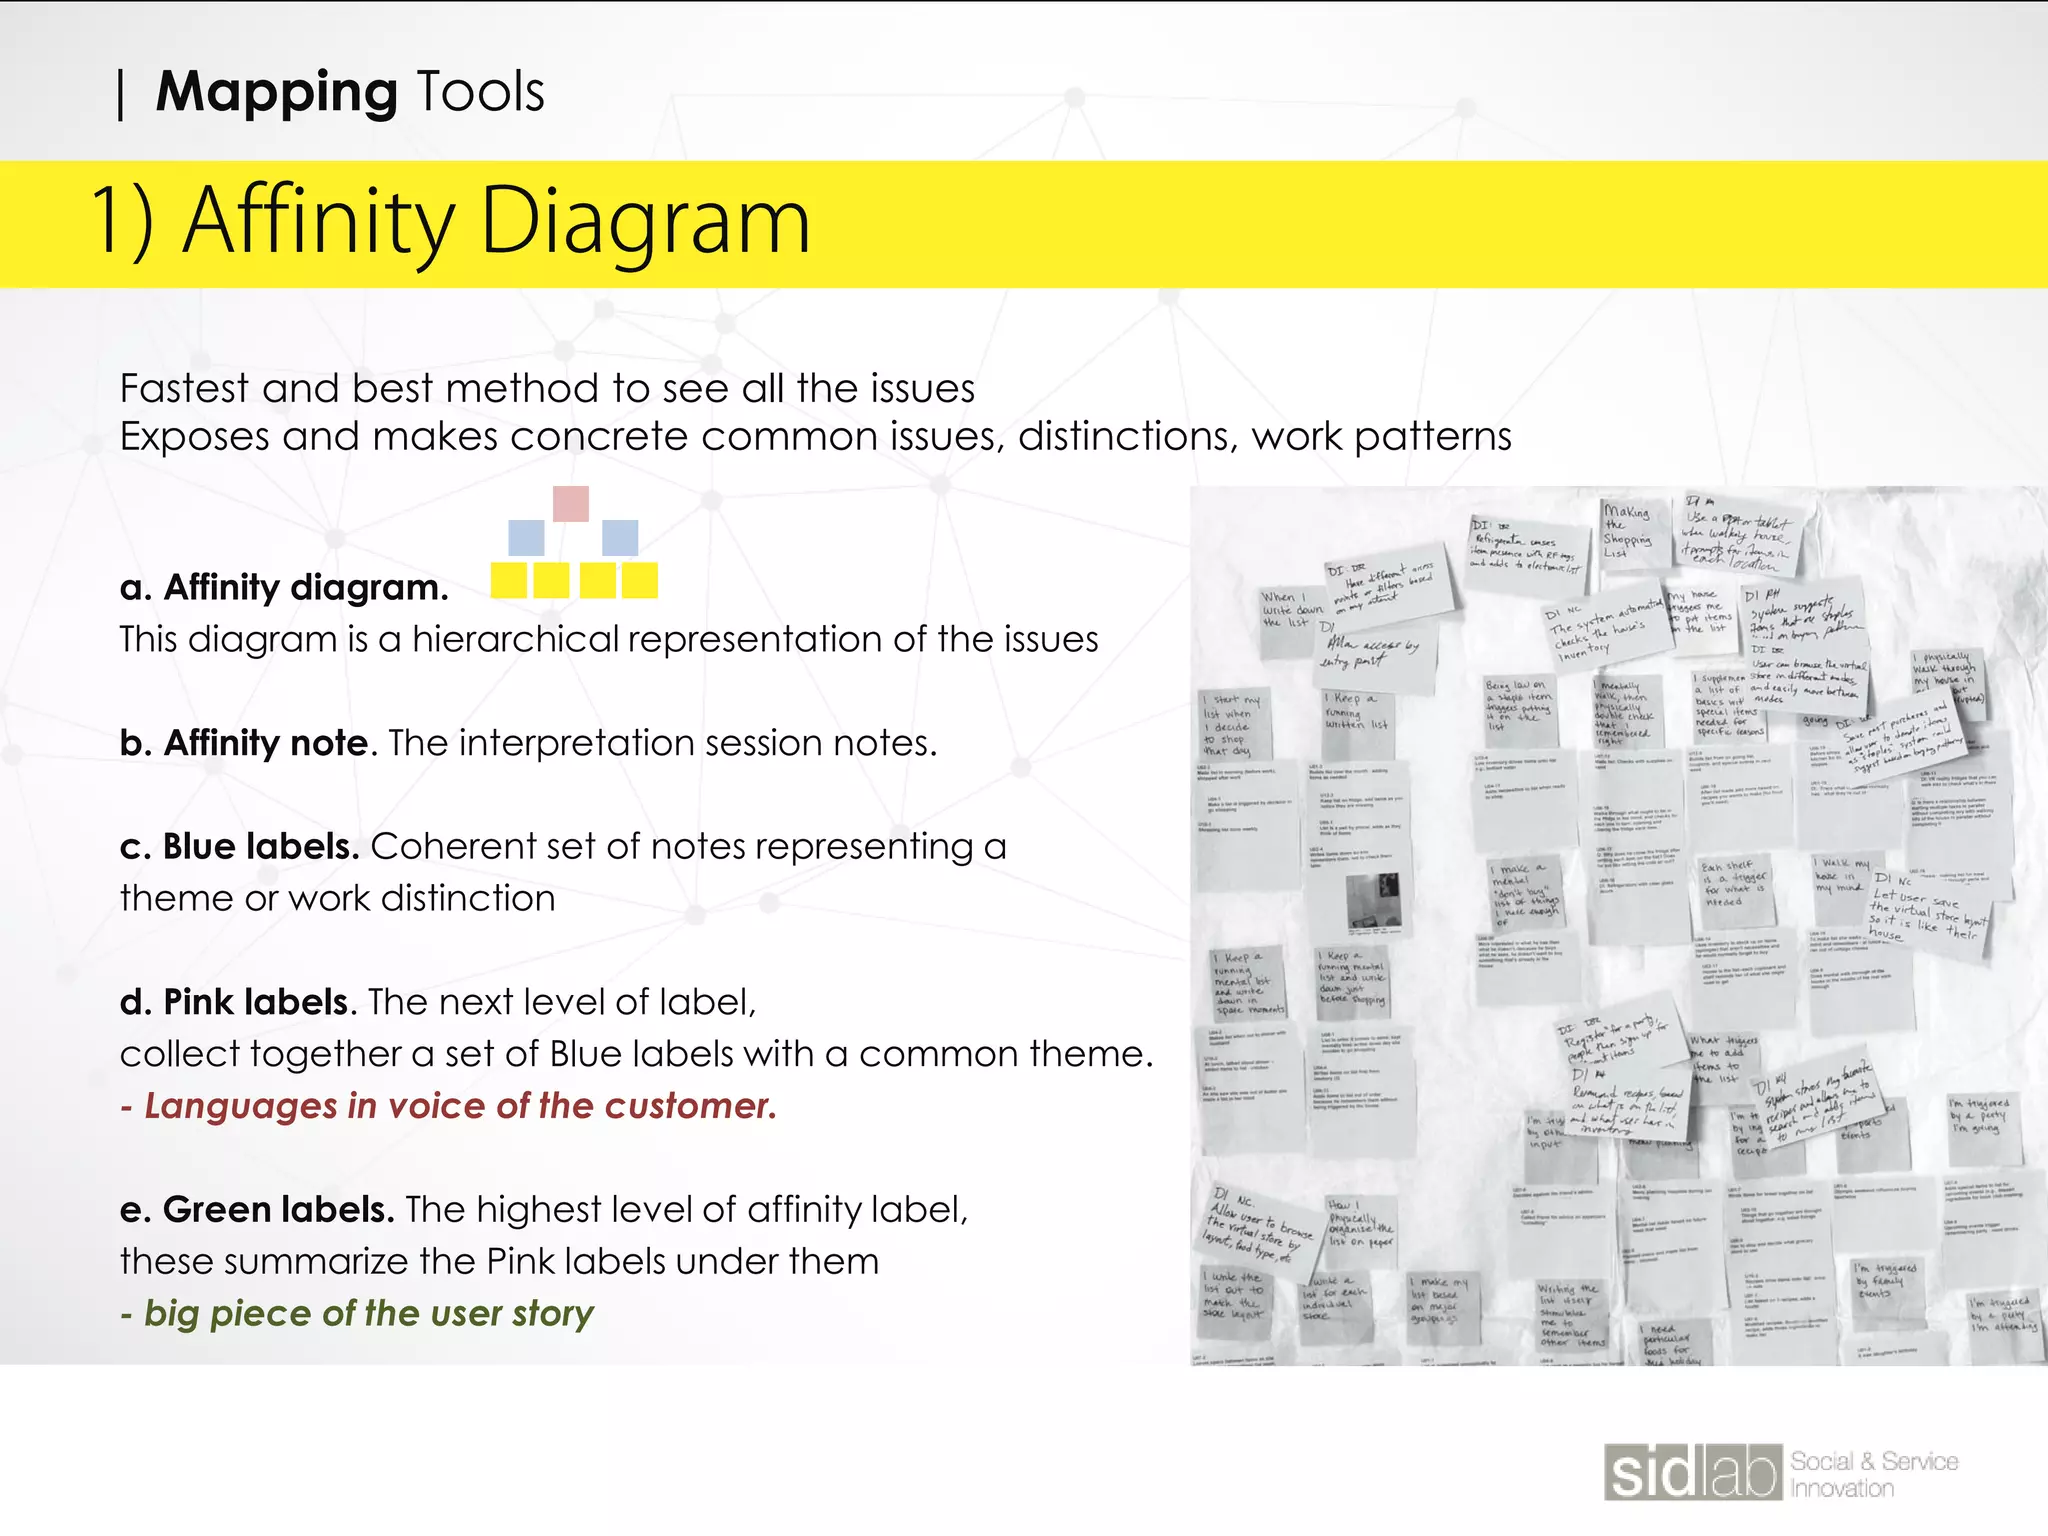


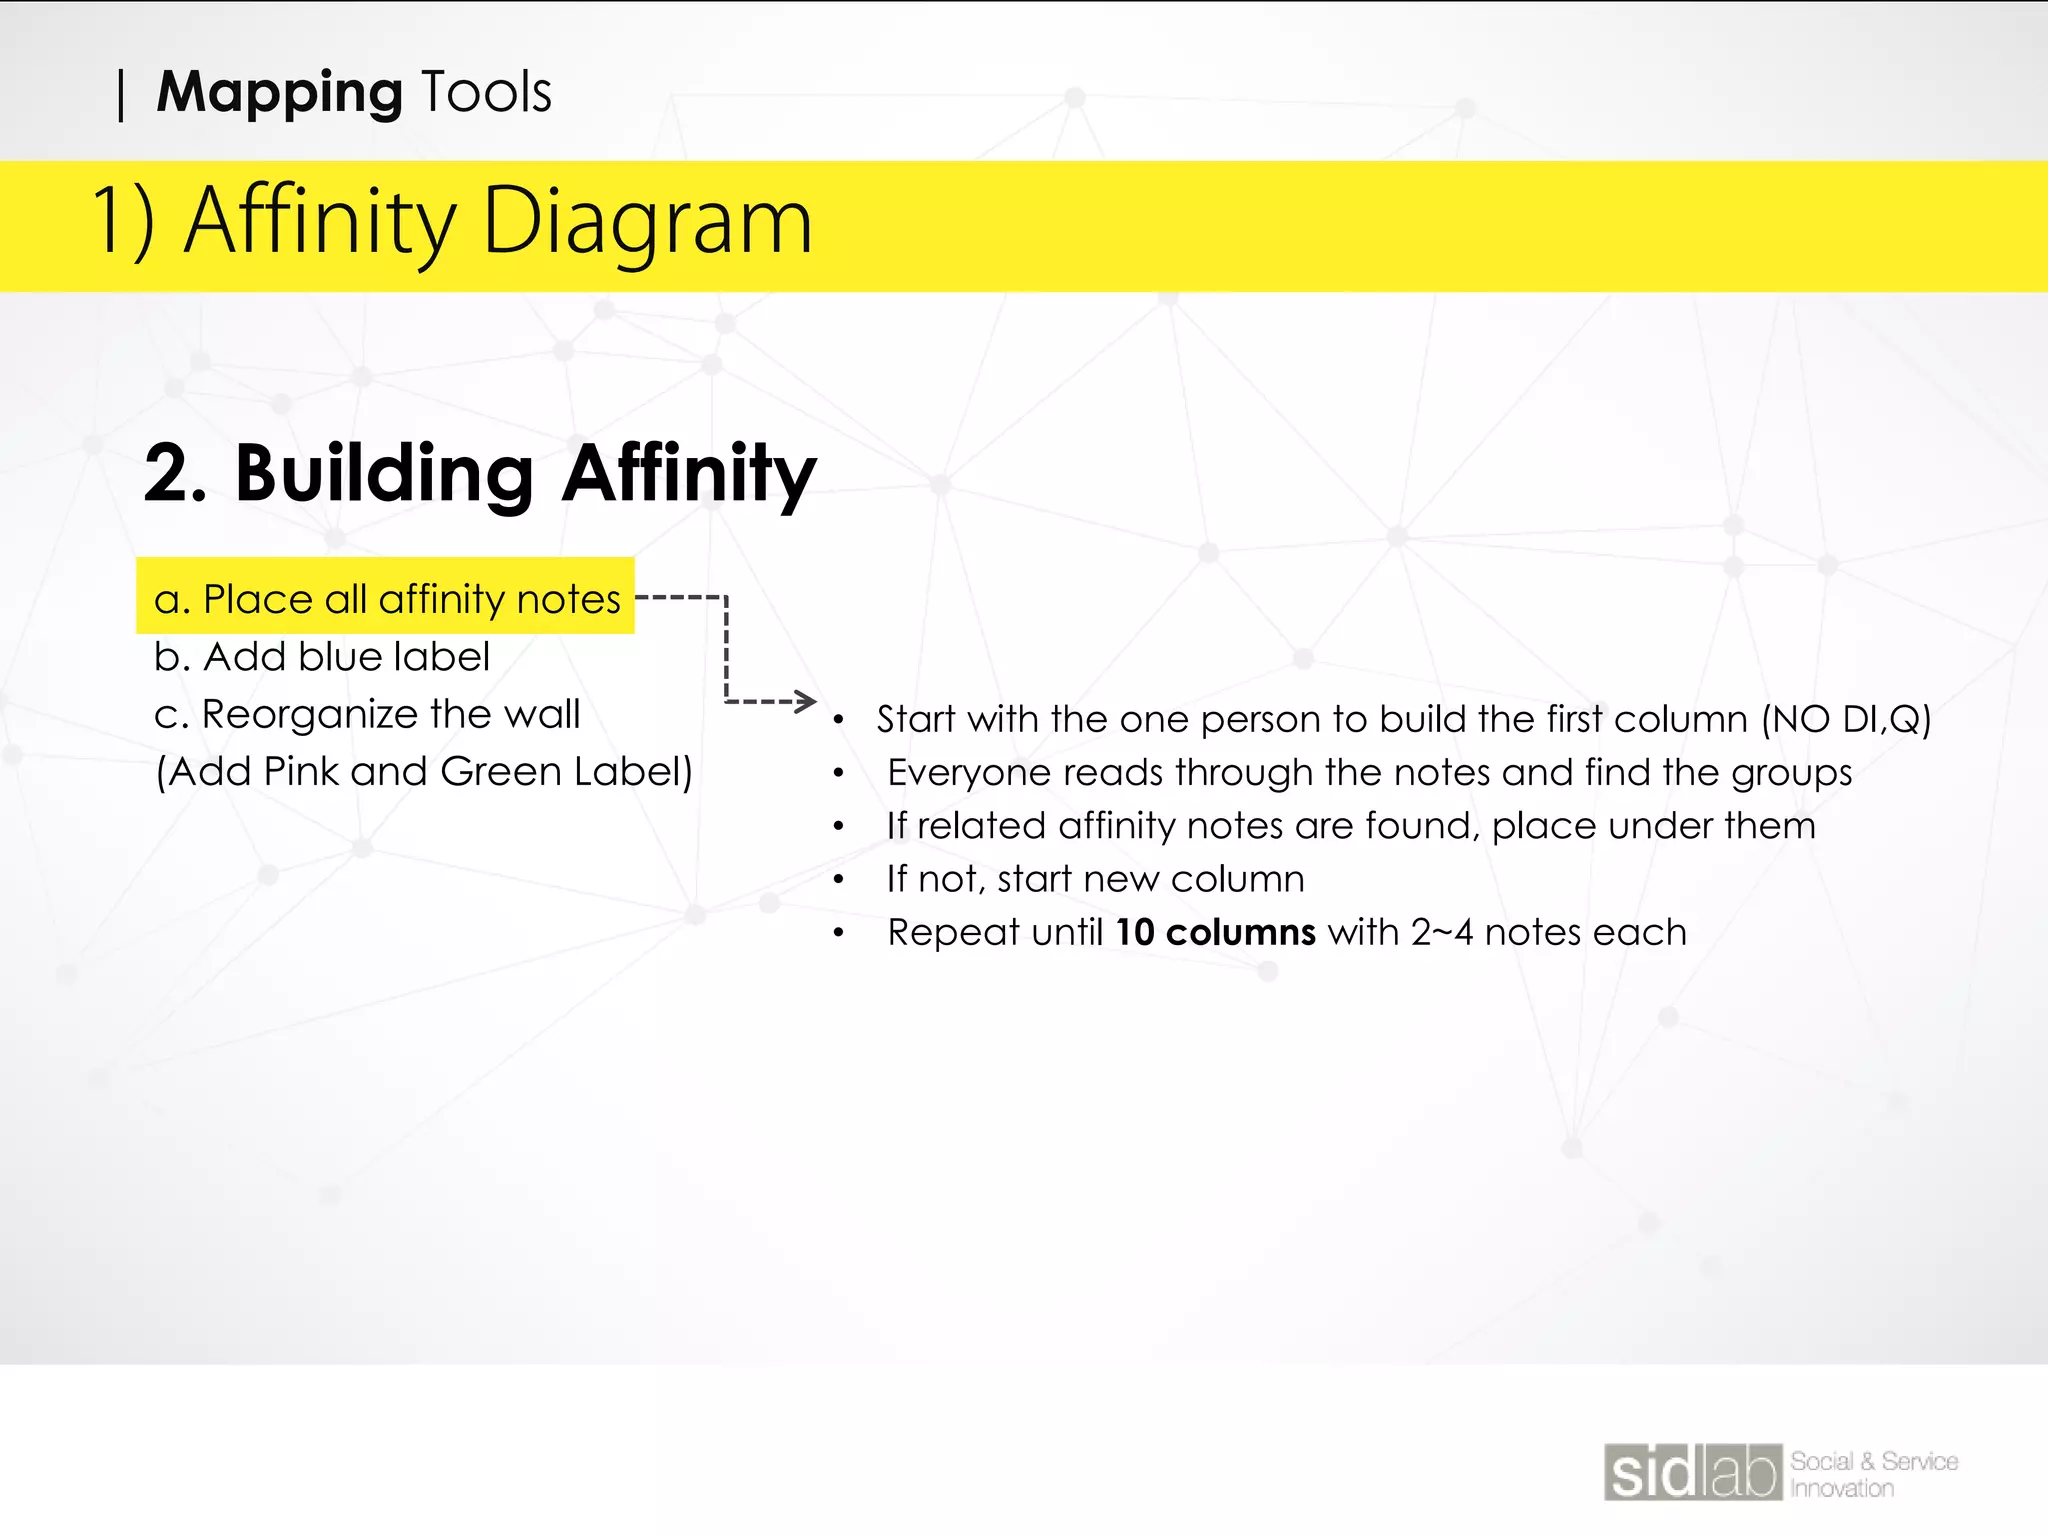
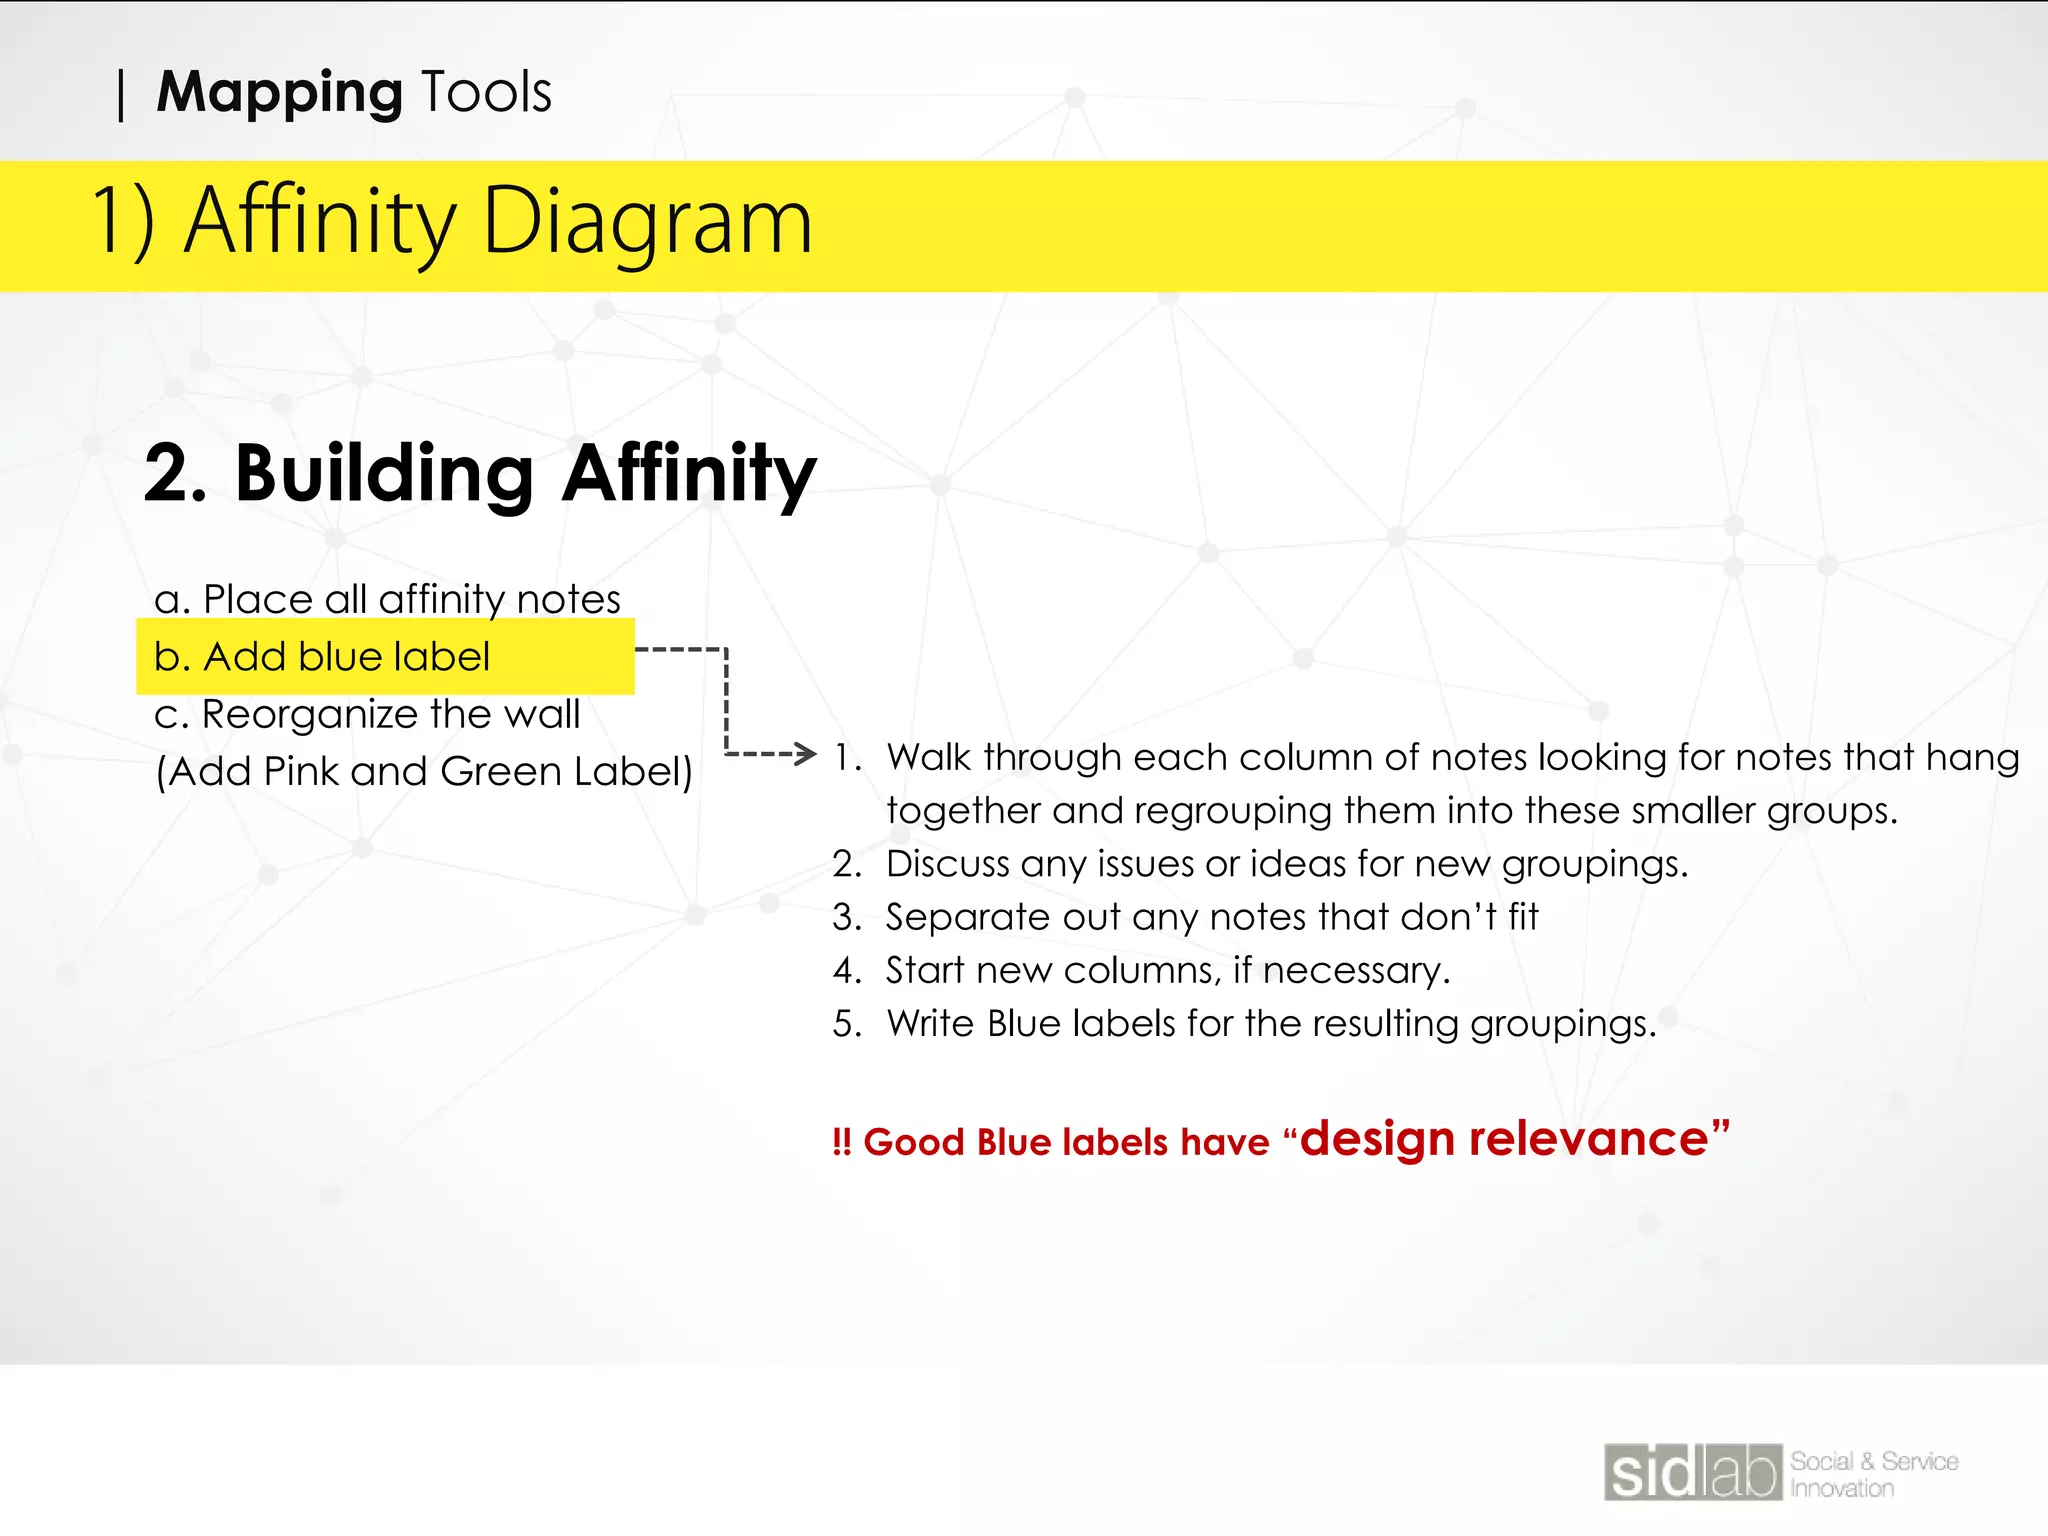

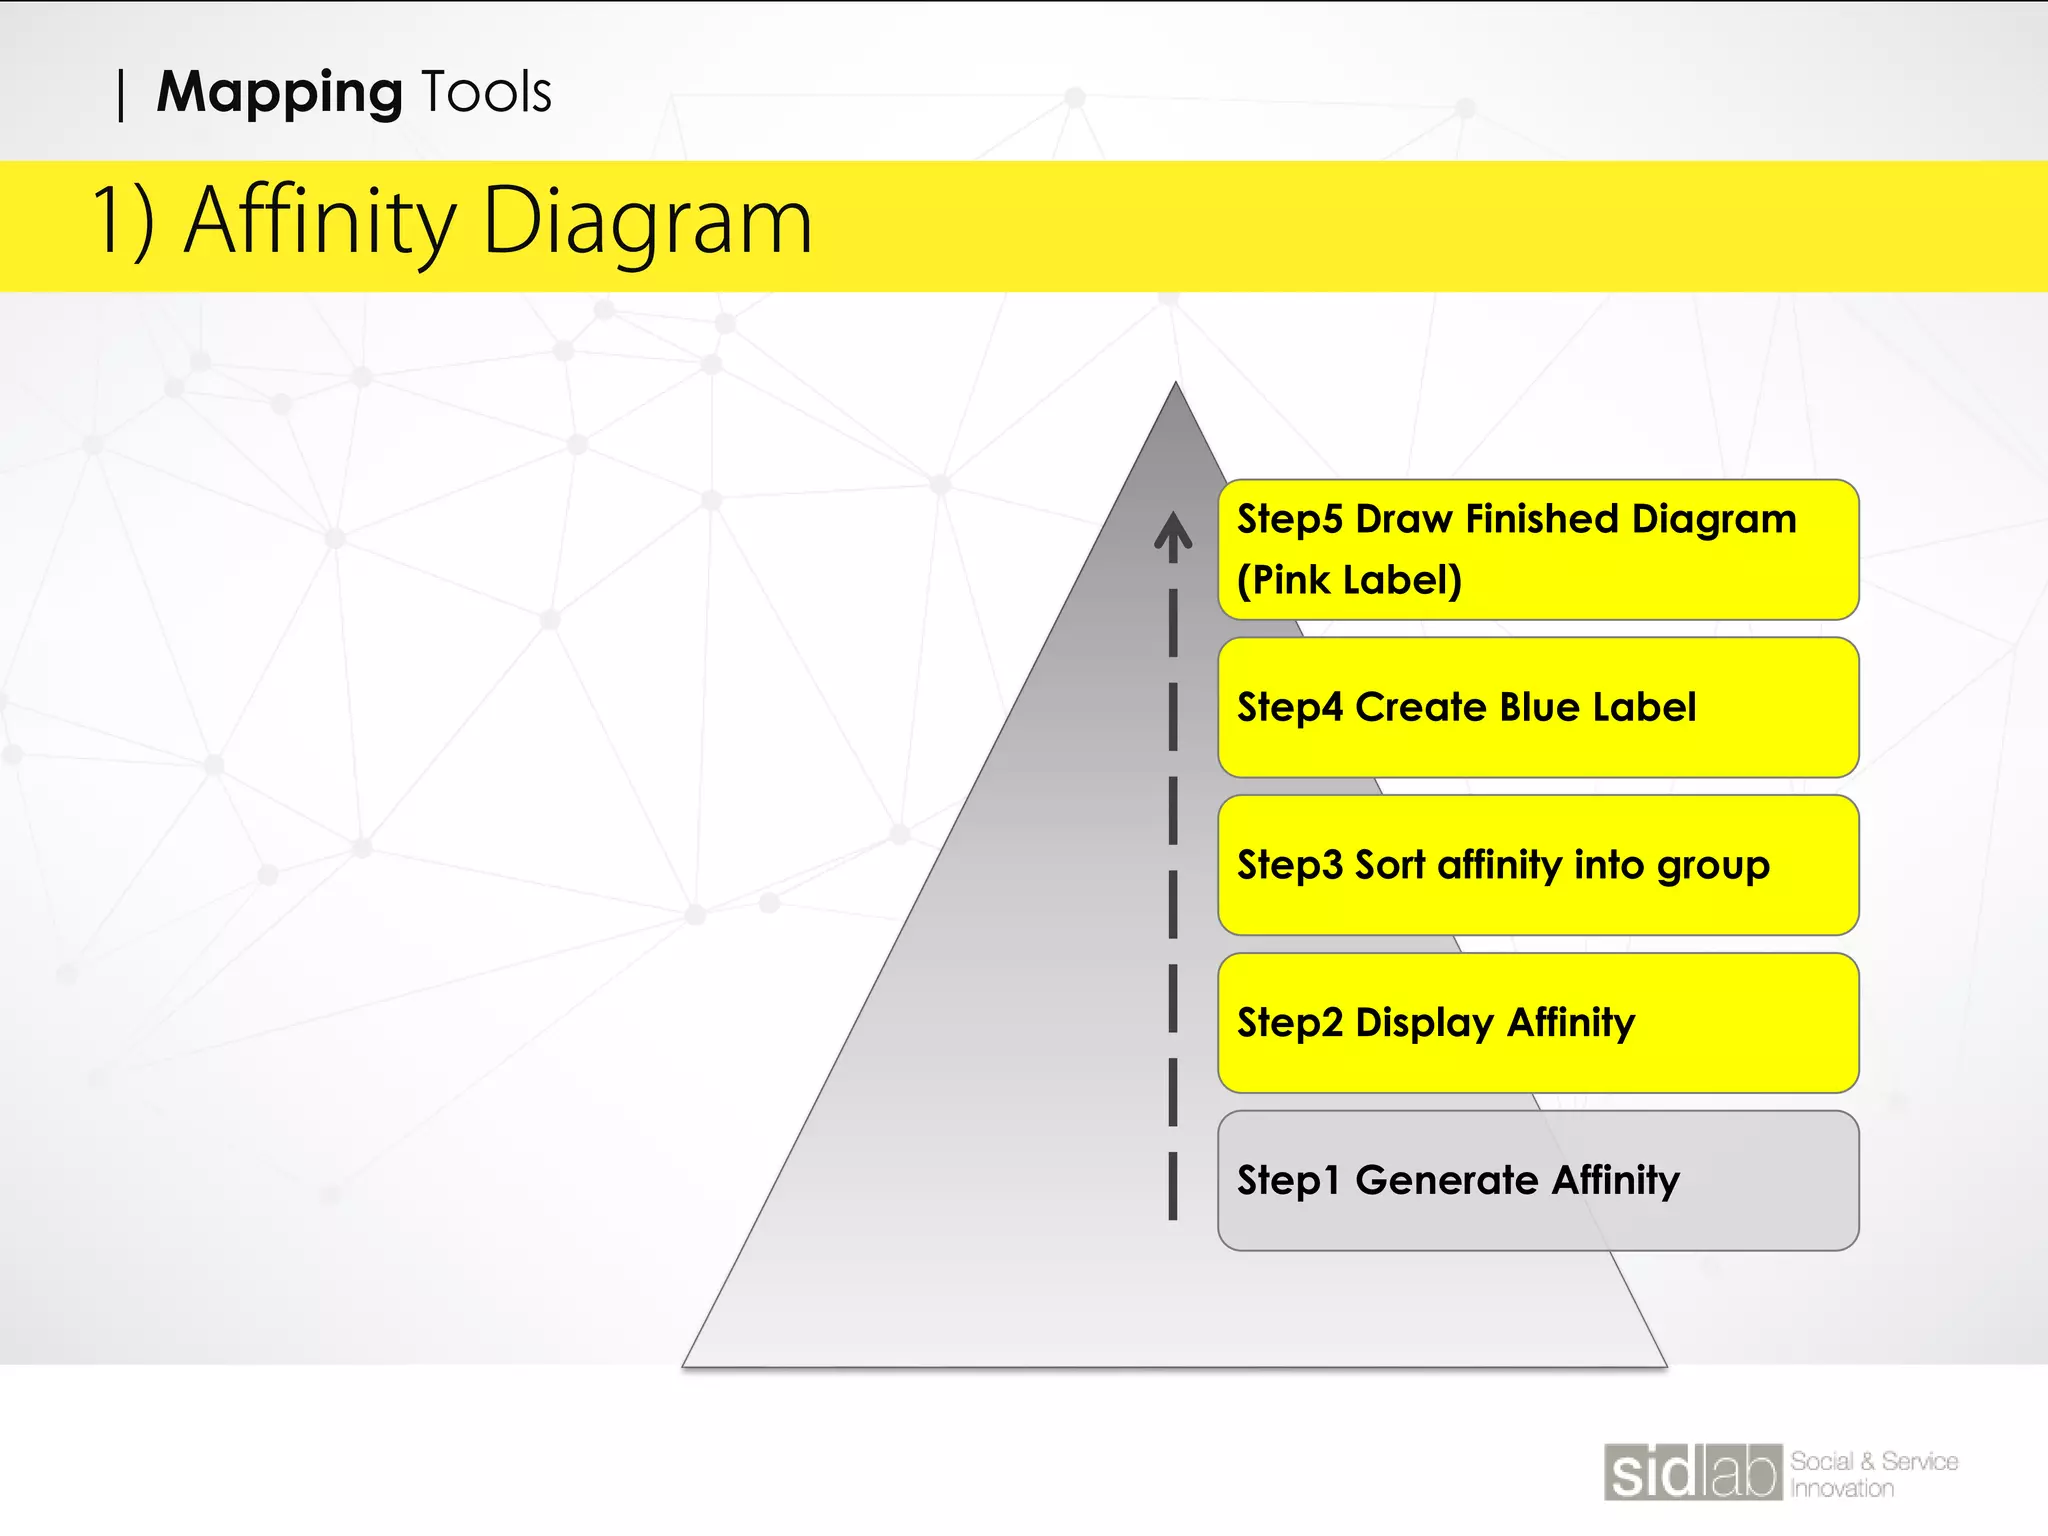

The affinity diagram process involves gathering insights from interviews and organizing them into groups based on their natural relationships. Notes are written on individual cards then sorted into columns based on common themes, with blue labels assigned to each column. Pink labels are then created to group the blue labels together under higher-level themes. This process exposes patterns and common issues that emerge from the raw data. The organized groups can then be used to generate insights about user needs and experiences.


![[EWD2014]CLASS10](https://cdn.slidesharecdn.com/ss_thumbnails/ewdclass10-140513011233-phpapp02-thumbnail.jpg?width=640&height=640&fit=bounds)

![[Trends]14 trend researchiv](https://cdn.slidesharecdn.com/ss_thumbnails/trends14trendresearchiv-160614031250-thumbnail.jpg?width=640&height=640&fit=bounds)


![[Imr]week5](https://cdn.slidesharecdn.com/ss_thumbnails/imrweek5-120403034314-phpapp01-thumbnail.jpg?width=640&height=640&fit=bounds)


![[Info14] information design iii](https://cdn.slidesharecdn.com/ss_thumbnails/info14informationdesigniii-160614024004-thumbnail.jpg?width=640&height=640&fit=bounds)
![[Trends]13 trend researchiii_](https://cdn.slidesharecdn.com/ss_thumbnails/trends13trendresearchiii-160602133740-thumbnail.jpg?width=640&height=640&fit=bounds)
![[Info13] information design](https://cdn.slidesharecdn.com/ss_thumbnails/info13informationdesign-160602133731-thumbnail.jpg?width=640&height=640&fit=bounds)
![[Trends]12 trend researchii_](https://cdn.slidesharecdn.com/ss_thumbnails/trends12trendresearchii-160530114615-thumbnail.jpg?width=640&height=640&fit=bounds)
![[Info12] information design](https://cdn.slidesharecdn.com/ss_thumbnails/info12informationdesign-160524121253-thumbnail.jpg?width=640&height=640&fit=bounds)
![[Trends]10 trend research__](https://cdn.slidesharecdn.com/ss_thumbnails/trends10trendresearch-160523042337-thumbnail.jpg?width=640&height=640&fit=bounds)
![[Trends]09 consumer trends](https://cdn.slidesharecdn.com/ss_thumbnails/trends09consumertrends-160512085707-thumbnail.jpg?width=640&height=640&fit=bounds)
![[Info10]visual leaderii](https://cdn.slidesharecdn.com/ss_thumbnails/info10visualleaderii-160512085340-thumbnail.jpg?width=640&height=640&fit=bounds)
![[Info09]visual leaderi 은유와모델](https://cdn.slidesharecdn.com/ss_thumbnails/info09visualleaderi-160509054018-thumbnail.jpg?width=640&height=640&fit=bounds)
![[Trends]06 tech trends](https://cdn.slidesharecdn.com/ss_thumbnails/trends06techtrends-160412141839-thumbnail.jpg?width=640&height=640&fit=bounds)
![[Info06]graphical thinking](https://cdn.slidesharecdn.com/ss_thumbnails/info06graphicalthinking-160412141441-thumbnail.jpg?width=640&height=640&fit=bounds)
![[Info05]visual thinking iv](https://cdn.slidesharecdn.com/ss_thumbnails/info05visualthinkingiv-160405140605-thumbnail.jpg?width=640&height=640&fit=bounds)
![[Trends]05 macro trends 01](https://cdn.slidesharecdn.com/ss_thumbnails/trends05macrotrendsi-160405140347-thumbnail.jpg?width=640&height=640&fit=bounds)
![[Trends]04 mega trendsii](https://cdn.slidesharecdn.com/ss_thumbnails/trends04megatrendsii-160331140113-thumbnail.jpg?width=640&height=640&fit=bounds)
![[Info04]visual thinkingiii](https://cdn.slidesharecdn.com/ss_thumbnails/info04visualthinkingiii-160331135845-thumbnail.jpg?width=640&height=640&fit=bounds)
![[Trends]03 mega trends](https://cdn.slidesharecdn.com/ss_thumbnails/trends03megatrends-160325072540-thumbnail.jpg?width=640&height=640&fit=bounds)
![[Info03]visual thinkingii](https://cdn.slidesharecdn.com/ss_thumbnails/info03visualthinkingii-160325072507-thumbnail.jpg?width=640&height=640&fit=bounds)
![[Trends]02 terms](https://cdn.slidesharecdn.com/ss_thumbnails/trends02terms-160317053328-thumbnail.jpg?width=640&height=640&fit=bounds)
![[Info02]visual thinking](https://cdn.slidesharecdn.com/ss_thumbnails/info02visualthinking-160317053318-thumbnail.jpg?width=640&height=640&fit=bounds)
![[IRU2016]CLASS02_SCIENTIFIC RESEARCH](https://cdn.slidesharecdn.com/ss_thumbnails/iruweek02-160311061936-thumbnail.jpg?width=640&height=640&fit=bounds)


![Chapter4_Initiation_of_Sediment_Motion_v2[1].pptx](https://cdn.slidesharecdn.com/ss_thumbnails/chapter4initiationofsedimentmotionv21-251208223747-f94ef163-thumbnail.jpg?width=640&height=640&fit=bounds)


