SlideShare a Scribd company logo
1 of 14
Download to read offline
10 Best Technical Indicators List |
Trend Indicators
https://pivotstocks.com/
Trading in the financial markets requires a deep understanding of various tools
and techniques that can help traders make informed decisions. One such set of
tools is technical indicators, which are widely used to analyze price movements,
identify trends, and generate trading signals. In this article, we will explore some
of the most trending technical indicators used by traders worldwide. So, let’s dive
in and uncover the power of these indicators in shaping successful trading
strategies.
Introduction to Technical Indicators
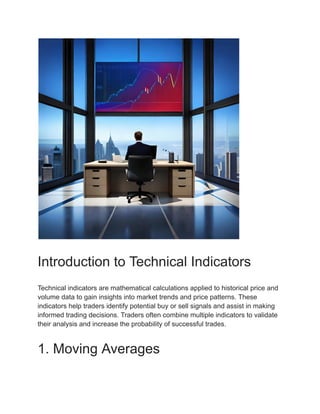
Technical indicators are mathematical calculations applied to historical price and
volume data to gain insights into market trends and price patterns. These
indicators help traders identify potential buy or sell signals and assist in making
informed trading decisions. Traders often combine multiple indicators to validate
their analysis and increase the probability of successful trades.
1. Moving Averages
● Simple Moving Average (SMA)
A simple moving average (SMA) is a commonly used technical indicator that
calculates the average price of a security over a specified period. It smoothes out
price fluctuations and helps identify trends. Traders use SMAs to determine
support and resistance levels and generate trading signals when the price
crosses above or below the moving average.
● Exponential Moving Average (EMA)
The exponential moving average (EMA) is another widely used moving average
indicator. It gives more weight to recent prices, making it more responsive to
recent market changes compared to the SMA. Traders use EMAs to identify
short-term trends and potential entry or exit points.
2. Relative Strength Index (RSI)
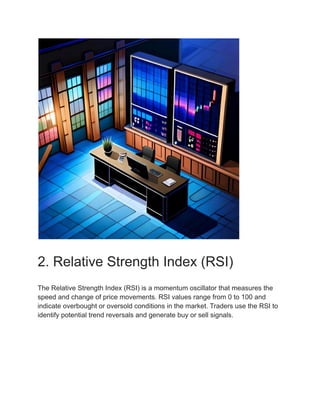
The Relative Strength Index (RSI) is a momentum oscillator that measures the
speed and change of price movements. RSI values range from 0 to 100 and
indicate overbought or oversold conditions in the market. Traders use the RSI to
identify potential trend reversals and generate buy or sell signals.
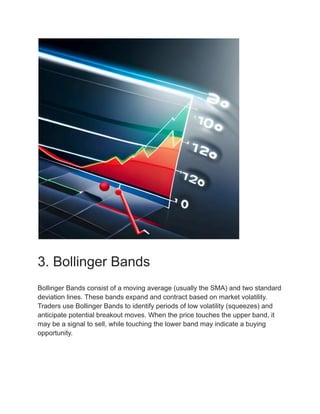
3. Bollinger Bands
Bollinger Bands consist of a moving average (usually the SMA) and two standard
deviation lines. These bands expand and contract based on market volatility.
Traders use Bollinger Bands to identify periods of low volatility (squeezes) and
anticipate potential breakout moves. When the price touches the upper band, it
may be a signal to sell, while touching the lower band may indicate a buying
opportunity.
4. MACD (Moving Average
Convergence Divergence)
The Moving Average Convergence Divergence (MACD) is a trend-following
momentum indicator. It consists of two lines: the MACD line and the signal line.
Traders use the MACD to identify potential trend reversals, generate buy or sell
signals, and confirm the strength of a trend.
5. Stochastic Oscillator
The Stochastic Oscillator is a momentum indicator that compares the closing
price of a security to its price range over a specific period. It consists of two lines:
%K and %D. Traders use the Stochastic Oscillator to identify overbought or
oversold conditions and potential trend reversals.
6. Fibonacci Retracement
Fibonacci Retracement is a technical analysis tool based on the Fibonacci
sequence. Traders use Fibonacci retracement levels to identify potential support
and resistance levels where price corrections may end and the original trend
could resume. These levels are derived from ratios of the Fibonacci sequence
(e.g., 38.2%, 50%, and 61.8%).
7. Volume
Volume is a crucial technical indicator that represents the number of shares or
contracts traded in a security or market during a given period. Traders analyze
volume to assess the strength of price movements and confirm trends. High
volume often indicates increased market interest and validates the significance of
price levels.
8. Average True Range (ATR)
The Average True Range (ATR) is a volatility indicator that measures the average
range between the high and low prices over a specific period. Traders use the
ATR to assess market volatility and determine potential stop-loss levels or profit
targets. Higher ATR values indicate higher volatility, while lower values suggest
decreased volatility.
9. Ichimoku Cloud
The Ichimoku Cloud is a comprehensive technical indicator that provides insights
into support and resistance levels, trend direction, and momentum. It consists of
multiple lines and a cloud component. Traders use the Ichimoku Cloud to
generate trading signals and assess overall market conditions.
10. Pivot Points
Pivot Points are horizontal levels derived from the previous day’s high, low, and
closing prices. Traders use pivot points to identify potential support and
resistance levels. These levels help determine entry and exit points and define
stop-loss and take-profit levels.
11. Conclusion
Technical indicators are very useful to understand the market trends. They
provide valuable insights into market trends, potential reversals, and entry or exit
points. By understanding and effectively utilizing these indicators, traders can
enhance their trading strategies and improve their chances of success in the
financial markets. Technical indicators are valuable tools for traders, providing
insights into market trends and potential trading opportunities. By understanding
and utilizing a diverse range of indicators, traders can enhance their
decision-making process and improve their overall trading performance.
Remember to adapt and fine-tune your indicators based on market conditions
and always incorporate risk management strategies into your trading plan. Happy
trading!
12. FAQ’s
1. Q: How many technical indicators should I use in my trading
strategy?
A: The number of technical indicators you use depends on your trading style and
preferences. It’s advisable to start with a few indicators and gradually expand
your knowledge as you gain experience.
2. Q: Are technical indicators suitable for all types of markets?
A: Technical indicators can be applied to various markets, including stocks, forex,
commodities, and crypto currencies. However, it’s essential to understand the
unique characteristics of each market and adjust your indicators accordingly.
3. Q: Can technical indicators guarantee profitable trades?
A: No, technical indicators are tools that provide insights and help in
decision-making. They do not guarantee profitable trades. It’s crucial to combine
technical indicators with other forms of analysis and risk management strategies.
4. Q: How often should I update my technical indicators?
A: It’s advisable to review and update your technical indicators regularly to adapt
to changing market conditions. Set a routine to reassess and optimize your
indicators based on the current market environment.
5. Q: Where can I learn more about technical indicators?
A: There are various online resources, books, and educational courses available
to learn more about technical indicators. Engaging in continuous learning and
practice is key to mastering their application.
Go to For more About Trading Strategies
Moving Averages: The Best Technical Indicator for Analyzing Market Trends
Best Stocks Swing Trading: 100% Profits in the Stock Market

More Related Content

Similar to 10 Best Technical Indicators List Trend Indicators.pdf

Price Action Trading.pdf
Price Action Trading.pdfPrice Action Trading.pdf
Price Action Trading.pdfShreya292338
 
QNBFS Daily Technical Trader Qatar - May 12, 2022 التحليل الفني اليومي لبورصة...
QNBFS Daily Technical Trader Qatar - May 12, 2022 التحليل الفني اليومي لبورصة...QNBFS Daily Technical Trader Qatar - May 12, 2022 التحليل الفني اليومي لبورصة...
QNBFS Daily Technical Trader Qatar - May 12, 2022 التحليل الفني اليومي لبورصة...QNB Group
 
What are Key Chart Levels and How to Trade Them
What are Key Chart Levels and How to Trade ThemWhat are Key Chart Levels and How to Trade Them
What are Key Chart Levels and How to Trade Them My Trading Skills
 
QNBFS Daily Technical Trader Qatar - May 15, 2022 التحليل الفني اليومي لبورصة...
QNBFS Daily Technical Trader Qatar - May 15, 2022 التحليل الفني اليومي لبورصة...QNBFS Daily Technical Trader Qatar - May 15, 2022 التحليل الفني اليومي لبورصة...
QNBFS Daily Technical Trader Qatar - May 15, 2022 التحليل الفني اليومي لبورصة...QNB Group
 
QNBFS Daily Technical Trader Qatar - May 22, 2022 التحليل الفني اليومي لبورصة...
QNBFS Daily Technical Trader Qatar - May 22, 2022 التحليل الفني اليومي لبورصة...QNBFS Daily Technical Trader Qatar - May 22, 2022 التحليل الفني اليومي لبورصة...
QNBFS Daily Technical Trader Qatar - May 22, 2022 التحليل الفني اليومي لبورصة...QNB Group
 
QNBFS Daily Technical Trader Qatar - April 28, 2022 التحليل الفني اليومي لبور...
QNBFS Daily Technical Trader Qatar - April 28, 2022 التحليل الفني اليومي لبور...QNBFS Daily Technical Trader Qatar - April 28, 2022 التحليل الفني اليومي لبور...
QNBFS Daily Technical Trader Qatar - April 28, 2022 التحليل الفني اليومي لبور...QNB Group
 
QNBFS Daily Technical Trader Qatar - May 08, 2022 التحليل الفني اليومي لبورصة...
QNBFS Daily Technical Trader Qatar - May 08, 2022 التحليل الفني اليومي لبورصة...QNBFS Daily Technical Trader Qatar - May 08, 2022 التحليل الفني اليومي لبورصة...
QNBFS Daily Technical Trader Qatar - May 08, 2022 التحليل الفني اليومي لبورصة...QNB Group
 
QNBFS Daily Technical Trader Qatar - May 09, 2022
QNBFS Daily Technical Trader Qatar - May 09, 2022QNBFS Daily Technical Trader Qatar - May 09, 2022
QNBFS Daily Technical Trader Qatar - May 09, 2022QNB Group
 
QNBFS Daily Technical Trader Qatar - May 09, 2022 التحليل الفني اليومي لبورصة...
QNBFS Daily Technical Trader Qatar - May 09, 2022 التحليل الفني اليومي لبورصة...QNBFS Daily Technical Trader Qatar - May 09, 2022 التحليل الفني اليومي لبورصة...
QNBFS Daily Technical Trader Qatar - May 09, 2022 التحليل الفني اليومي لبورصة...QNB Group
 
Technical Analysis
Technical AnalysisTechnical Analysis
Technical Analysisluv_sharma
 
QNBFS Daily Technical Trader - Qatar for April 22, 2018 التحليل الفني اليومي ...
QNBFS Daily Technical Trader - Qatar for April 22, 2018 التحليل الفني اليومي ...QNBFS Daily Technical Trader - Qatar for April 22, 2018 التحليل الفني اليومي ...
QNBFS Daily Technical Trader - Qatar for April 22, 2018 التحليل الفني اليومي ...QNB Group
 
QNBFS Daily Technical Trader Qatar - April 27, 2022 التحليل الفني اليومي لبور...
QNBFS Daily Technical Trader Qatar - April 27, 2022 التحليل الفني اليومي لبور...QNBFS Daily Technical Trader Qatar - April 27, 2022 التحليل الفني اليومي لبور...
QNBFS Daily Technical Trader Qatar - April 27, 2022 التحليل الفني اليومي لبور...QNB Group
 
QNBFS Daily Technical Trader Qatar - May 19, 2022 التحليل الفني اليومي لبورصة...
QNBFS Daily Technical Trader Qatar - May 19, 2022 التحليل الفني اليومي لبورصة...QNBFS Daily Technical Trader Qatar - May 19, 2022 التحليل الفني اليومي لبورصة...
QNBFS Daily Technical Trader Qatar - May 19, 2022 التحليل الفني اليومي لبورصة...QNB Group
 
Forex Signals - What you need to know
Forex Signals - What you need to knowForex Signals - What you need to know
Forex Signals - What you need to knowCompareForexBrokers
 
QNBFS Daily Technical Trader - Qatar for June 13 2018 التحليل الفني اليومي لب...
QNBFS Daily Technical Trader - Qatar for June 13 2018 التحليل الفني اليومي لب...QNBFS Daily Technical Trader - Qatar for June 13 2018 التحليل الفني اليومي لب...
QNBFS Daily Technical Trader - Qatar for June 13 2018 التحليل الفني اليومي لب...QNB Group
 
QNBFS Daily Technical Trader Qatar - October 27, 2021 التحليل الفني اليومي لب...
QNBFS Daily Technical Trader Qatar - October 27, 2021 التحليل الفني اليومي لب...QNBFS Daily Technical Trader Qatar - October 27, 2021 التحليل الفني اليومي لب...
QNBFS Daily Technical Trader Qatar - October 27, 2021 التحليل الفني اليومي لب...QNB Group
 
QNBFS Daily Technical Trader Qatar - January 09, 2022 التحليل الفني اليومي لب...
QNBFS Daily Technical Trader Qatar - January 09, 2022 التحليل الفني اليومي لب...QNBFS Daily Technical Trader Qatar - January 09, 2022 التحليل الفني اليومي لب...
QNBFS Daily Technical Trader Qatar - January 09, 2022 التحليل الفني اليومي لب...QNB Group
 
QNBFS Daily Technical Trader - Qatar for May 23 2018 التحليل الفني اليومي لبو...
QNBFS Daily Technical Trader - Qatar for May 23 2018 التحليل الفني اليومي لبو...QNBFS Daily Technical Trader - Qatar for May 23 2018 التحليل الفني اليومي لبو...
QNBFS Daily Technical Trader - Qatar for May 23 2018 التحليل الفني اليومي لبو...QNB Group
 
QNBFS Daily Technical Trader Qatar - May 11, 2022 التحليل الفني اليومي لبورصة...
QNBFS Daily Technical Trader Qatar - May 11, 2022 التحليل الفني اليومي لبورصة...QNBFS Daily Technical Trader Qatar - May 11, 2022 التحليل الفني اليومي لبورصة...
QNBFS Daily Technical Trader Qatar - May 11, 2022 التحليل الفني اليومي لبورصة...QNB Group
 

Similar to 10 Best Technical Indicators List Trend Indicators.pdf (20)

Price Action Trading.pdf
Price Action Trading.pdfPrice Action Trading.pdf
Price Action Trading.pdf
 
QNBFS Daily Technical Trader Qatar - May 12, 2022 التحليل الفني اليومي لبورصة...
QNBFS Daily Technical Trader Qatar - May 12, 2022 التحليل الفني اليومي لبورصة...QNBFS Daily Technical Trader Qatar - May 12, 2022 التحليل الفني اليومي لبورصة...
QNBFS Daily Technical Trader Qatar - May 12, 2022 التحليل الفني اليومي لبورصة...
 
What are Key Chart Levels and How to Trade Them
What are Key Chart Levels and How to Trade ThemWhat are Key Chart Levels and How to Trade Them
What are Key Chart Levels and How to Trade Them
 
ECL Learnings.pptx
ECL Learnings.pptxECL Learnings.pptx
ECL Learnings.pptx
 
QNBFS Daily Technical Trader Qatar - May 15, 2022 التحليل الفني اليومي لبورصة...
QNBFS Daily Technical Trader Qatar - May 15, 2022 التحليل الفني اليومي لبورصة...QNBFS Daily Technical Trader Qatar - May 15, 2022 التحليل الفني اليومي لبورصة...
QNBFS Daily Technical Trader Qatar - May 15, 2022 التحليل الفني اليومي لبورصة...
 
QNBFS Daily Technical Trader Qatar - May 22, 2022 التحليل الفني اليومي لبورصة...
QNBFS Daily Technical Trader Qatar - May 22, 2022 التحليل الفني اليومي لبورصة...QNBFS Daily Technical Trader Qatar - May 22, 2022 التحليل الفني اليومي لبورصة...
QNBFS Daily Technical Trader Qatar - May 22, 2022 التحليل الفني اليومي لبورصة...
 
QNBFS Daily Technical Trader Qatar - April 28, 2022 التحليل الفني اليومي لبور...
QNBFS Daily Technical Trader Qatar - April 28, 2022 التحليل الفني اليومي لبور...QNBFS Daily Technical Trader Qatar - April 28, 2022 التحليل الفني اليومي لبور...
QNBFS Daily Technical Trader Qatar - April 28, 2022 التحليل الفني اليومي لبور...
 
QNBFS Daily Technical Trader Qatar - May 08, 2022 التحليل الفني اليومي لبورصة...
QNBFS Daily Technical Trader Qatar - May 08, 2022 التحليل الفني اليومي لبورصة...QNBFS Daily Technical Trader Qatar - May 08, 2022 التحليل الفني اليومي لبورصة...
QNBFS Daily Technical Trader Qatar - May 08, 2022 التحليل الفني اليومي لبورصة...
 
QNBFS Daily Technical Trader Qatar - May 09, 2022
QNBFS Daily Technical Trader Qatar - May 09, 2022QNBFS Daily Technical Trader Qatar - May 09, 2022
QNBFS Daily Technical Trader Qatar - May 09, 2022
 
QNBFS Daily Technical Trader Qatar - May 09, 2022 التحليل الفني اليومي لبورصة...
QNBFS Daily Technical Trader Qatar - May 09, 2022 التحليل الفني اليومي لبورصة...QNBFS Daily Technical Trader Qatar - May 09, 2022 التحليل الفني اليومي لبورصة...
QNBFS Daily Technical Trader Qatar - May 09, 2022 التحليل الفني اليومي لبورصة...
 
Technical Analysis
Technical AnalysisTechnical Analysis
Technical Analysis
 
QNBFS Daily Technical Trader - Qatar for April 22, 2018 التحليل الفني اليومي ...
QNBFS Daily Technical Trader - Qatar for April 22, 2018 التحليل الفني اليومي ...QNBFS Daily Technical Trader - Qatar for April 22, 2018 التحليل الفني اليومي ...
QNBFS Daily Technical Trader - Qatar for April 22, 2018 التحليل الفني اليومي ...
 
QNBFS Daily Technical Trader Qatar - April 27, 2022 التحليل الفني اليومي لبور...
QNBFS Daily Technical Trader Qatar - April 27, 2022 التحليل الفني اليومي لبور...QNBFS Daily Technical Trader Qatar - April 27, 2022 التحليل الفني اليومي لبور...
QNBFS Daily Technical Trader Qatar - April 27, 2022 التحليل الفني اليومي لبور...
 
QNBFS Daily Technical Trader Qatar - May 19, 2022 التحليل الفني اليومي لبورصة...
QNBFS Daily Technical Trader Qatar - May 19, 2022 التحليل الفني اليومي لبورصة...QNBFS Daily Technical Trader Qatar - May 19, 2022 التحليل الفني اليومي لبورصة...
QNBFS Daily Technical Trader Qatar - May 19, 2022 التحليل الفني اليومي لبورصة...
 
Forex Signals - What you need to know
Forex Signals - What you need to knowForex Signals - What you need to know
Forex Signals - What you need to know
 
QNBFS Daily Technical Trader - Qatar for June 13 2018 التحليل الفني اليومي لب...
QNBFS Daily Technical Trader - Qatar for June 13 2018 التحليل الفني اليومي لب...QNBFS Daily Technical Trader - Qatar for June 13 2018 التحليل الفني اليومي لب...
QNBFS Daily Technical Trader - Qatar for June 13 2018 التحليل الفني اليومي لب...
 
QNBFS Daily Technical Trader Qatar - October 27, 2021 التحليل الفني اليومي لب...
QNBFS Daily Technical Trader Qatar - October 27, 2021 التحليل الفني اليومي لب...QNBFS Daily Technical Trader Qatar - October 27, 2021 التحليل الفني اليومي لب...
QNBFS Daily Technical Trader Qatar - October 27, 2021 التحليل الفني اليومي لب...
 
QNBFS Daily Technical Trader Qatar - January 09, 2022 التحليل الفني اليومي لب...
QNBFS Daily Technical Trader Qatar - January 09, 2022 التحليل الفني اليومي لب...QNBFS Daily Technical Trader Qatar - January 09, 2022 التحليل الفني اليومي لب...
QNBFS Daily Technical Trader Qatar - January 09, 2022 التحليل الفني اليومي لب...
 
QNBFS Daily Technical Trader - Qatar for May 23 2018 التحليل الفني اليومي لبو...
QNBFS Daily Technical Trader - Qatar for May 23 2018 التحليل الفني اليومي لبو...QNBFS Daily Technical Trader - Qatar for May 23 2018 التحليل الفني اليومي لبو...
QNBFS Daily Technical Trader - Qatar for May 23 2018 التحليل الفني اليومي لبو...
 
QNBFS Daily Technical Trader Qatar - May 11, 2022 التحليل الفني اليومي لبورصة...
QNBFS Daily Technical Trader Qatar - May 11, 2022 التحليل الفني اليومي لبورصة...QNBFS Daily Technical Trader Qatar - May 11, 2022 التحليل الفني اليومي لبورصة...
QNBFS Daily Technical Trader Qatar - May 11, 2022 التحليل الفني اليومي لبورصة...
 

More from Nazim Khan

What are Options and How to Trade Options 10 Successful Options Strategies.pdf
What are Options and How to Trade Options 10 Successful Options Strategies.pdfWhat are Options and How to Trade Options 10 Successful Options Strategies.pdf
What are Options and How to Trade Options 10 Successful Options Strategies.pdfNazim Khan
 
What is Inflation and How to Beat Inflation 2024.pdf
What is Inflation and How to Beat Inflation 2024.pdfWhat is Inflation and How to Beat Inflation 2024.pdf
What is Inflation and How to Beat Inflation 2024.pdfNazim Khan
 
Price Action Trading Best 100% Successful Strategies used by Investors.pdf
Price Action Trading Best 100% Successful Strategies used by Investors.pdfPrice Action Trading Best 100% Successful Strategies used by Investors.pdf
Price Action Trading Best 100% Successful Strategies used by Investors.pdfNazim Khan
 
Algo Trading – Best Algorithmic Trading Examples.pdf
Algo Trading – Best Algorithmic Trading Examples.pdfAlgo Trading – Best Algorithmic Trading Examples.pdf
Algo Trading – Best Algorithmic Trading Examples.pdfNazim Khan
 
Mutual Funds or Stock Investments Best 5 Facts for Wise Investments.pdf
Mutual Funds or Stock Investments Best 5 Facts for Wise Investments.pdfMutual Funds or Stock Investments Best 5 Facts for Wise Investments.pdf
Mutual Funds or Stock Investments Best 5 Facts for Wise Investments.pdfNazim Khan
 
Technical Analysis Vs Fundamental Analysis.pdf
Technical Analysis Vs Fundamental Analysis.pdfTechnical Analysis Vs Fundamental Analysis.pdf
Technical Analysis Vs Fundamental Analysis.pdfNazim Khan
 
Best Moving Average for Swing Trading.pdf
Best Moving Average for Swing Trading.pdfBest Moving Average for Swing Trading.pdf
Best Moving Average for Swing Trading.pdfNazim Khan
 
ELSS – What are ELSS funds – Is ELSS tax free after 3 years.pdf
ELSS – What are ELSS funds – Is ELSS tax free after 3 years.pdfELSS – What are ELSS funds – Is ELSS tax free after 3 years.pdf
ELSS – What are ELSS funds – Is ELSS tax free after 3 years.pdfNazim Khan
 
Fibonacci Retracement – 5 Best Tips for Master Fibonacci Retracement.pdf
Fibonacci Retracement – 5 Best Tips for Master Fibonacci Retracement.pdfFibonacci Retracement – 5 Best Tips for Master Fibonacci Retracement.pdf
Fibonacci Retracement – 5 Best Tips for Master Fibonacci Retracement.pdfNazim Khan
 

More from Nazim Khan (9)

What are Options and How to Trade Options 10 Successful Options Strategies.pdf
What are Options and How to Trade Options 10 Successful Options Strategies.pdfWhat are Options and How to Trade Options 10 Successful Options Strategies.pdf
What are Options and How to Trade Options 10 Successful Options Strategies.pdf
 
What is Inflation and How to Beat Inflation 2024.pdf
What is Inflation and How to Beat Inflation 2024.pdfWhat is Inflation and How to Beat Inflation 2024.pdf
What is Inflation and How to Beat Inflation 2024.pdf
 
Price Action Trading Best 100% Successful Strategies used by Investors.pdf
Price Action Trading Best 100% Successful Strategies used by Investors.pdfPrice Action Trading Best 100% Successful Strategies used by Investors.pdf
Price Action Trading Best 100% Successful Strategies used by Investors.pdf
 
Algo Trading – Best Algorithmic Trading Examples.pdf
Algo Trading – Best Algorithmic Trading Examples.pdfAlgo Trading – Best Algorithmic Trading Examples.pdf
Algo Trading – Best Algorithmic Trading Examples.pdf
 
Mutual Funds or Stock Investments Best 5 Facts for Wise Investments.pdf
Mutual Funds or Stock Investments Best 5 Facts for Wise Investments.pdfMutual Funds or Stock Investments Best 5 Facts for Wise Investments.pdf
Mutual Funds or Stock Investments Best 5 Facts for Wise Investments.pdf
 
Technical Analysis Vs Fundamental Analysis.pdf
Technical Analysis Vs Fundamental Analysis.pdfTechnical Analysis Vs Fundamental Analysis.pdf
Technical Analysis Vs Fundamental Analysis.pdf
 
Best Moving Average for Swing Trading.pdf
Best Moving Average for Swing Trading.pdfBest Moving Average for Swing Trading.pdf
Best Moving Average for Swing Trading.pdf
 
ELSS – What are ELSS funds – Is ELSS tax free after 3 years.pdf
ELSS – What are ELSS funds – Is ELSS tax free after 3 years.pdfELSS – What are ELSS funds – Is ELSS tax free after 3 years.pdf
ELSS – What are ELSS funds – Is ELSS tax free after 3 years.pdf
 
Fibonacci Retracement – 5 Best Tips for Master Fibonacci Retracement.pdf
Fibonacci Retracement – 5 Best Tips for Master Fibonacci Retracement.pdfFibonacci Retracement – 5 Best Tips for Master Fibonacci Retracement.pdf
Fibonacci Retracement – 5 Best Tips for Master Fibonacci Retracement.pdf
 

Recently uploaded

Enzyme, Pharmaceutical Aids, Miscellaneous Last Part of Chapter no 5th.pdf
Enzyme, Pharmaceutical Aids, Miscellaneous Last Part of Chapter no 5th.pdfEnzyme, Pharmaceutical Aids, Miscellaneous Last Part of Chapter no 5th.pdf
Enzyme, Pharmaceutical Aids, Miscellaneous Last Part of Chapter no 5th.pdfSumit Tiwari
 
Framing an Appropriate Research Question 6b9b26d93da94caf993c038d9efcdedb.pdf
Framing an Appropriate Research Question 6b9b26d93da94caf993c038d9efcdedb.pdfFraming an Appropriate Research Question 6b9b26d93da94caf993c038d9efcdedb.pdf
Framing an Appropriate Research Question 6b9b26d93da94caf993c038d9efcdedb.pdfUjwalaBharambe
 
Interactive Powerpoint_How to Master effective communication
Interactive Powerpoint_How to Master effective communicationInteractive Powerpoint_How to Master effective communication
Interactive Powerpoint_How to Master effective communicationnomboosow
 
ECONOMIC CONTEXT - PAPER 1 Q3: NEWSPAPERS.pptx
ECONOMIC CONTEXT - PAPER 1 Q3: NEWSPAPERS.pptxECONOMIC CONTEXT - PAPER 1 Q3: NEWSPAPERS.pptx
ECONOMIC CONTEXT - PAPER 1 Q3: NEWSPAPERS.pptxiammrhaywood
 
Proudly South Africa powerpoint Thorisha.pptx
Proudly South Africa powerpoint Thorisha.pptxProudly South Africa powerpoint Thorisha.pptx
Proudly South Africa powerpoint Thorisha.pptxthorishapillay1
 
Crayon Activity Handout For the Crayon A
Crayon Activity Handout For the Crayon ACrayon Activity Handout For the Crayon A
Crayon Activity Handout For the Crayon AUnboundStockton
 
CARE OF CHILD IN INCUBATOR..........pptx
CARE OF CHILD IN INCUBATOR..........pptxCARE OF CHILD IN INCUBATOR..........pptx
CARE OF CHILD IN INCUBATOR..........pptxGaneshChakor2
 
Types of Journalistic Writing Grade 8.pptx
Types of Journalistic Writing Grade 8.pptxTypes of Journalistic Writing Grade 8.pptx
Types of Journalistic Writing Grade 8.pptxEyham Joco
 
Organic Name Reactions for the students and aspirants of Chemistry12th.pptx
Organic Name Reactions  for the students and aspirants of Chemistry12th.pptxOrganic Name Reactions  for the students and aspirants of Chemistry12th.pptx
Organic Name Reactions for the students and aspirants of Chemistry12th.pptxVS Mahajan Coaching Centre
 
EPANDING THE CONTENT OF AN OUTLINE using notes.pptx
EPANDING THE CONTENT OF AN OUTLINE using notes.pptxEPANDING THE CONTENT OF AN OUTLINE using notes.pptx
EPANDING THE CONTENT OF AN OUTLINE using notes.pptxRaymartEstabillo3
 
internship ppt on smartinternz platform as salesforce developer
internship ppt on smartinternz platform as salesforce developerinternship ppt on smartinternz platform as salesforce developer
internship ppt on smartinternz platform as salesforce developerunnathinaik
 
Roles & Responsibilities in Pharmacovigilance
Roles & Responsibilities in PharmacovigilanceRoles & Responsibilities in Pharmacovigilance
Roles & Responsibilities in PharmacovigilanceSamikshaHamane
 
भारत-रोम व्यापार.pptx, Indo-Roman Trade,
भारत-रोम व्यापार.pptx, Indo-Roman Trade,भारत-रोम व्यापार.pptx, Indo-Roman Trade,
भारत-रोम व्यापार.pptx, Indo-Roman Trade,Virag Sontakke
 
Painted Grey Ware.pptx, PGW Culture of India
Painted Grey Ware.pptx, PGW Culture of IndiaPainted Grey Ware.pptx, PGW Culture of India
Painted Grey Ware.pptx, PGW Culture of IndiaVirag Sontakke
 
Introduction to AI in Higher Education_draft.pptx
Introduction to AI in Higher Education_draft.pptxIntroduction to AI in Higher Education_draft.pptx
Introduction to AI in Higher Education_draft.pptxpboyjonauth
 
Full Stack Web Development Course for Beginners
Full Stack Web Development Course  for BeginnersFull Stack Web Development Course  for Beginners
Full Stack Web Development Course for BeginnersSabitha Banu
 

Recently uploaded (20)

Enzyme, Pharmaceutical Aids, Miscellaneous Last Part of Chapter no 5th.pdf
Enzyme, Pharmaceutical Aids, Miscellaneous Last Part of Chapter no 5th.pdfEnzyme, Pharmaceutical Aids, Miscellaneous Last Part of Chapter no 5th.pdf
Enzyme, Pharmaceutical Aids, Miscellaneous Last Part of Chapter no 5th.pdf
 
Framing an Appropriate Research Question 6b9b26d93da94caf993c038d9efcdedb.pdf
Framing an Appropriate Research Question 6b9b26d93da94caf993c038d9efcdedb.pdfFraming an Appropriate Research Question 6b9b26d93da94caf993c038d9efcdedb.pdf
Framing an Appropriate Research Question 6b9b26d93da94caf993c038d9efcdedb.pdf
 
Interactive Powerpoint_How to Master effective communication
Interactive Powerpoint_How to Master effective communicationInteractive Powerpoint_How to Master effective communication
Interactive Powerpoint_How to Master effective communication
 
ECONOMIC CONTEXT - PAPER 1 Q3: NEWSPAPERS.pptx
ECONOMIC CONTEXT - PAPER 1 Q3: NEWSPAPERS.pptxECONOMIC CONTEXT - PAPER 1 Q3: NEWSPAPERS.pptx
ECONOMIC CONTEXT - PAPER 1 Q3: NEWSPAPERS.pptx
 
Proudly South Africa powerpoint Thorisha.pptx
Proudly South Africa powerpoint Thorisha.pptxProudly South Africa powerpoint Thorisha.pptx
Proudly South Africa powerpoint Thorisha.pptx
 
Crayon Activity Handout For the Crayon A
Crayon Activity Handout For the Crayon ACrayon Activity Handout For the Crayon A
Crayon Activity Handout For the Crayon A
 
CARE OF CHILD IN INCUBATOR..........pptx
CARE OF CHILD IN INCUBATOR..........pptxCARE OF CHILD IN INCUBATOR..........pptx
CARE OF CHILD IN INCUBATOR..........pptx
 
Types of Journalistic Writing Grade 8.pptx
Types of Journalistic Writing Grade 8.pptxTypes of Journalistic Writing Grade 8.pptx
Types of Journalistic Writing Grade 8.pptx
 
9953330565 Low Rate Call Girls In Rohini Delhi NCR
9953330565 Low Rate Call Girls In Rohini  Delhi NCR9953330565 Low Rate Call Girls In Rohini  Delhi NCR
9953330565 Low Rate Call Girls In Rohini Delhi NCR
 
OS-operating systems- ch04 (Threads) ...
OS-operating systems- ch04 (Threads) ...OS-operating systems- ch04 (Threads) ...
OS-operating systems- ch04 (Threads) ...
 
Organic Name Reactions for the students and aspirants of Chemistry12th.pptx
Organic Name Reactions  for the students and aspirants of Chemistry12th.pptxOrganic Name Reactions  for the students and aspirants of Chemistry12th.pptx
Organic Name Reactions for the students and aspirants of Chemistry12th.pptx
 
EPANDING THE CONTENT OF AN OUTLINE using notes.pptx
EPANDING THE CONTENT OF AN OUTLINE using notes.pptxEPANDING THE CONTENT OF AN OUTLINE using notes.pptx
EPANDING THE CONTENT OF AN OUTLINE using notes.pptx
 
internship ppt on smartinternz platform as salesforce developer
internship ppt on smartinternz platform as salesforce developerinternship ppt on smartinternz platform as salesforce developer
internship ppt on smartinternz platform as salesforce developer
 
Roles & Responsibilities in Pharmacovigilance
Roles & Responsibilities in PharmacovigilanceRoles & Responsibilities in Pharmacovigilance
Roles & Responsibilities in Pharmacovigilance
 
भारत-रोम व्यापार.pptx, Indo-Roman Trade,
भारत-रोम व्यापार.pptx, Indo-Roman Trade,भारत-रोम व्यापार.pptx, Indo-Roman Trade,
भारत-रोम व्यापार.pptx, Indo-Roman Trade,
 
ESSENTIAL of (CS/IT/IS) class 06 (database)
ESSENTIAL of (CS/IT/IS) class 06 (database)ESSENTIAL of (CS/IT/IS) class 06 (database)
ESSENTIAL of (CS/IT/IS) class 06 (database)
 
Painted Grey Ware.pptx, PGW Culture of India
Painted Grey Ware.pptx, PGW Culture of IndiaPainted Grey Ware.pptx, PGW Culture of India
Painted Grey Ware.pptx, PGW Culture of India
 
Model Call Girl in Bikash Puri Delhi reach out to us at 🔝9953056974🔝
Model Call Girl in Bikash Puri  Delhi reach out to us at 🔝9953056974🔝Model Call Girl in Bikash Puri  Delhi reach out to us at 🔝9953056974🔝
Model Call Girl in Bikash Puri Delhi reach out to us at 🔝9953056974🔝
 
Introduction to AI in Higher Education_draft.pptx
Introduction to AI in Higher Education_draft.pptxIntroduction to AI in Higher Education_draft.pptx
Introduction to AI in Higher Education_draft.pptx
 
Full Stack Web Development Course for Beginners
Full Stack Web Development Course  for BeginnersFull Stack Web Development Course  for Beginners
Full Stack Web Development Course for Beginners
 

10 Best Technical Indicators List Trend Indicators.pdf

  • 1. 10 Best Technical Indicators List | Trend Indicators https://pivotstocks.com/ Trading in the financial markets requires a deep understanding of various tools and techniques that can help traders make informed decisions. One such set of tools is technical indicators, which are widely used to analyze price movements, identify trends, and generate trading signals. In this article, we will explore some of the most trending technical indicators used by traders worldwide. So, let’s dive in and uncover the power of these indicators in shaping successful trading strategies.
  • 2. Introduction to Technical Indicators Technical indicators are mathematical calculations applied to historical price and volume data to gain insights into market trends and price patterns. These indicators help traders identify potential buy or sell signals and assist in making informed trading decisions. Traders often combine multiple indicators to validate their analysis and increase the probability of successful trades. 1. Moving Averages
  • 3. ● Simple Moving Average (SMA) A simple moving average (SMA) is a commonly used technical indicator that calculates the average price of a security over a specified period. It smoothes out price fluctuations and helps identify trends. Traders use SMAs to determine support and resistance levels and generate trading signals when the price crosses above or below the moving average. ● Exponential Moving Average (EMA) The exponential moving average (EMA) is another widely used moving average indicator. It gives more weight to recent prices, making it more responsive to recent market changes compared to the SMA. Traders use EMAs to identify short-term trends and potential entry or exit points.
  • 4. 2. Relative Strength Index (RSI) The Relative Strength Index (RSI) is a momentum oscillator that measures the speed and change of price movements. RSI values range from 0 to 100 and indicate overbought or oversold conditions in the market. Traders use the RSI to identify potential trend reversals and generate buy or sell signals.
  • 5. 3. Bollinger Bands Bollinger Bands consist of a moving average (usually the SMA) and two standard deviation lines. These bands expand and contract based on market volatility. Traders use Bollinger Bands to identify periods of low volatility (squeezes) and anticipate potential breakout moves. When the price touches the upper band, it may be a signal to sell, while touching the lower band may indicate a buying opportunity.
  • 6. 4. MACD (Moving Average Convergence Divergence) The Moving Average Convergence Divergence (MACD) is a trend-following momentum indicator. It consists of two lines: the MACD line and the signal line. Traders use the MACD to identify potential trend reversals, generate buy or sell signals, and confirm the strength of a trend.
  • 7. 5. Stochastic Oscillator The Stochastic Oscillator is a momentum indicator that compares the closing price of a security to its price range over a specific period. It consists of two lines: %K and %D. Traders use the Stochastic Oscillator to identify overbought or oversold conditions and potential trend reversals.
  • 8. 6. Fibonacci Retracement Fibonacci Retracement is a technical analysis tool based on the Fibonacci sequence. Traders use Fibonacci retracement levels to identify potential support and resistance levels where price corrections may end and the original trend could resume. These levels are derived from ratios of the Fibonacci sequence (e.g., 38.2%, 50%, and 61.8%).
  • 9. 7. Volume Volume is a crucial technical indicator that represents the number of shares or contracts traded in a security or market during a given period. Traders analyze volume to assess the strength of price movements and confirm trends. High volume often indicates increased market interest and validates the significance of price levels.
  • 10. 8. Average True Range (ATR) The Average True Range (ATR) is a volatility indicator that measures the average range between the high and low prices over a specific period. Traders use the ATR to assess market volatility and determine potential stop-loss levels or profit targets. Higher ATR values indicate higher volatility, while lower values suggest decreased volatility. 9. Ichimoku Cloud
  • 11. The Ichimoku Cloud is a comprehensive technical indicator that provides insights into support and resistance levels, trend direction, and momentum. It consists of multiple lines and a cloud component. Traders use the Ichimoku Cloud to generate trading signals and assess overall market conditions. 10. Pivot Points Pivot Points are horizontal levels derived from the previous day’s high, low, and closing prices. Traders use pivot points to identify potential support and resistance levels. These levels help determine entry and exit points and define stop-loss and take-profit levels.
  • 12. 11. Conclusion Technical indicators are very useful to understand the market trends. They provide valuable insights into market trends, potential reversals, and entry or exit points. By understanding and effectively utilizing these indicators, traders can enhance their trading strategies and improve their chances of success in the financial markets. Technical indicators are valuable tools for traders, providing insights into market trends and potential trading opportunities. By understanding and utilizing a diverse range of indicators, traders can enhance their decision-making process and improve their overall trading performance. Remember to adapt and fine-tune your indicators based on market conditions and always incorporate risk management strategies into your trading plan. Happy trading!
  • 13. 12. FAQ’s 1. Q: How many technical indicators should I use in my trading strategy? A: The number of technical indicators you use depends on your trading style and preferences. It’s advisable to start with a few indicators and gradually expand your knowledge as you gain experience. 2. Q: Are technical indicators suitable for all types of markets?
  • 14. A: Technical indicators can be applied to various markets, including stocks, forex, commodities, and crypto currencies. However, it’s essential to understand the unique characteristics of each market and adjust your indicators accordingly. 3. Q: Can technical indicators guarantee profitable trades? A: No, technical indicators are tools that provide insights and help in decision-making. They do not guarantee profitable trades. It’s crucial to combine technical indicators with other forms of analysis and risk management strategies. 4. Q: How often should I update my technical indicators? A: It’s advisable to review and update your technical indicators regularly to adapt to changing market conditions. Set a routine to reassess and optimize your indicators based on the current market environment. 5. Q: Where can I learn more about technical indicators? A: There are various online resources, books, and educational courses available to learn more about technical indicators. Engaging in continuous learning and practice is key to mastering their application. Go to For more About Trading Strategies Moving Averages: The Best Technical Indicator for Analyzing Market Trends Best Stocks Swing Trading: 100% Profits in the Stock Market