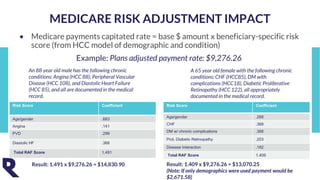
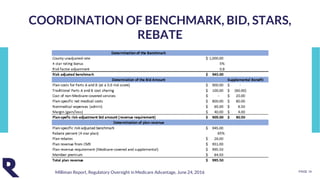
GOVERNMENT PROGRAMS
• Government programs funded directly or contract with health plans
for capitated programs (PMPM)
• Government-sponsored programs biggest source of organic growth
• Disruptive growth and share aggregation
• Star Ratings, member experience, and risk adjustment drive the
market
• Variability and unpredictability in risk adjustment
PAGE 2
OVERVIEW
To understand the opportunity, need to understand
framework, requirements, and how to leverage
changes in regulations to benefit product
PAGE 3
NEW GUIDANCE FOR OPPORTUNITIES IN GP
SPACE
Revenue up +6.4%
+3.4% change in payment by CMS
Modifications to risk adjustment
Benchmark increase by 5.28%
Improvements to star ratings
Flexible uniformity for additional benefits
Expansion of supplemental benefit offering
$
PAGE 4
• Why does this matter:
• Plans want to make money
• One way is through increased enrollment
• Enrollment is influenced by a number of factors but 1 is benefits offered/engagement activities
• Benefits are heavily dependent on star ratings
• Plans are paid based on their bid.
• Payment varies between local and regional plans.
• Benchmarks are set and it is the maximum a plan will be paid. Bids and payments are derived
off the benchmarks.
• Star Ratings provide the ability for plans to receive a bonus added to the benchmark.
• Risk Adjustment provides additional reimbursement for a plan that assumes a sicker
population.
COMPONENTS TO HOW PLANS ARE PAID
PAGE 5
THE PLAN BID AND CALENDAR
• Plans projection of what
it will cost to cover a
single beneficiary (with
a risk score) each
month.
• CMS analyzes for
actuarial soundness
Milliman Report, Regulatory Oversight in Medicare Advantage,
June 24, 2016
PAGE 6
PLAN PAYMENT: BID AND BENCHMARK
Grade Target
Plan Bid ($)
Grade Target
Plan Bid ($)
Shopping spree Shopping spree
New Car (Bonus (5%))Actual Grade (benchmark)
Actual Grade (Bonus-Adjusted ($))
Original 5%
65%
75%
Scenario:
Parents reward
for grades
exceeding target
More chores Actual Grade
Grade target
Actual grade
below grade
goal
Actual grade
meets or
exceeds
goal
PAGE 7
PLAN PAYMENT: BID AND BENCHMARK
Plan Bid ($) Plan Bid ($)
Rebate
Bonus Payment (5%)CMS Benchmark ($)
New Benchmark
Bonus-Adjusted ($)
CMS Benchmark +5%
65%
75%
Rebate
Charge Premium Original Benchmark ($)
Plan Bid
Bid above
benchmark
Bid below
benchmark
PAGE 8
• Annual ratings of Medicare plans that are made available on Medicare Plan Finder and
CMS website
• 2 year data lag; 2017 ratings represent 2015 performance
• Ratings are displayed as 1 to 5 stars
• Almost 2/3 of Medicare Advantage enrollees are in contracts with ratings of 4 or more
stars
OVERVIEW OF STAR RATINGS
Overall
Summary
Domains
Measure
• <4-Star plans on life
support
• ≤3-Star plans dead
• 1/2 Star = ~ $15-$50
PMPM
PAGE 9
THE MEMBER EXPERIENCE: COMPRISE HALF OF
RATINGS
Rating of the Plan
Rating of Health
Care/Providers
Rating of the Drug
Plan
PAGE 10
STAR RATING IMPACT/IMPLICATIONS
$700
(3 star)
$700
(4 star)
Original Benchmark +5%
Rebate
$700
(3.5 star)
Benchmark $800
Rebate
Star rating
QBP %
MA
Benchmark
Savings
Rebate
Percentage
MA Rebate
3
0%
$800
$100
50%
$50
Benchmark $800
Rebate
3.5
0%
$800
$100
65%
$65
4
5.0%
$840
$140
65%
$91
New Benchmark $840
$700
(5 star)
Rebate
New Benchmark $840
5
5.0%
$840
$140
70%
$98
Bid
Example Plan: $700 bid amount, MA benchmark of $800
PAGE 11
STAR RATING IMPACT/IMPLICATIONS
Plan: $700 bid amount, MA benchmark of $800
Overall Star Rating Formula 3.0 Stars or
Lower
3.5 Stars New/Low
Enrollment
4.0 Stars 4.5 Stars or
Higher
Bid Amount A $700 $700 $700 $700 $700
QBP Percentage B 0% 0% 3.5% 5.0% 5.0%
MA Benchmark C = $800 x (1+B) $800 $800 $828 $840 $840
Savings D = C-A $100 $100 $128 $140 $140
Rebate Percentage E 50% 65% 65% 65% 70%
MA Rebate F = DxE $50 $65 $83 $91 $98
• The impact of dropping from a 3.5 star rating to a 3.0 is a 23% reduction in MA rebate revenue (resulting in benefit
reductions or member premium increases)
• The impact of dropping from a 4.0 star rating to a 3.5 results is a 29% reduction in MA rebate revenue
• Marketing
o CMS displays star ratings on the Medicare Plan Finder where beneficiaries shop for plans
o CMS labels certain plans with a “Low Performing Icon” or “High Performing Icon”
o Plans with five-star ratings can enroll beneficiaries throughout the year rather than only during open
enrollment
PAGE 12
Key Source of Plan Revenue
• Accounts for ~30% of variation in payment to MA plans
• Similar methodologies adopted in Medicaid
• Diagnostic code-driven provider; goal is complete and accurate data
Prospective Evaluations
• Opportunity to identify eligible early before encounter information; link
home visit data with care management programs, PCPs
• Move to “mobile medical home”: in-home labs, tests, MTM, caregiver
education
• Diagnostic code verification
RISK ADJUSTMENT IN GOVERNMENT
PROGRAMS
MEDICARE RISK ADJUSTMENT IMPACT
• Medicare payments capitated rate = base $ amount x beneficiary-specific risk
score (from HCC model of demographic and condition)
Risk Score Coefficient
Age/gender .683
Angina .141
PVD .299
Diastolic HF .368
Total RAF Score 1.491
Result: 1.491 x $9,276.26 = $14,830.90
An 88 year old male has the following chronic
conditions: Angina (HCC 88), Peripheral Vascular
Disease (HCC 108), and Diastolic Heart Failure
(HCC 85), and all are documented in the medical
record.
Risk Score Coefficient
Age/gender .288
CHF .368
DM w/ chronic complications .368
Prol. Diabetic Retinopathy .203
Disease Interaction .182
Total RAF Score 1.409
A 65 year old female with the following chronic
conditions: CHF (HCC85), DM with
complications (HCC18), Diabetic Proliferative
Retinopathy (HCC 122), all appropriately
documented in the medical record.
Result: 1.409 x $9,276.26 = $13,070.25
(Note: If only demographics were used payment would be
$2,671.58)
Example: Plans adjusted payment rate: $9,276.26
PAGE 14
COORDINATION OF BENCHMARK, BID, STARS,
REBATE
Milliman Report, Regulatory Oversight in Medicare Advantage, June 24, 2016
PAGE 15
NEW OPPORTUNITIES IN GP SPACE
Revenue up +6.4%
+3.4% change in payment by CMS
Modifications to risk adjustment
Benchmark increase by 5.28%
Improvements to star ratings
Flexible uniformity for additional benefits
Expansion of supplemental benefit offering
$
● CAPHS/HOS periodic surveying
● Promoting new benefits
● Social determinants
● Risk adjustment
● Medicaid
● Rich communication services (RCS)
● Consulting
© 2018 Revel
THANK YOU

1 - Understanding Medicare Star Ratings

  • 1.
  • 2.
    • Government programsfunded directly or contract with health plans for capitated programs (PMPM) • Government-sponsored programs biggest source of organic growth • Disruptive growth and share aggregation • Star Ratings, member experience, and risk adjustment drive the market • Variability and unpredictability in risk adjustment PAGE 2 OVERVIEW To understand the opportunity, need to understand framework, requirements, and how to leverage changes in regulations to benefit product
  • 3.
    PAGE 3 NEW GUIDANCEFOR OPPORTUNITIES IN GP SPACE Revenue up +6.4% +3.4% change in payment by CMS Modifications to risk adjustment Benchmark increase by 5.28% Improvements to star ratings Flexible uniformity for additional benefits Expansion of supplemental benefit offering $
  • 4.
    PAGE 4 • Whydoes this matter: • Plans want to make money • One way is through increased enrollment • Enrollment is influenced by a number of factors but 1 is benefits offered/engagement activities • Benefits are heavily dependent on star ratings • Plans are paid based on their bid. • Payment varies between local and regional plans. • Benchmarks are set and it is the maximum a plan will be paid. Bids and payments are derived off the benchmarks. • Star Ratings provide the ability for plans to receive a bonus added to the benchmark. • Risk Adjustment provides additional reimbursement for a plan that assumes a sicker population. COMPONENTS TO HOW PLANS ARE PAID
  • 5.
    PAGE 5 THE PLANBID AND CALENDAR • Plans projection of what it will cost to cover a single beneficiary (with a risk score) each month. • CMS analyzes for actuarial soundness Milliman Report, Regulatory Oversight in Medicare Advantage, June 24, 2016
  • 6.
    PAGE 6 PLAN PAYMENT:BID AND BENCHMARK Grade Target Plan Bid ($) Grade Target Plan Bid ($) Shopping spree Shopping spree New Car (Bonus (5%))Actual Grade (benchmark) Actual Grade (Bonus-Adjusted ($)) Original 5% 65% 75% Scenario: Parents reward for grades exceeding target More chores Actual Grade Grade target Actual grade below grade goal Actual grade meets or exceeds goal
  • 7.
    PAGE 7 PLAN PAYMENT:BID AND BENCHMARK Plan Bid ($) Plan Bid ($) Rebate Bonus Payment (5%)CMS Benchmark ($) New Benchmark Bonus-Adjusted ($) CMS Benchmark +5% 65% 75% Rebate Charge Premium Original Benchmark ($) Plan Bid Bid above benchmark Bid below benchmark
  • 8.
    PAGE 8 • Annualratings of Medicare plans that are made available on Medicare Plan Finder and CMS website • 2 year data lag; 2017 ratings represent 2015 performance • Ratings are displayed as 1 to 5 stars • Almost 2/3 of Medicare Advantage enrollees are in contracts with ratings of 4 or more stars OVERVIEW OF STAR RATINGS Overall Summary Domains Measure • <4-Star plans on life support • ≤3-Star plans dead • 1/2 Star = ~ $15-$50 PMPM
  • 9.
    PAGE 9 THE MEMBEREXPERIENCE: COMPRISE HALF OF RATINGS Rating of the Plan Rating of Health Care/Providers Rating of the Drug Plan
  • 10.
    PAGE 10 STAR RATINGIMPACT/IMPLICATIONS $700 (3 star) $700 (4 star) Original Benchmark +5% Rebate $700 (3.5 star) Benchmark $800 Rebate Star rating QBP % MA Benchmark Savings Rebate Percentage MA Rebate 3 0% $800 $100 50% $50 Benchmark $800 Rebate 3.5 0% $800 $100 65% $65 4 5.0% $840 $140 65% $91 New Benchmark $840 $700 (5 star) Rebate New Benchmark $840 5 5.0% $840 $140 70% $98 Bid Example Plan: $700 bid amount, MA benchmark of $800
  • 11.
    PAGE 11 STAR RATINGIMPACT/IMPLICATIONS Plan: $700 bid amount, MA benchmark of $800 Overall Star Rating Formula 3.0 Stars or Lower 3.5 Stars New/Low Enrollment 4.0 Stars 4.5 Stars or Higher Bid Amount A $700 $700 $700 $700 $700 QBP Percentage B 0% 0% 3.5% 5.0% 5.0% MA Benchmark C = $800 x (1+B) $800 $800 $828 $840 $840 Savings D = C-A $100 $100 $128 $140 $140 Rebate Percentage E 50% 65% 65% 65% 70% MA Rebate F = DxE $50 $65 $83 $91 $98 • The impact of dropping from a 3.5 star rating to a 3.0 is a 23% reduction in MA rebate revenue (resulting in benefit reductions or member premium increases) • The impact of dropping from a 4.0 star rating to a 3.5 results is a 29% reduction in MA rebate revenue • Marketing o CMS displays star ratings on the Medicare Plan Finder where beneficiaries shop for plans o CMS labels certain plans with a “Low Performing Icon” or “High Performing Icon” o Plans with five-star ratings can enroll beneficiaries throughout the year rather than only during open enrollment
  • 12.
    PAGE 12 Key Sourceof Plan Revenue • Accounts for ~30% of variation in payment to MA plans • Similar methodologies adopted in Medicaid • Diagnostic code-driven provider; goal is complete and accurate data Prospective Evaluations • Opportunity to identify eligible early before encounter information; link home visit data with care management programs, PCPs • Move to “mobile medical home”: in-home labs, tests, MTM, caregiver education • Diagnostic code verification RISK ADJUSTMENT IN GOVERNMENT PROGRAMS
  • 13.
    MEDICARE RISK ADJUSTMENTIMPACT • Medicare payments capitated rate = base $ amount x beneficiary-specific risk score (from HCC model of demographic and condition) Risk Score Coefficient Age/gender .683 Angina .141 PVD .299 Diastolic HF .368 Total RAF Score 1.491 Result: 1.491 x $9,276.26 = $14,830.90 An 88 year old male has the following chronic conditions: Angina (HCC 88), Peripheral Vascular Disease (HCC 108), and Diastolic Heart Failure (HCC 85), and all are documented in the medical record. Risk Score Coefficient Age/gender .288 CHF .368 DM w/ chronic complications .368 Prol. Diabetic Retinopathy .203 Disease Interaction .182 Total RAF Score 1.409 A 65 year old female with the following chronic conditions: CHF (HCC85), DM with complications (HCC18), Diabetic Proliferative Retinopathy (HCC 122), all appropriately documented in the medical record. Result: 1.409 x $9,276.26 = $13,070.25 (Note: If only demographics were used payment would be $2,671.58) Example: Plans adjusted payment rate: $9,276.26
  • 14.
    PAGE 14 COORDINATION OFBENCHMARK, BID, STARS, REBATE Milliman Report, Regulatory Oversight in Medicare Advantage, June 24, 2016
  • 15.
    PAGE 15 NEW OPPORTUNITIESIN GP SPACE Revenue up +6.4% +3.4% change in payment by CMS Modifications to risk adjustment Benchmark increase by 5.28% Improvements to star ratings Flexible uniformity for additional benefits Expansion of supplemental benefit offering $ ● CAPHS/HOS periodic surveying ● Promoting new benefits ● Social determinants ● Risk adjustment ● Medicaid ● Rich communication services (RCS) ● Consulting
  • 16.