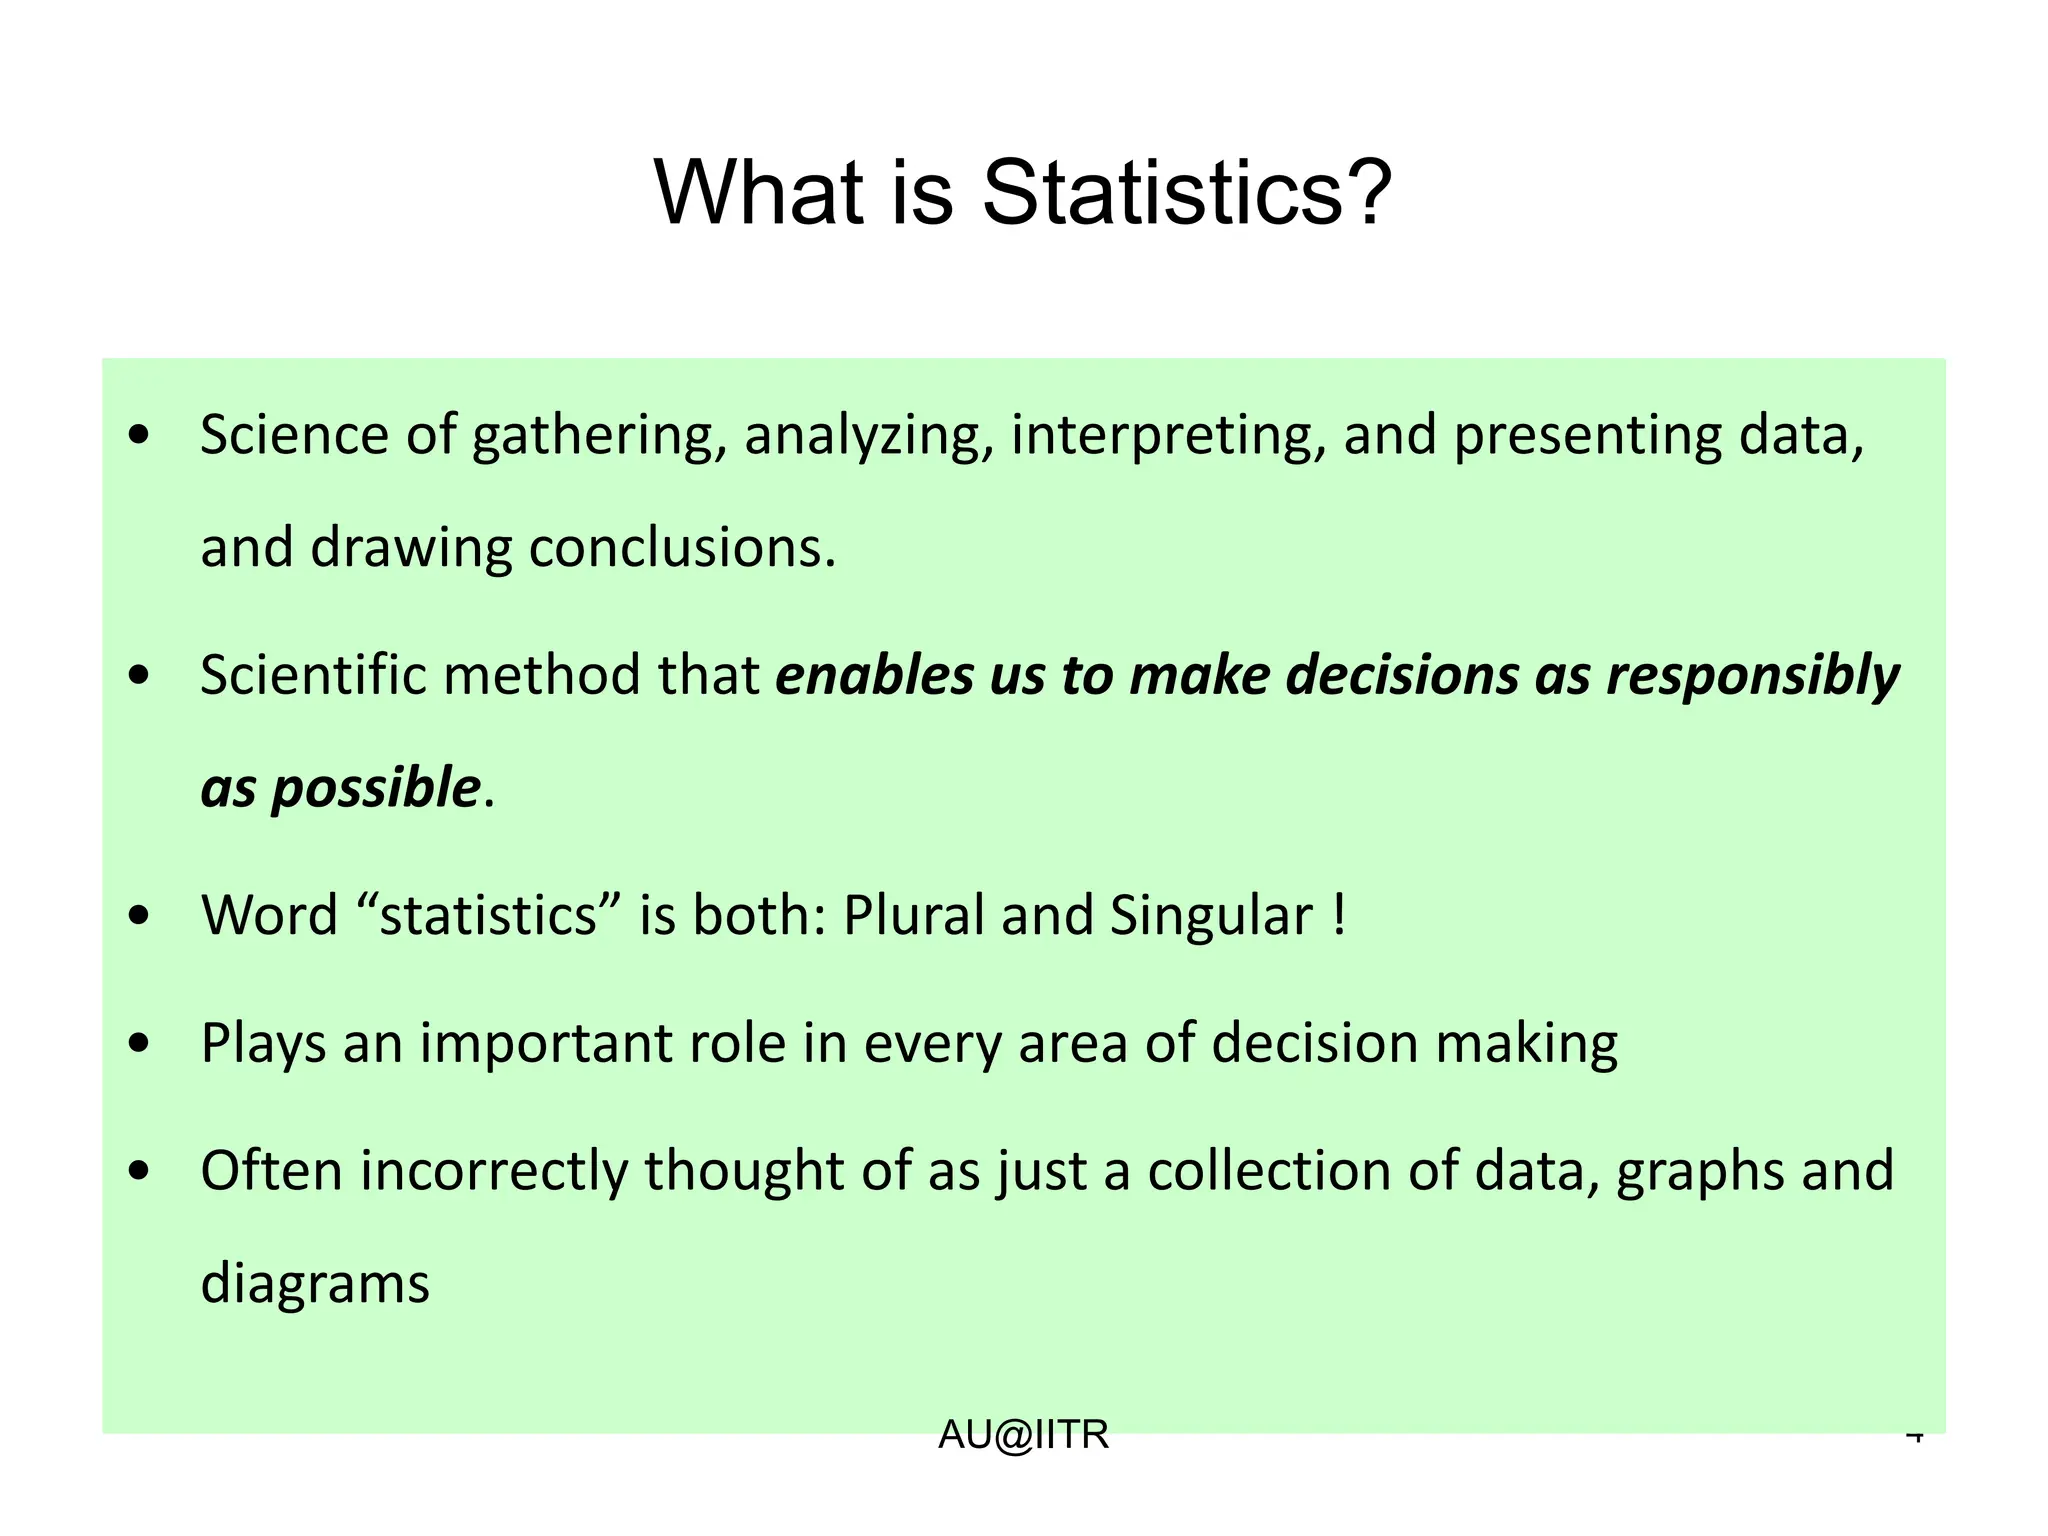
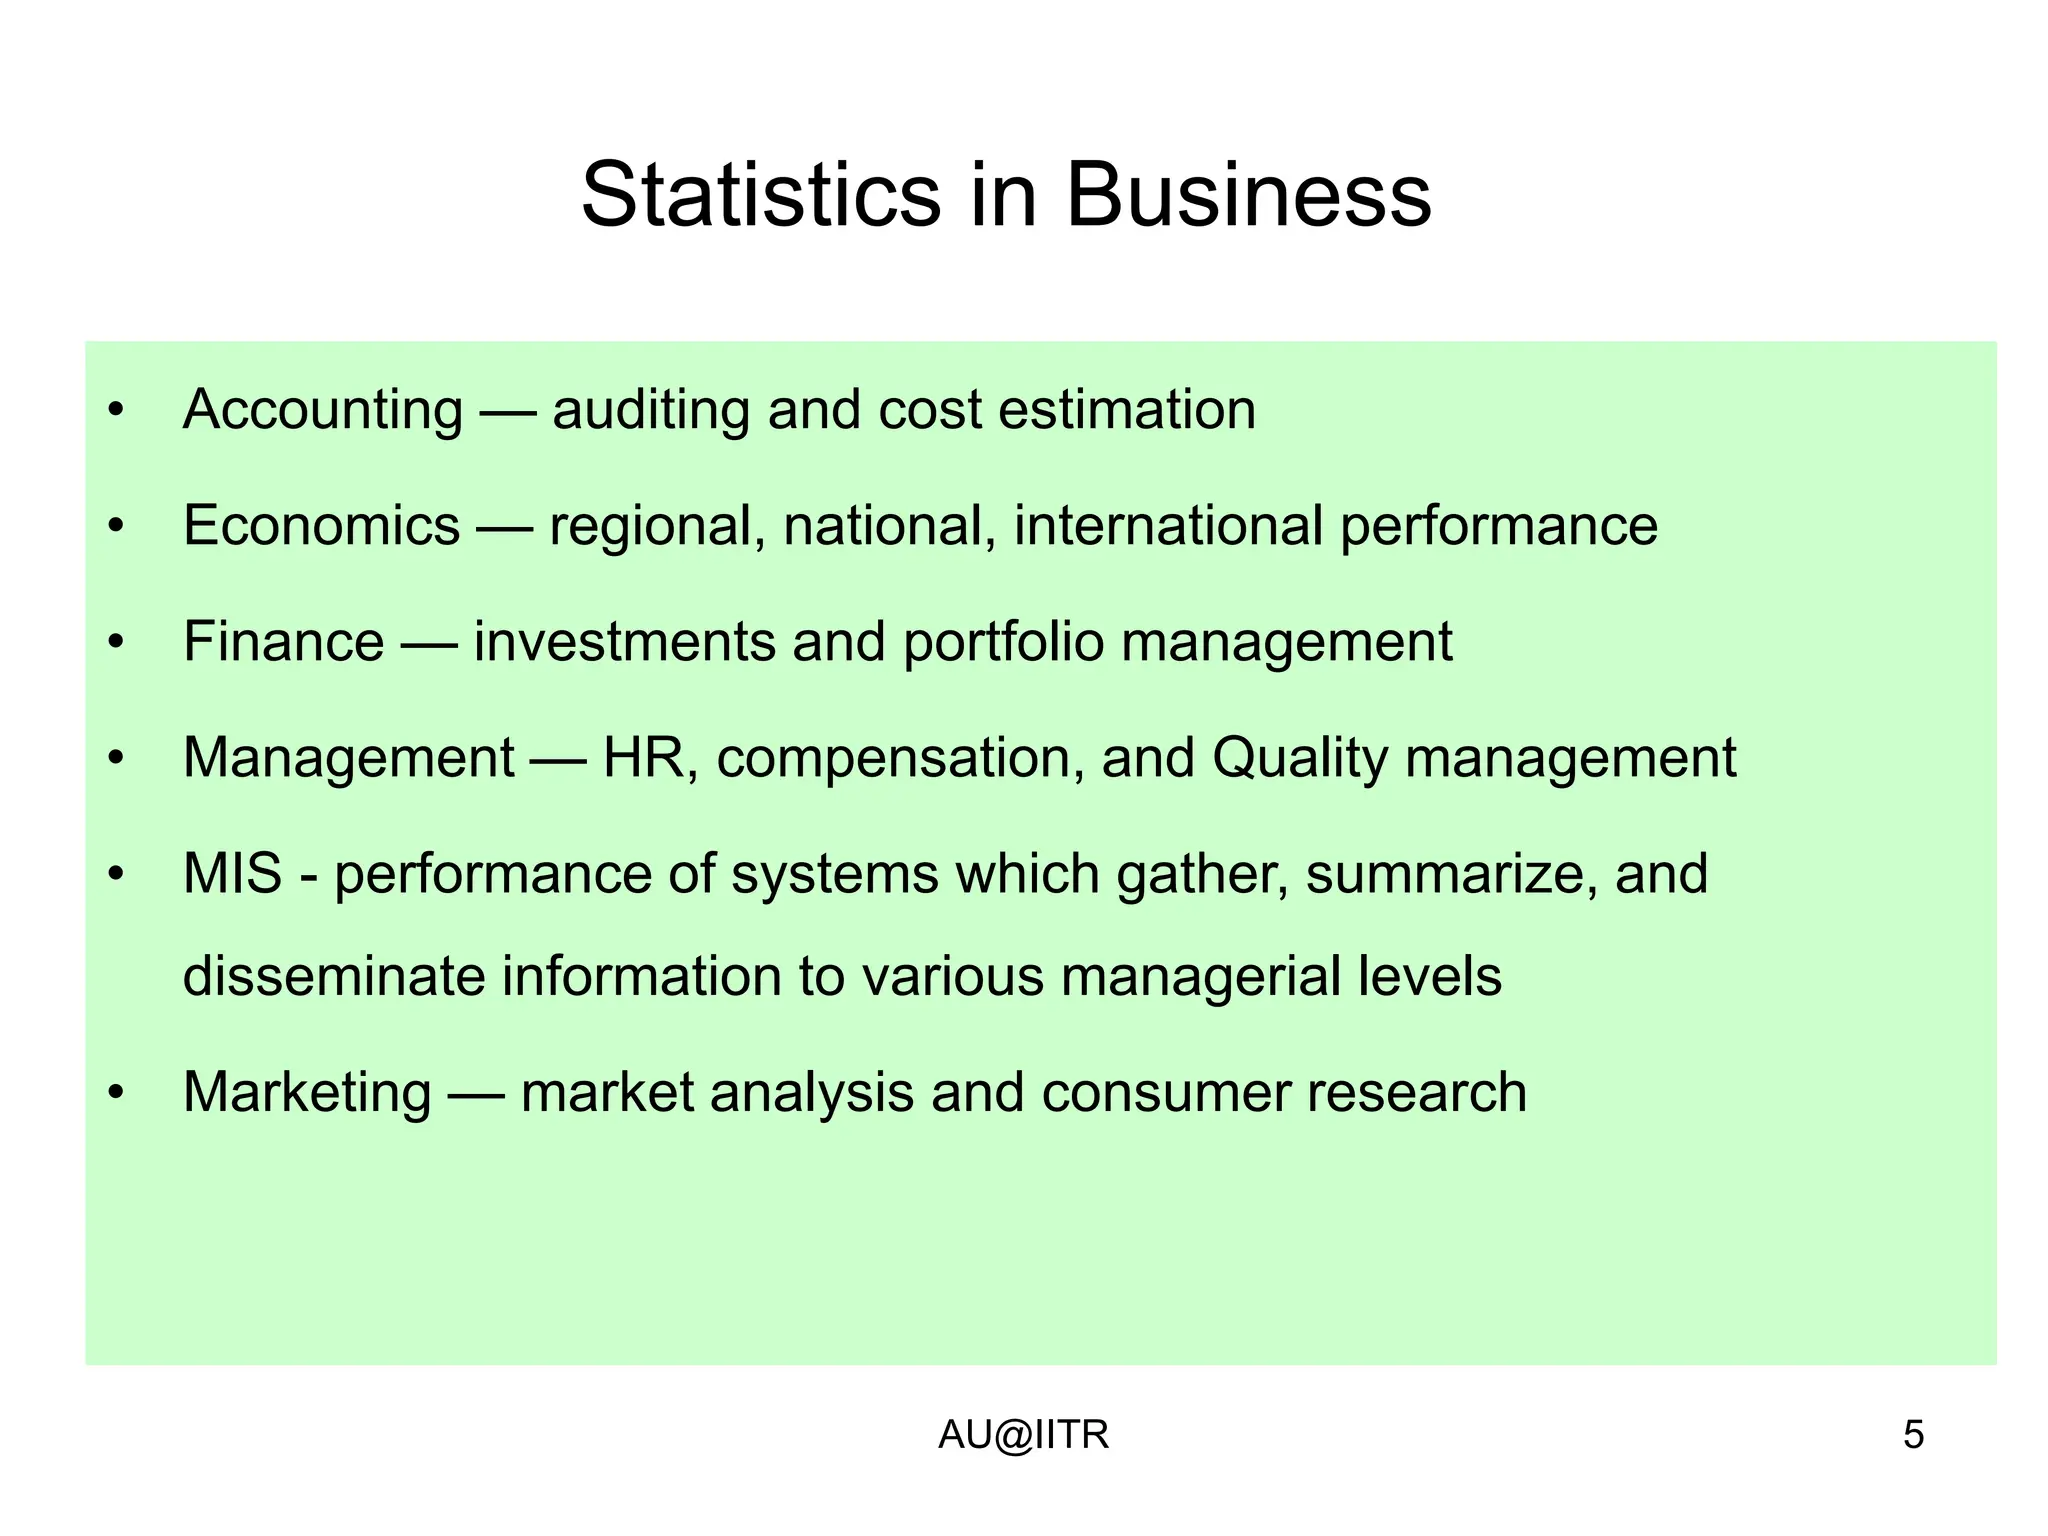
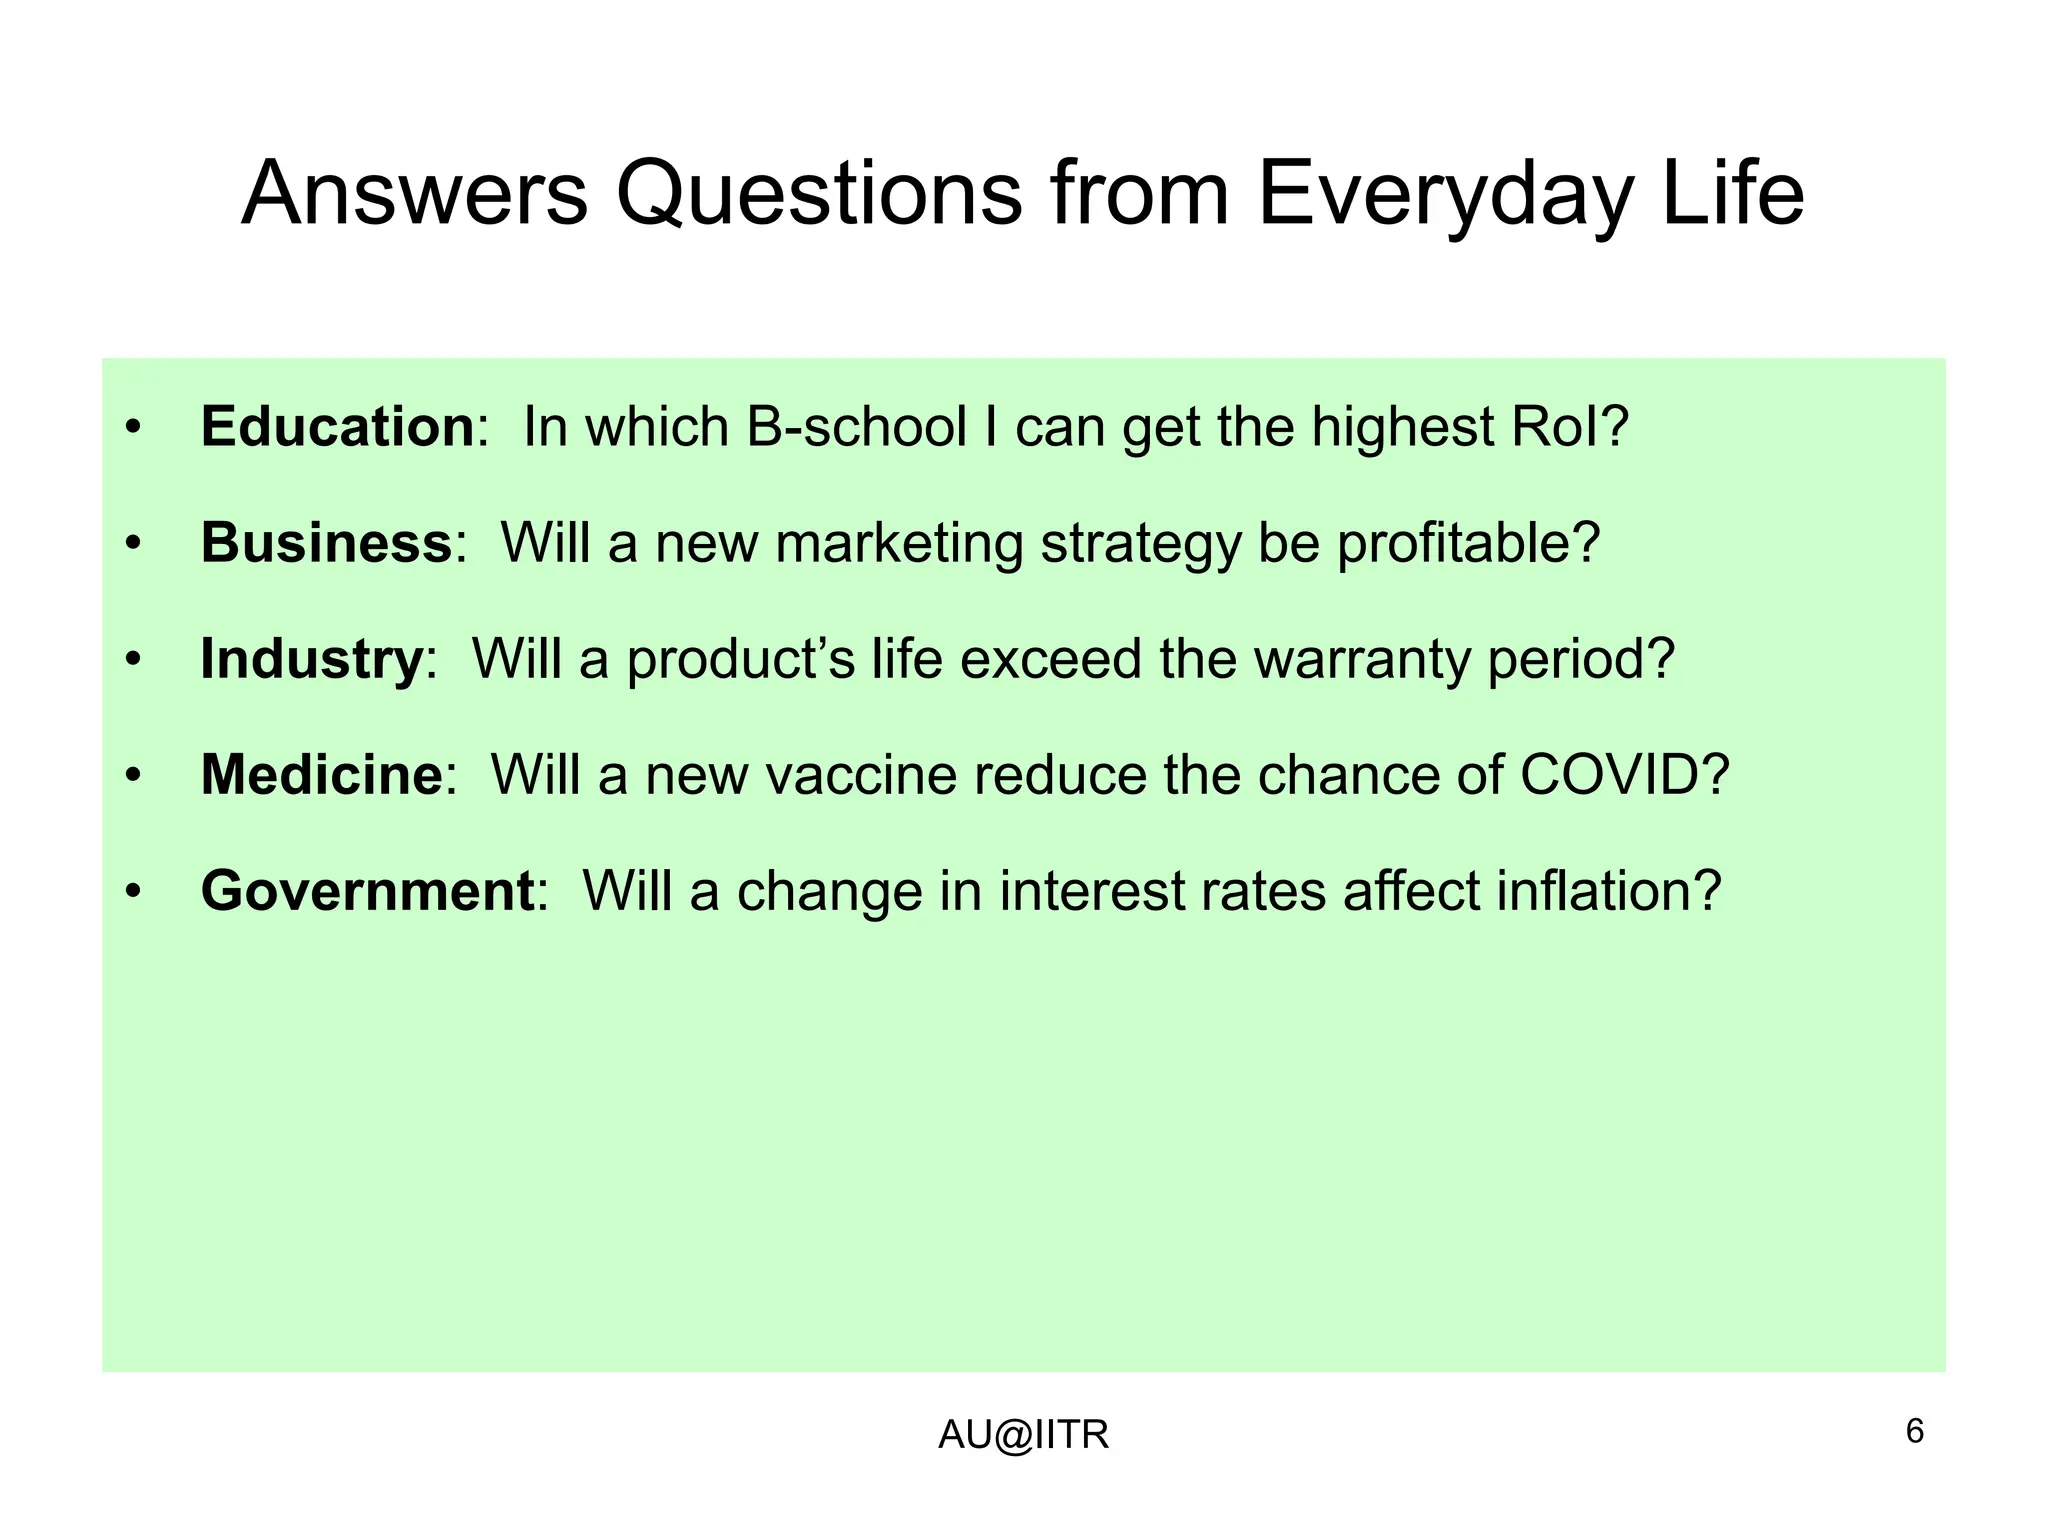
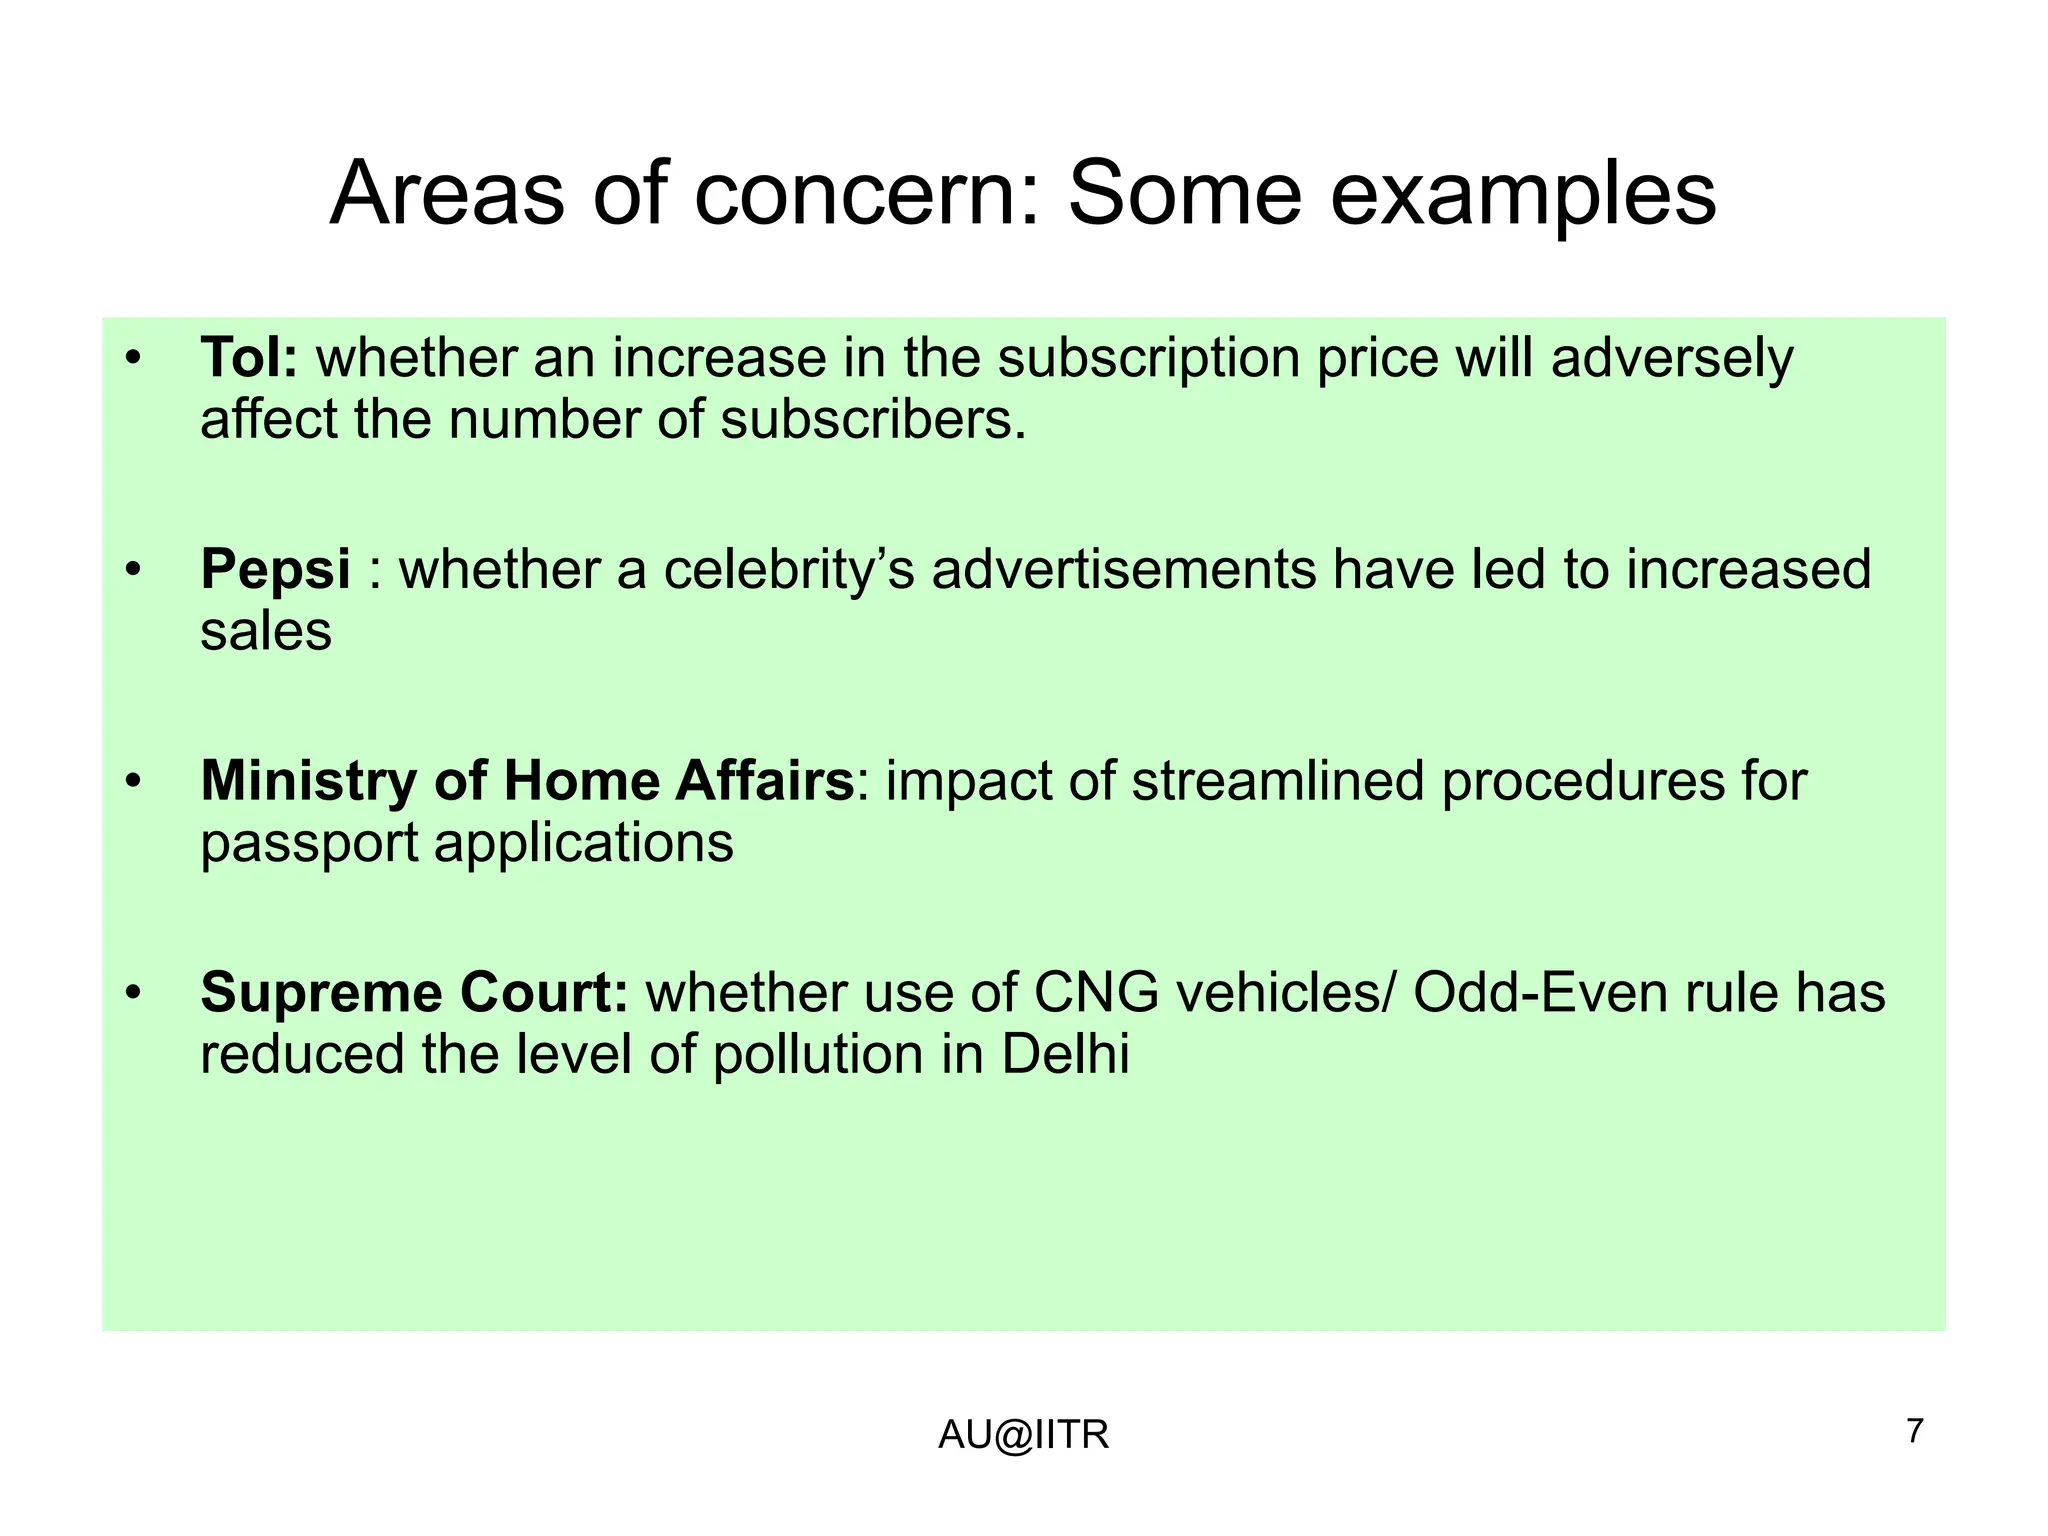
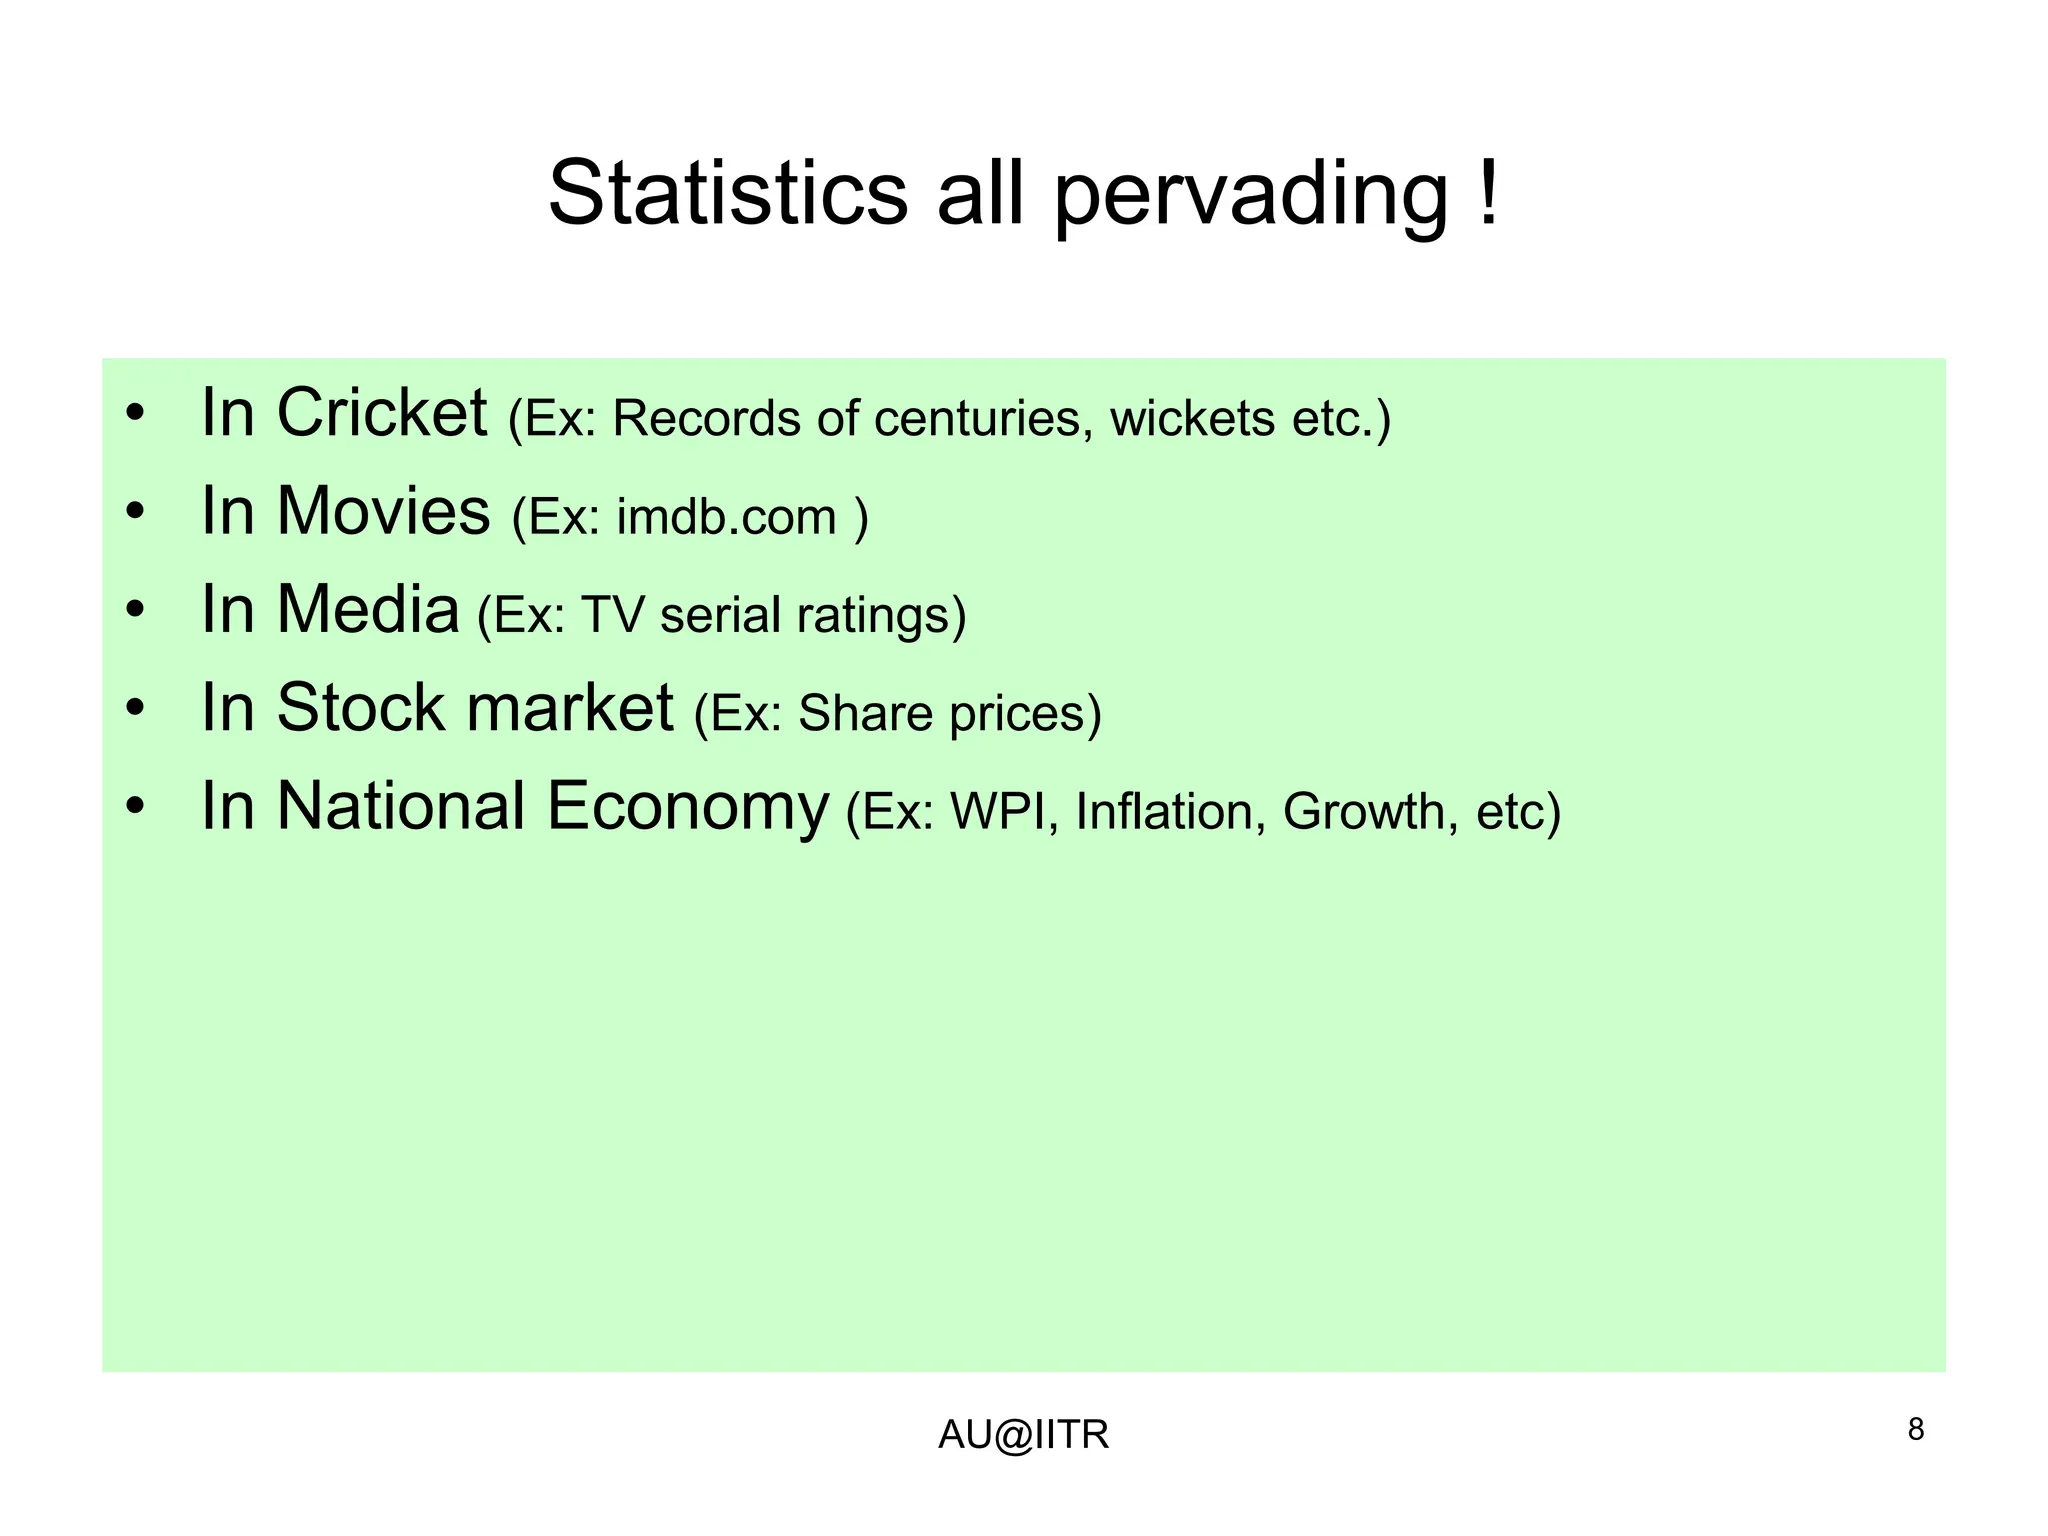
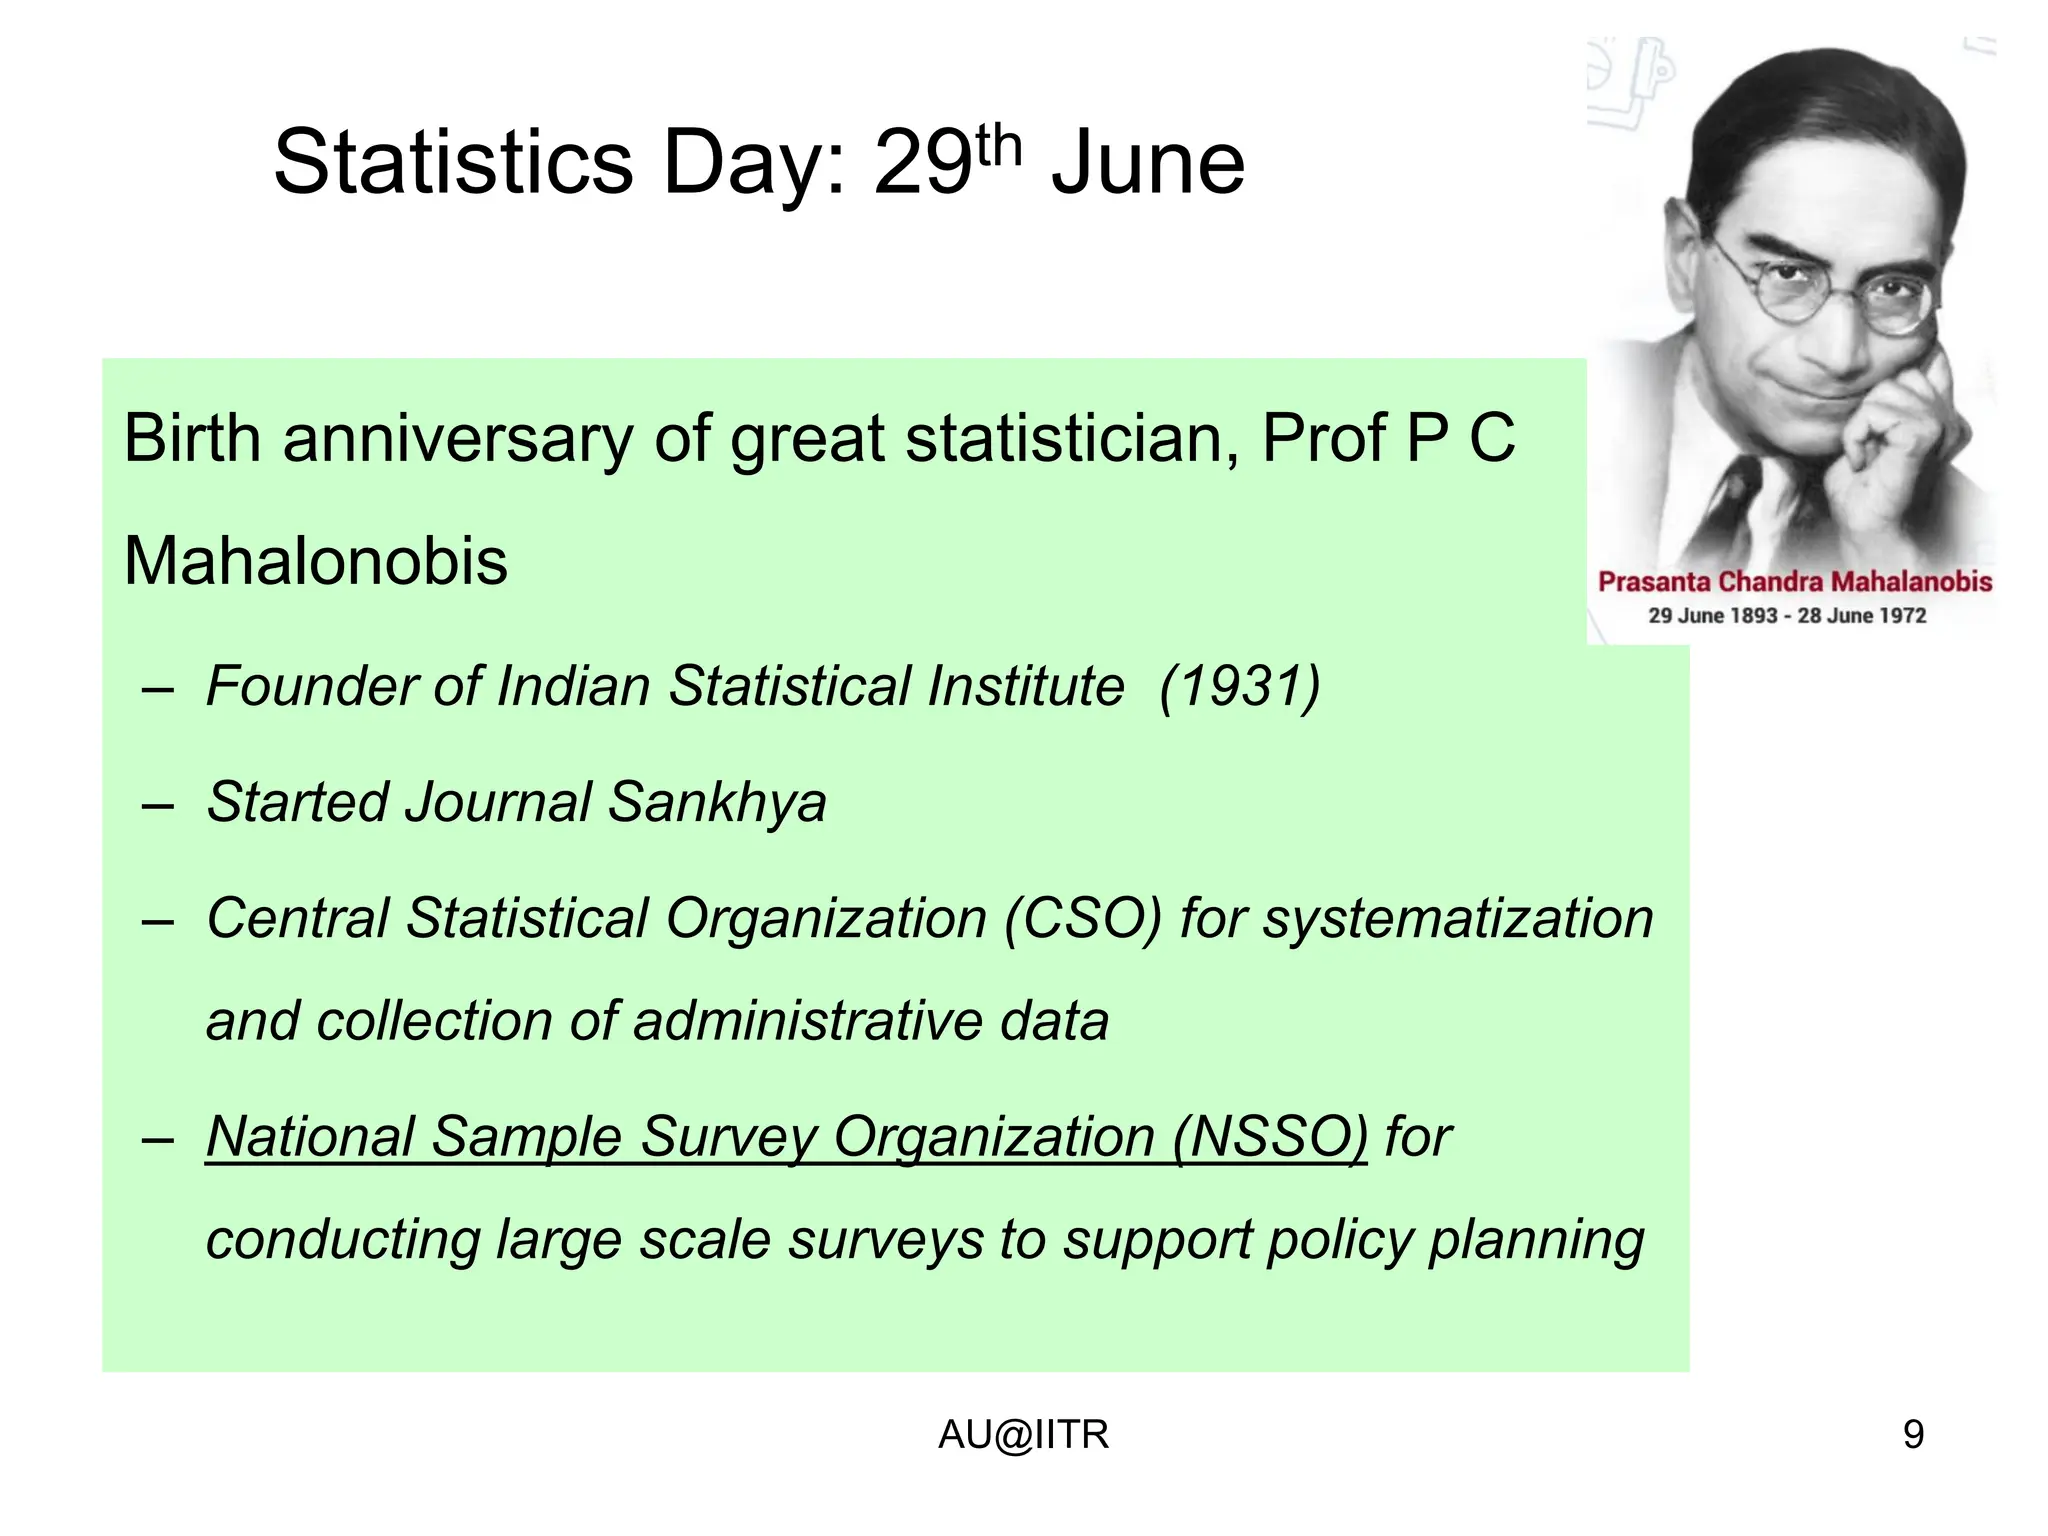
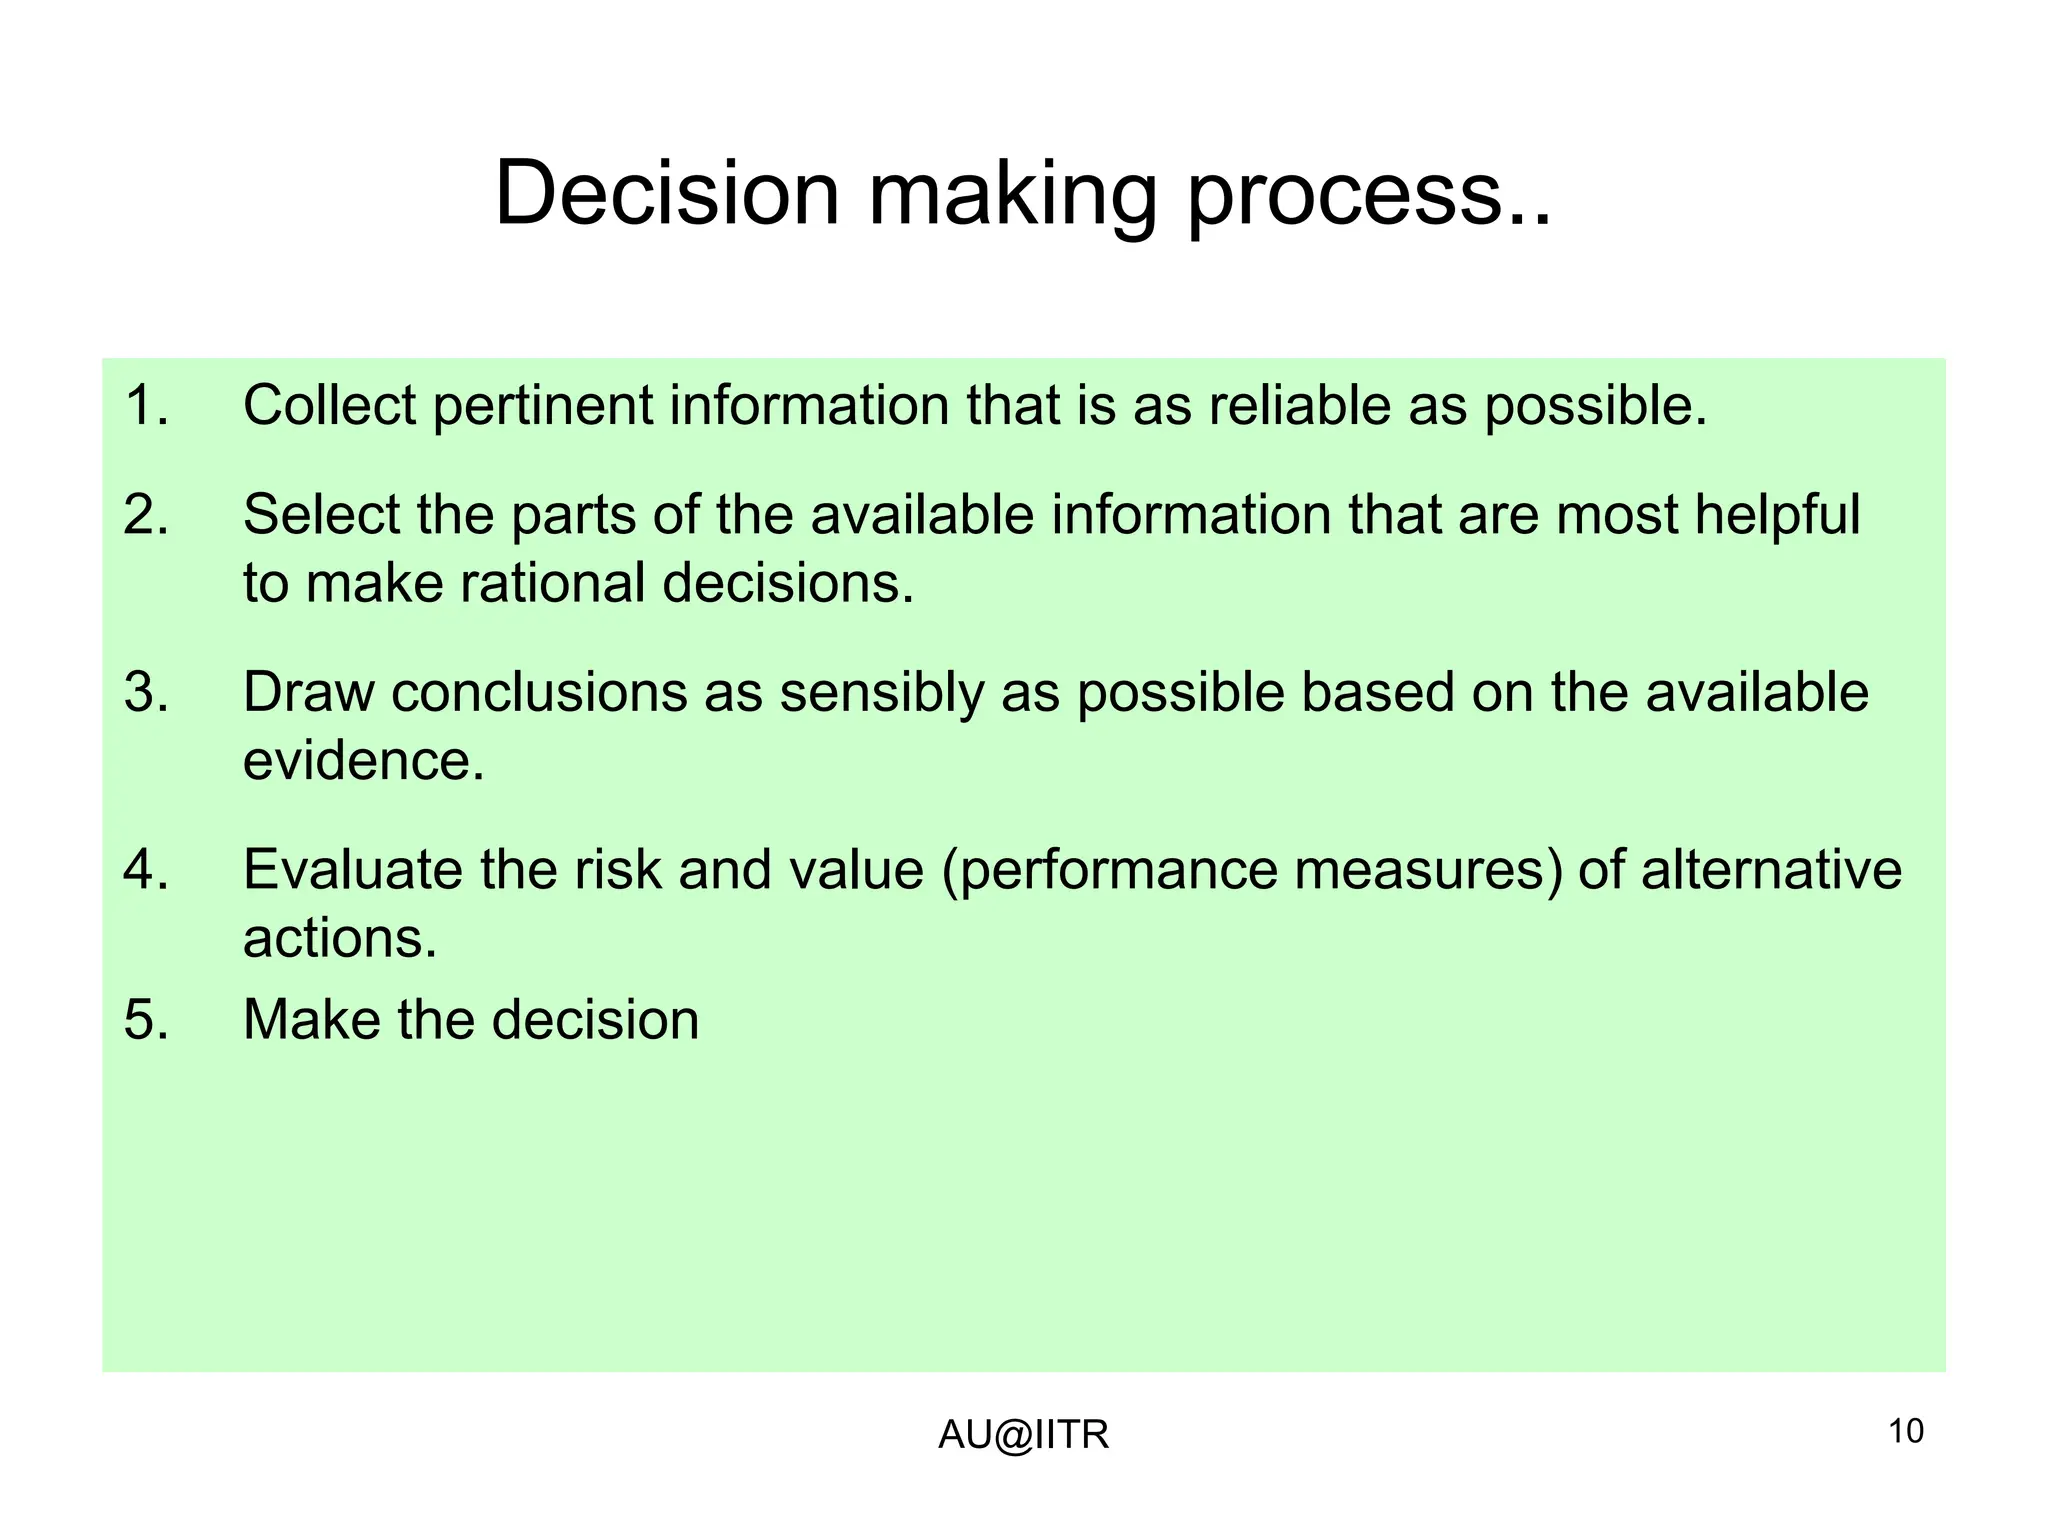
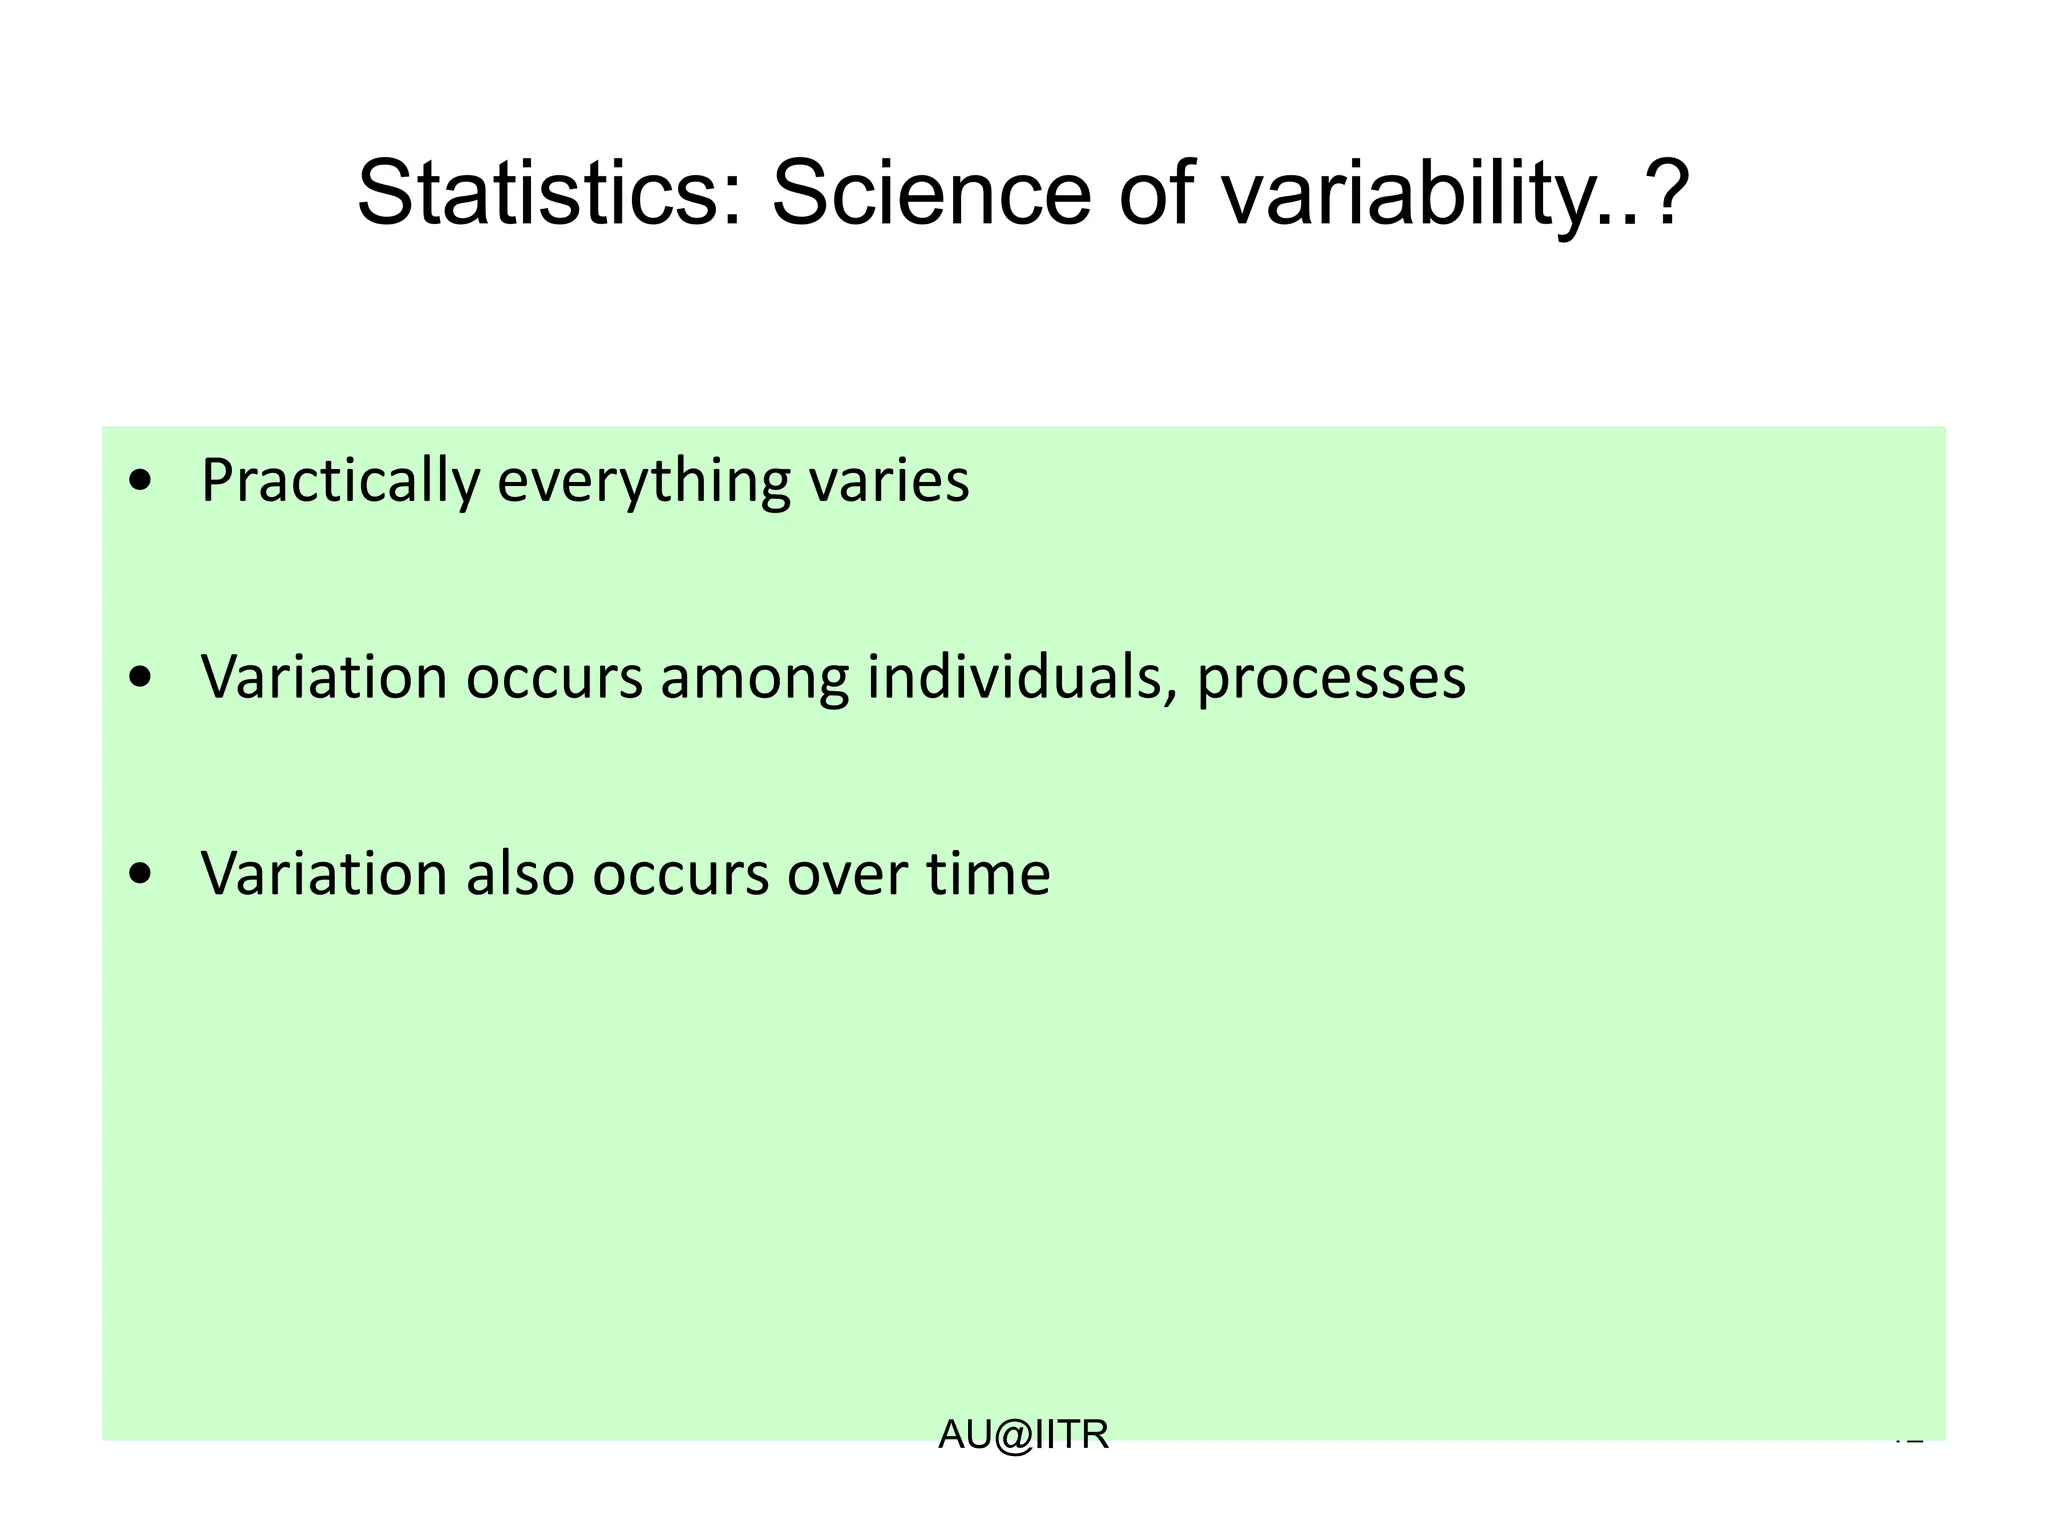
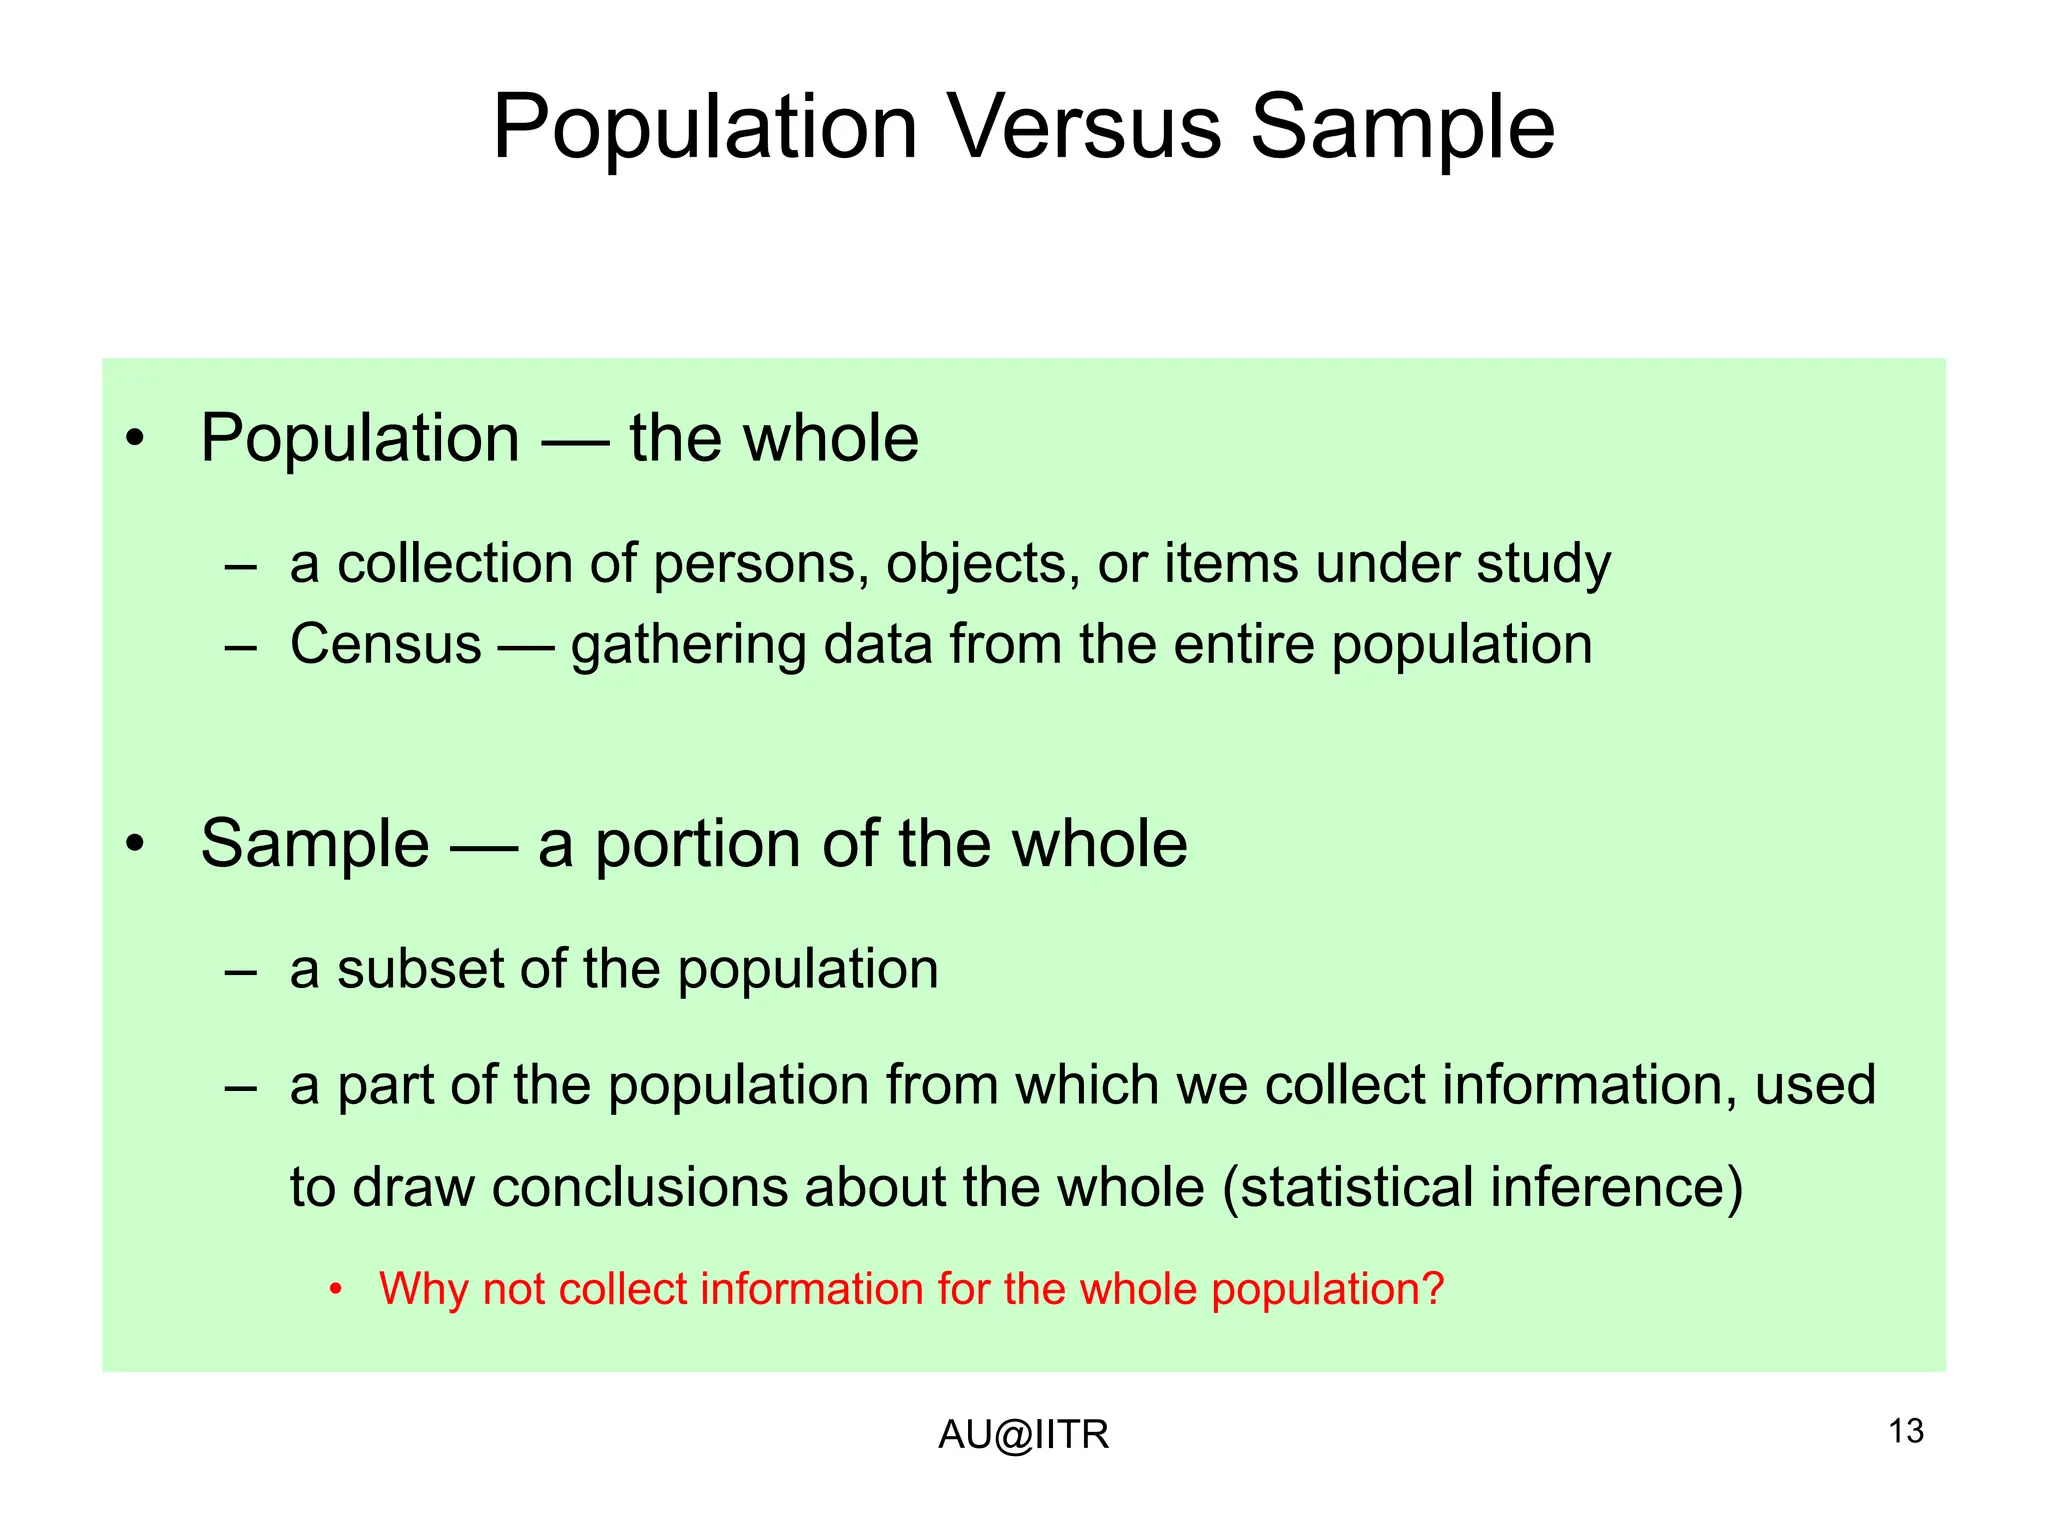
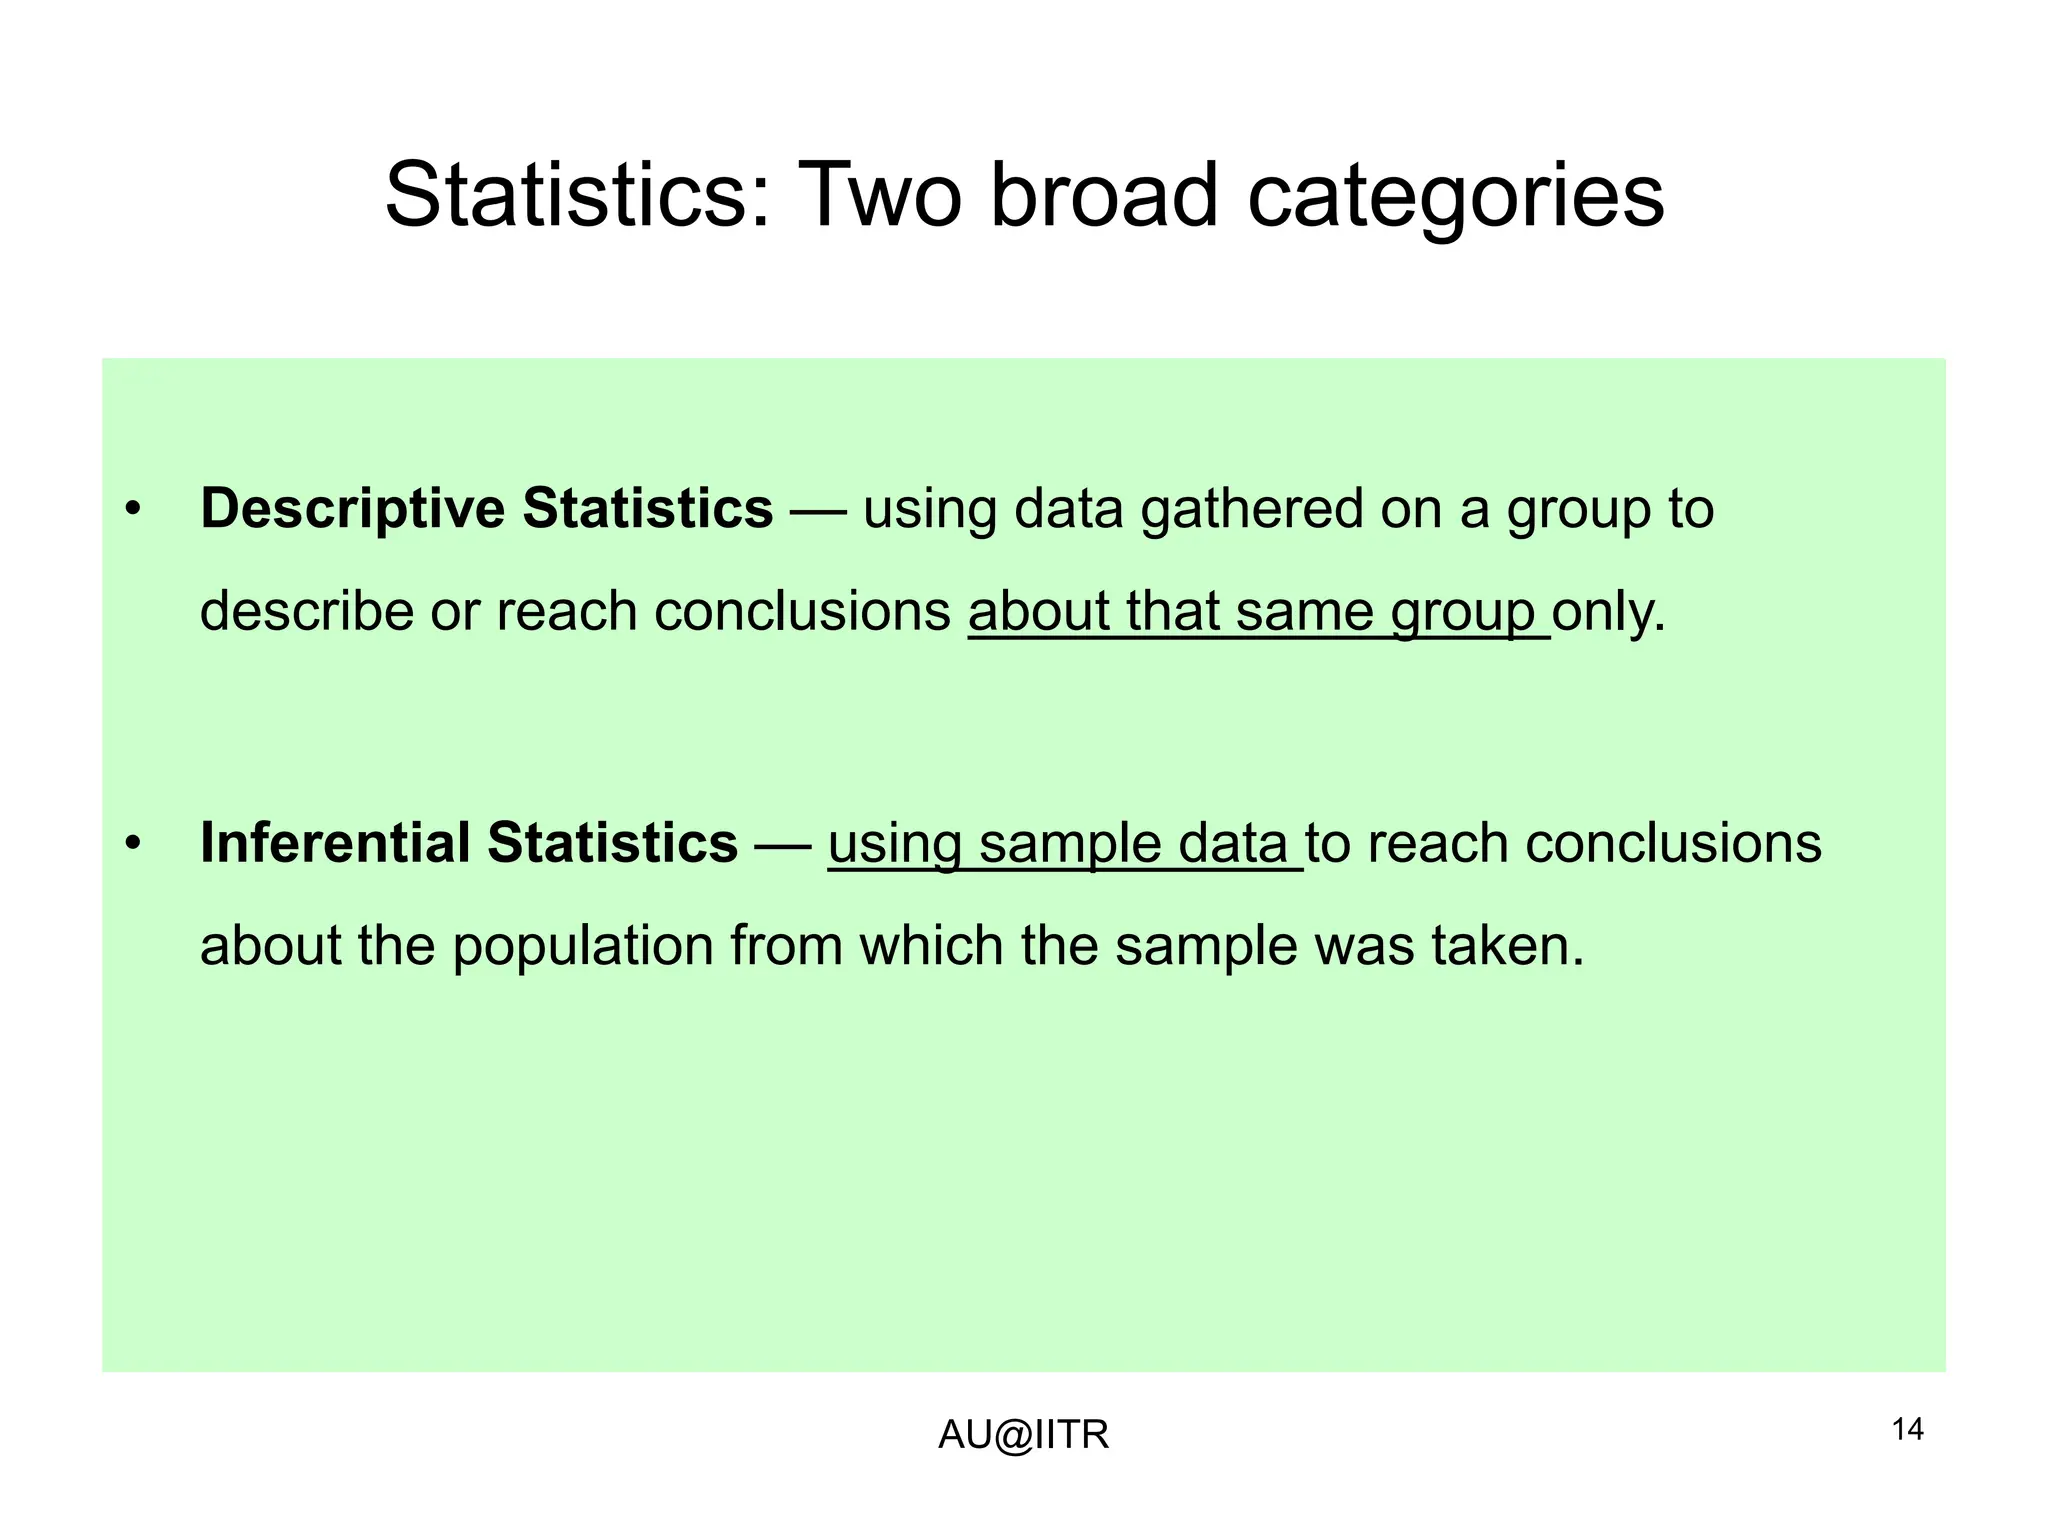
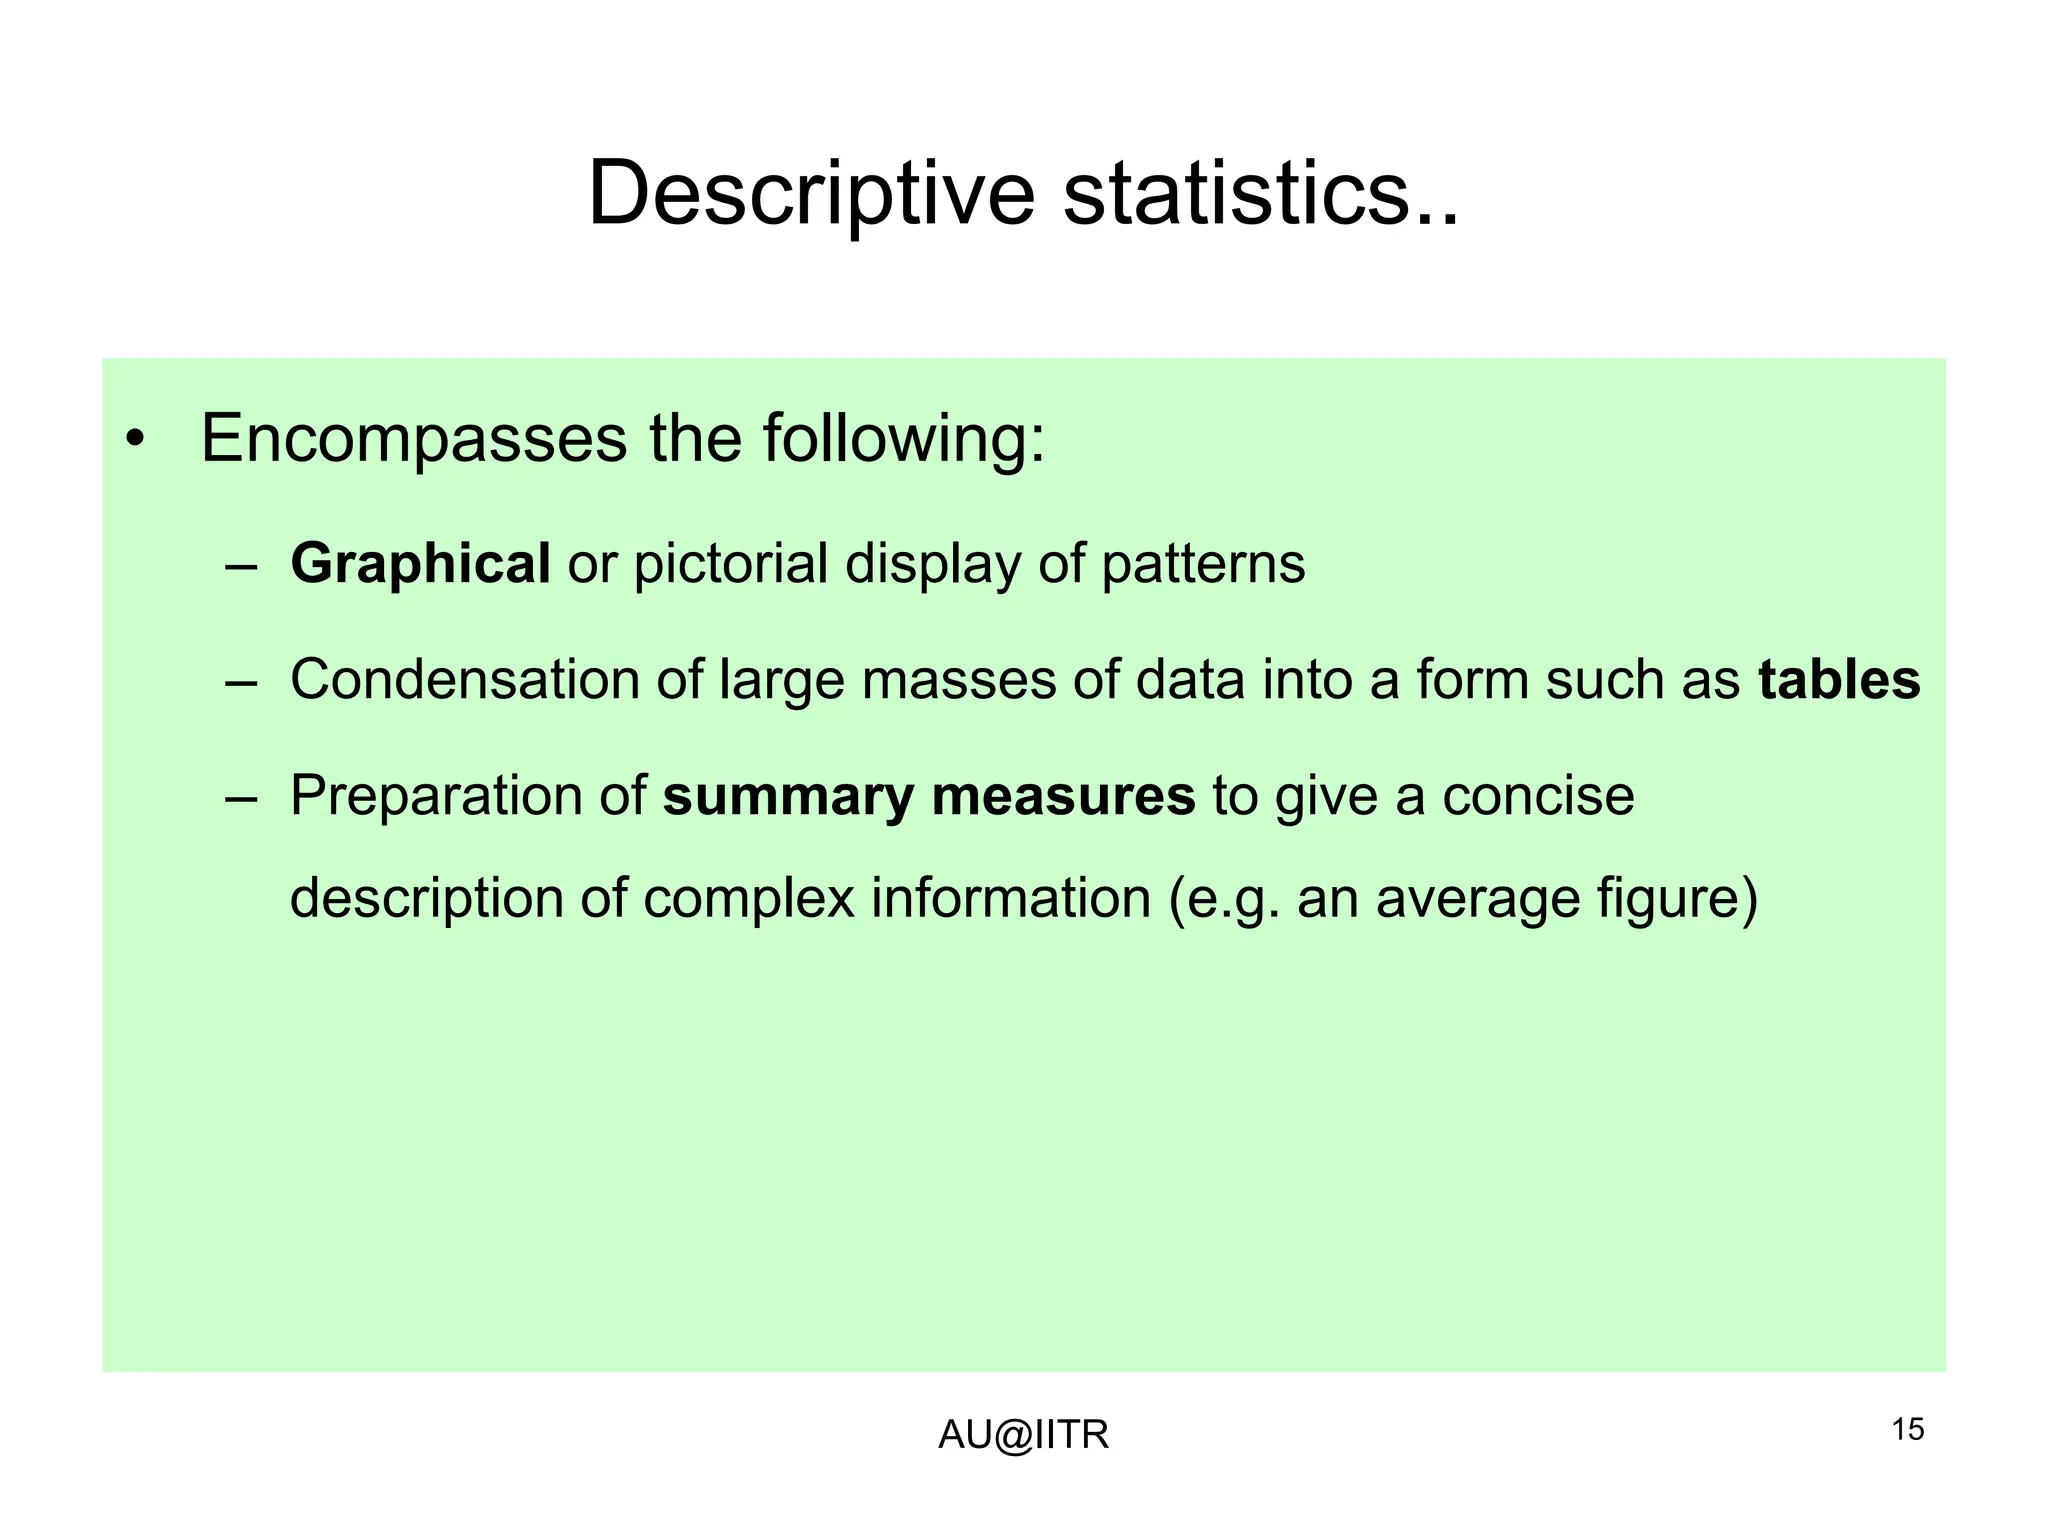
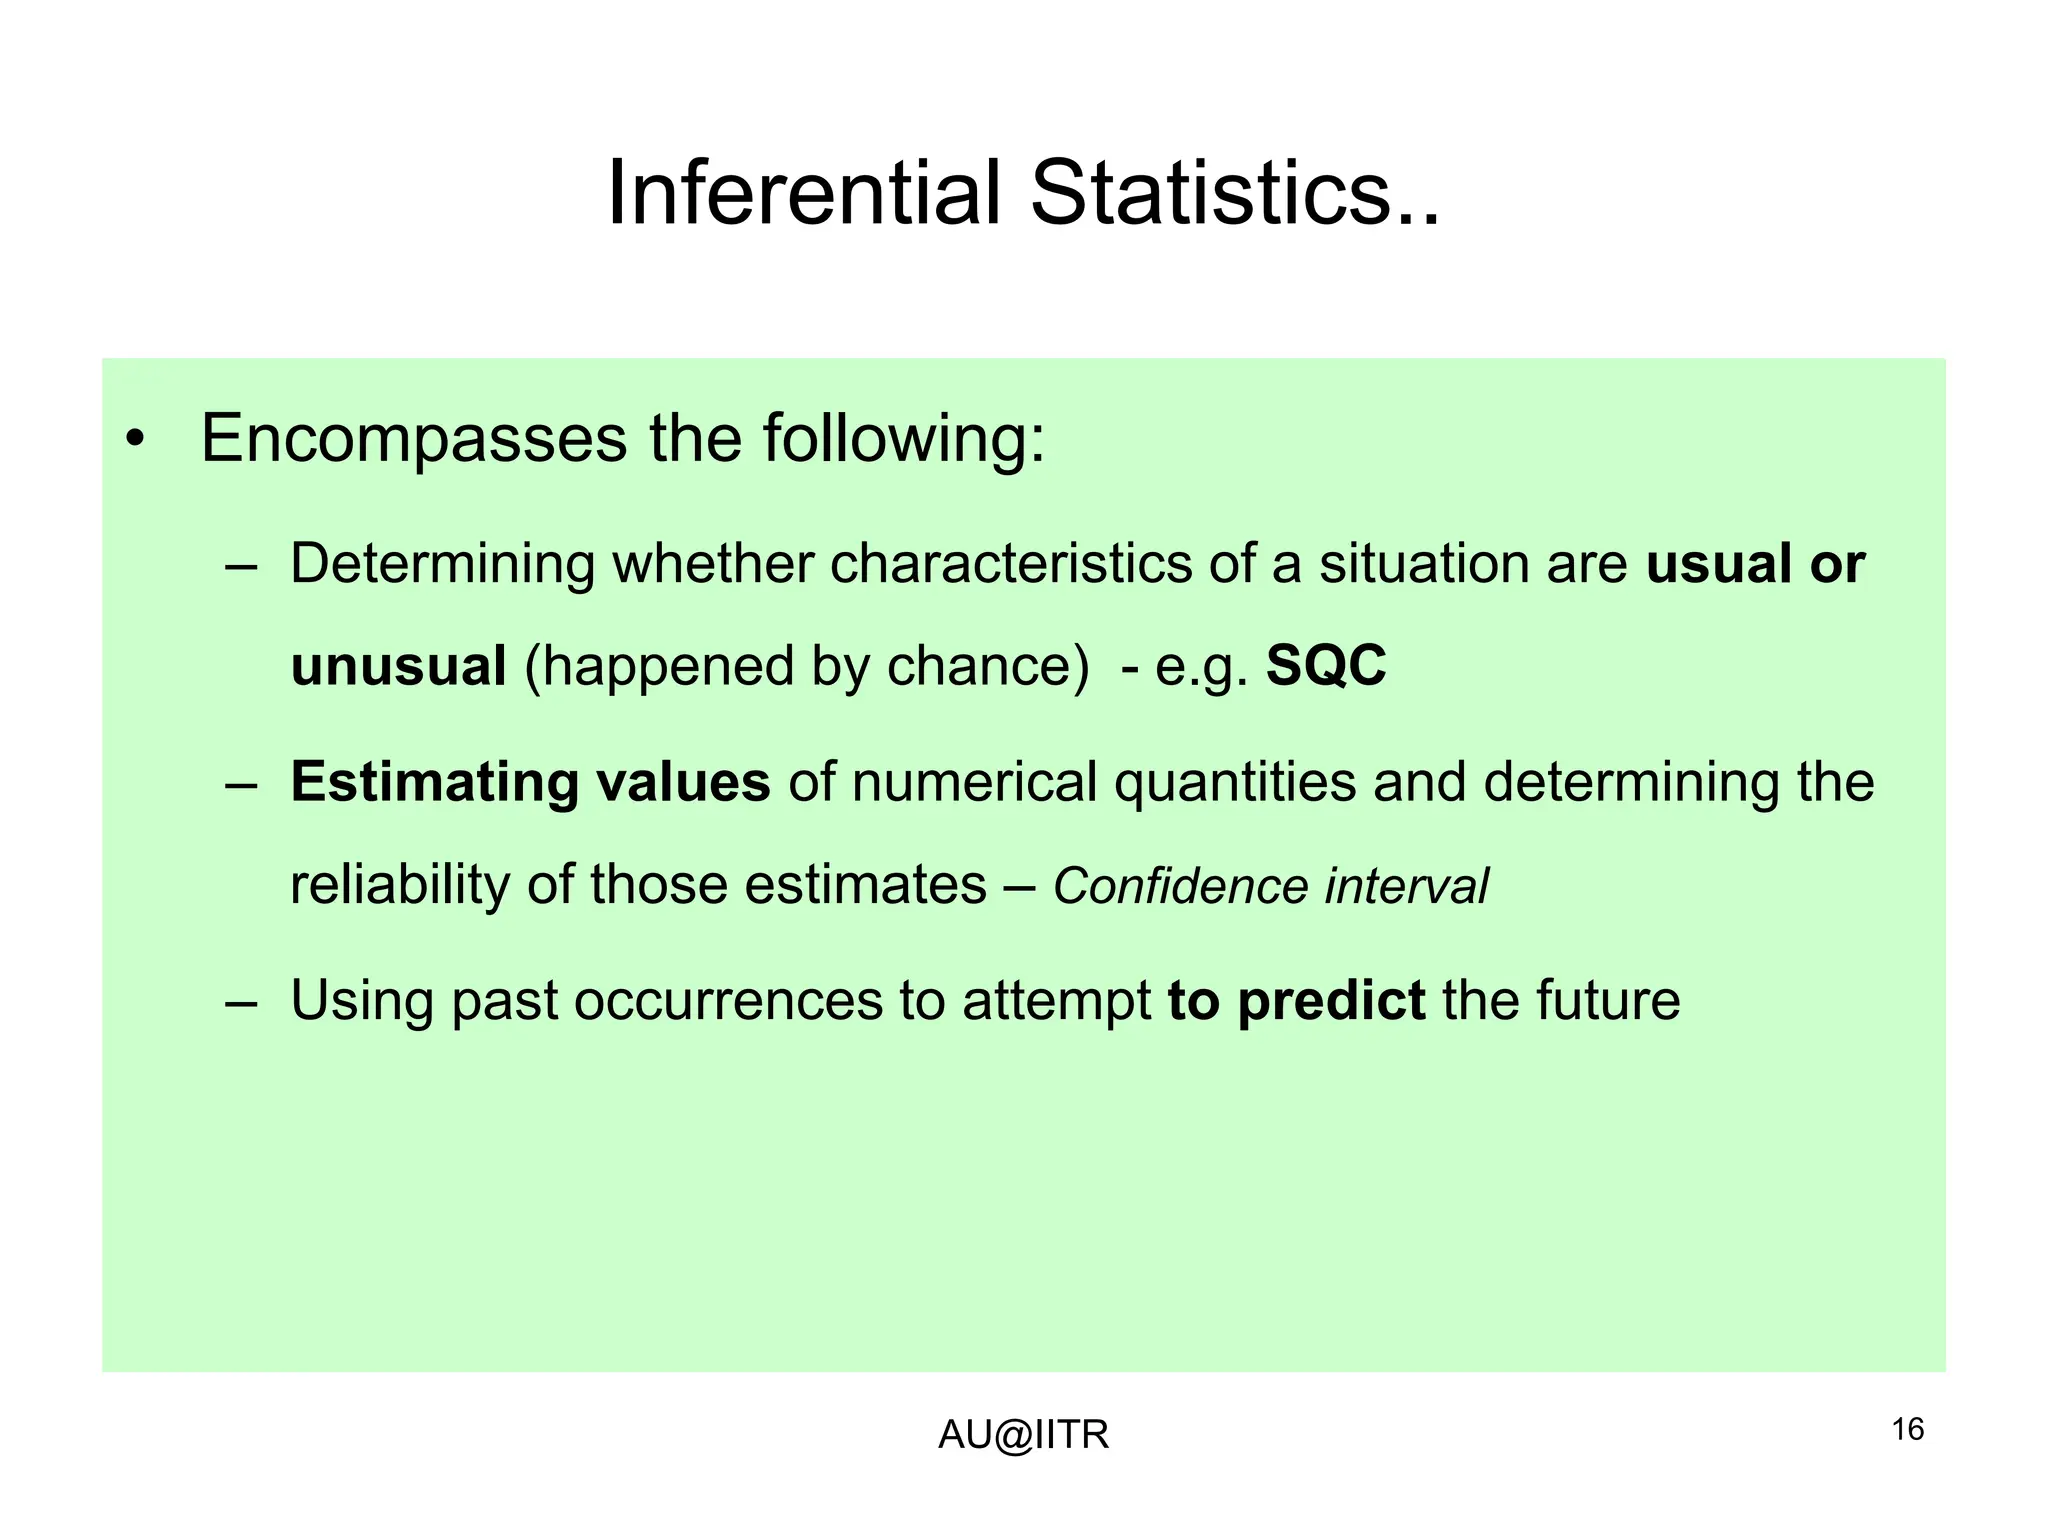
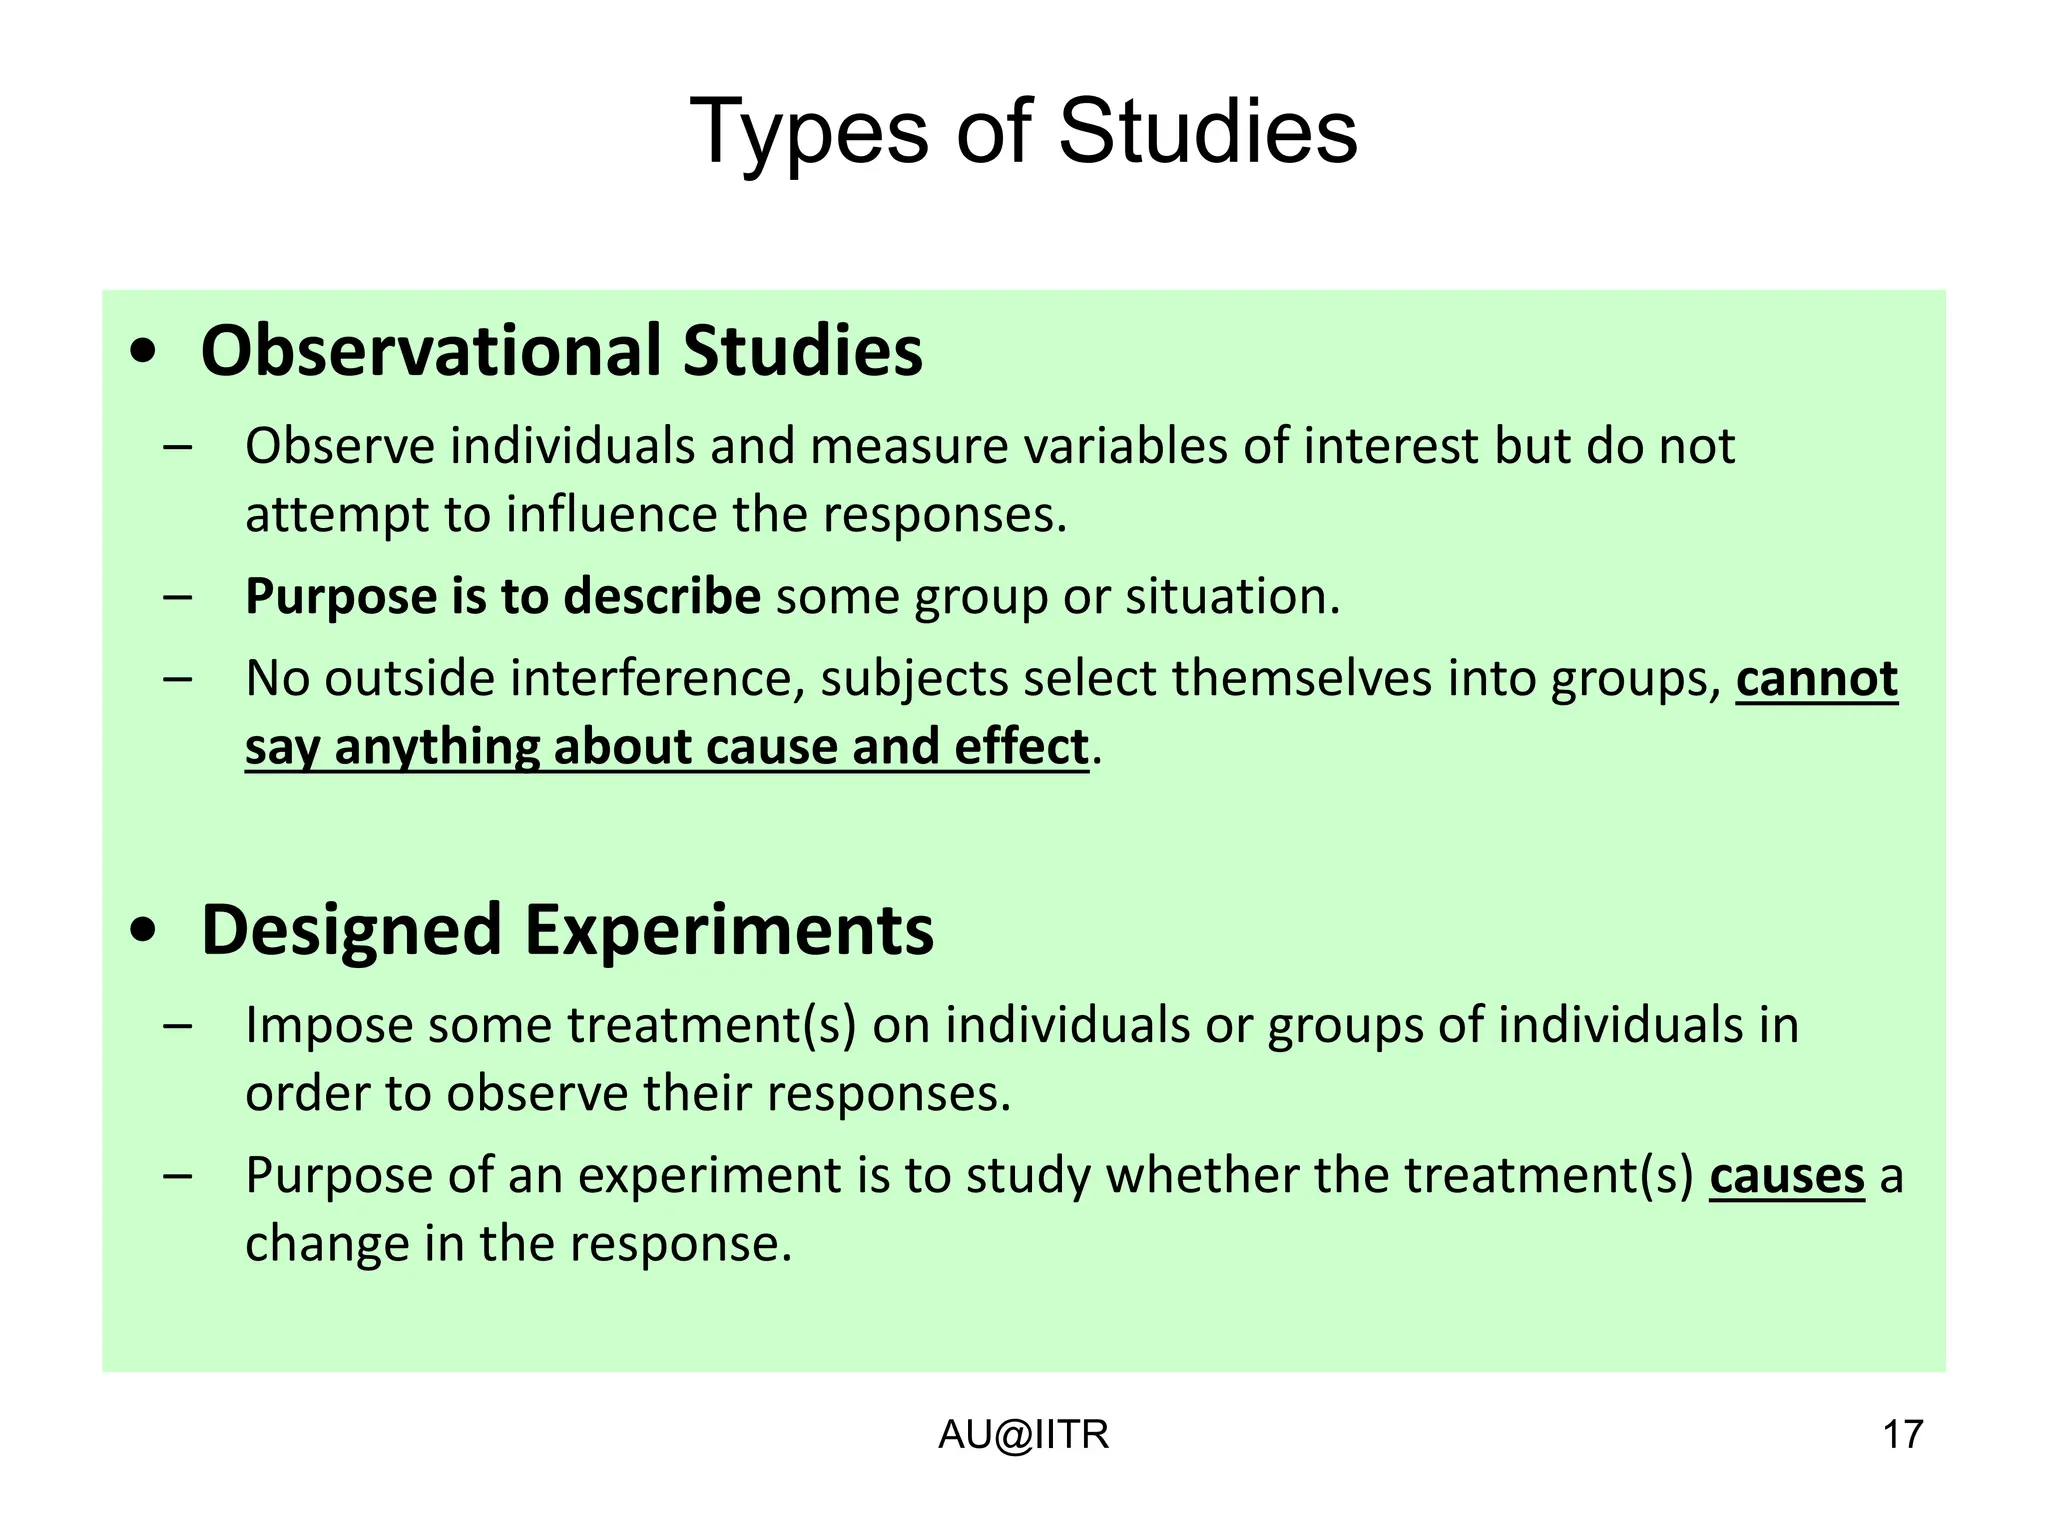
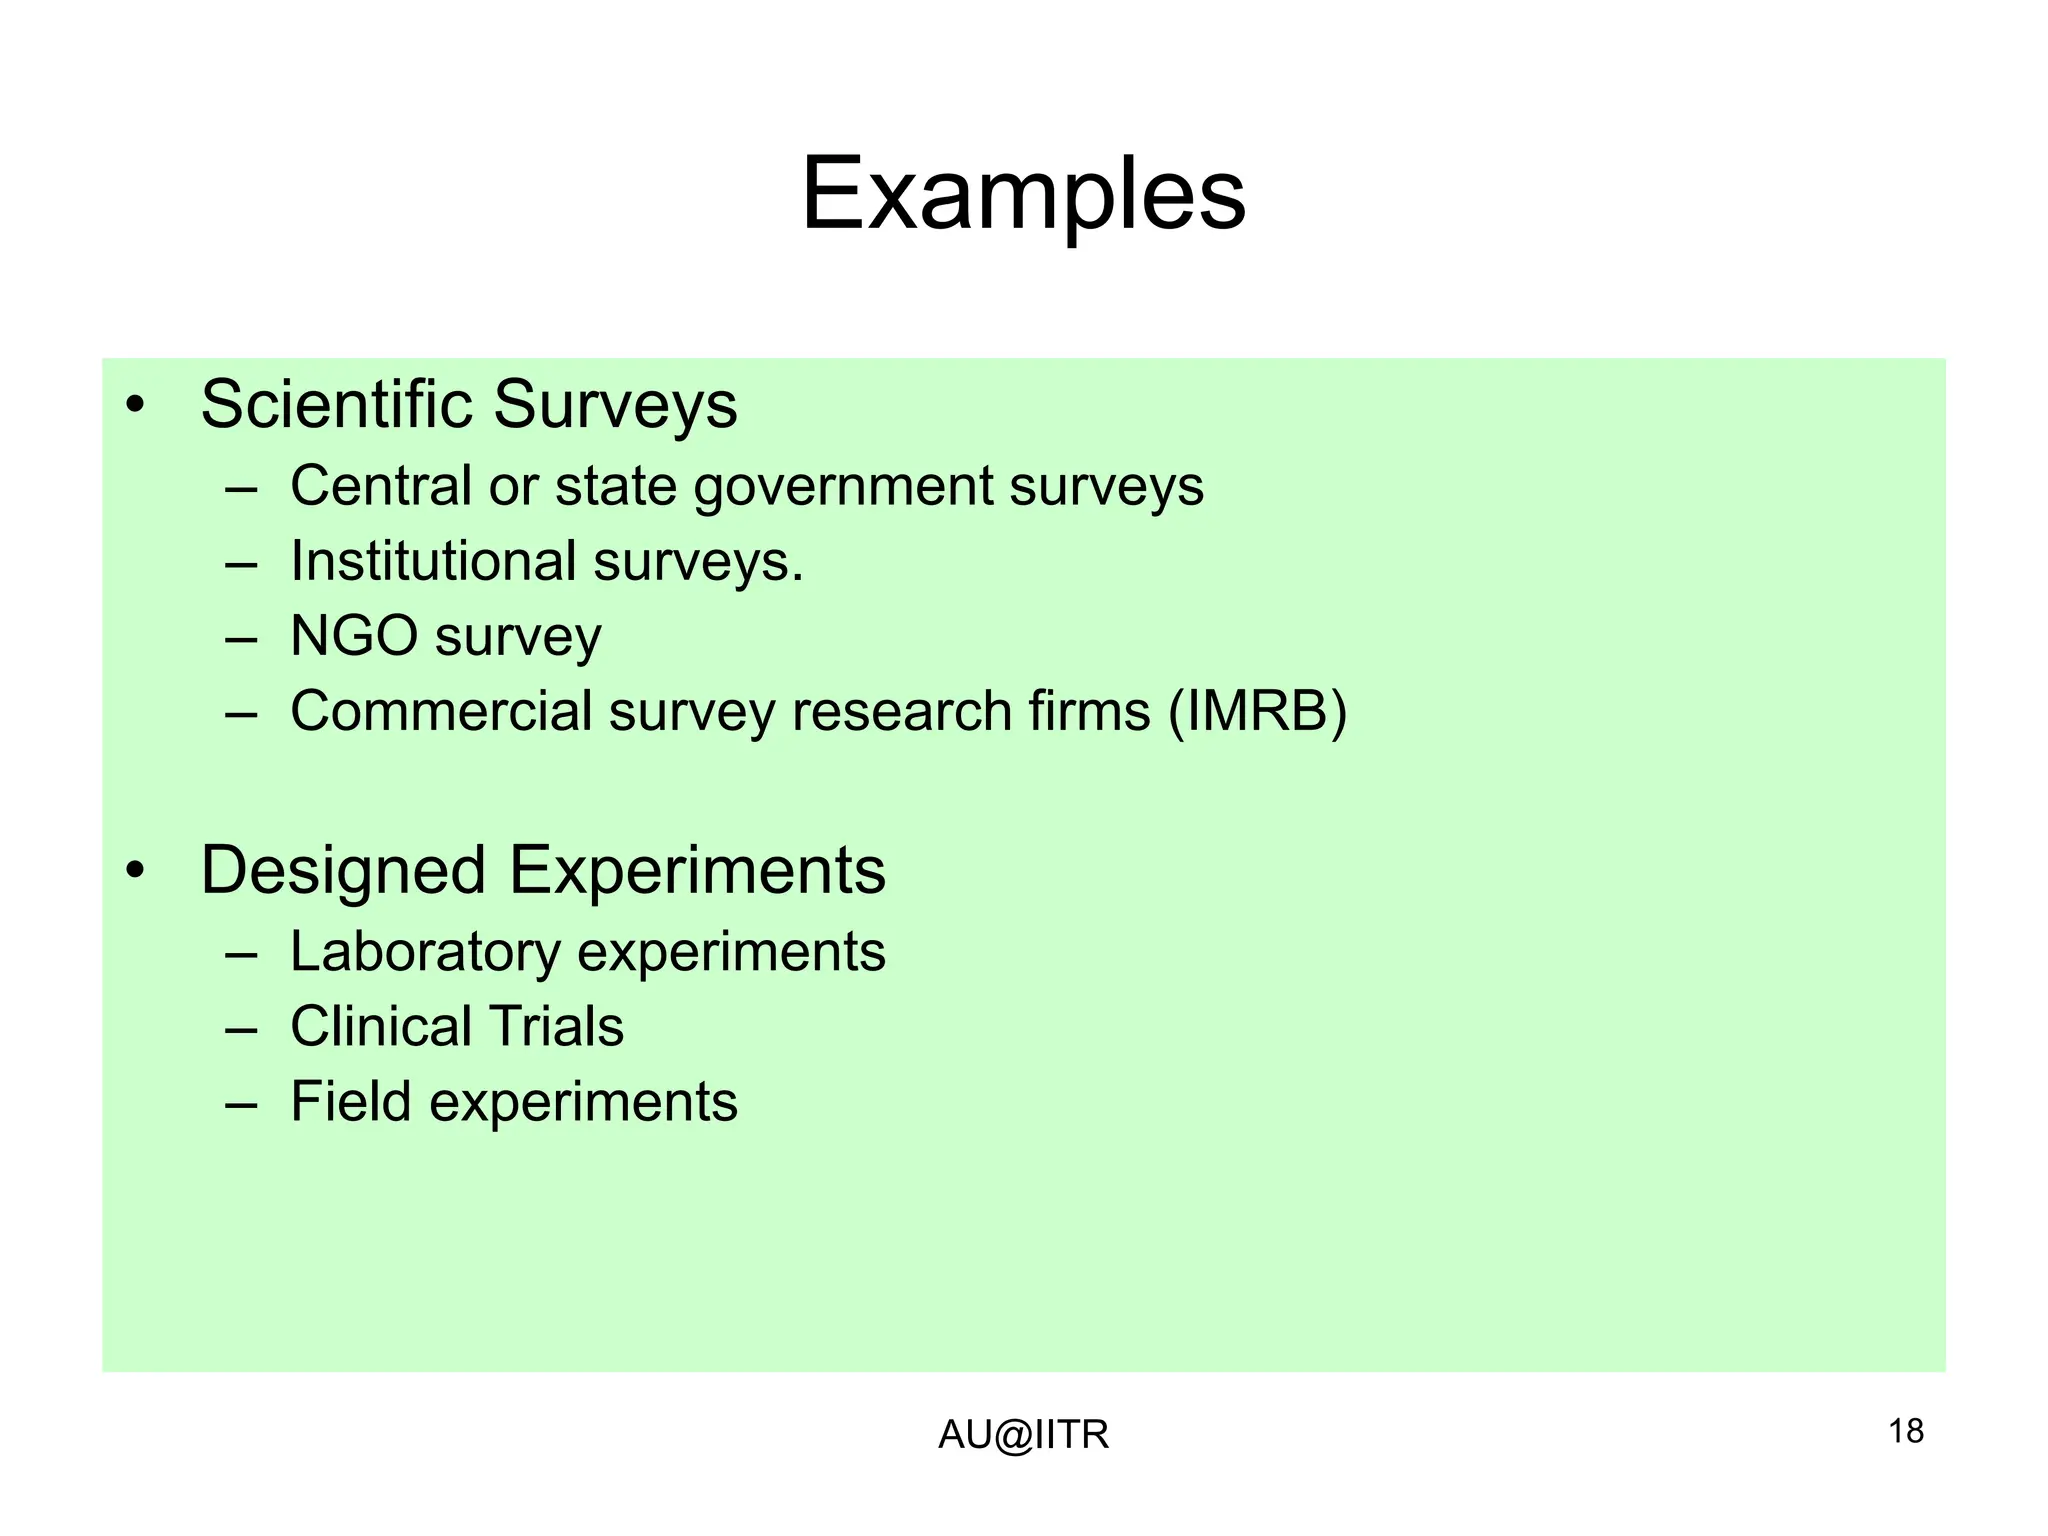
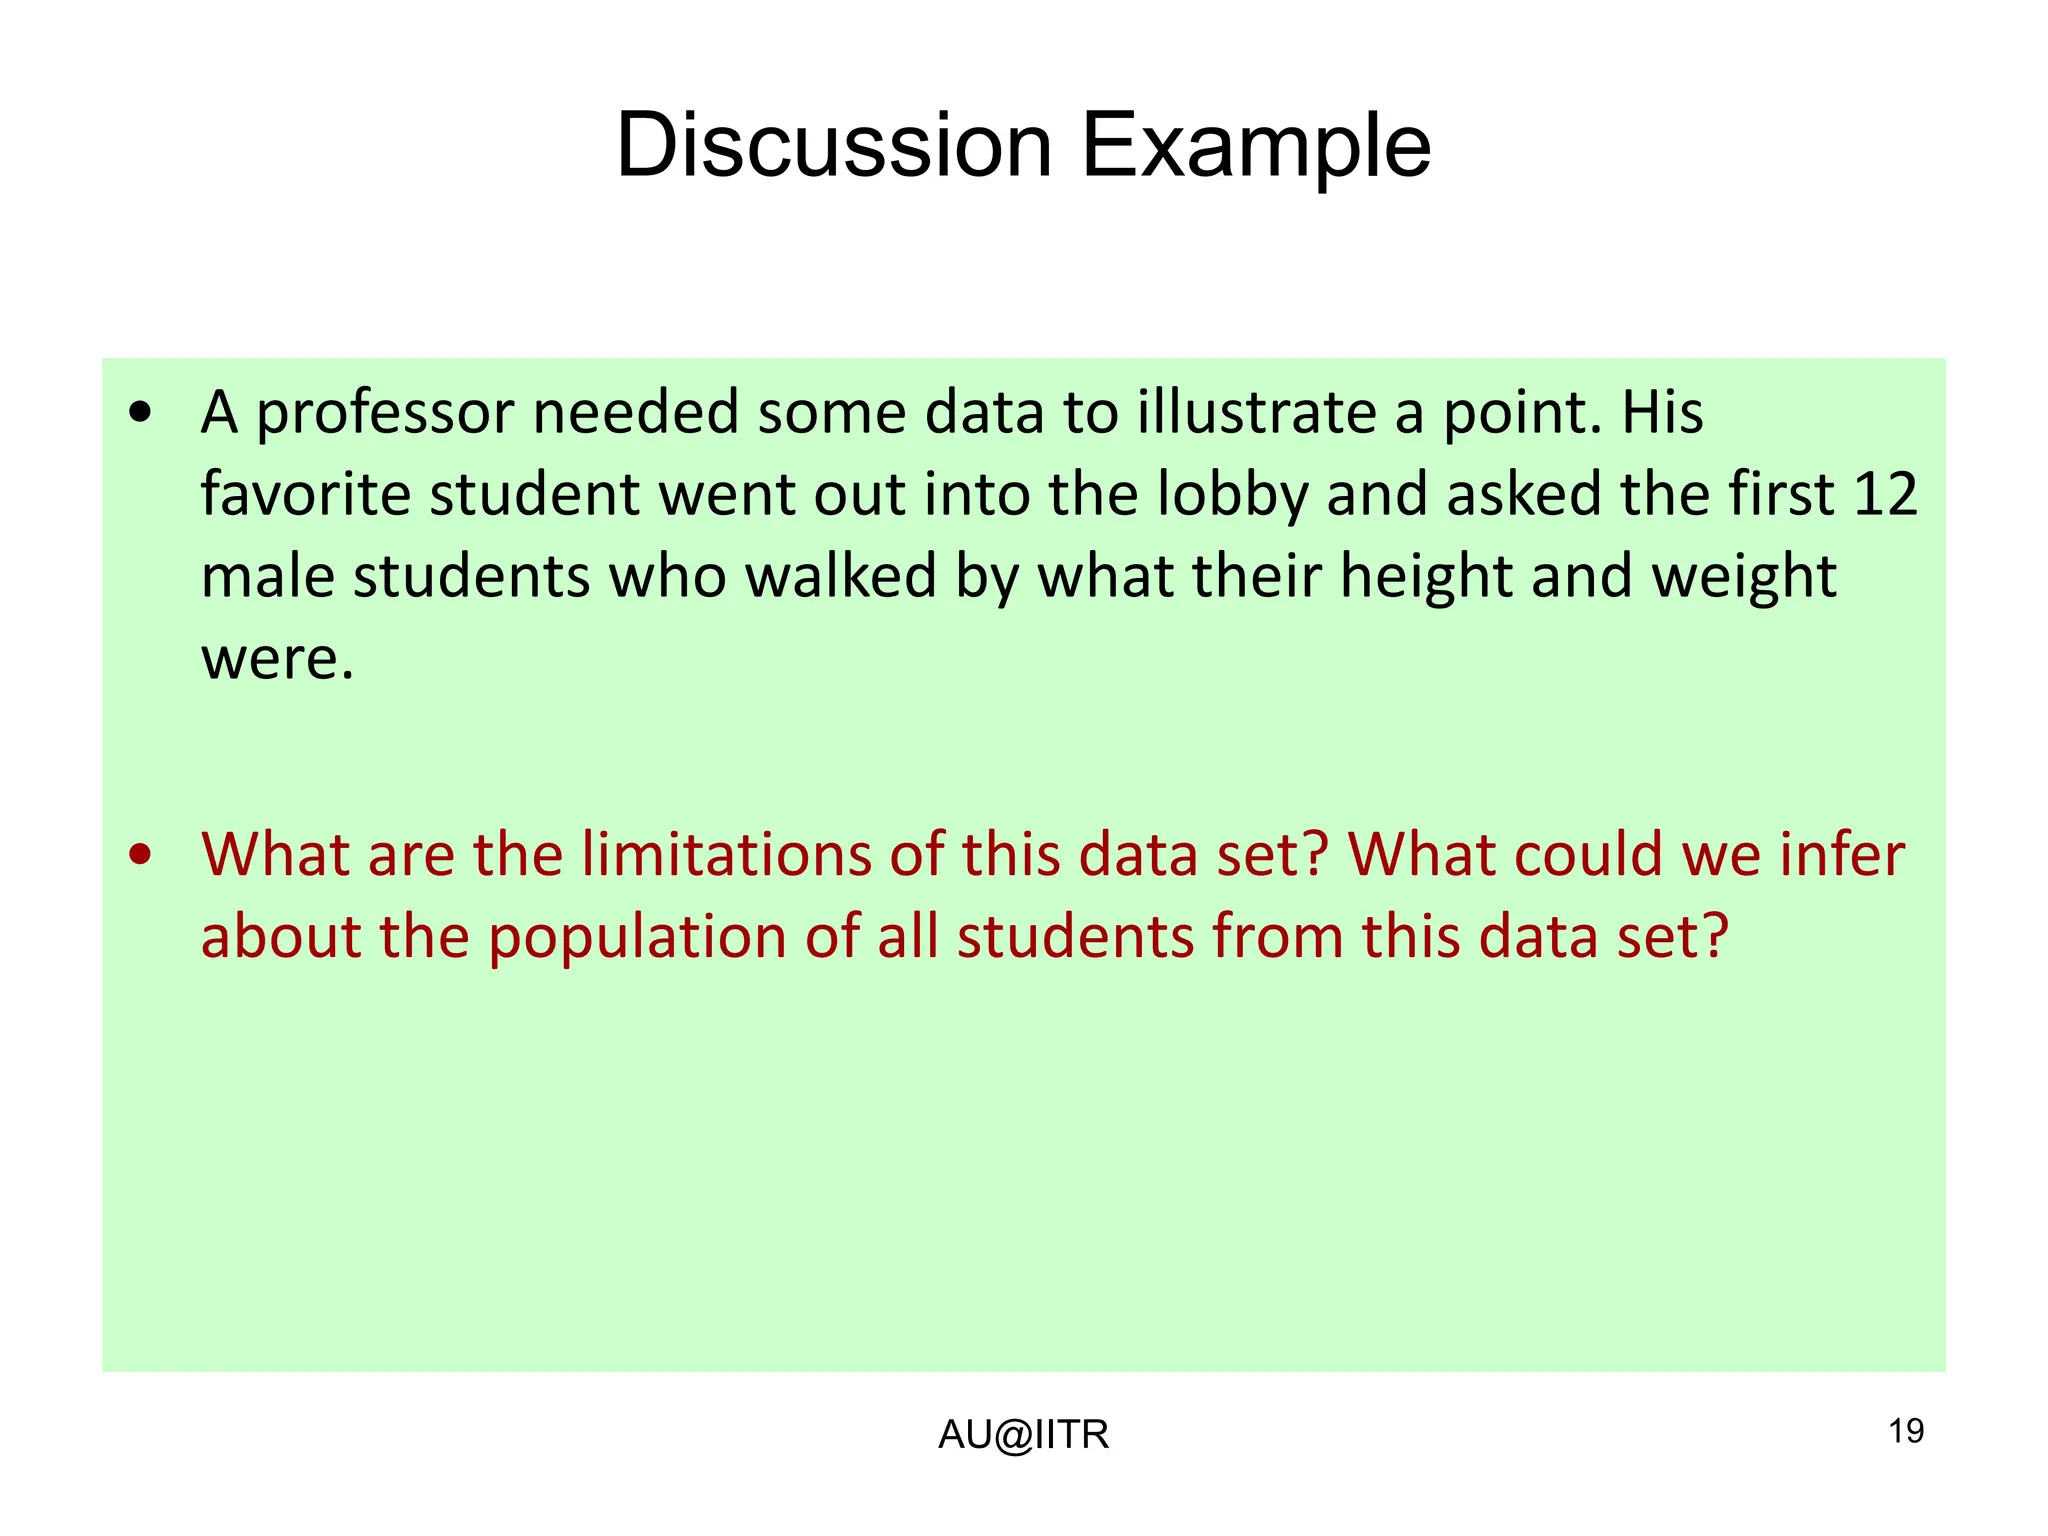
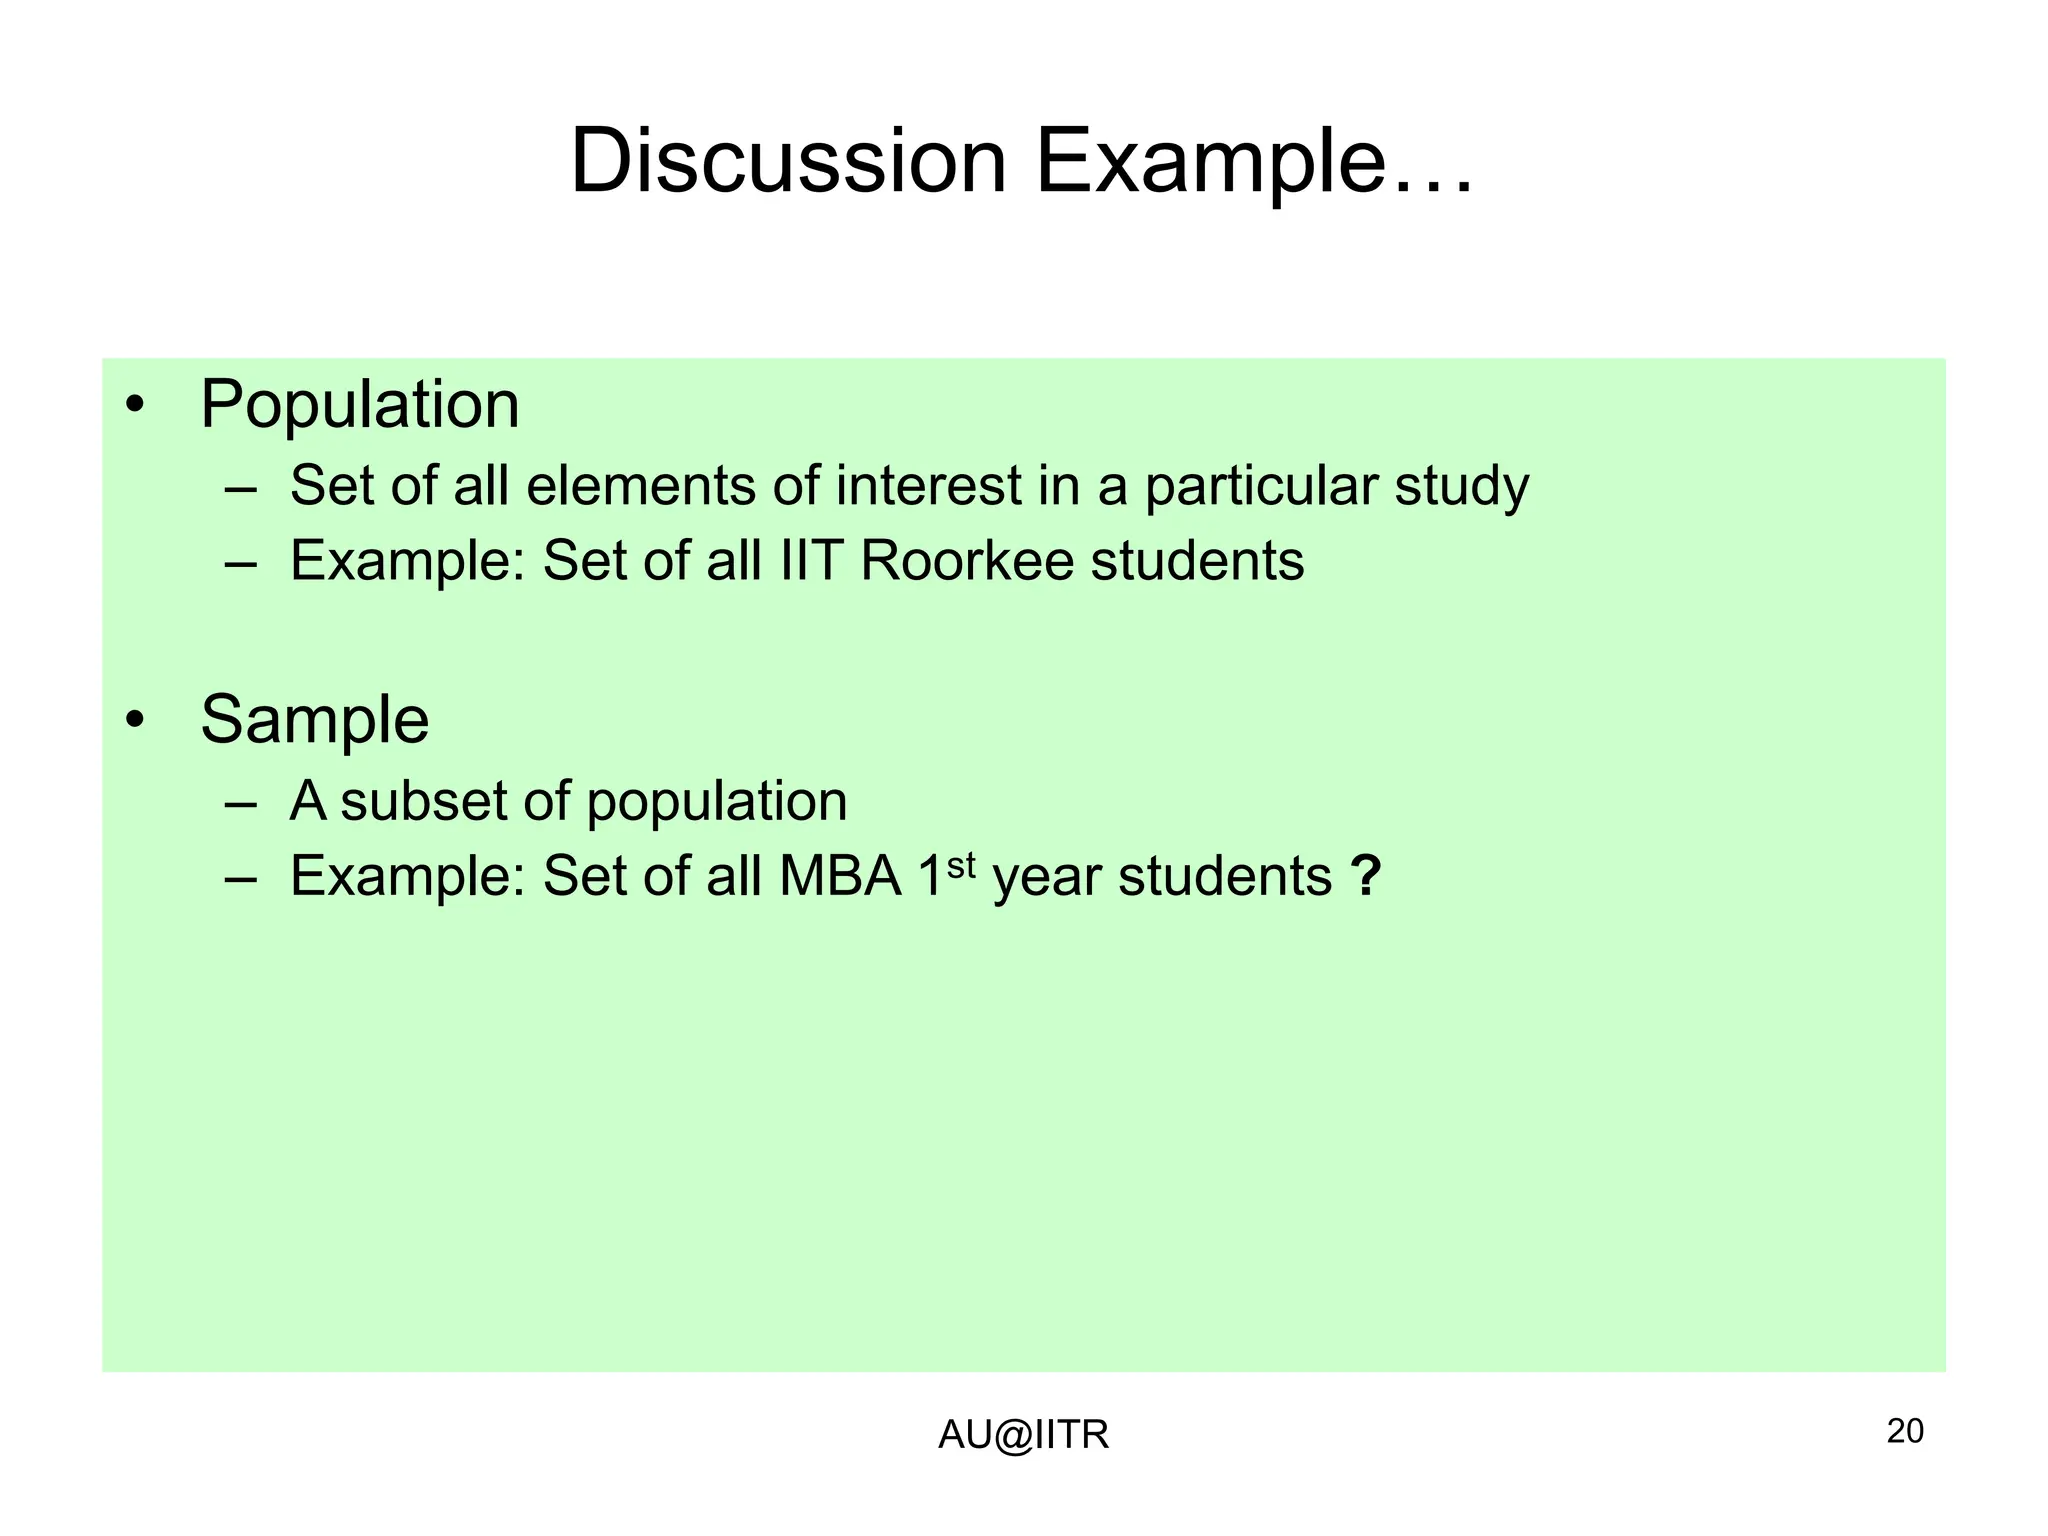
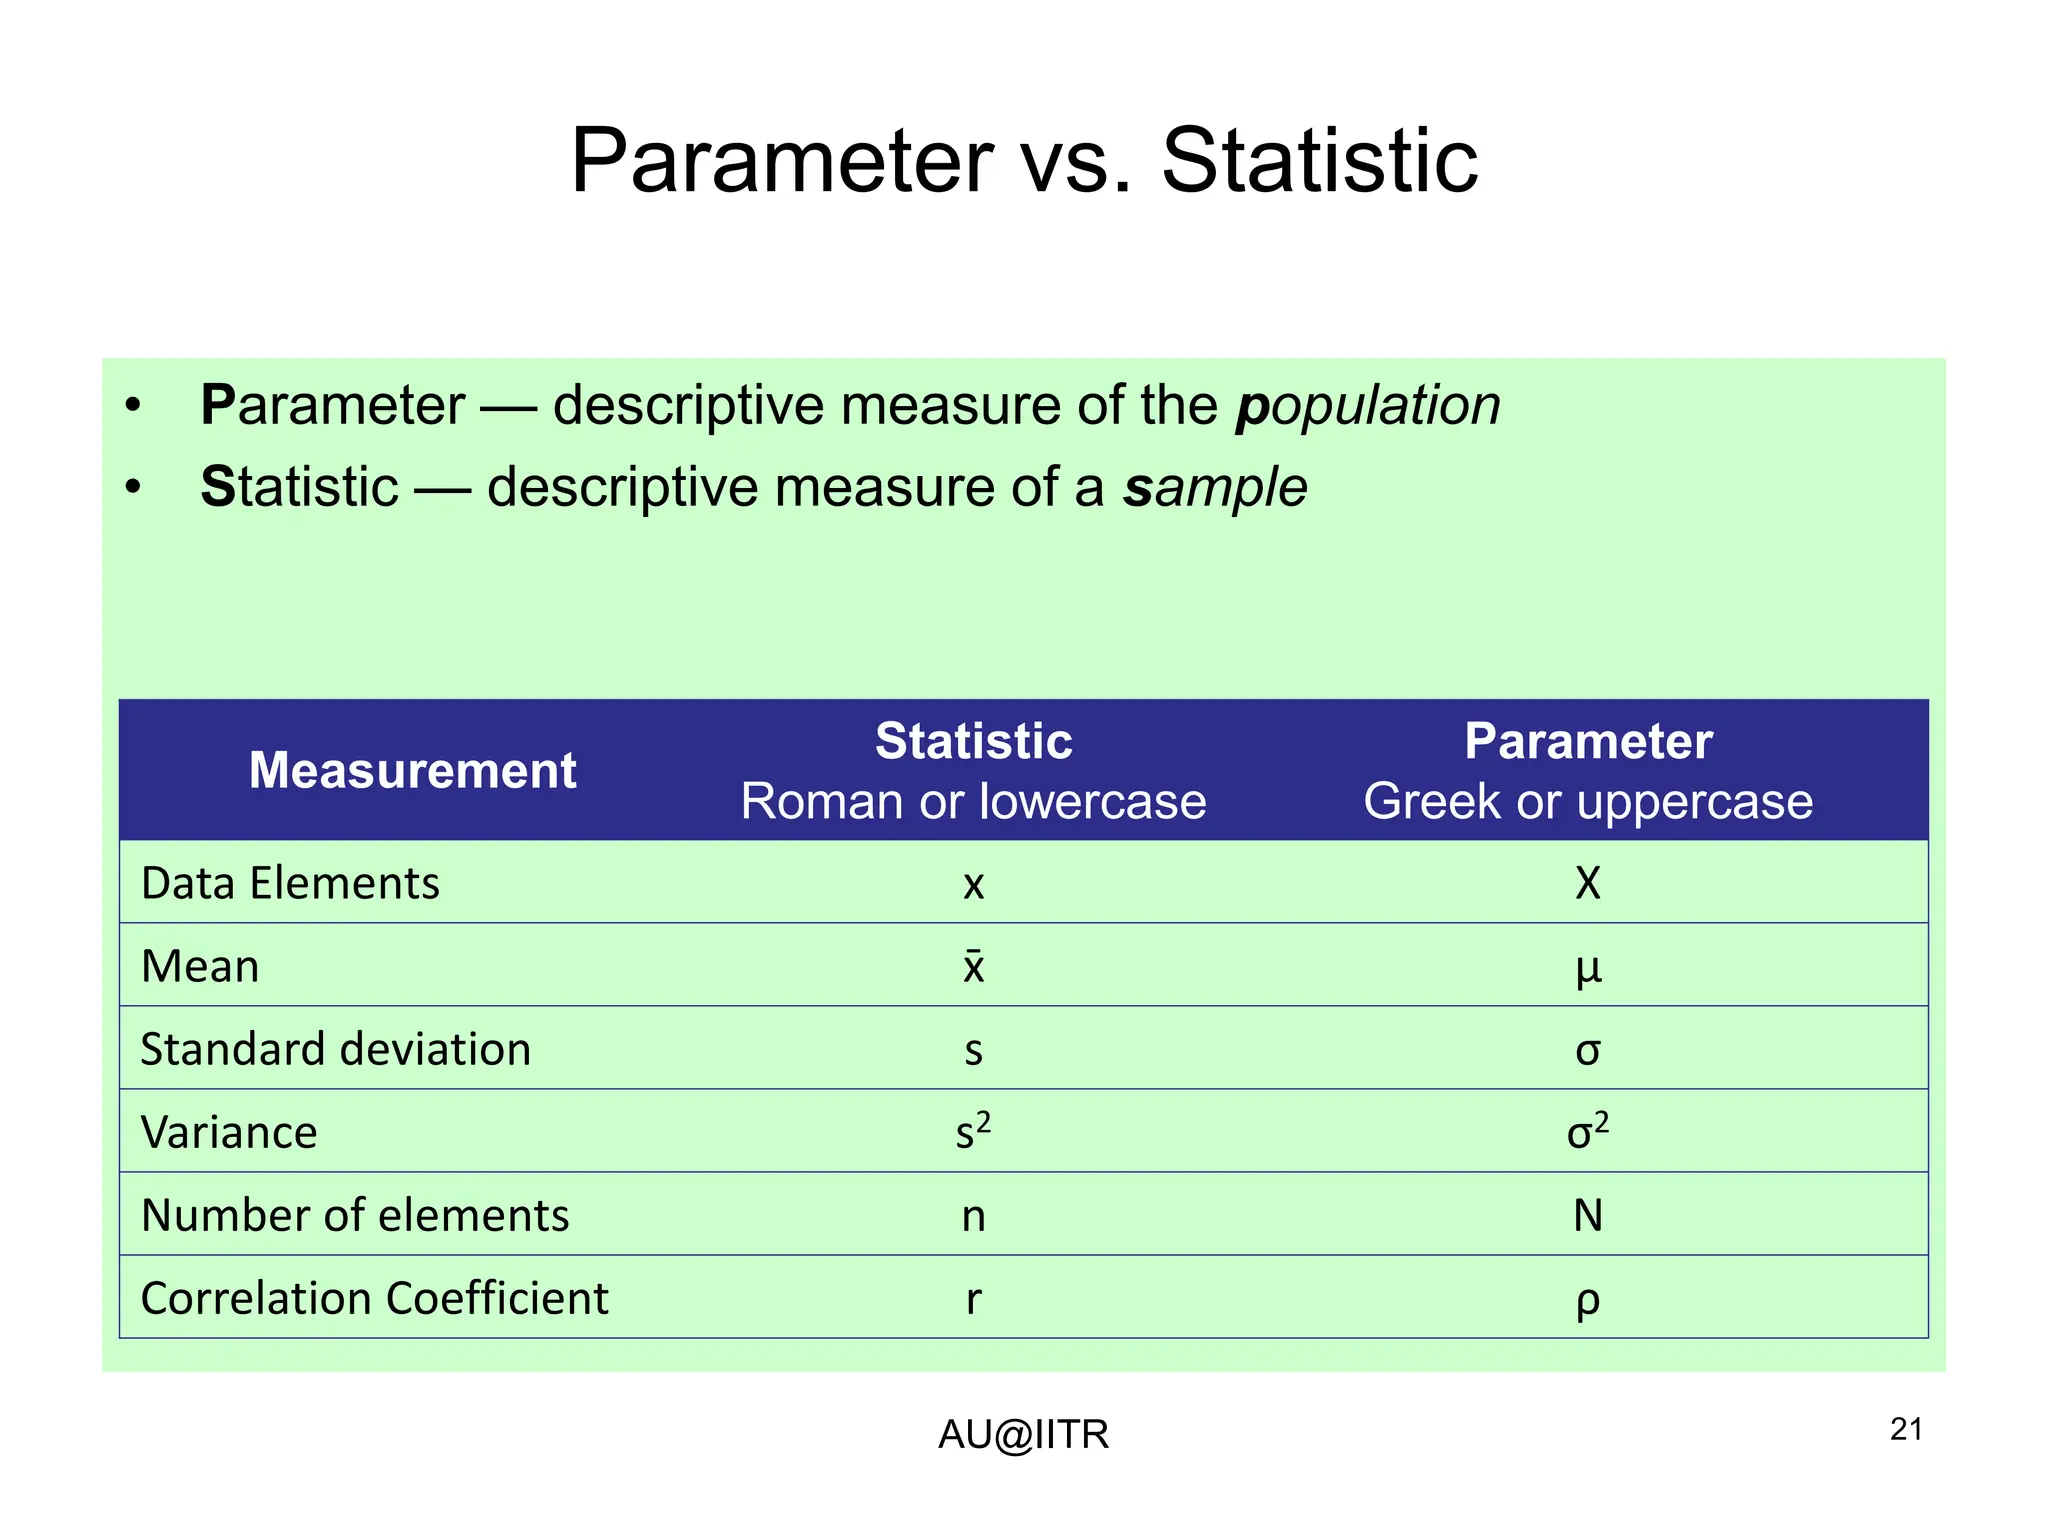
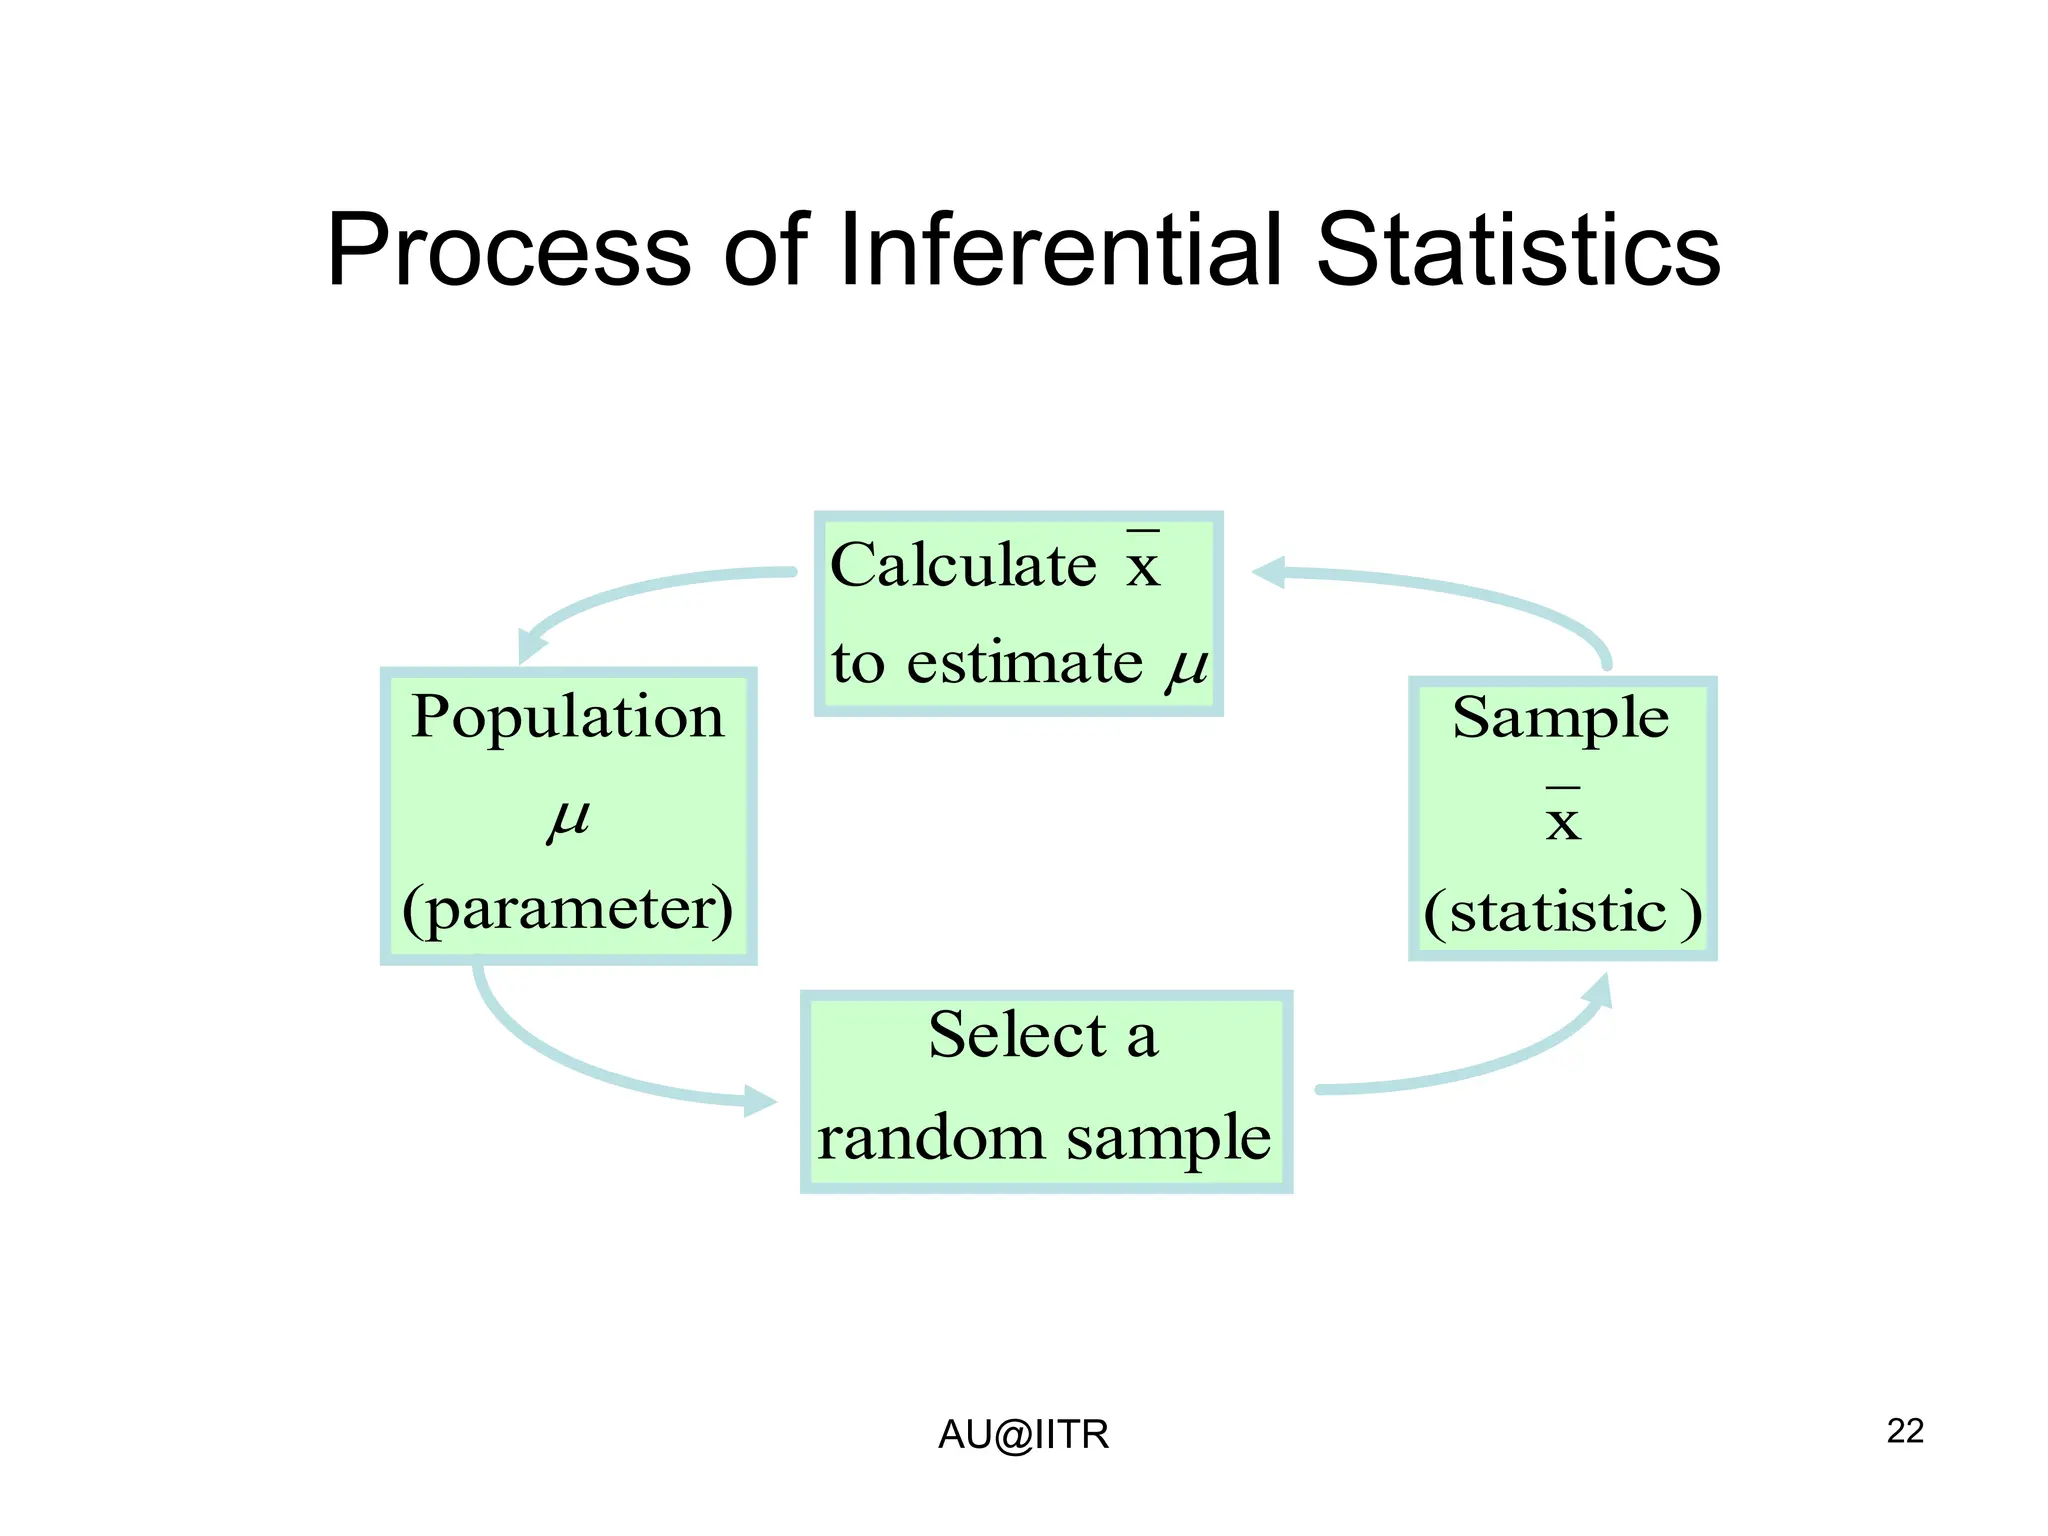
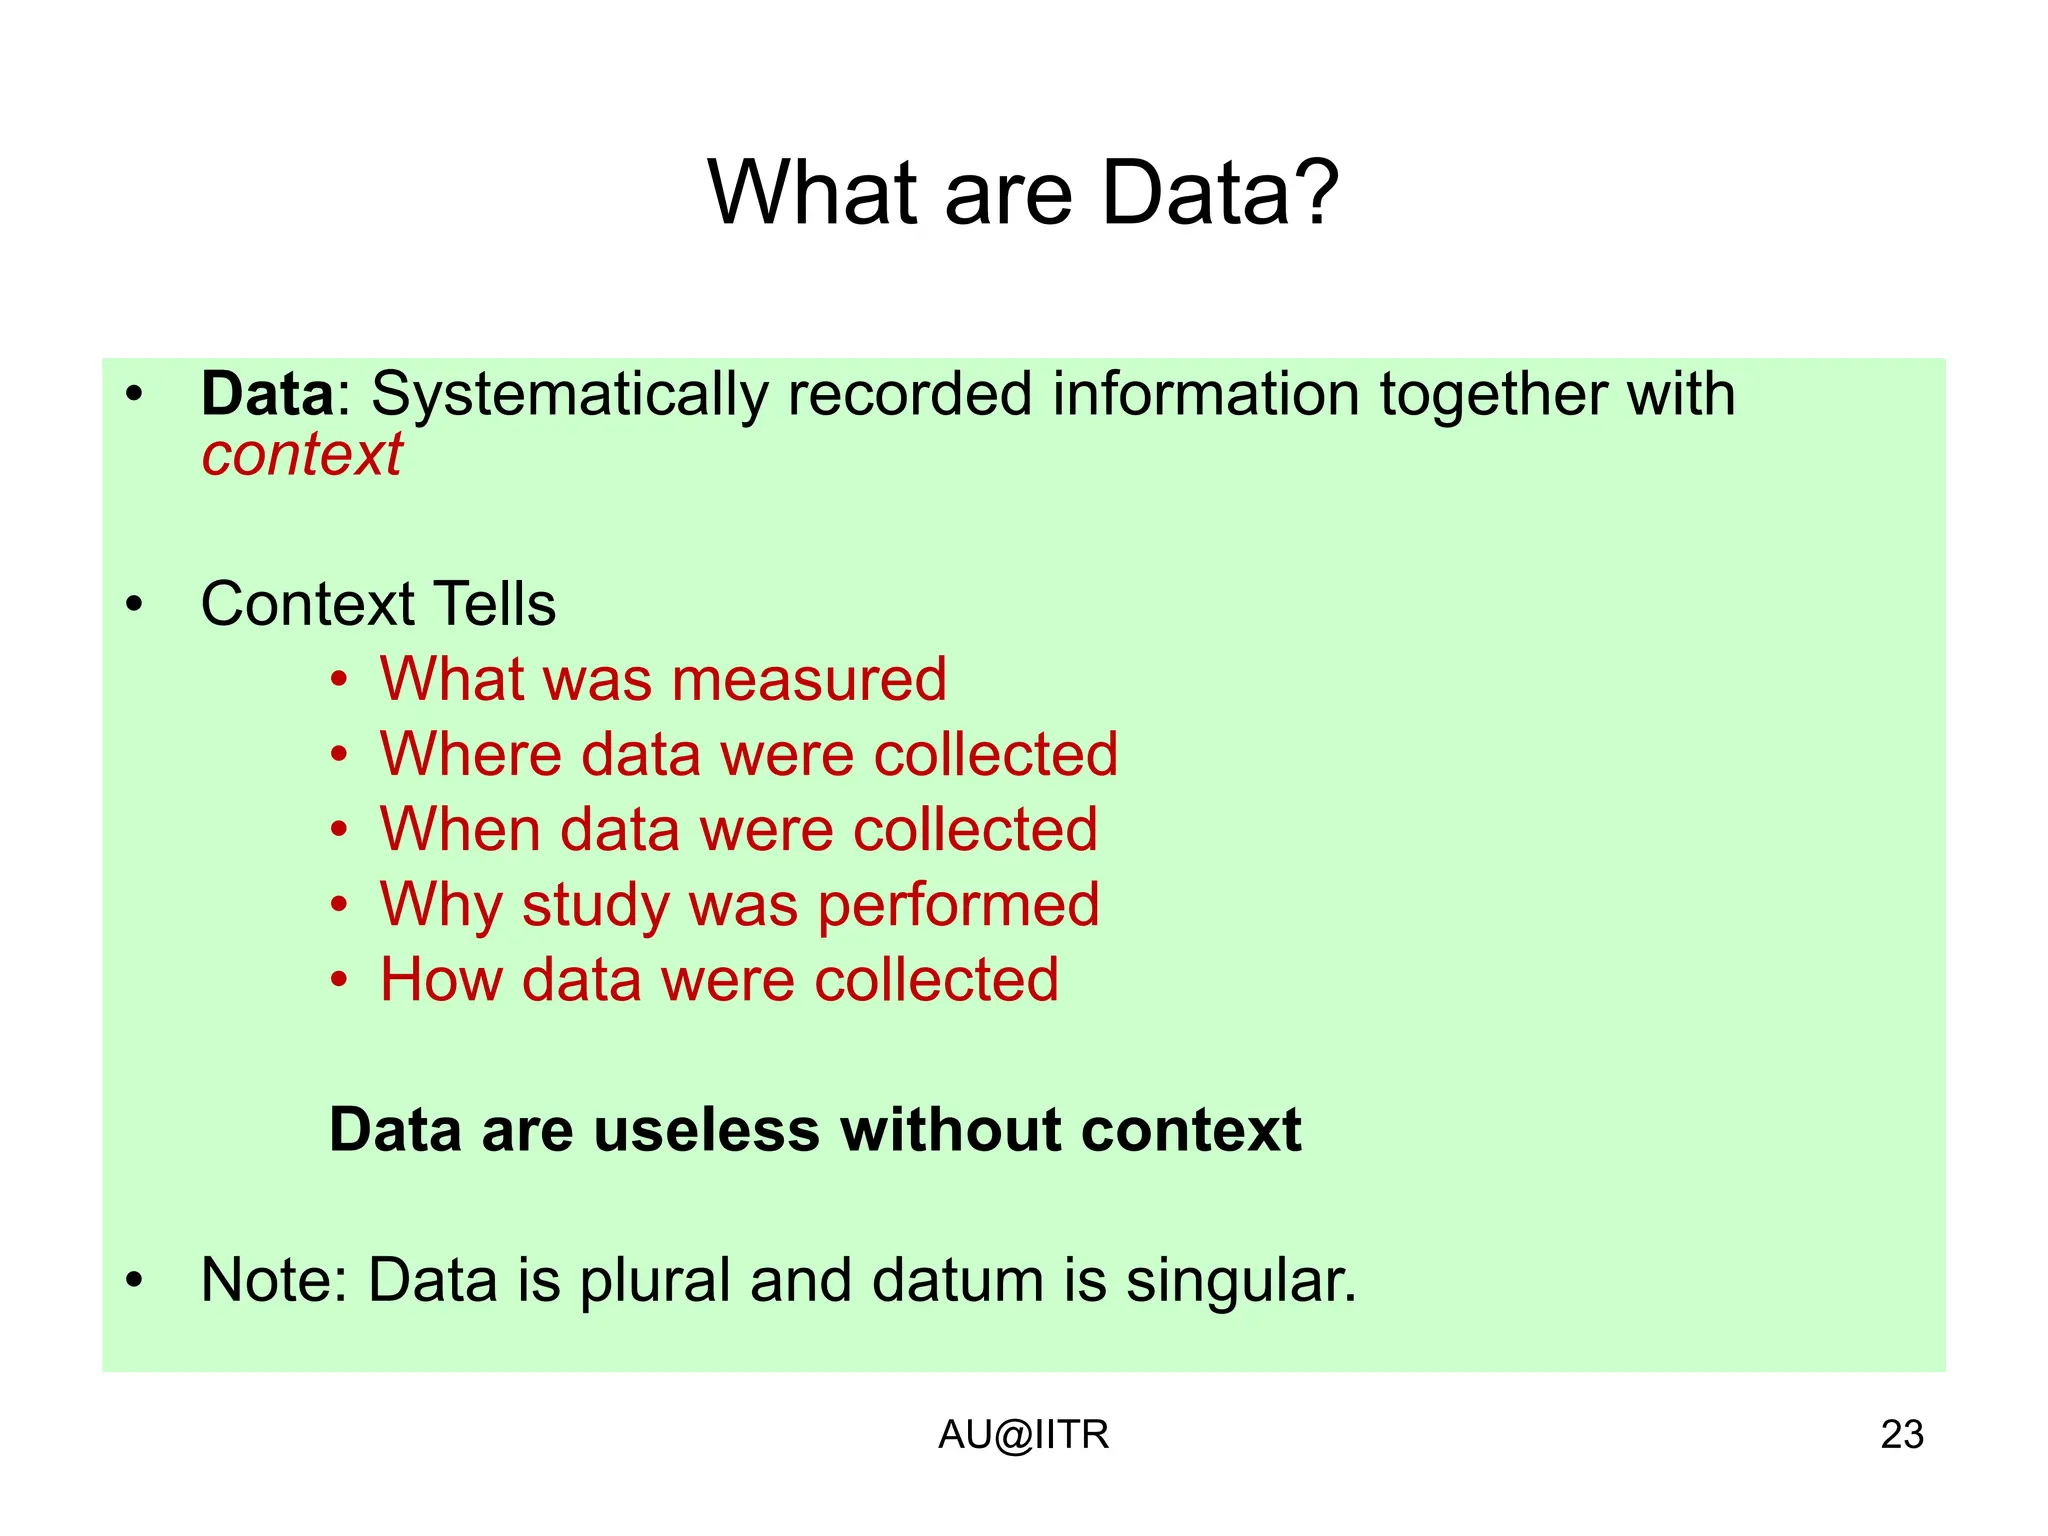
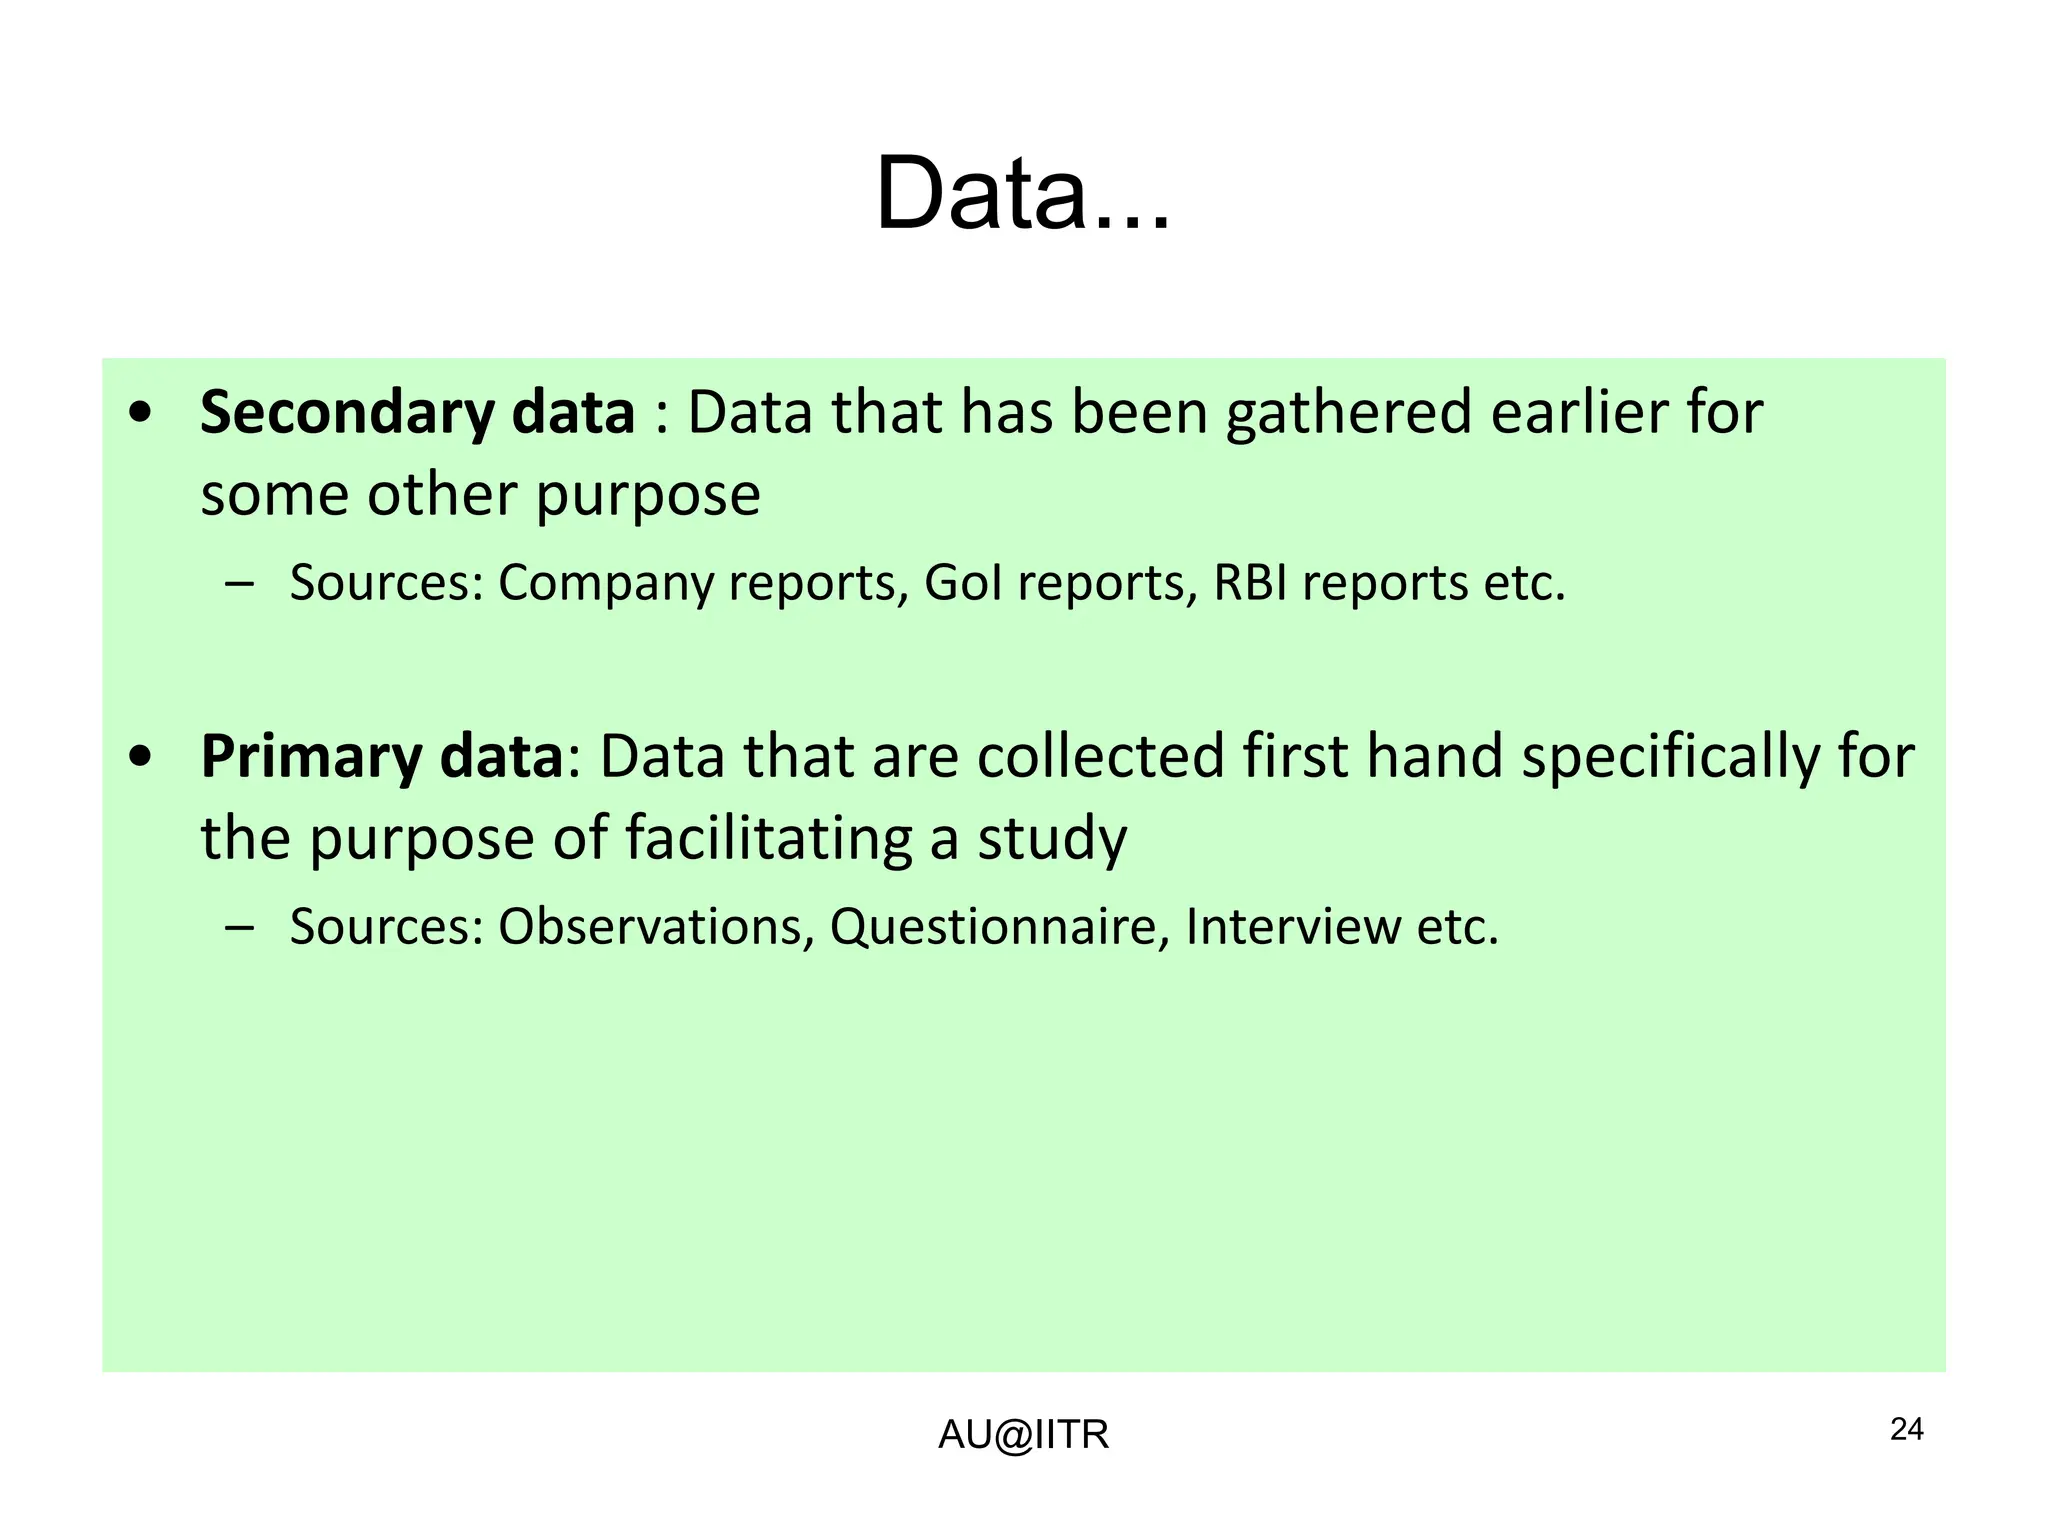
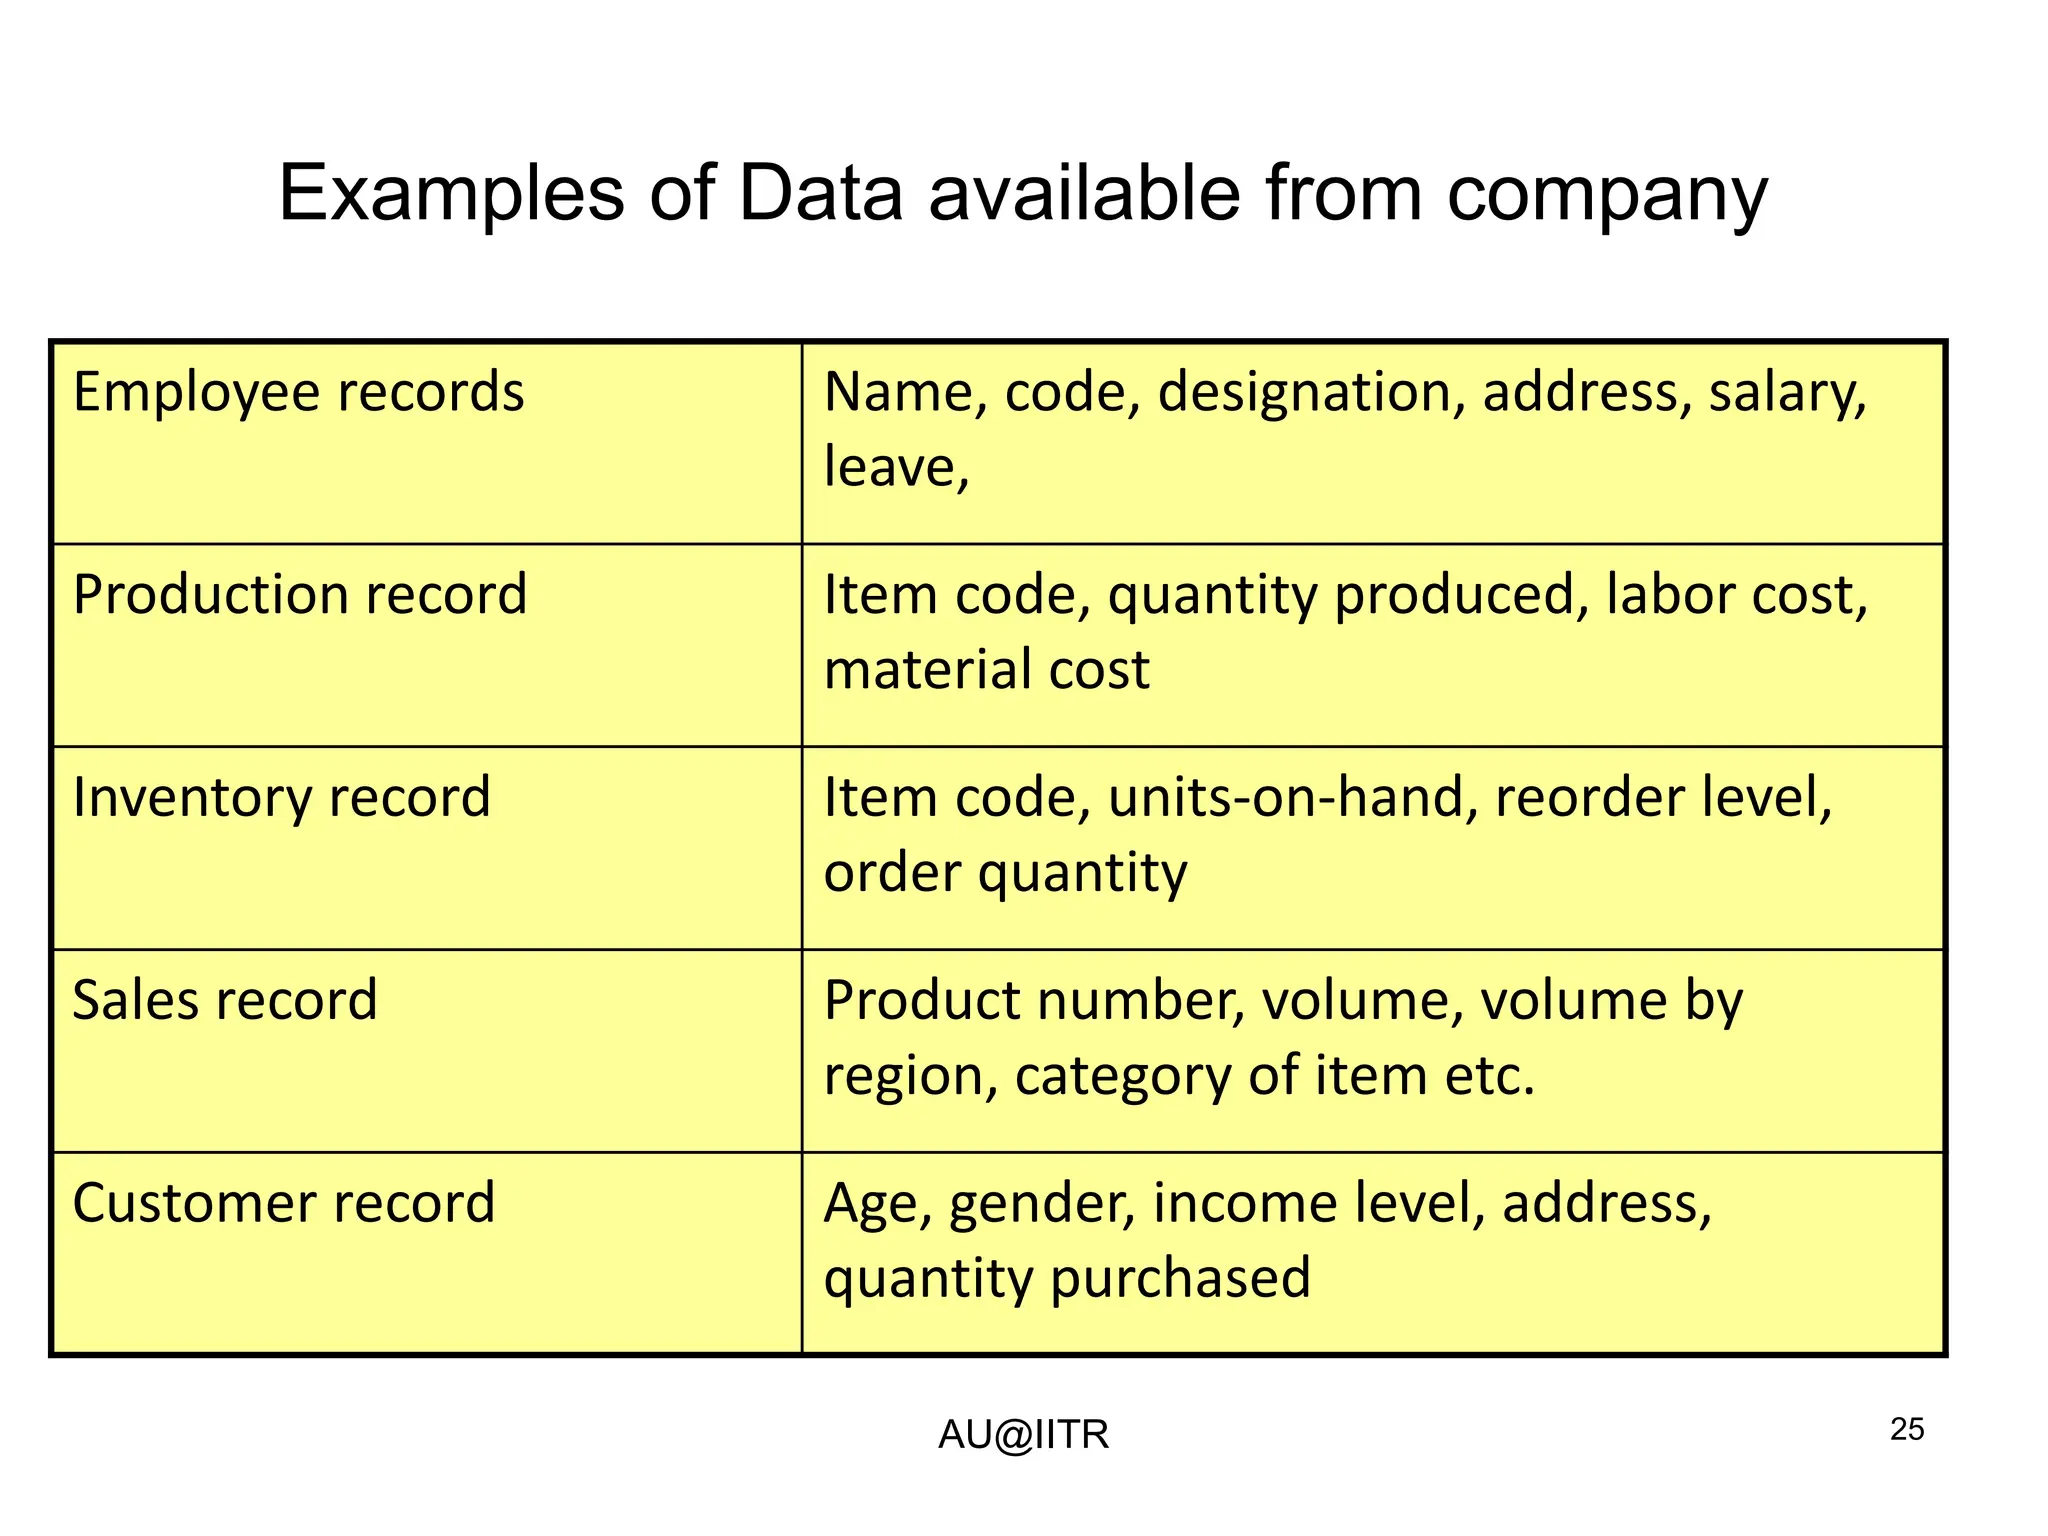
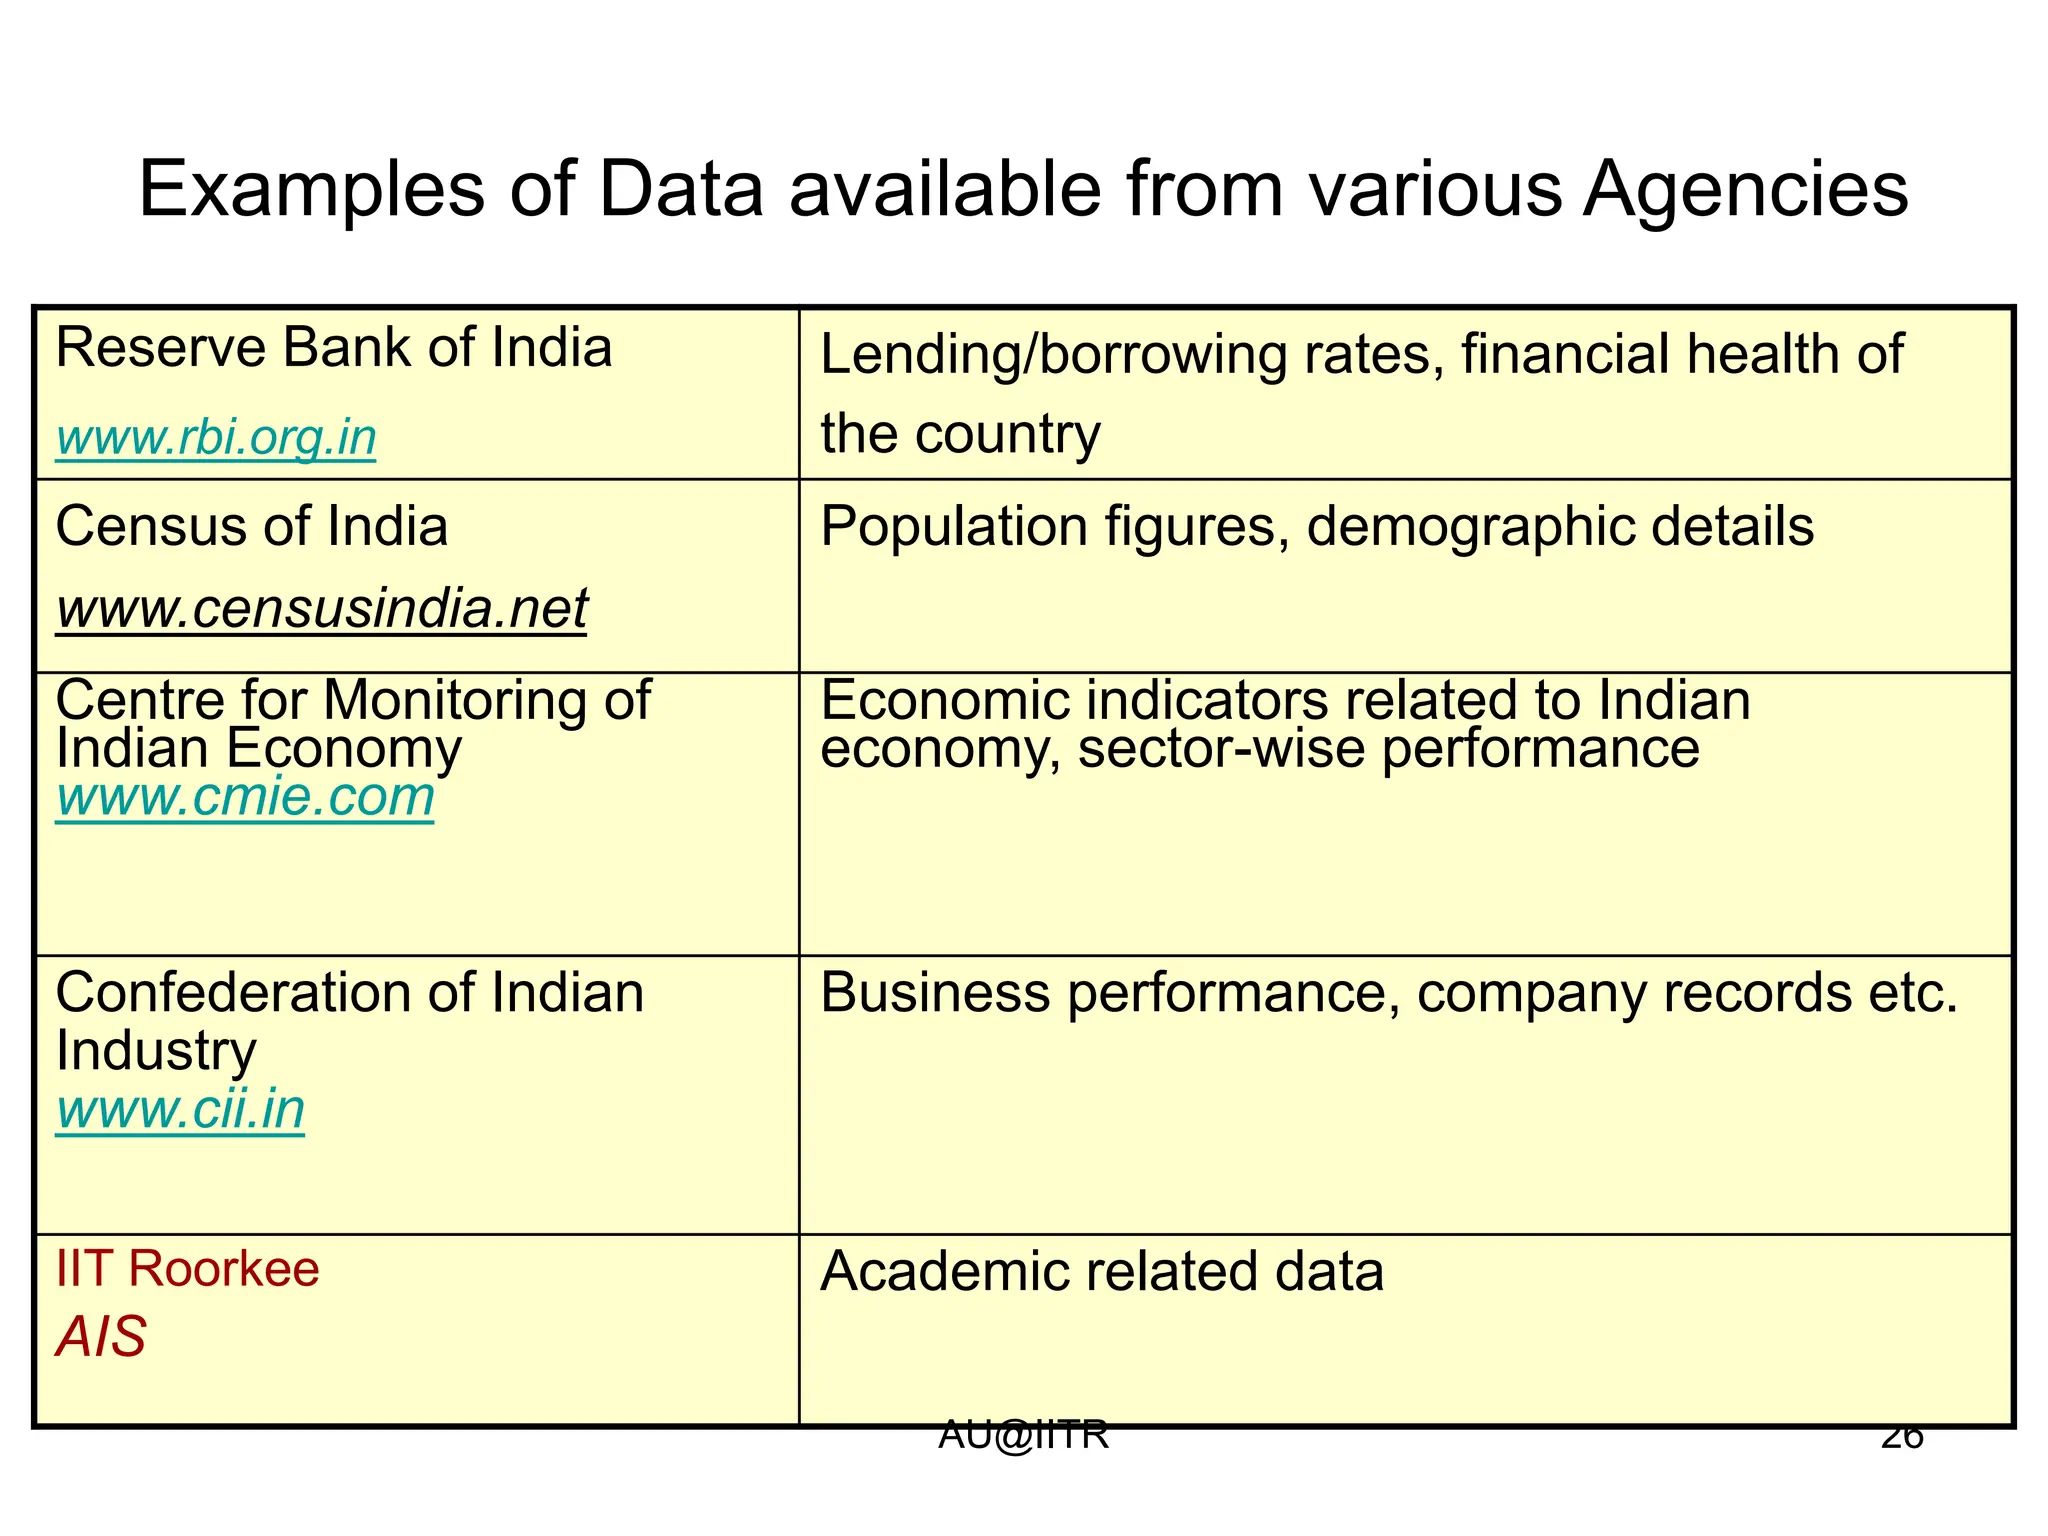
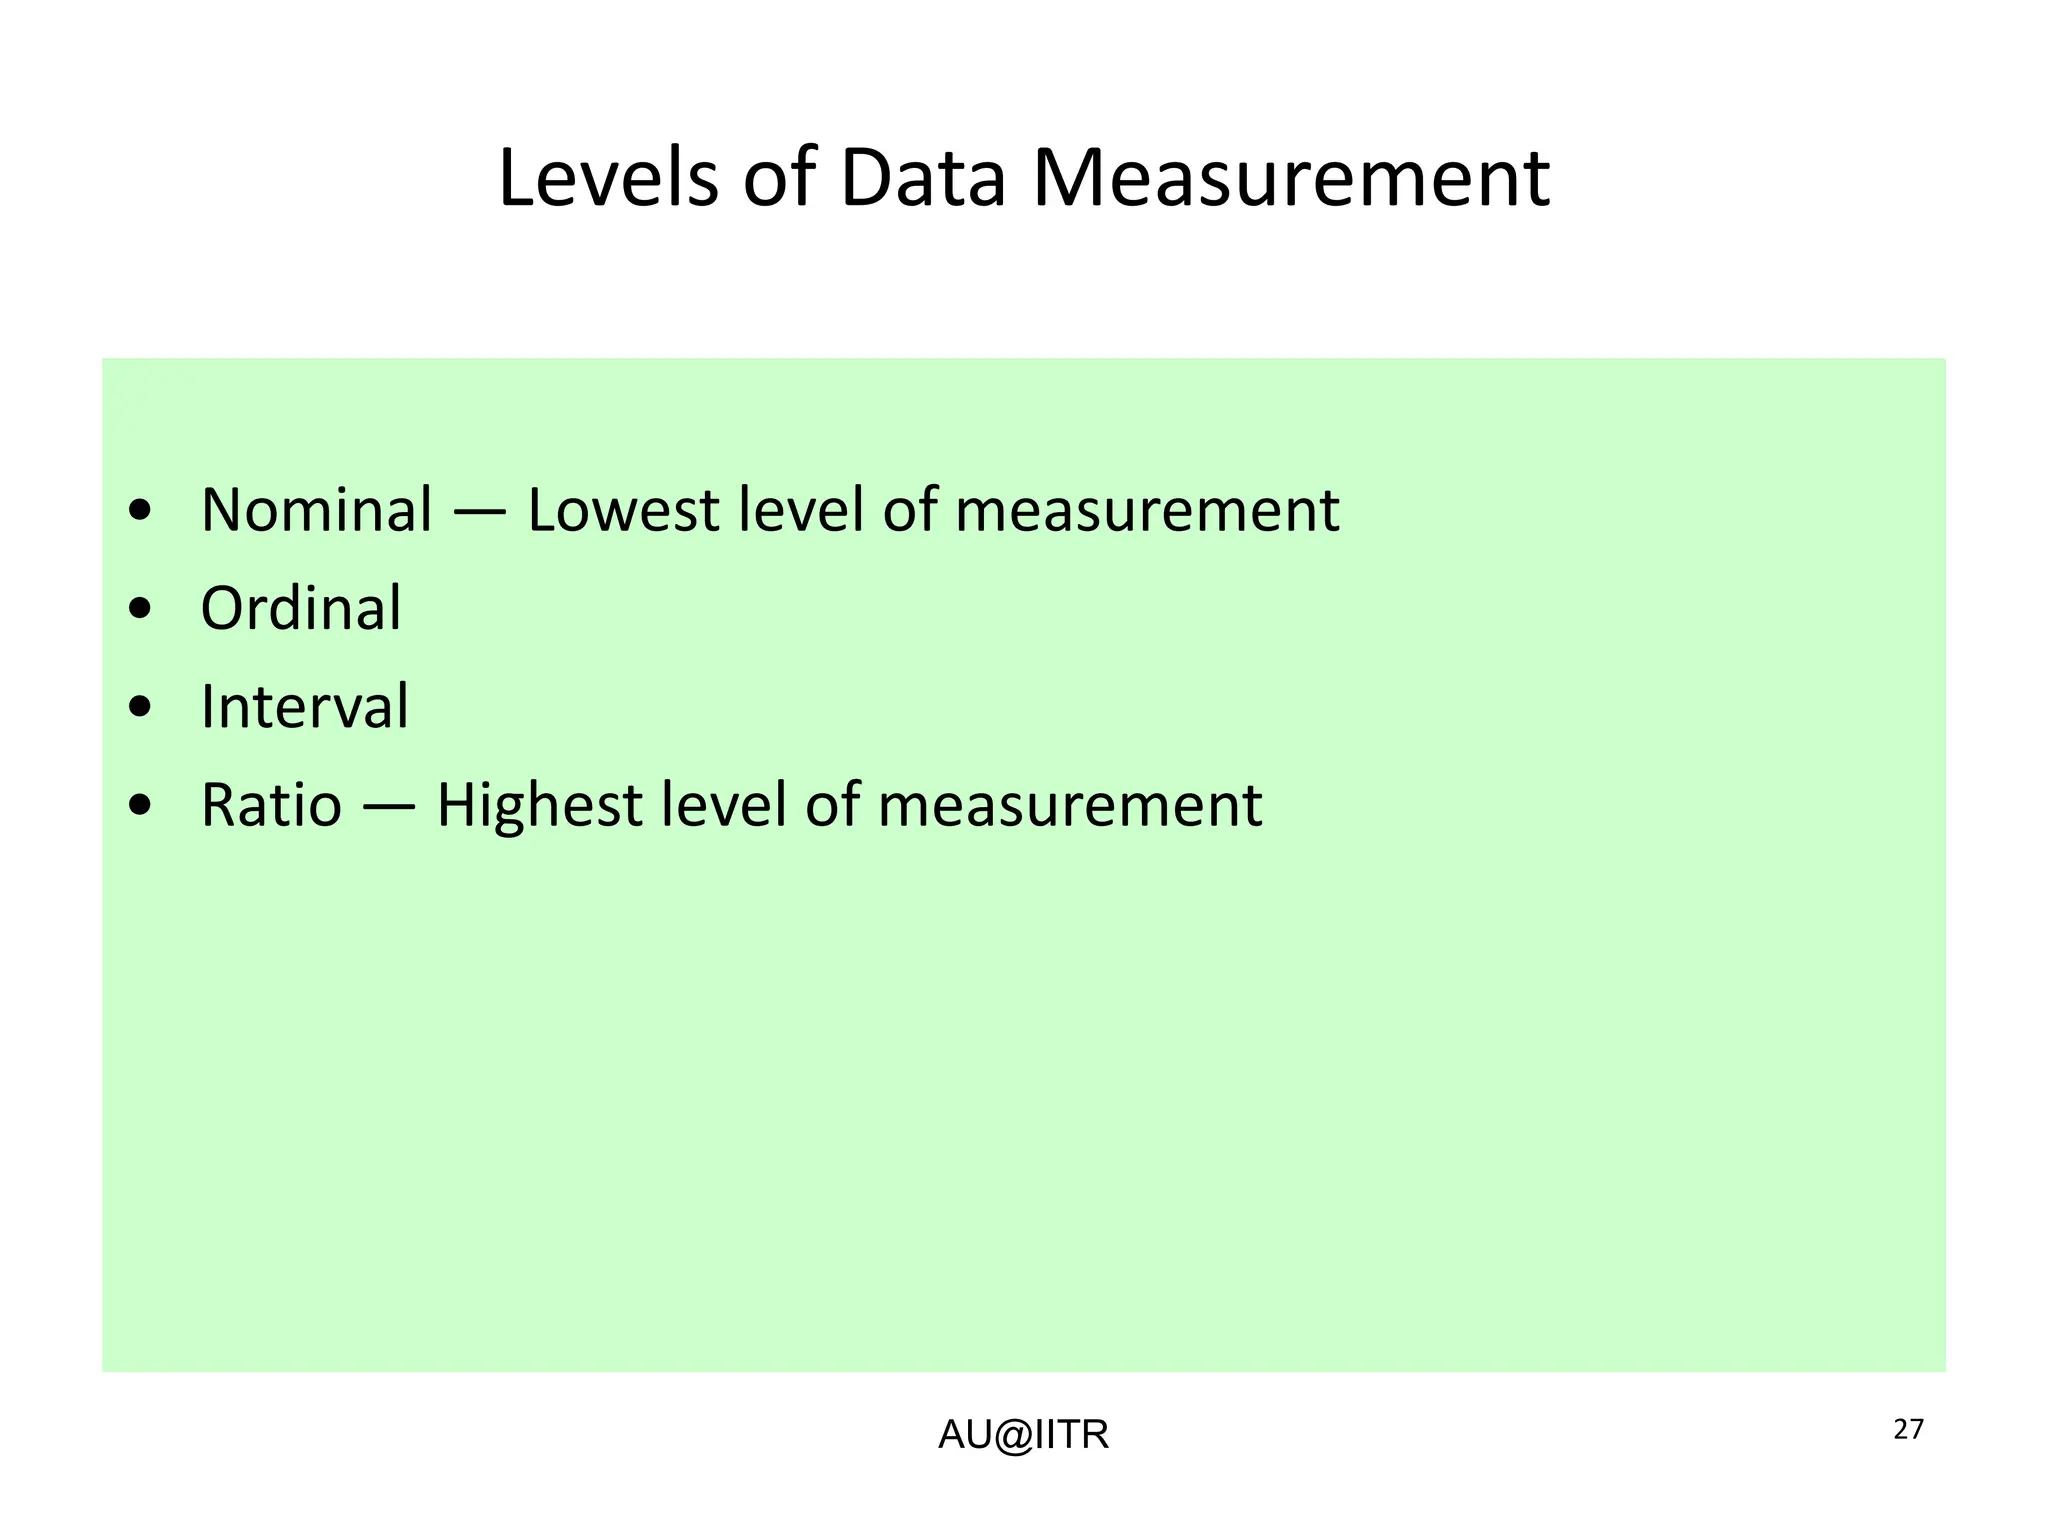
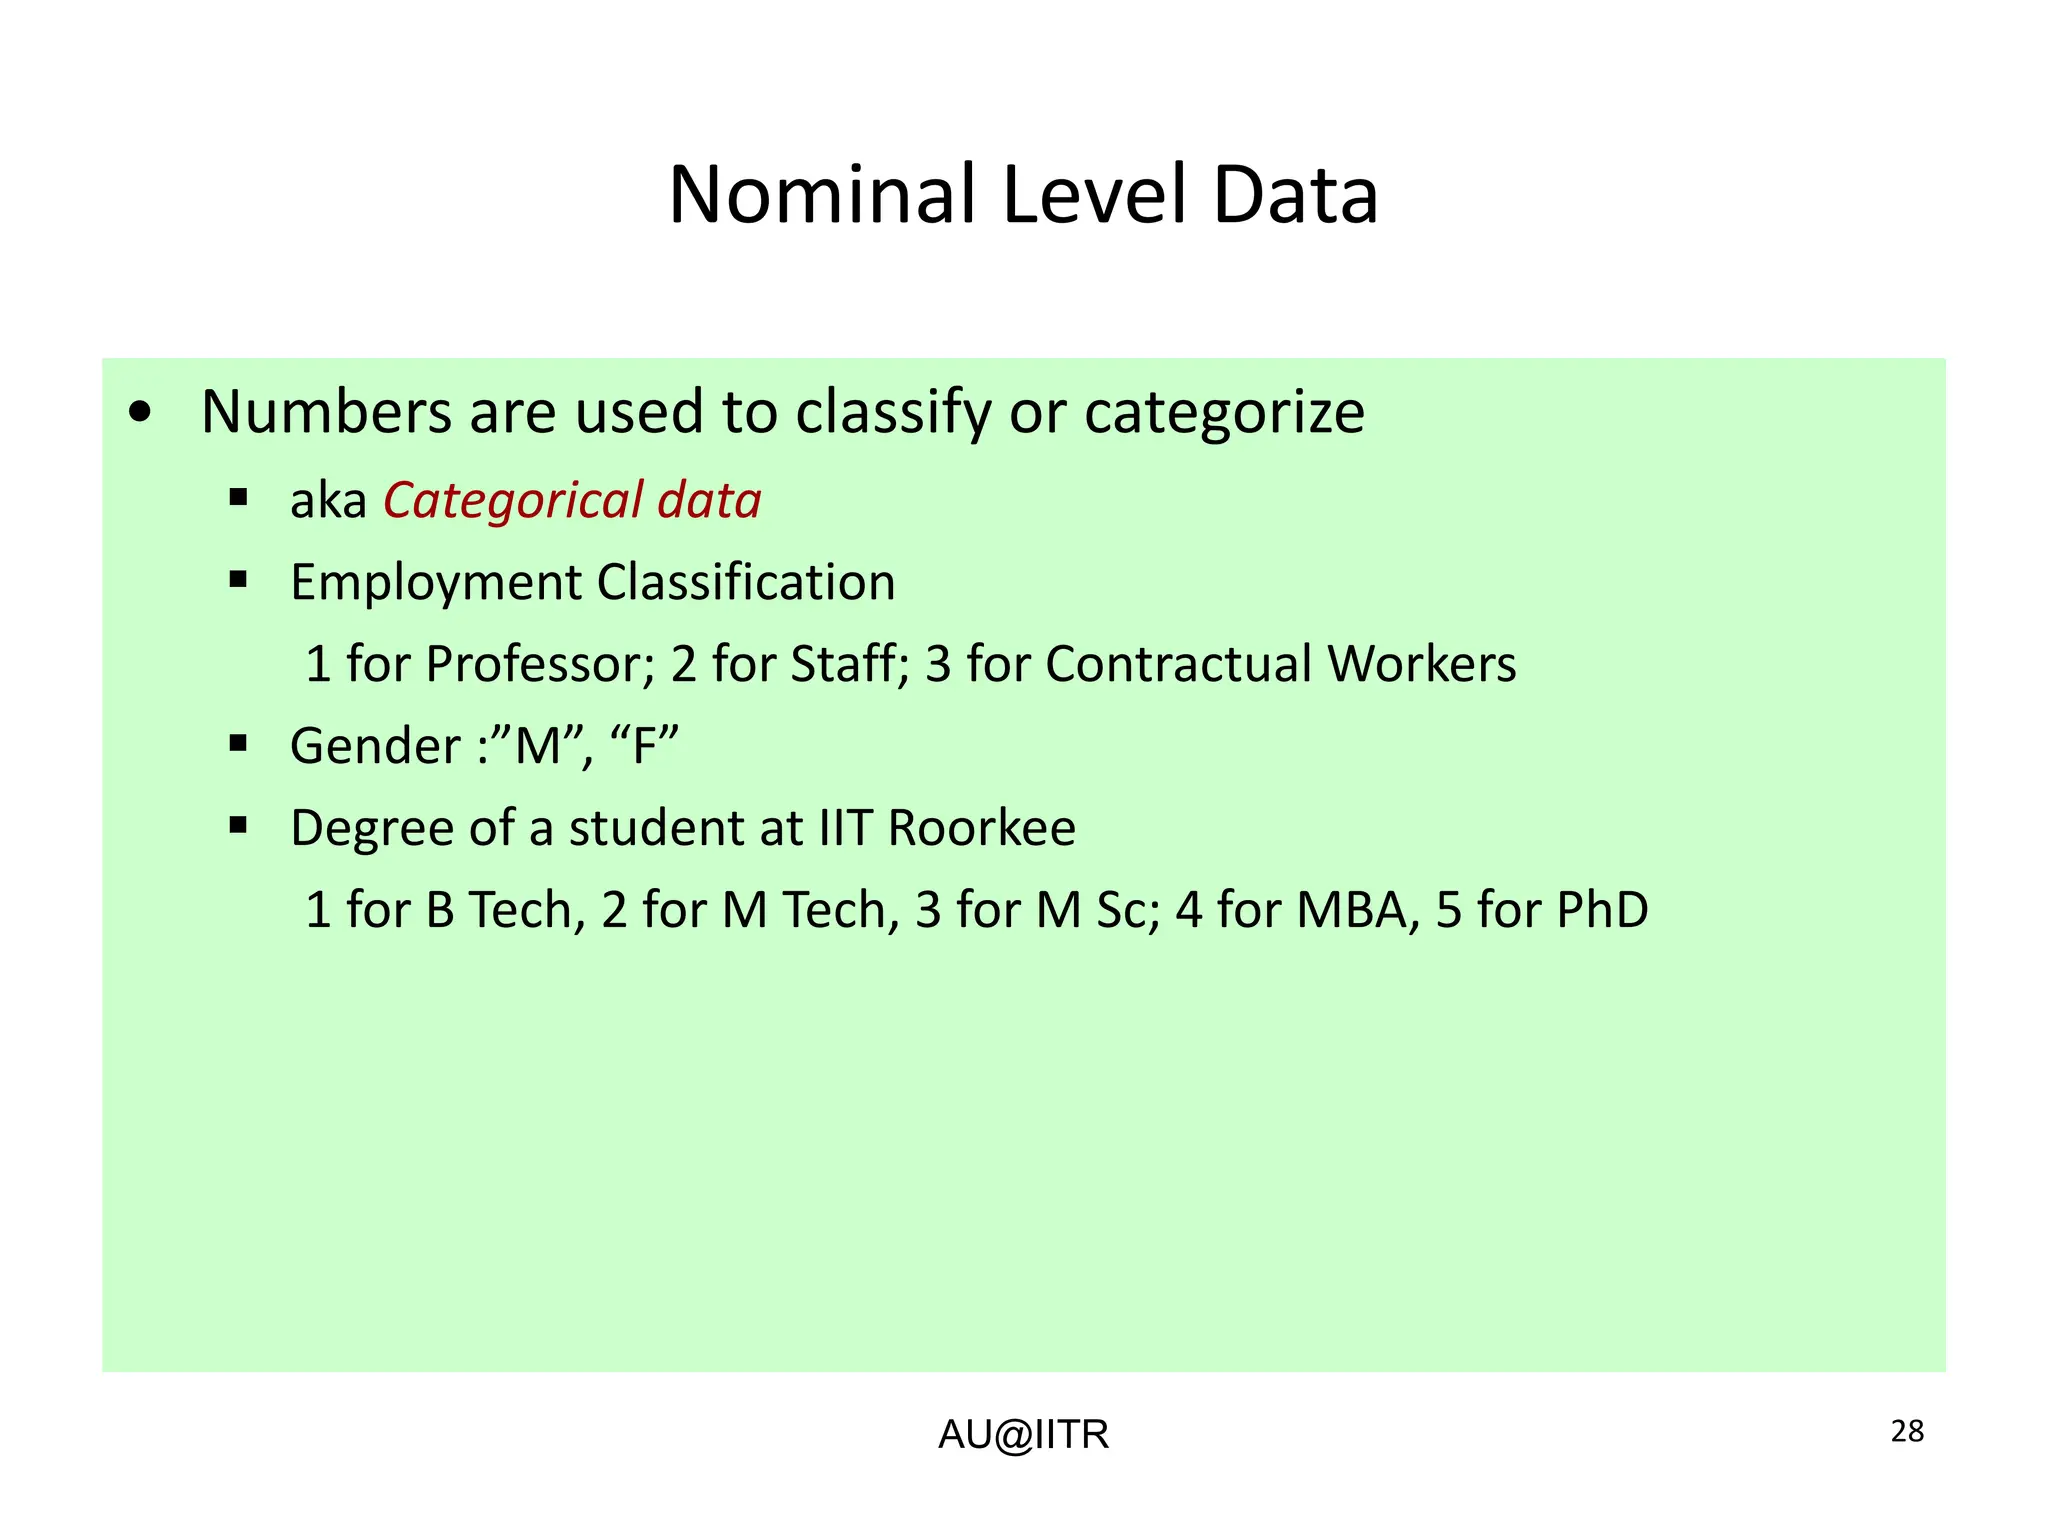
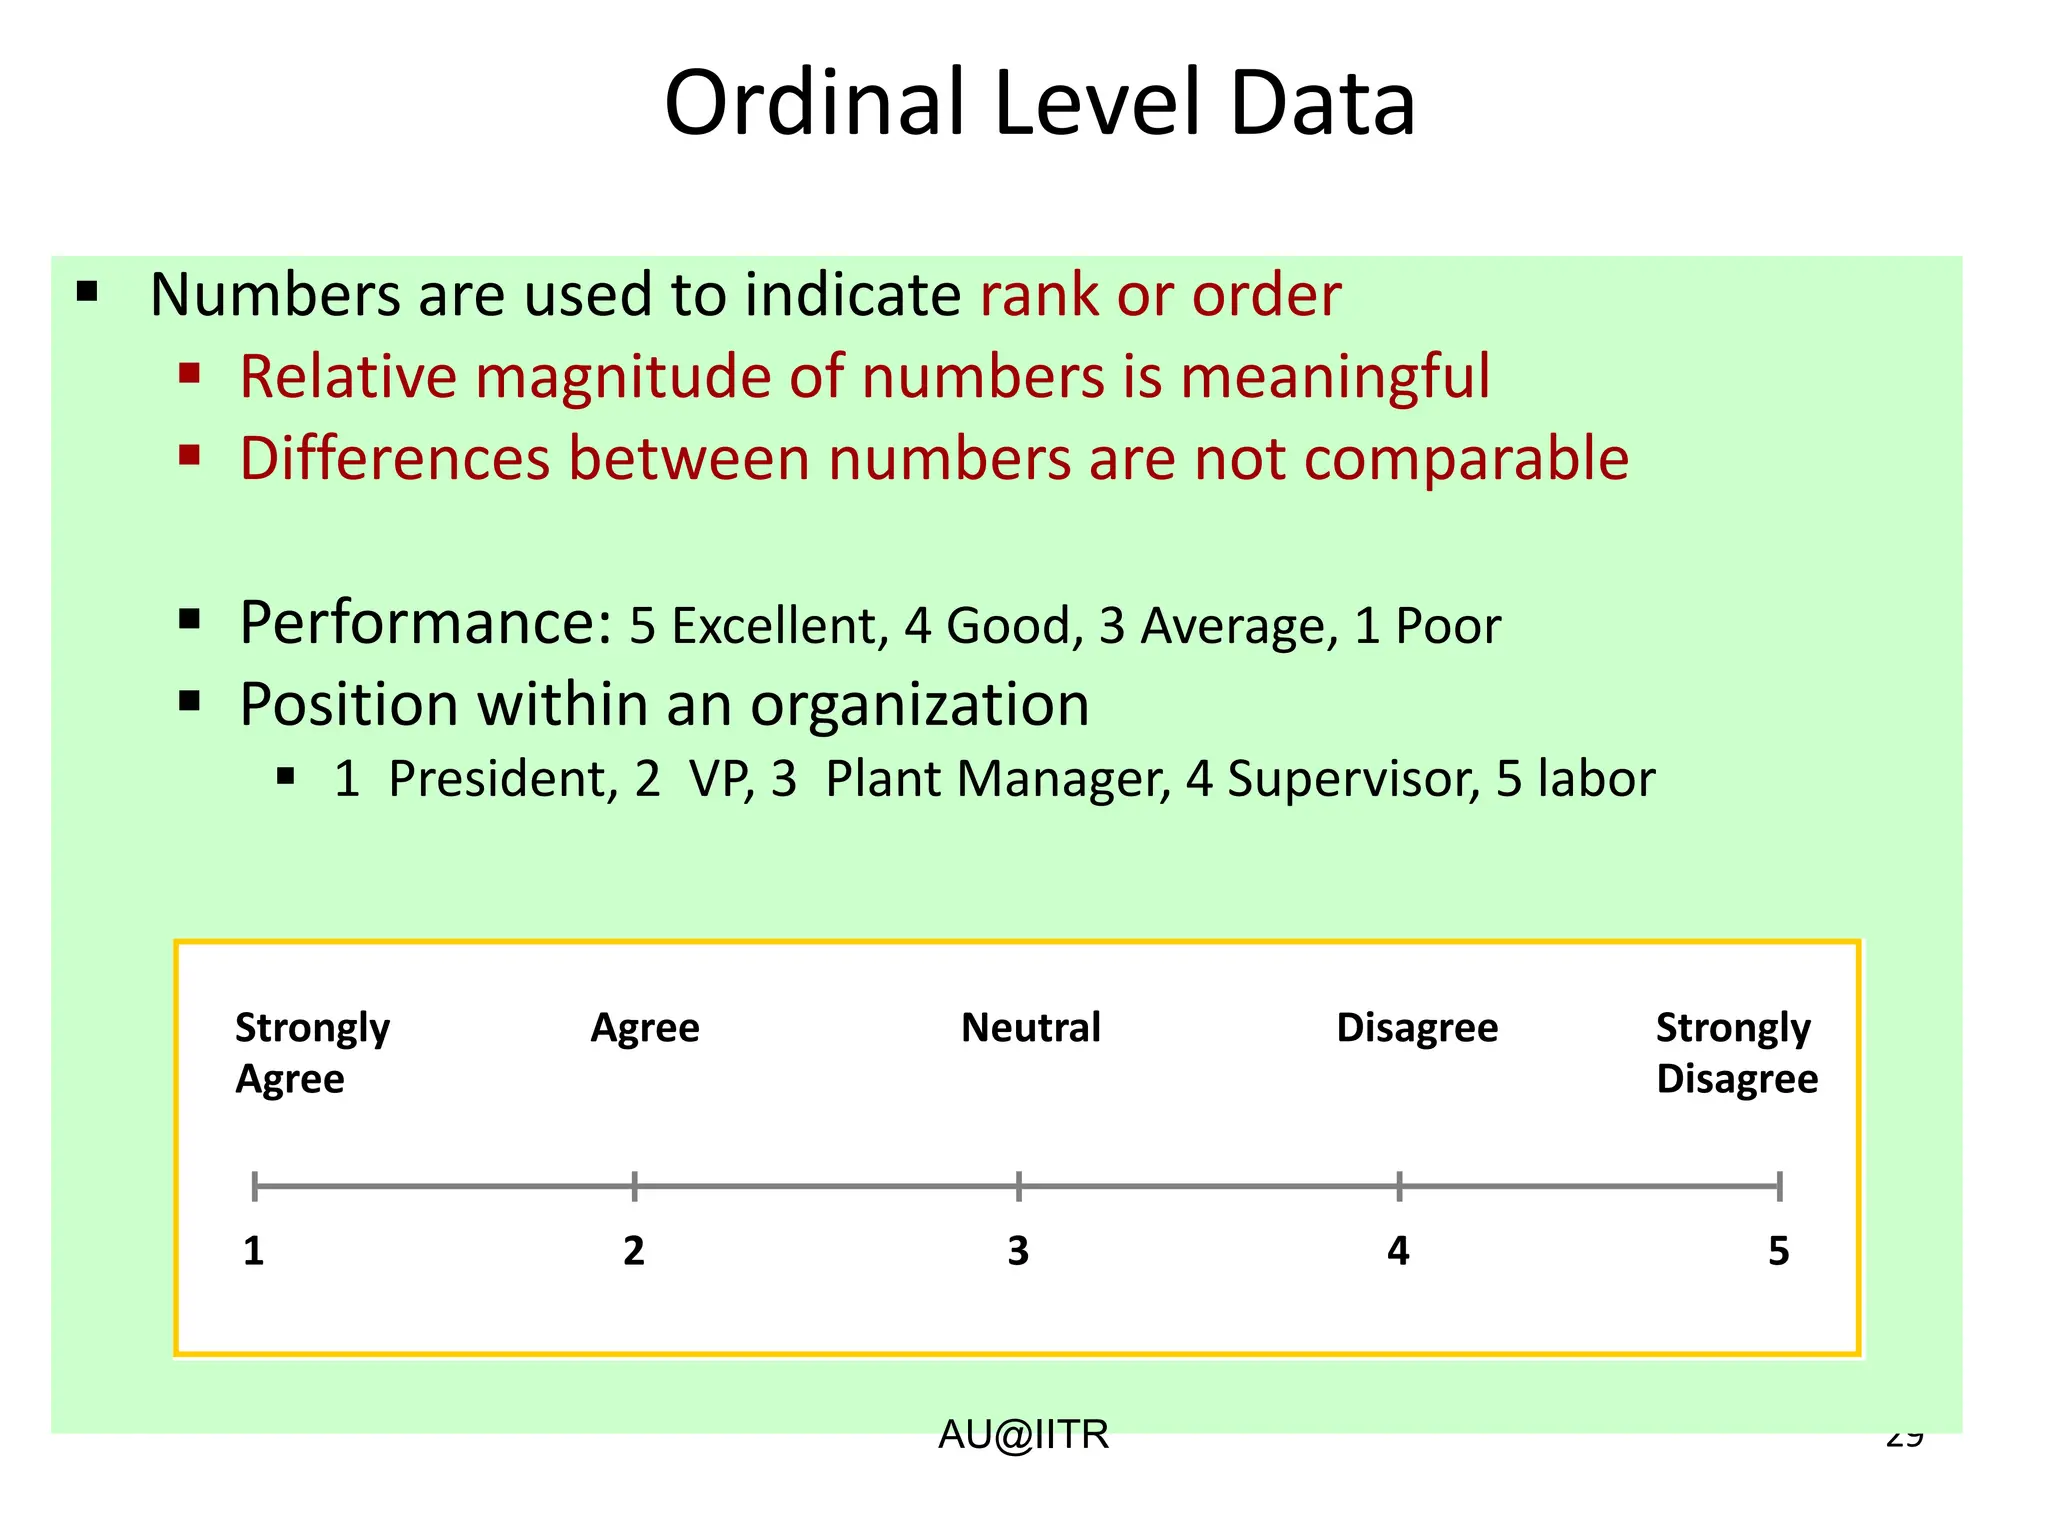
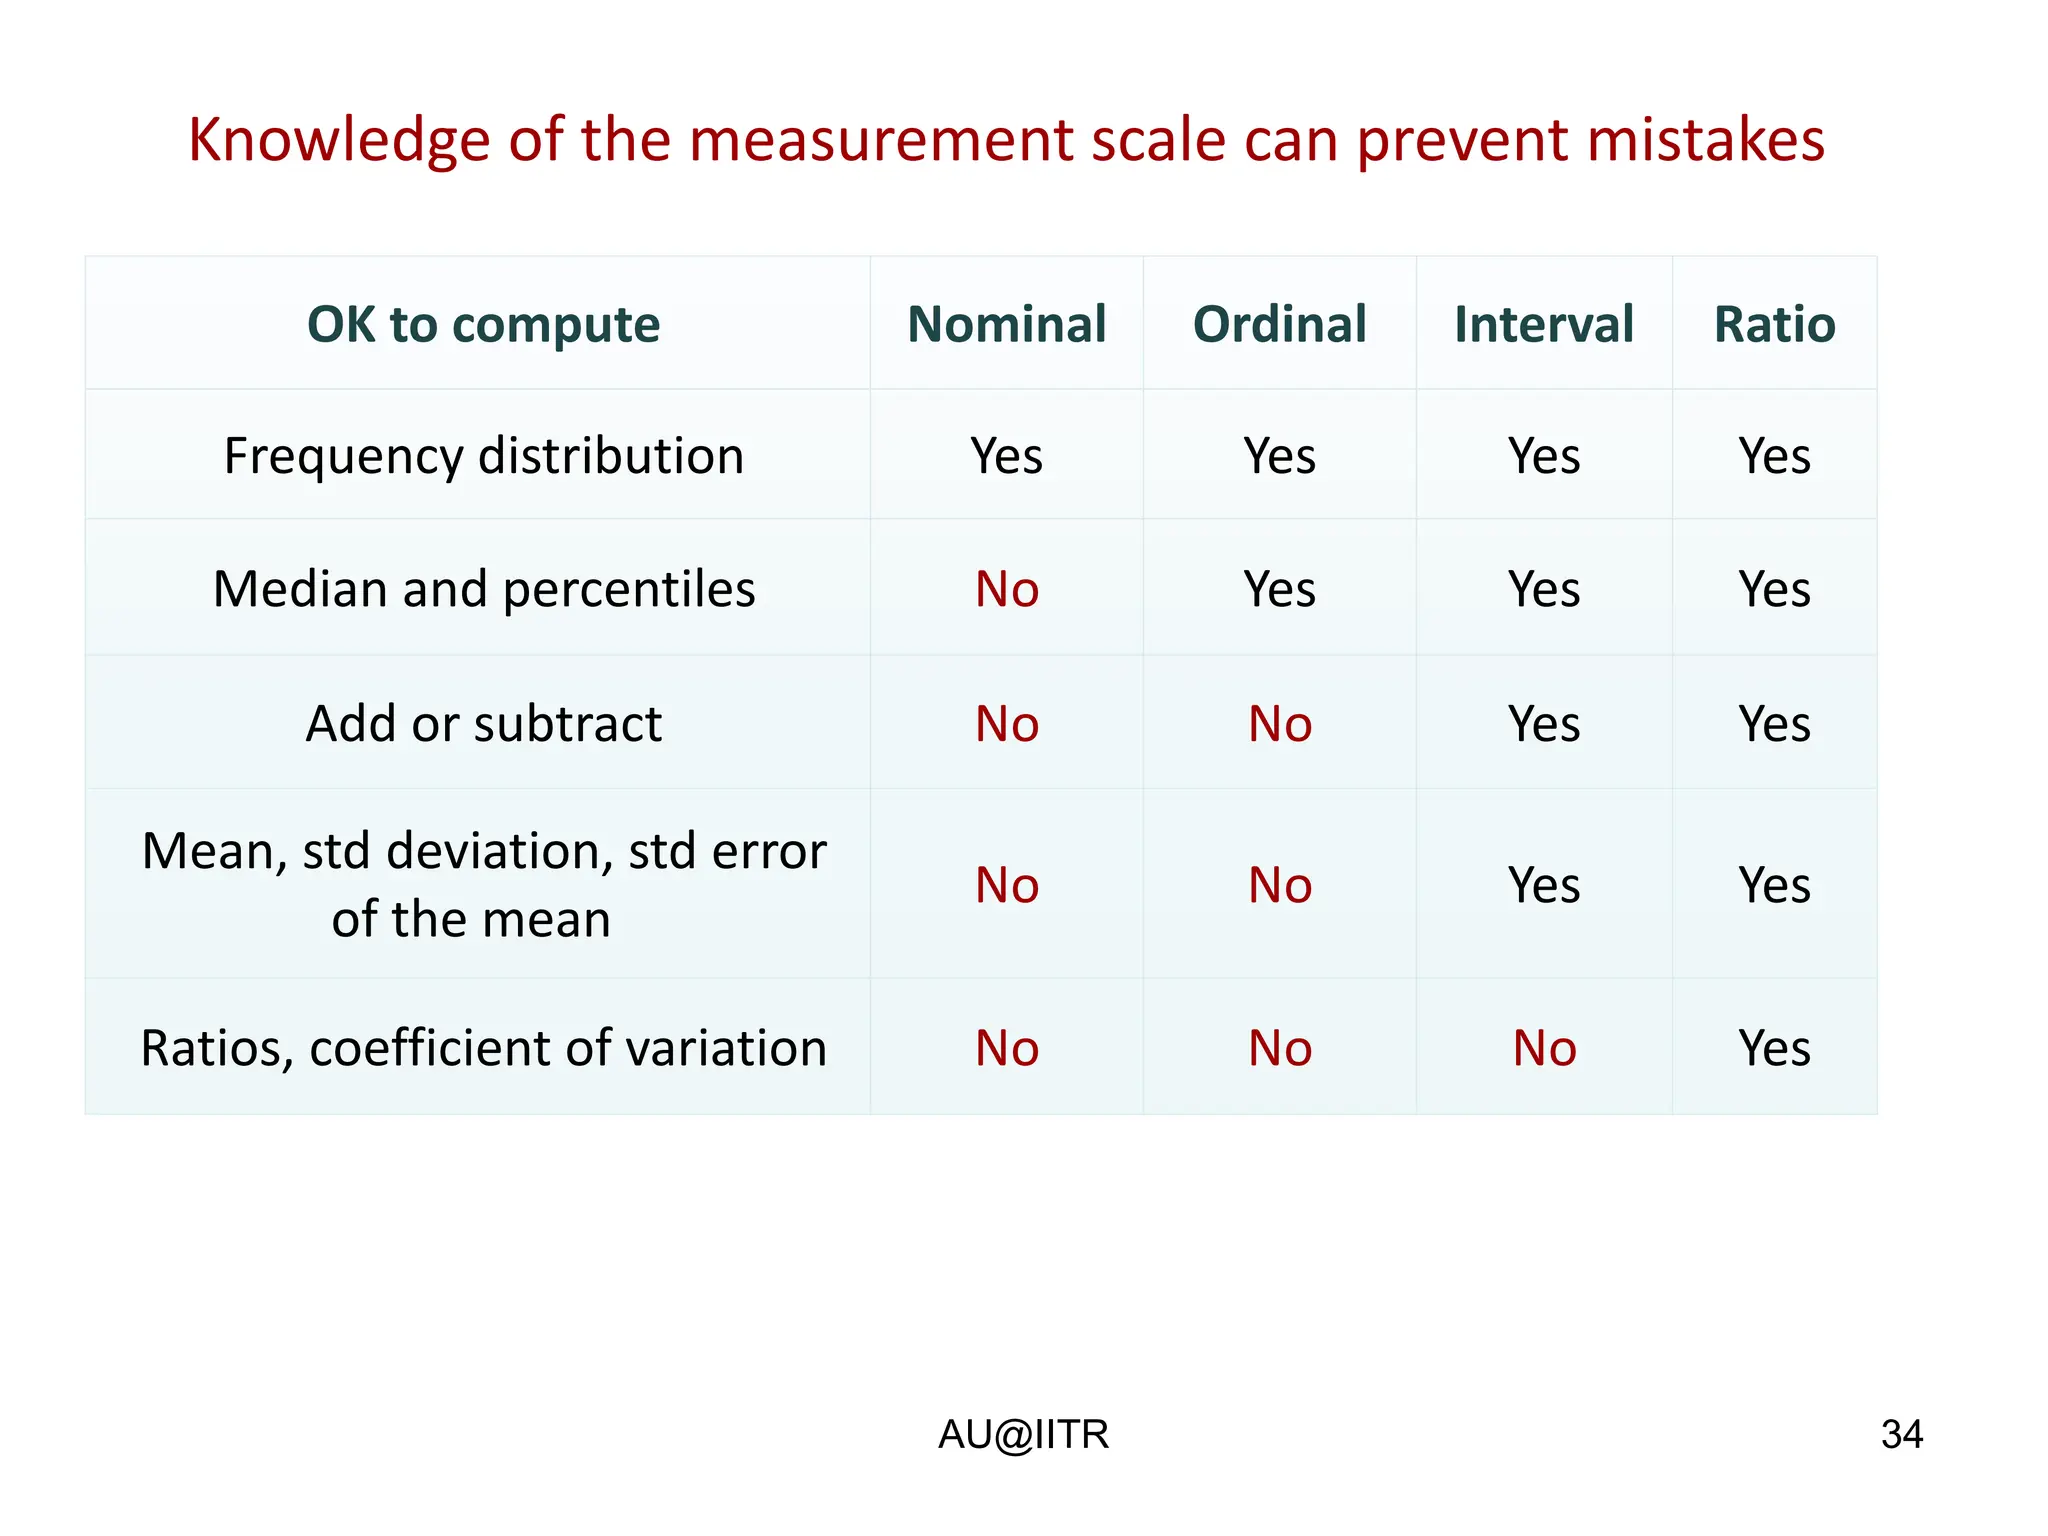
This document provides an introduction to statistics for management. It outlines the course, which will cover descriptive and inferential statistics. Statistics is defined as the science of gathering, analyzing, and interpreting data to draw conclusions. It plays an important role in decision making across many fields like business, medicine, government and everyday life. The course will examine how statistics are used in areas like accounting, economics, finance, management, and marketing. It will also explore key statistical concepts like populations, samples, parameters, and statistics. Finally, it discusses the importance of understanding data measurement and levels of data to appropriately apply statistical methods.
Here are some common sources of primary and secondary data:
Primary data sources:
- Surveys (questionnaires, interviews)
- Experiments
- Observations
- Focus groups
Secondary data sources:
- Government data (census data, vital statistics)
- Published research studies
- Organizational records and documents
- Media reports
- Commercial data providers
This document introduces key concepts in statistics. It discusses the importance of observations in various fields like agriculture, industry, etc. It explains that statistics is used to make many important decisions in life by processing and analyzing numerical data under uncertain conditions. The document also distinguishes between descriptive and inferential statistics. It describes different types of variables like qualitative, quantitative, discrete, and continuous variables. Various methods of data presentation like frequency distributions and cross-tabulation are also introduced.
This document provides an introduction to statistics. It defines statistics as the science of collecting, organizing, analyzing, and drawing conclusions from data. Data is defined as facts or figures collected for a specific purpose. The document outlines the characteristics of statistics and discusses the functions, scope and limitations of statistics. It also distinguishes between primary and secondary data, discrete and continuous data, and descriptive and inferential statistics.
This document discusses data management and statistics. It defines data management as collecting, organizing, presenting, analyzing and interpreting numerical data. There are two main types of statistics: descriptive statistics which describes data and inferential statistics which analyzes data to make predictions. Variables can be qualitative like gender or quantitative like height. Quantitative variables can be discrete like number of students or continuous like weight. Data management is important for research reproducibility and preventing data loss. Statistics is useful in many fields like weather, health, politics and business.
This document provides an overview of statistics presented by five students. It defines statistics as the practice of collecting and analyzing numerical data. Descriptive statistics summarize data through parameters like the mean, while inferential statistics interpret descriptive statistics to draw conclusions. The document discusses examples of statistics, different types of charts and graphs, descriptive versus inferential statistics, and the importance and applications of statistics in fields like business, economics, and social sciences. It also covers topics like sampling methods, characteristics of sampling, probability versus non-probability sampling, and differences between the two.
This document provides an overview of data management and statistics. It discusses the two integral parts of data management as collecting and organizing data. Statistics is useful in many fields including weather forecasting, medical studies, genetics, and the stock market. Proper data management is important as it allows researchers to prove their work, ensure replicability of results, and prevent data loss. Documentation of data analysis and storing of research data and results are key parts of data management.
Statistics is the science of collecting, organizing, summarizing, presenting, and analyzing numerical data. It has two main fields - descriptive statistics which summarizes data, and inferential statistics which makes generalizations beyond the data. There are different types of variables, sources of data, methods of data presentation including tables, graphs, and textual descriptions. Common statistical terms include population, sample, measurement, and classification of variables. Sampling allows studying a small part of the population and generalizing to the whole. Probability and non-probability sampling methods are described.
Data refers to raw information collected for research purposes, while statistics are numerical quantities calculated from the data. There are several key stages to statistical analysis: collection, organization, presentation, analysis and interpretation of data. Data can be classified as quantitative or qualitative depending on whether they are expressed numerically. Primary data are collected directly while secondary data are already available from other sources. Proper selection of the statistical unit of analysis is important for research.
DATA COLLECTION AND PRESENTATION IN PUBLIC HEALTH DENTISTRYPoonam Narang
The basics of data collection, from defining data types to exploring measurement scales. We discussed and outlined various sources for data collection. Text, tables, and graphs are effective communication media that present and convey data and information. They aid readers in understanding the content of research, sustain their interest, and effectively present large quantities of complex information.
This document provides an overview of research methodology. It discusses the meaning and objectives of research, as well as types of research including descriptive, applied, quantitative, conceptual, empirical, qualitative, fundamental, and analytical research. It also distinguishes between research methods and research methodology. The document outlines various sampling methods, data collection methods, data analysis techniques, hypothesis testing, and the steps involved in interpreting and presenting research findings in a report.
This document provides an introduction to statistics. It defines statistics as the scientific methods for collecting, organizing, summarizing, presenting and analyzing data to derive valid conclusions. Statistics is useful across many fields and careers as it helps make informed decisions based on data. The document outlines descriptive and inferential statistics, and notes that descriptive statistics simplifies complexity while inferential statistics allows for conclusions to be drawn. It also discusses types of data sources, including primary data collected directly and secondary data that has already been collected.
The document provides an introduction to statistical concepts, explaining that statistics is used to extract useful information from data to help with decision making. It discusses different types of data, variables, methods of data collection and quality, as well as statistical analysis techniques including descriptive statistics, inferential statistics, frequency distributions, graphs and charts. The goal of statistics is to summarize and analyze data to draw conclusions and make informed business decisions.
Elementary Statistics for Business.pptxHarish Augad
Elementary Statistics for Business provides an overview of how statistics is used in various business functions and decision making. It discusses how statistical analysis is used in marketing to understand customer needs and determine appropriate strategies. Operations and supply chain management also relies on statistics to make decisions around production levels and costs. Finance and purchasing both use historical statistical data to inform efficient practices. Business research primarily analyzes numerical and text data to solve business problems. Descriptive and inferential statistics are introduced as the main branches of statistics used. Common measures of central tendency like mean, median and mode are also outlined.
This document discusses the role and importance of statistics in scientific research. It begins by defining statistics as the science of learning from data and communicating uncertainty. Statistics are important for summarizing, analyzing, and drawing inferences from data in research studies. They also allow researchers to effectively present their findings and support their conclusions. The document then describes how statistics are used and are important in many fields of scientific research like biology, economics, physics, and more. It also provides examples of statistical terms commonly used in research studies and some common misuses of statistics.
Statistical analysis and Statistical process in 2023 .pptxFayaz Ahmad
Fayaz Ahmad (known as Feng fei in China) is a PhD scholar in Biostatistics and Epidemiology at Zhengzhou University in China. He has over 5 years of experience working in universities in Pakistan and has received several awards for his work, including developing a mosquito killing device. He is a member of the American Statistical Association and coordinates statistical training programs in Pakistan.
This document provides an introduction and definition of statistics. It discusses statistics in both the plural and singular sense, as numerical data and as a method of study, respectively. It also outlines the basic terminologies in statistics such as data, population, sample, parameters, variables, and scales of measurement. Finally, it discusses the classification and applications of statistics as well as its limitations.
This document provides an overview of business research including definitions, types of research, research process and methodology. It discusses quantitative vs qualitative research, descriptive vs explanatory research, and basic vs applied research. It also outlines research applications in various business functions like marketing, finance, human resources and production. Additionally, it covers research process, data sources, questionnaire method, measurement scales, sampling techniques and criteria for good research.
This document provides an introduction to statistics, including defining key terms and concepts. It discusses what statistics is, the difference between populations and samples, parameters and statistics. It also outlines the two main branches of statistics - descriptive statistics, which involves organizing and summarizing data, and inferential statistics, which uses samples to draw conclusions about populations. The document then discusses different types of data, such as qualitative vs. quantitative, and the four levels of measurement for quantitative data. Finally, it discusses methods for designing statistical studies and collecting data, such as interviews, questionnaires, observation, and using registration data or mechanical devices.
Statistics is the discipline concerned with collecting, organizing, analyzing, interpreting, and presenting data. Descriptive statistics summarize and describe data through graphs, tables, and numerical measures. Inferential statistics make inferences about populations based on samples through techniques like hypothesis testing and confidence intervals. Statistics is widely applied in business, economics, and other fields to help make data-driven decisions.
Stastistics in Physical Education - SMK.pptxshatrunjaykote
• It is a specific branch of mathematics that deals with analysis of data collected on various population groups
• Statistics involves mathematical abilities more than addition, subtraction, division and multiplication which are repeated many times in a logical fashion.
• for fuller details of statistical tests may refer to Chandha (1992); Vincent (1995); Hopkin et al. (1996); Sincrich et al. (2002); Triola (2002)
• Understanding of basic statistics is indispensable for dealing with the process of evaluation of test and measurement.
• The statistical concepts facilities proper and effective interpretation of test scores or measurements taken by the coach or a physical educator
• While a computer assists the teacher or the coach in saving the huge time needed for enormous calculations, but the meaning of results is made clear only through the understanding of relevant statistical test concepts.
• Tests act as seed to measurements, the statistical tests act as seed to the construction of all other types of tests and are also essential for the testing of validity, reliability and objectivity of all tests.
The information which we can deduce from test and measurement is based on our statistical ability. It is the statistical tools which enable us to do the following important functions:
1. Organize and tabulate date (presentation of facts in a definite form)
2. Analysis data
3. Synthesize data (classification / combination of facts)
4. Compare groups of data
5. Simplification of unwieldy and complex data
6. Proper interpretation of a data
7. testing of hypotheses
8. understand the relationship and association between different parameters, make predications and take decisions.
9. Construction of physical, psychomotor and written tests
10. Evaluation of individual measurements
11. selection of sportsperson
12. Monitoring of training and teaching effects and testing the need for individualization of training and teaching.
13. Meaning: The word “statistics” is a plural form of ‘statistic’. The term statistic is uncommon to that an extent that many of the students of statistics may be unaware of its singular form. The word statistics has been taken from German word ‘statistik’ meaning a political state. Since, facts and figures were required in olden days mainly by kings for their administration. Therefore, in the beginning. It was also known as the ‘Science of Kings’ (Chadha, 1992). Subsequently, its scope has greatly widened and statistics now refers to a huge body of methods, symbols and formulae dealing with phenomena that can be described numerically providing quantitative arrays of information
14. Statistic is numerical value which characterizes a group of scores. For example the average height characterizes the entire sample whose all subjects’ heights have been measured to calculate the average height. A number of such characterizing values refer to the plural form of above mentioned statistic and thus, give rise to the more commonly used
This document provides an overview and introduction to an economics statistics course. It discusses key topics that will be covered in the course, including:
- Descriptive and inferential statistics
- Probability theory as the bridge between descriptive and inferential statistics
- The process of statistical investigation from designing experiments/surveys to making inferences and assessing reliability
- Examples of how statistics is used to analyze data and make decisions in various fields like government, business, and research.
This document discusses research design and proposal. It defines research design as an outline or plan for a research project. The design should include details like the researcher, objectives, data inputs, analytical methods, and resources. Research design can be qualitative, quantitative, or mixed methods. Qualitative research explores issues and motivations through methods like interviews, while quantitative examines relationships between variables using statistical analysis. Research objectives can be exploratory to gain insight, descriptive to identify patterns, or causal to determine cause-and-effect relationships through experiments. Proper research design helps ensure accurate and valid findings.
1. The document introduces statistics and probability concepts relevant to engineering problems including collecting and analyzing data.
2. Key methods of collecting engineering data are retrospective studies, observational studies, and designed experiments, with advantages and disadvantages of each.
3. Statistical concepts such as populations, samples, variables, and probability are defined and related to engineering applications.
This document provides an introduction to statistics. It discusses key concepts including the role of statistics in research, the typical research process, variables, scales of measurement, and descriptive and inferential statistics. Specifically, it describes how statistics is used for collecting, analyzing and interpreting data to answer research questions. It also outlines the typical steps in research including developing questions and hypotheses, choosing measures, designing the study, analyzing data, and drawing conclusions.
Audit and stat for medical professionalsNadir Mehmood
This document discusses clinical audit and statistics. It begins by defining audit and its importance in clinical practice. The document outlines the types of audit and how statistics are used in clinical practice. It discusses the components of a clinical audit and defines key statistical terms like population, sample, and descriptive statistics. The document provides examples to illustrate statistical concepts and calculations like descriptive statistics and the area under the curve of a normal distribution. It emphasizes that the goal of statistics is to summarize data in a way that is understandable for non-statisticians.
Statistics can be categorized into descriptive and inferential types. Descriptive statistics summarize data from samples using measures like mean and standard deviation, while inferential statistics interpret descriptive statistics to draw conclusions. There are four levels of measurement scales: nominal for categories without ordering; ordinal for ordered categories; interval for equal intervals but arbitrary zero; and ratio for absolute zero. Proper use of statistics and scales allows for accurate data analysis across various fields.
Statistics is the science of dealing with data about populations and using statistical techniques to make decisions that affect our lives. It is used extensively in fields like marketing, accounting, and healthcare to better understand data and make effective decisions. Studying statistics allows for simple presentation of complex data, expands individual knowledge and experience, facilitates comparison of large data sets, and helps with forecasting by extrapolating present data to predict future changes. Statistics provides a more reliable basis for decision-making than individual perceptions alone.
This document provides an overview of key concepts in statistics including descriptive statistics, inferential statistics, data, and data sources. It discusses the definition of statistics, applications of statistics in business, economics, and the state. Descriptive statistics are used to summarize and describe data through graphical representations like histograms and numerical measures like the mean and standard deviation. Inferential statistics are used to make generalizations about a population based on a sample. The document also defines topics like data types, elements, variables, observations, and scales of measurement. Finally, it discusses data acquisition considerations like time requirements and data errors.
06-04-2024 - NYC Tech Week - Discussion on Vector Databases, Unstructured Data and AI
Round table discussion of vector databases, unstructured data, ai, big data, real-time, robots and Milvus.
A lively discussion with NJ Gen AI Meetup Lead, Prasad and Procure.FYI's Co-Found
State of Artificial intelligence Report 2023kuntobimo2016
Artificial intelligence (AI) is a multidisciplinary field of science and engineering whose goal is to create intelligent machines.
We believe that AI will be a force multiplier on technological progress in our increasingly digital, data-driven world. This is because everything around us today, ranging from culture to consumer products, is a product of intelligence.
The State of AI Report is now in its sixth year. Consider this report as a compilation of the most interesting things we’ve seen with a goal of triggering an informed conversation about the state of AI and its implication for the future.
We consider the following key dimensions in our report:
Research: Technology breakthroughs and their capabilities.
Industry: Areas of commercial application for AI and its business impact.
Politics: Regulation of AI, its economic implications and the evolving geopolitics of AI.
Safety: Identifying and mitigating catastrophic risks that highly-capable future AI systems could pose to us.
Predictions: What we believe will happen in the next 12 months and a 2022 performance review to keep us honest.
The Building Blocks of QuestDB, a Time Series Databasejavier ramirez
Talk Delivered at Valencia Codes Meetup 2024-06.
Traditionally, databases have treated timestamps just as another data type. However, when performing real-time analytics, timestamps should be first class citizens and we need rich time semantics to get the most out of our data. We also need to deal with ever growing datasets while keeping performant, which is as fun as it sounds.
It is no wonder time-series databases are now more popular than ever before. Join me in this session to learn about the internal architecture and building blocks of QuestDB, an open source time-series database designed for speed. We will also review a history of some of the changes we have gone over the past two years to deal with late and unordered data, non-blocking writes, read-replicas, or faster batch ingestion.
Enhanced Enterprise Intelligence with your personal AI Data Copilot.pdfGetInData
Recently we have observed the rise of open-source Large Language Models (LLMs) that are community-driven or developed by the AI market leaders, such as Meta (Llama3), Databricks (DBRX) and Snowflake (Arctic). On the other hand, there is a growth in interest in specialized, carefully fine-tuned yet relatively small models that can efficiently assist programmers in day-to-day tasks. Finally, Retrieval-Augmented Generation (RAG) architectures have gained a lot of traction as the preferred approach for LLMs context and prompt augmentation for building conversational SQL data copilots, code copilots and chatbots.
In this presentation, we will show how we built upon these three concepts a robust Data Copilot that can help to democratize access to company data assets and boost performance of everyone working with data platforms.
Why do we need yet another (open-source ) Copilot?
How can we build one?
Architecture and evaluation
Unleashing the Power of Data_ Choosing a Trusted Analytics Platform.pdfEnterprise Wired
In this guide, we'll explore the key considerations and features to look for when choosing a Trusted analytics platform that meets your organization's needs and delivers actionable intelligence you can trust.
STATATHON: Unleashing the Power of Statistics in a 48-Hour Knowledge Extravag...sameer shah
"Join us for STATATHON, a dynamic 2-day event dedicated to exploring statistical knowledge and its real-world applications. From theory to practice, participants engage in intensive learning sessions, workshops, and challenges, fostering a deeper understanding of statistical methodologies and their significance in various fields."
3. Dedicated to
Professor. S. G. Deshmukh
3
Slides mostly from Prof. Deshmukh’s Statistics course at IIT Delhi
4. 4
What is Statistics?
• Science of gathering, analyzing, interpreting, and presenting data,
and drawing conclusions.
• Scientific method that enables us to make decisions as responsibly
as possible.
• Word “statistics” is both: Plural and Singular !
• Plays an important role in every area of decision making
• Often incorrectly thought of as just a collection of data, graphs and
diagrams
AU@IITR
5. 5
Statistics in Business
• Accounting — auditing and cost estimation
• Economics — regional, national, international performance
• Finance — investments and portfolio management
• Management — HR, compensation, and Quality management
• MIS - performance of systems which gather, summarize, and
disseminate information to various managerial levels
• Marketing — market analysis and consumer research
AU@IITR
6. 6
Answers Questions from Everyday Life
• Education: In which B-school I can get the highest RoI?
• Business: Will a new marketing strategy be profitable?
• Industry: Will a product’s life exceed the warranty period?
• Medicine: Will a new vaccine reduce the chance of COVID?
• Government: Will a change in interest rates affect inflation?
AU@IITR
7. 7
Areas of concern: Some examples
• ToI: whether an increase in the subscription price will adversely
affect the number of subscribers.
• Pepsi : whether a celebrity’s advertisements have led to increased
sales
• Ministry of Home Affairs: impact of streamlined procedures for
passport applications
• Supreme Court: whether use of CNG vehicles/ Odd-Even rule has
reduced the level of pollution in Delhi
AU@IITR
8. 8
Statistics all pervading !
• In Cricket (Ex: Records of centuries, wickets etc.)
• In Movies (Ex: imdb.com )
• In Media (Ex: TV serial ratings)
• In Stock market (Ex: Share prices)
• In National Economy (Ex: WPI, Inflation, Growth, etc)
AU@IITR
9. 9
Statistics Day: 29th June
Birth anniversary of great statistician, Prof P C
Mahalonobis
– Founder of Indian Statistical Institute (1931)
– Started Journal Sankhya
– Central Statistical Organization (CSO) for systematization
and collection of administrative data
– National Sample Survey Organization (NSSO) for
conducting large scale surveys to support policy planning
AU@IITR
10. 10
Decision making process..
1. Collect pertinent information that is as reliable as possible.
2. Select the parts of the available information that are most helpful
to make rational decisions.
3. Draw conclusions as sensibly as possible based on the available
evidence.
4. Evaluate the risk and value (performance measures) of alternative
actions.
5. Make the decision
AU@IITR
12. 12
Statistics: Science of variability..?
• Practically everything varies
• Variation occurs among individuals, processes
• Variation also occurs over time
AU@IITR
13. 13
Population Versus Sample
• Population — the whole
– a collection of persons, objects, or items under study
– Census — gathering data from the entire population
• Sample — a portion of the whole
– a subset of the population
– a part of the population from which we collect information, used
to draw conclusions about the whole (statistical inference)
• Why not collect information for the whole population?
AU@IITR
14. 14
Statistics: Two broad categories
• Descriptive Statistics — using data gathered on a group to
describe or reach conclusions about that same group only.
• Inferential Statistics — using sample data to reach conclusions
about the population from which the sample was taken.
AU@IITR
15. 15
Descriptive statistics..
• Encompasses the following:
– Graphical or pictorial display of patterns
– Condensation of large masses of data into a form such as tables
– Preparation of summary measures to give a concise
description of complex information (e.g. an average figure)
AU@IITR
16. 16
Inferential Statistics..
• Encompasses the following:
– Determining whether characteristics of a situation are usual or
unusual (happened by chance) - e.g. SQC
– Estimating values of numerical quantities and determining the
reliability of those estimates – Confidence interval
– Using past occurrences to attempt to predict the future
AU@IITR
17. 17
Types of Studies
• Observational Studies
– Observe individuals and measure variables of interest but do not
attempt to influence the responses.
– Purpose is to describe some group or situation.
– No outside interference, subjects select themselves into groups, cannot
say anything about cause and effect.
• Designed Experiments
– Impose some treatment(s) on individuals or groups of individuals in
order to observe their responses.
– Purpose of an experiment is to study whether the treatment(s) causes a
change in the response.
AU@IITR
18. 18
Examples
• Scientific Surveys
– Central or state government surveys
– Institutional surveys.
– NGO survey
– Commercial survey research firms (IMRB)
• Designed Experiments
– Laboratory experiments
– Clinical Trials
– Field experiments
AU@IITR
19. 19
Discussion Example
• A professor needed some data to illustrate a point. His
favorite student went out into the lobby and asked the first 12
male students who walked by what their height and weight
were.
• What are the limitations of this data set? What could we infer
about the population of all students from this data set?
AU@IITR
20. 20
Discussion Example…
• Population
– Set of all elements of interest in a particular study
– Example: Set of all IIT Roorkee students
• Sample
– A subset of population
– Example: Set of all MBA 1st year students ?
AU@IITR
21. 21
Parameter vs. Statistic
• Parameter — descriptive measure of the population
• Statistic — descriptive measure of a sample
Measurement
Statistic
Roman or lowercase
Parameter
Greek or uppercase
Data Elements x X
Mean x̄ μ
Standard deviation s σ
Variance s2 σ2
Number of elements n N
Correlation Coefficient r ρ
AU@IITR
22. 22
Process of Inferential Statistics
)
(parameter
Population
Sample
x
(statistic )
Calculate x
to estimate
Select a
random sample
AU@IITR
23. 23
What are Data?
• Data: Systematically recorded information together with
context
• Context Tells
• What was measured
• Where data were collected
• When data were collected
• Why study was performed
• How data were collected
Data are useless without context
• Note: Data is plural and datum is singular.
AU@IITR
24. 24
Data...
• Secondary data : Data that has been gathered earlier for
some other purpose
– Sources: Company reports, GoI reports, RBI reports etc.
• Primary data: Data that are collected first hand specifically for
the purpose of facilitating a study
– Sources: Observations, Questionnaire, Interview etc.
AU@IITR
25. 25
Examples of Data available from company
Employee records Name, code, designation, address, salary,
leave,
Production record Item code, quantity produced, labor cost,
material cost
Inventory record Item code, units-on-hand, reorder level,
order quantity
Sales record Product number, volume, volume by
region, category of item etc.
Customer record Age, gender, income level, address,
quantity purchased
AU@IITR
26. 26
Examples of Data available from various Agencies
Reserve Bank of India
www.rbi.org.in
Lending/borrowing rates, financial health of
the country
Census of India
www.censusindia.net
Population figures, demographic details
Centre for Monitoring of
Indian Economy
www.cmie.com
Economic indicators related to Indian
economy, sector-wise performance
Confederation of Indian
Industry
www.cii.in
Business performance, company records etc.
IIT Roorkee
AIS
Academic related data
AU@IITR
27. 27
Levels of Data Measurement
• Nominal — Lowest level of measurement
• Ordinal
• Interval
• Ratio — Highest level of measurement
AU@IITR
28. 28
Nominal Level Data
• Numbers are used to classify or categorize
▪ aka Categorical data
▪ Employment Classification
1 for Professor; 2 for Staff; 3 for Contractual Workers
▪ Gender :”M”, “F”
▪ Degree of a student at IIT Roorkee
1 for B Tech, 2 for M Tech, 3 for M Sc; 4 for MBA, 5 for PhD
AU@IITR
29. 29
Ordinal Level Data
▪ Numbers are used to indicate rank or order
▪ Relative magnitude of numbers is meaningful
▪ Differences between numbers are not comparable
▪ Performance: 5 Excellent, 4 Good, 3 Average, 1 Poor
▪ Position within an organization
▪ 1 President, 2 VP, 3 Plant Manager, 4 Supervisor, 5 labor
1 2 3 4 5
Strongly
Agree
Agree Strongly
Disagree
Disagree
Neutral
AU@IITR
30. 30
Interval Level Data
• Distances between consecutive integers are equal
– Relative magnitude of numbers is meaningful
– Differences between numbers are comparable
– Location of origin, zero, is arbitrary
Examples: Date, Clock time, Monetary Utility, Temperature (degree
F/C)
AU@IITR
31. 31
Ratio Level Data
• Highest level of measurement
– Relative magnitude of numbers is meaningful
– Differences between numbers are comparable
– Location of origin, zero, is absolute (natural)
Examples: Height, Weight, Volume, Profit, Loss, Revenues, Inventory
Turnover
AU@IITR
32. 32
Usage potential of various levels of data
Qualitative /
Categorical
Quantitative /
Numerical
Quantitative variables can also be classified into Discrete & Continuous.
AU@IITR
33. 33
Data Level, Operations, & Statistical Methods
Data Level
Nominal
Ordinal
Interval
Ratio
Meaningful Operations
Classifying and Counting
All of the above plus Ranking
All of the above plus Addition,
Subtraction, Multiplication,
and Division
All of the above
Statistical
Methods
Nonparametric
Nonparametric
Parametric
Parametric
Some control over the measurement scale:
Temperature: Choose degree C/F → Interval. Degree Kelvin → Ratio scale
Income: ask categories (low, medium, high) → Ordinal. Actual income → Ratio
AU@IITR
34. 34
OK to compute Nominal Ordinal Interval Ratio
Frequency distribution Yes Yes Yes Yes
Median and percentiles No Yes Yes Yes
Add or subtract No No Yes Yes
Mean, std deviation, std error
of the mean
No No Yes Yes
Ratios, coefficient of variation No No No Yes
Knowledge of the measurement scale can prevent mistakes
AU@IITR
35. 35
Methods of visual presentation of data:
Graphs & Tables → Book Levin Chapter 2
AU@IITR
36. 36
Can Statistics be trusted?
It is easy to lie with statistics. But it is easier to lie without them.
Frederick Mosteller
Figures won’t lie, but liars will figure.
Charles Grosvenor
There are three kinds of lies: Lies, damned lies, and statistics.
Mark Twain
Science without Statistics bear no fruit,
Statistics without Science have no roots !
AU@IITR