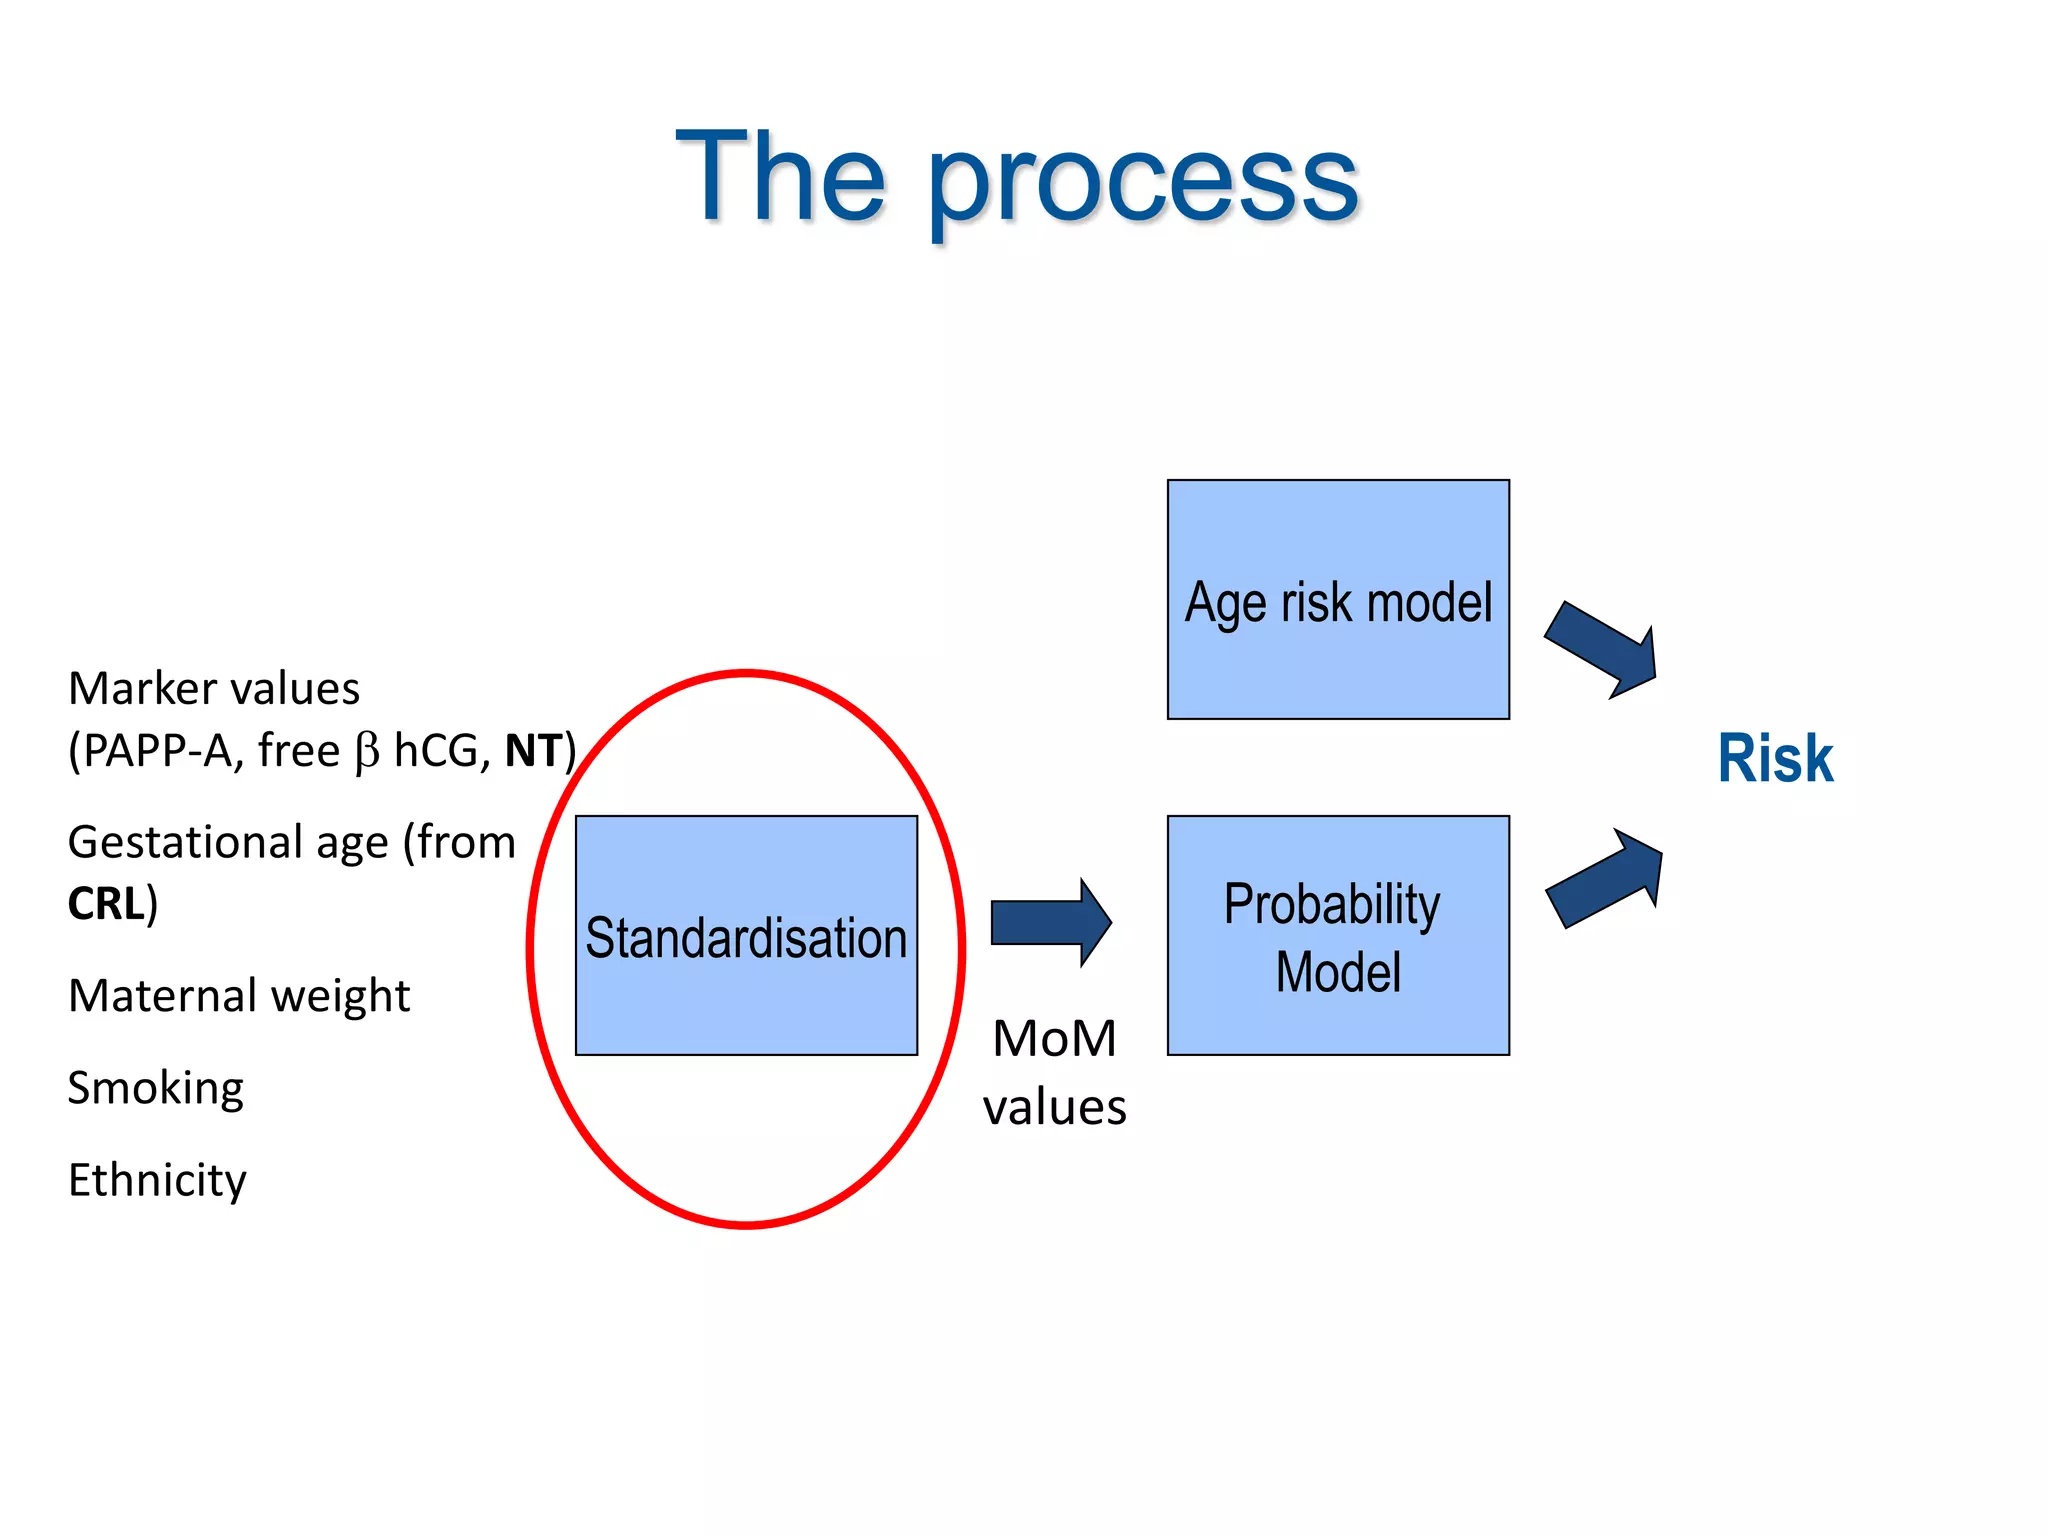
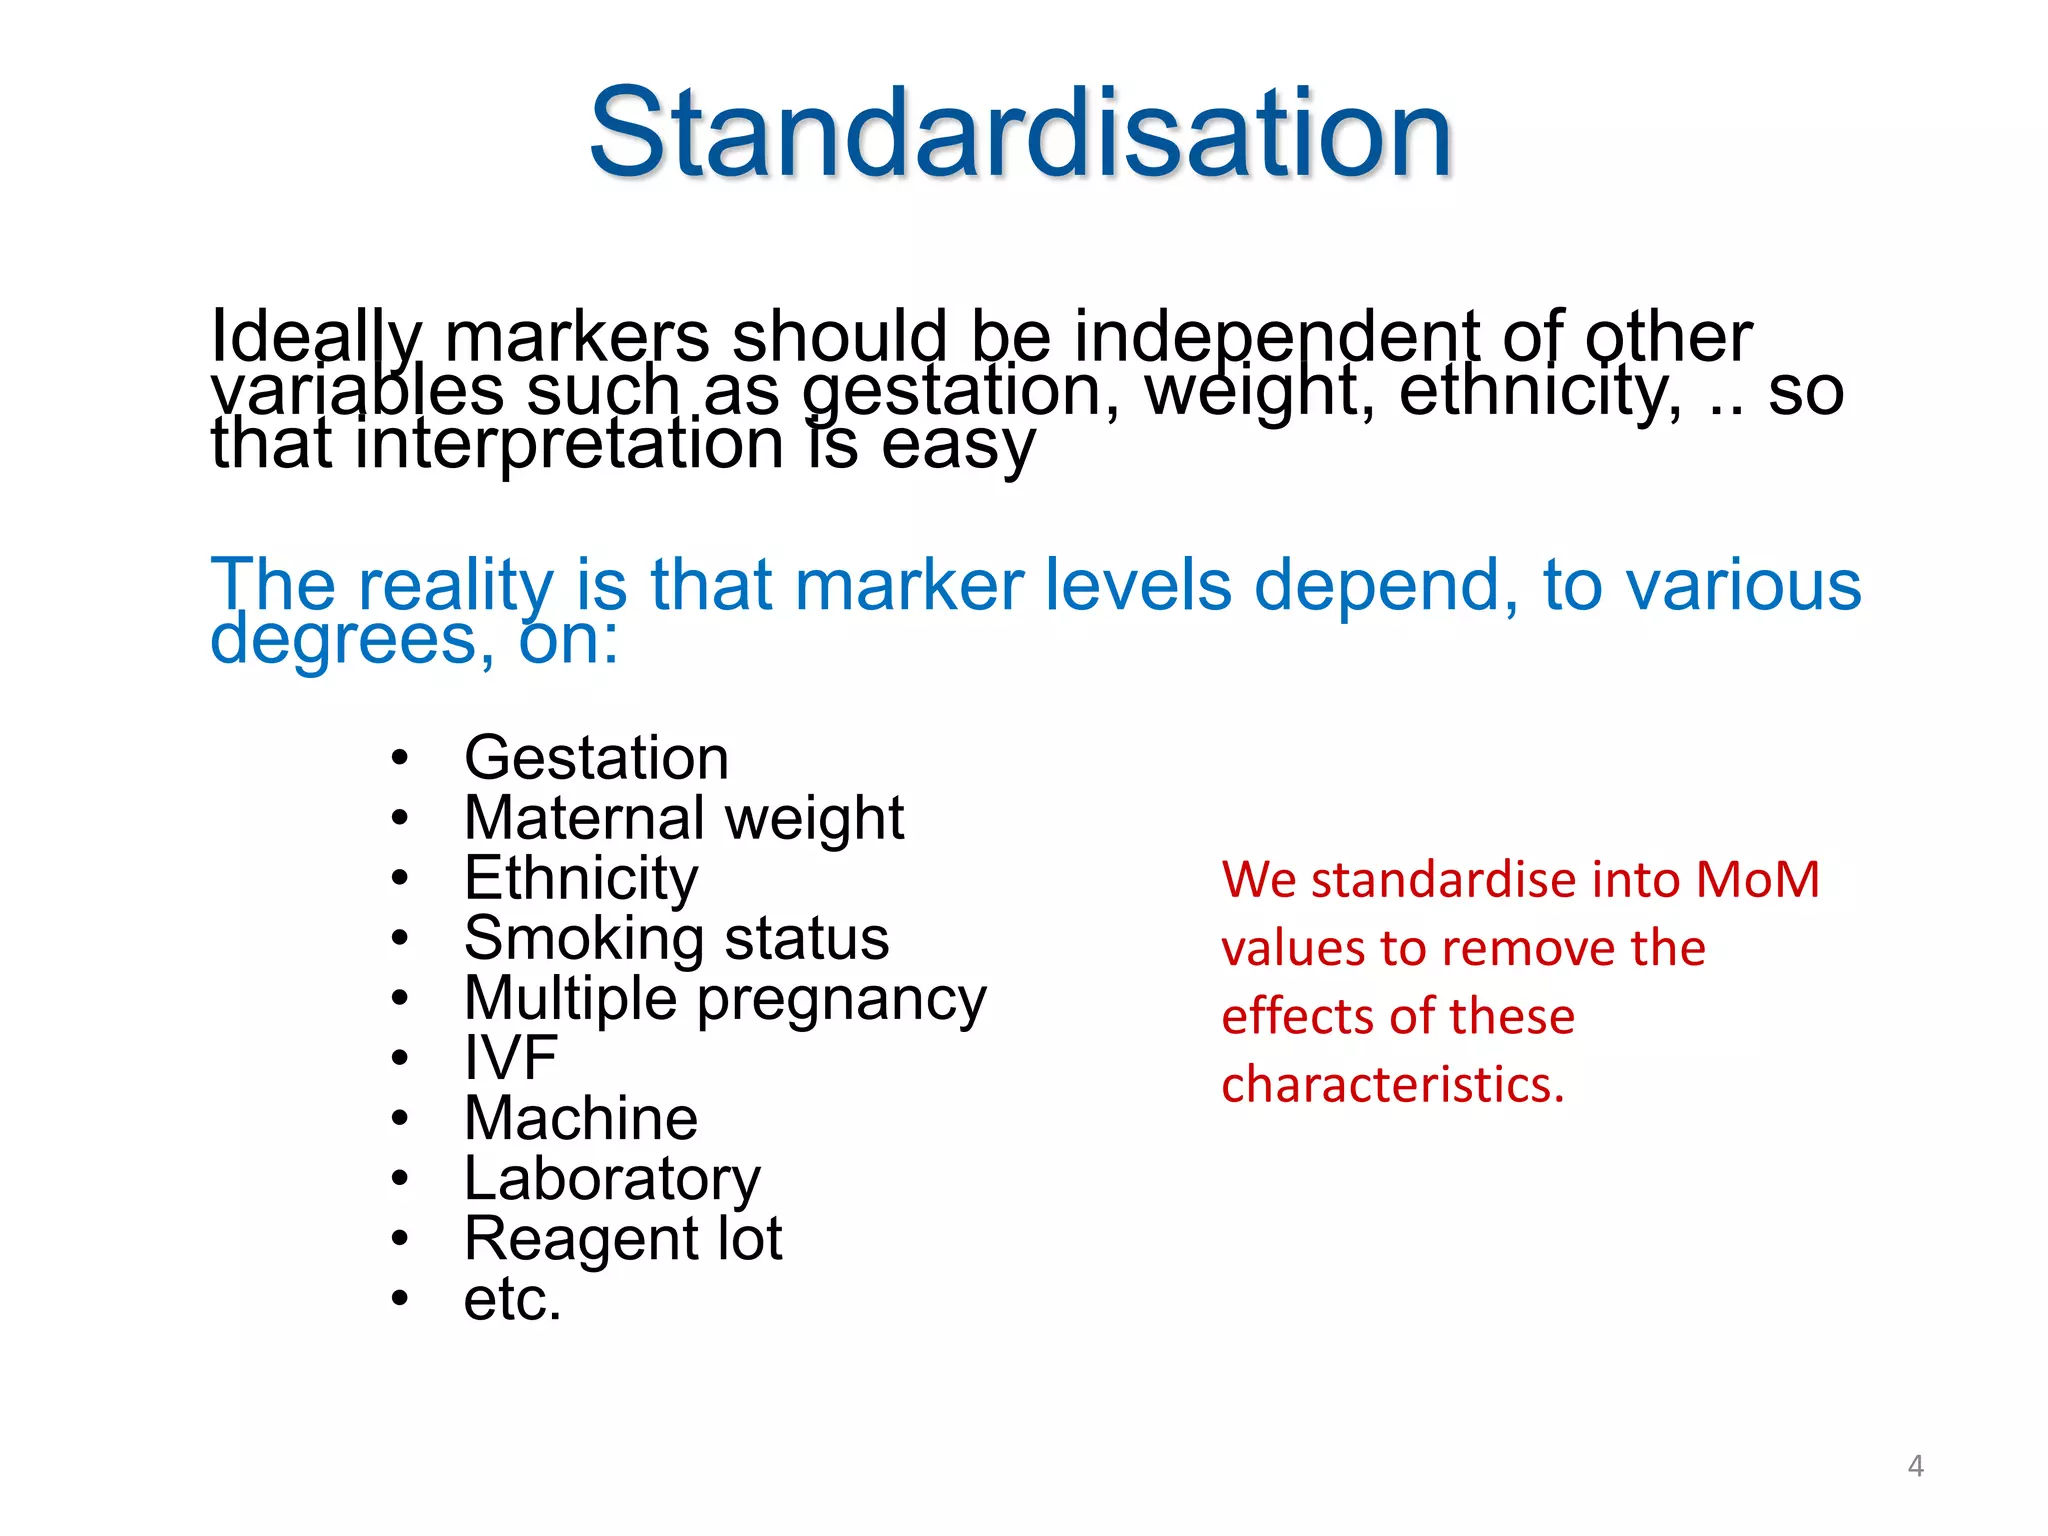
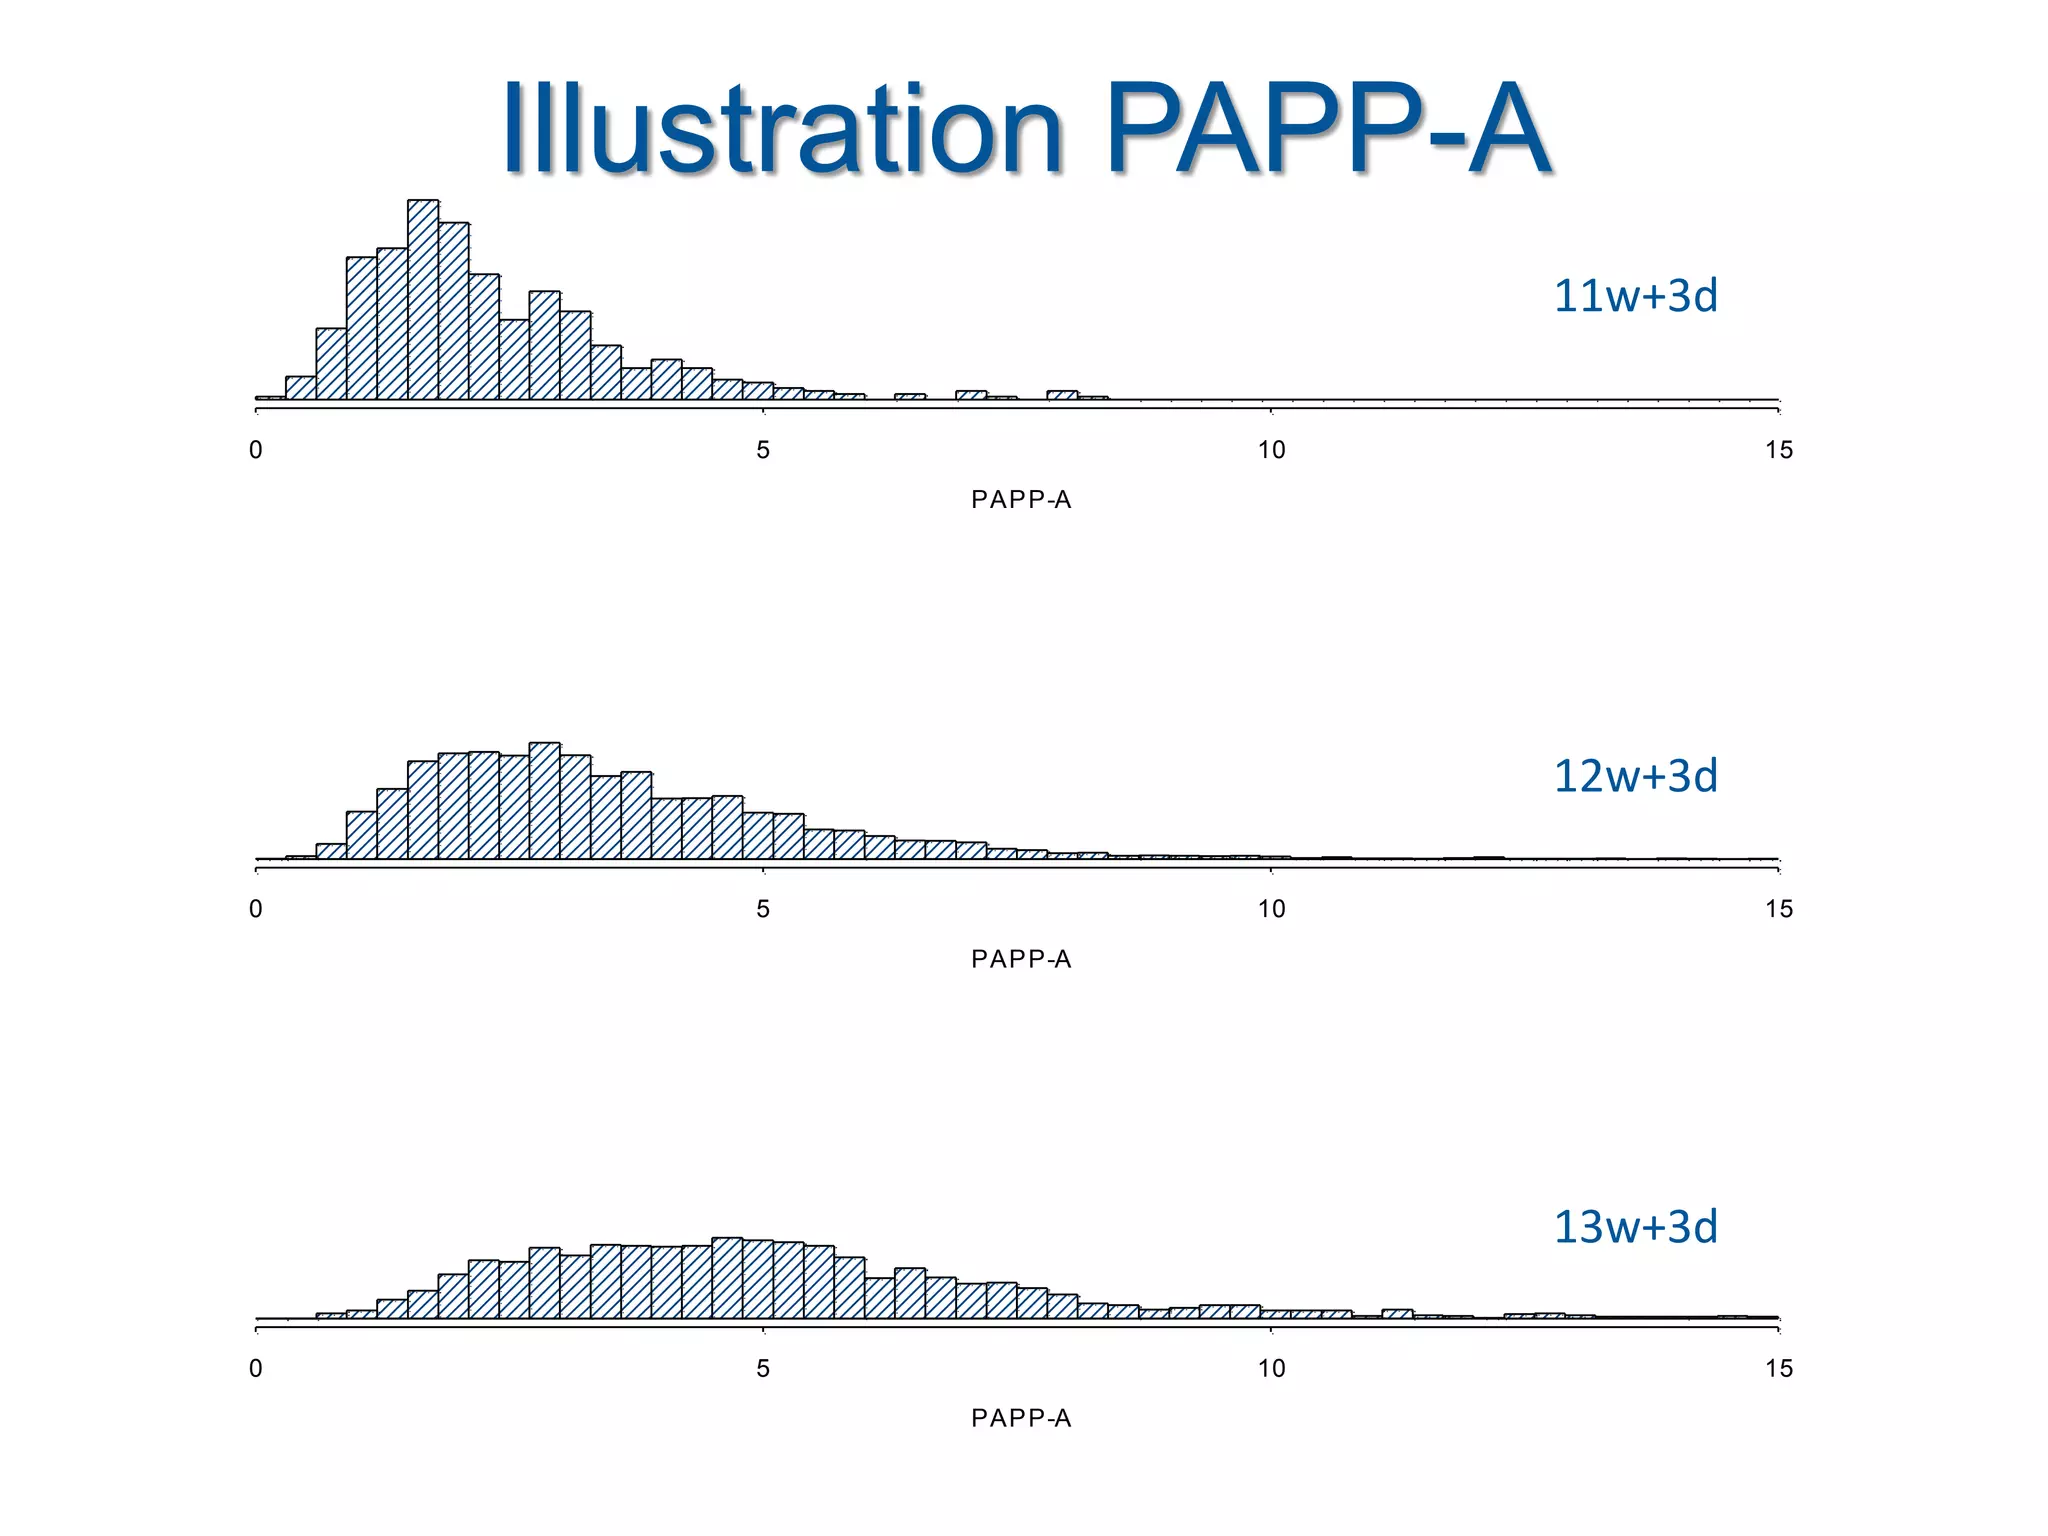
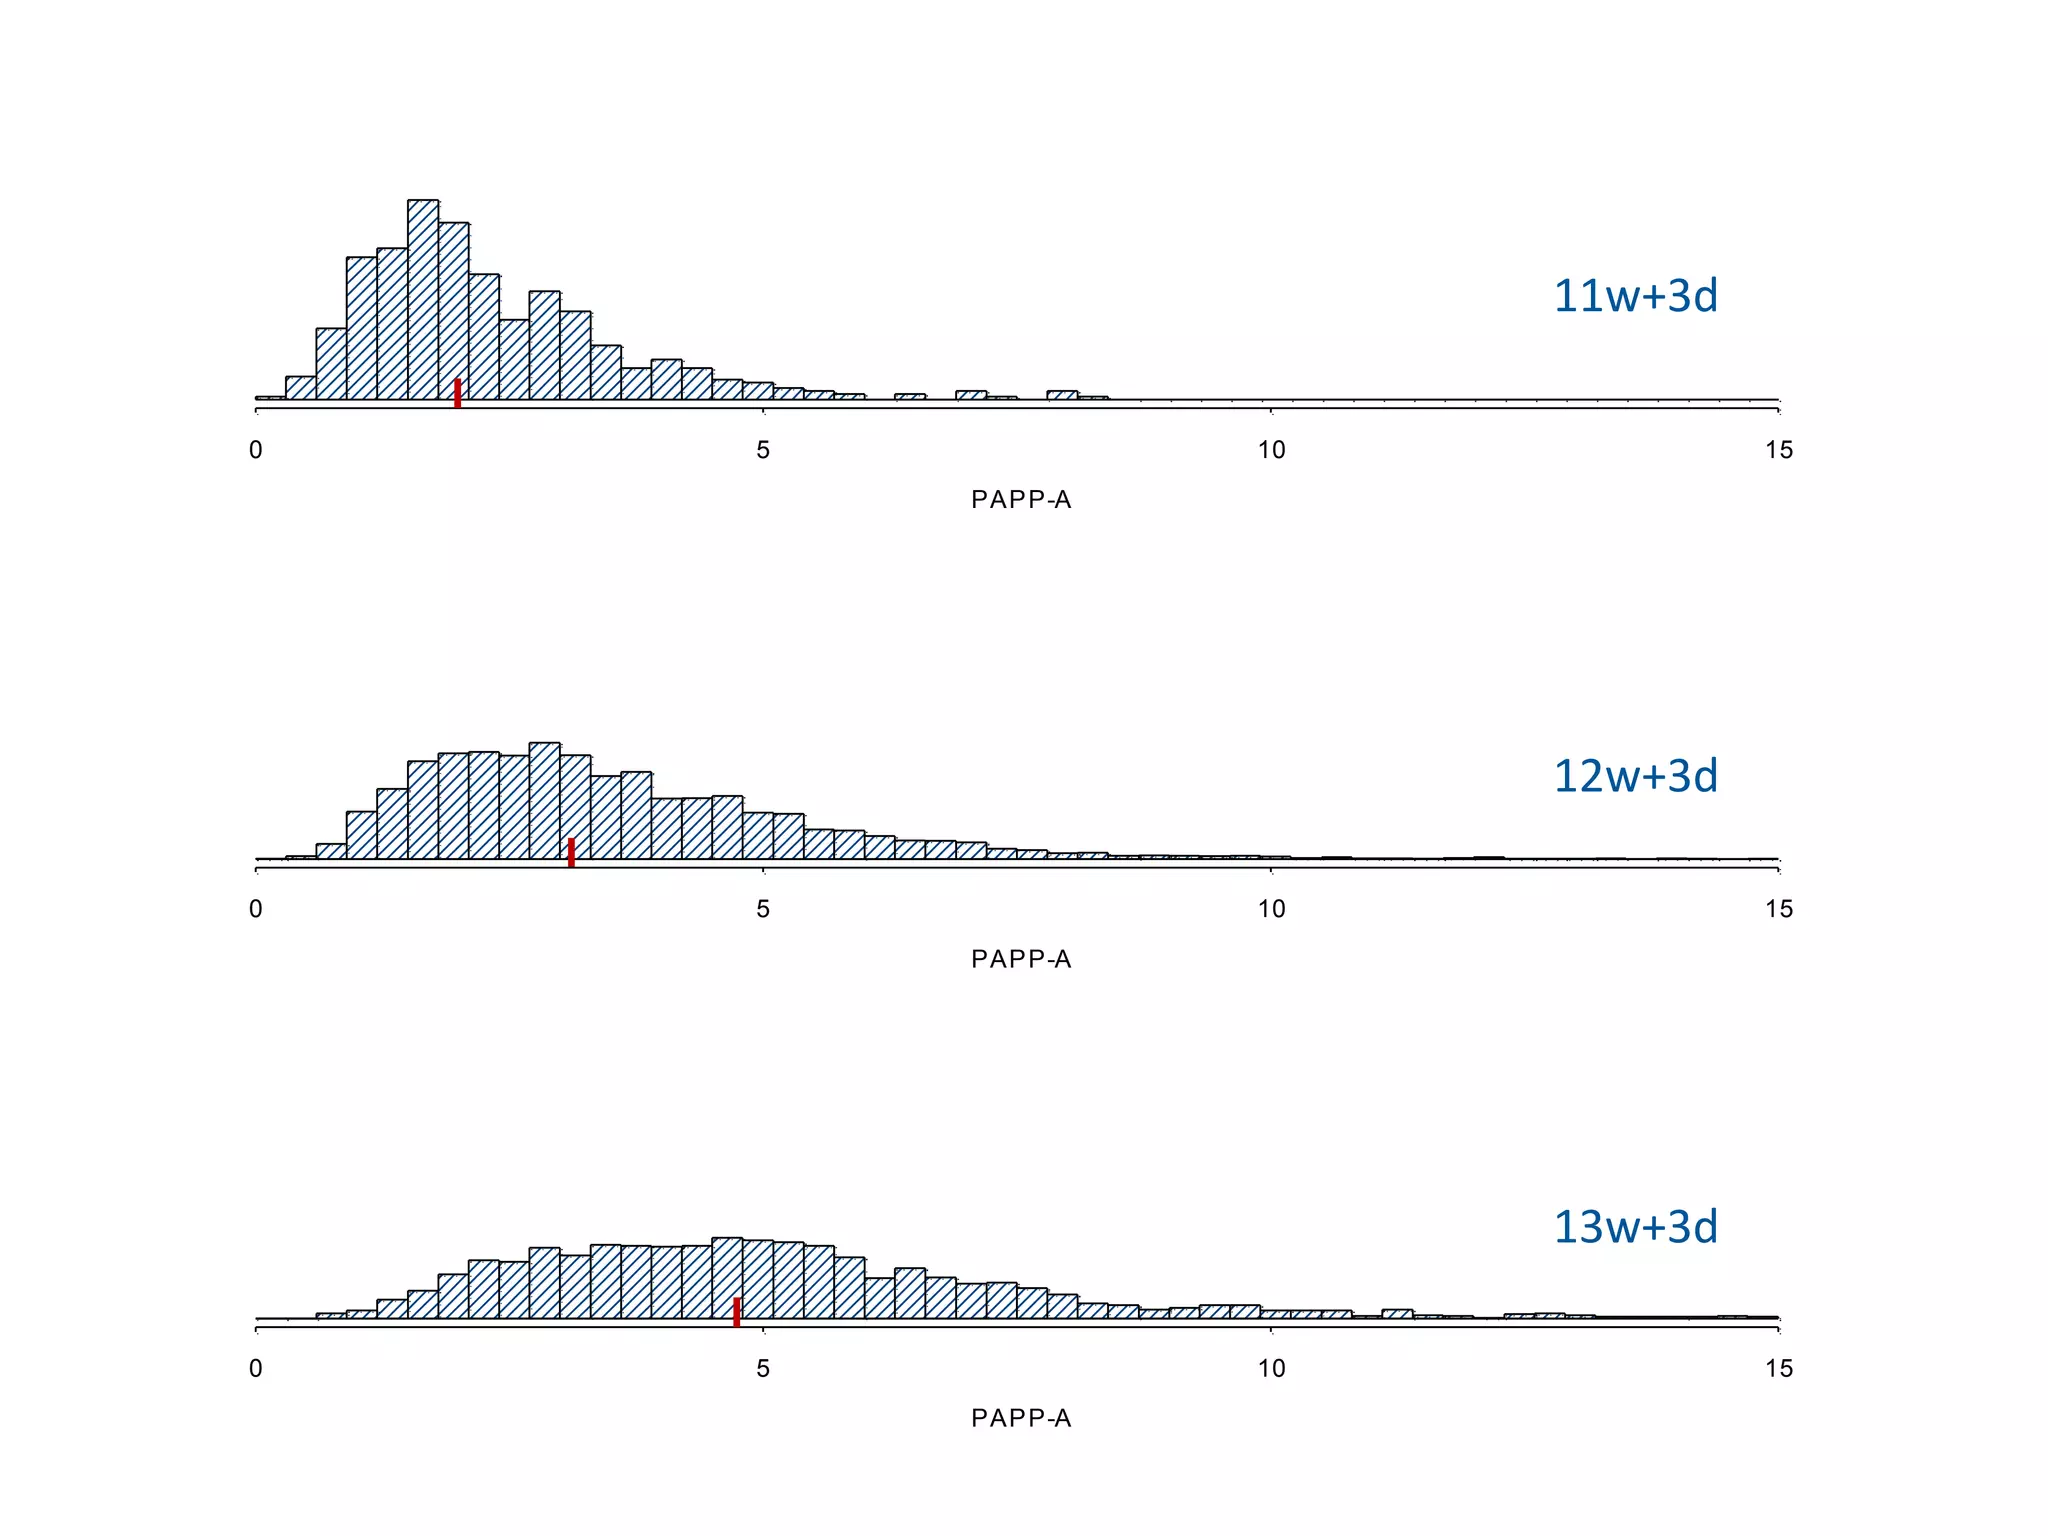
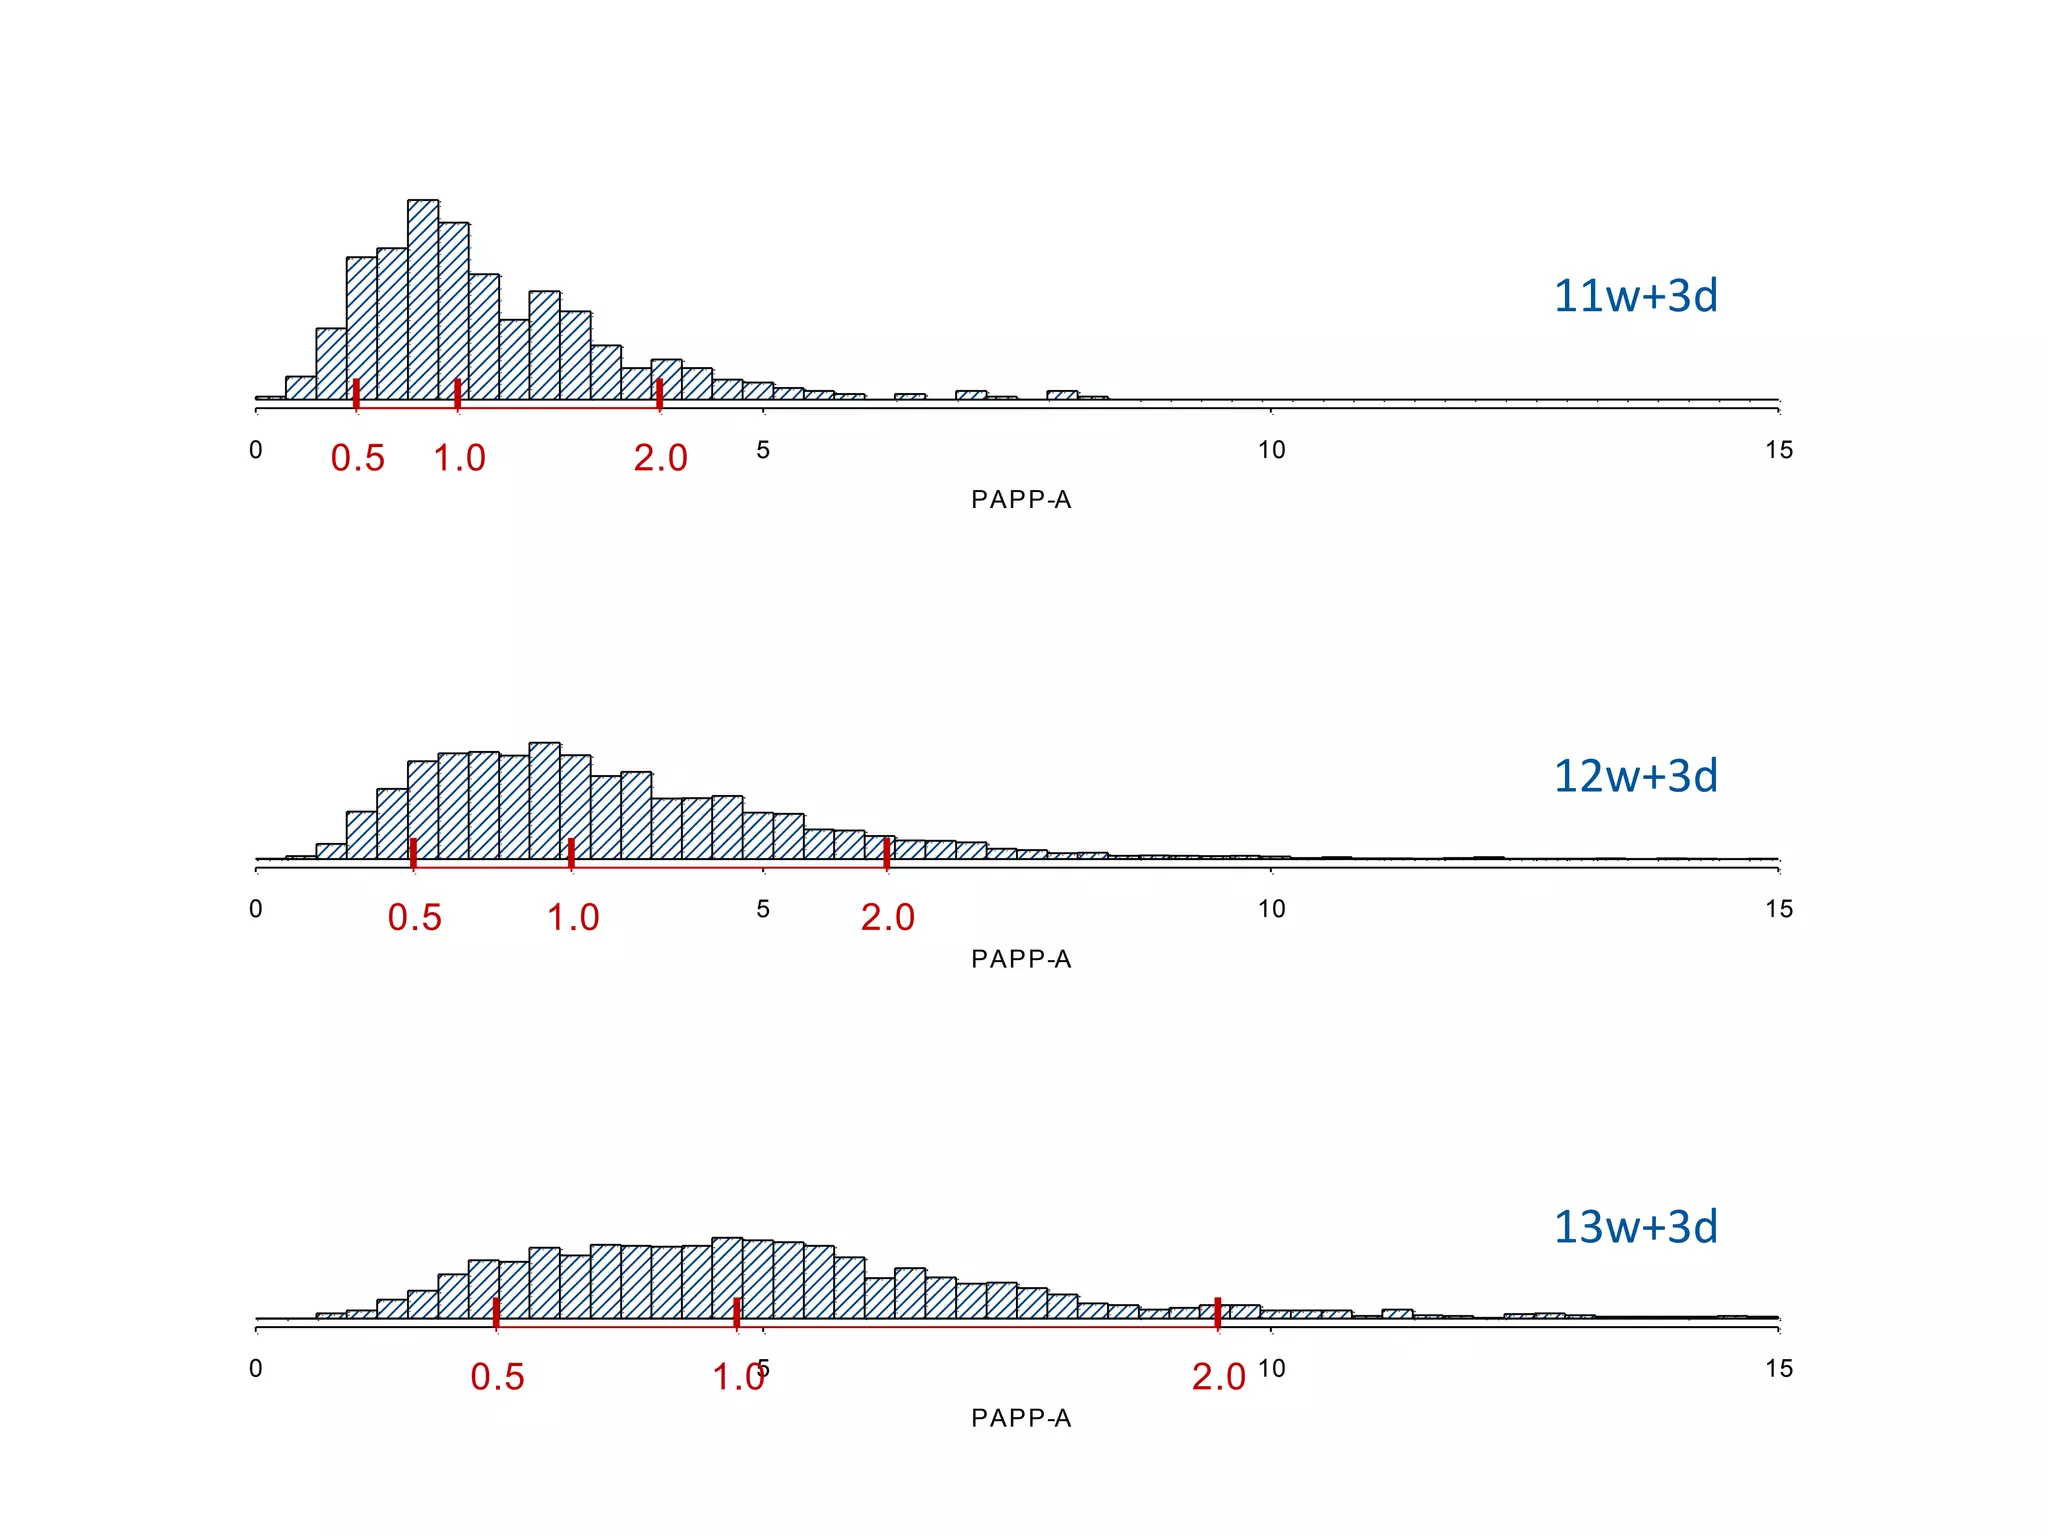
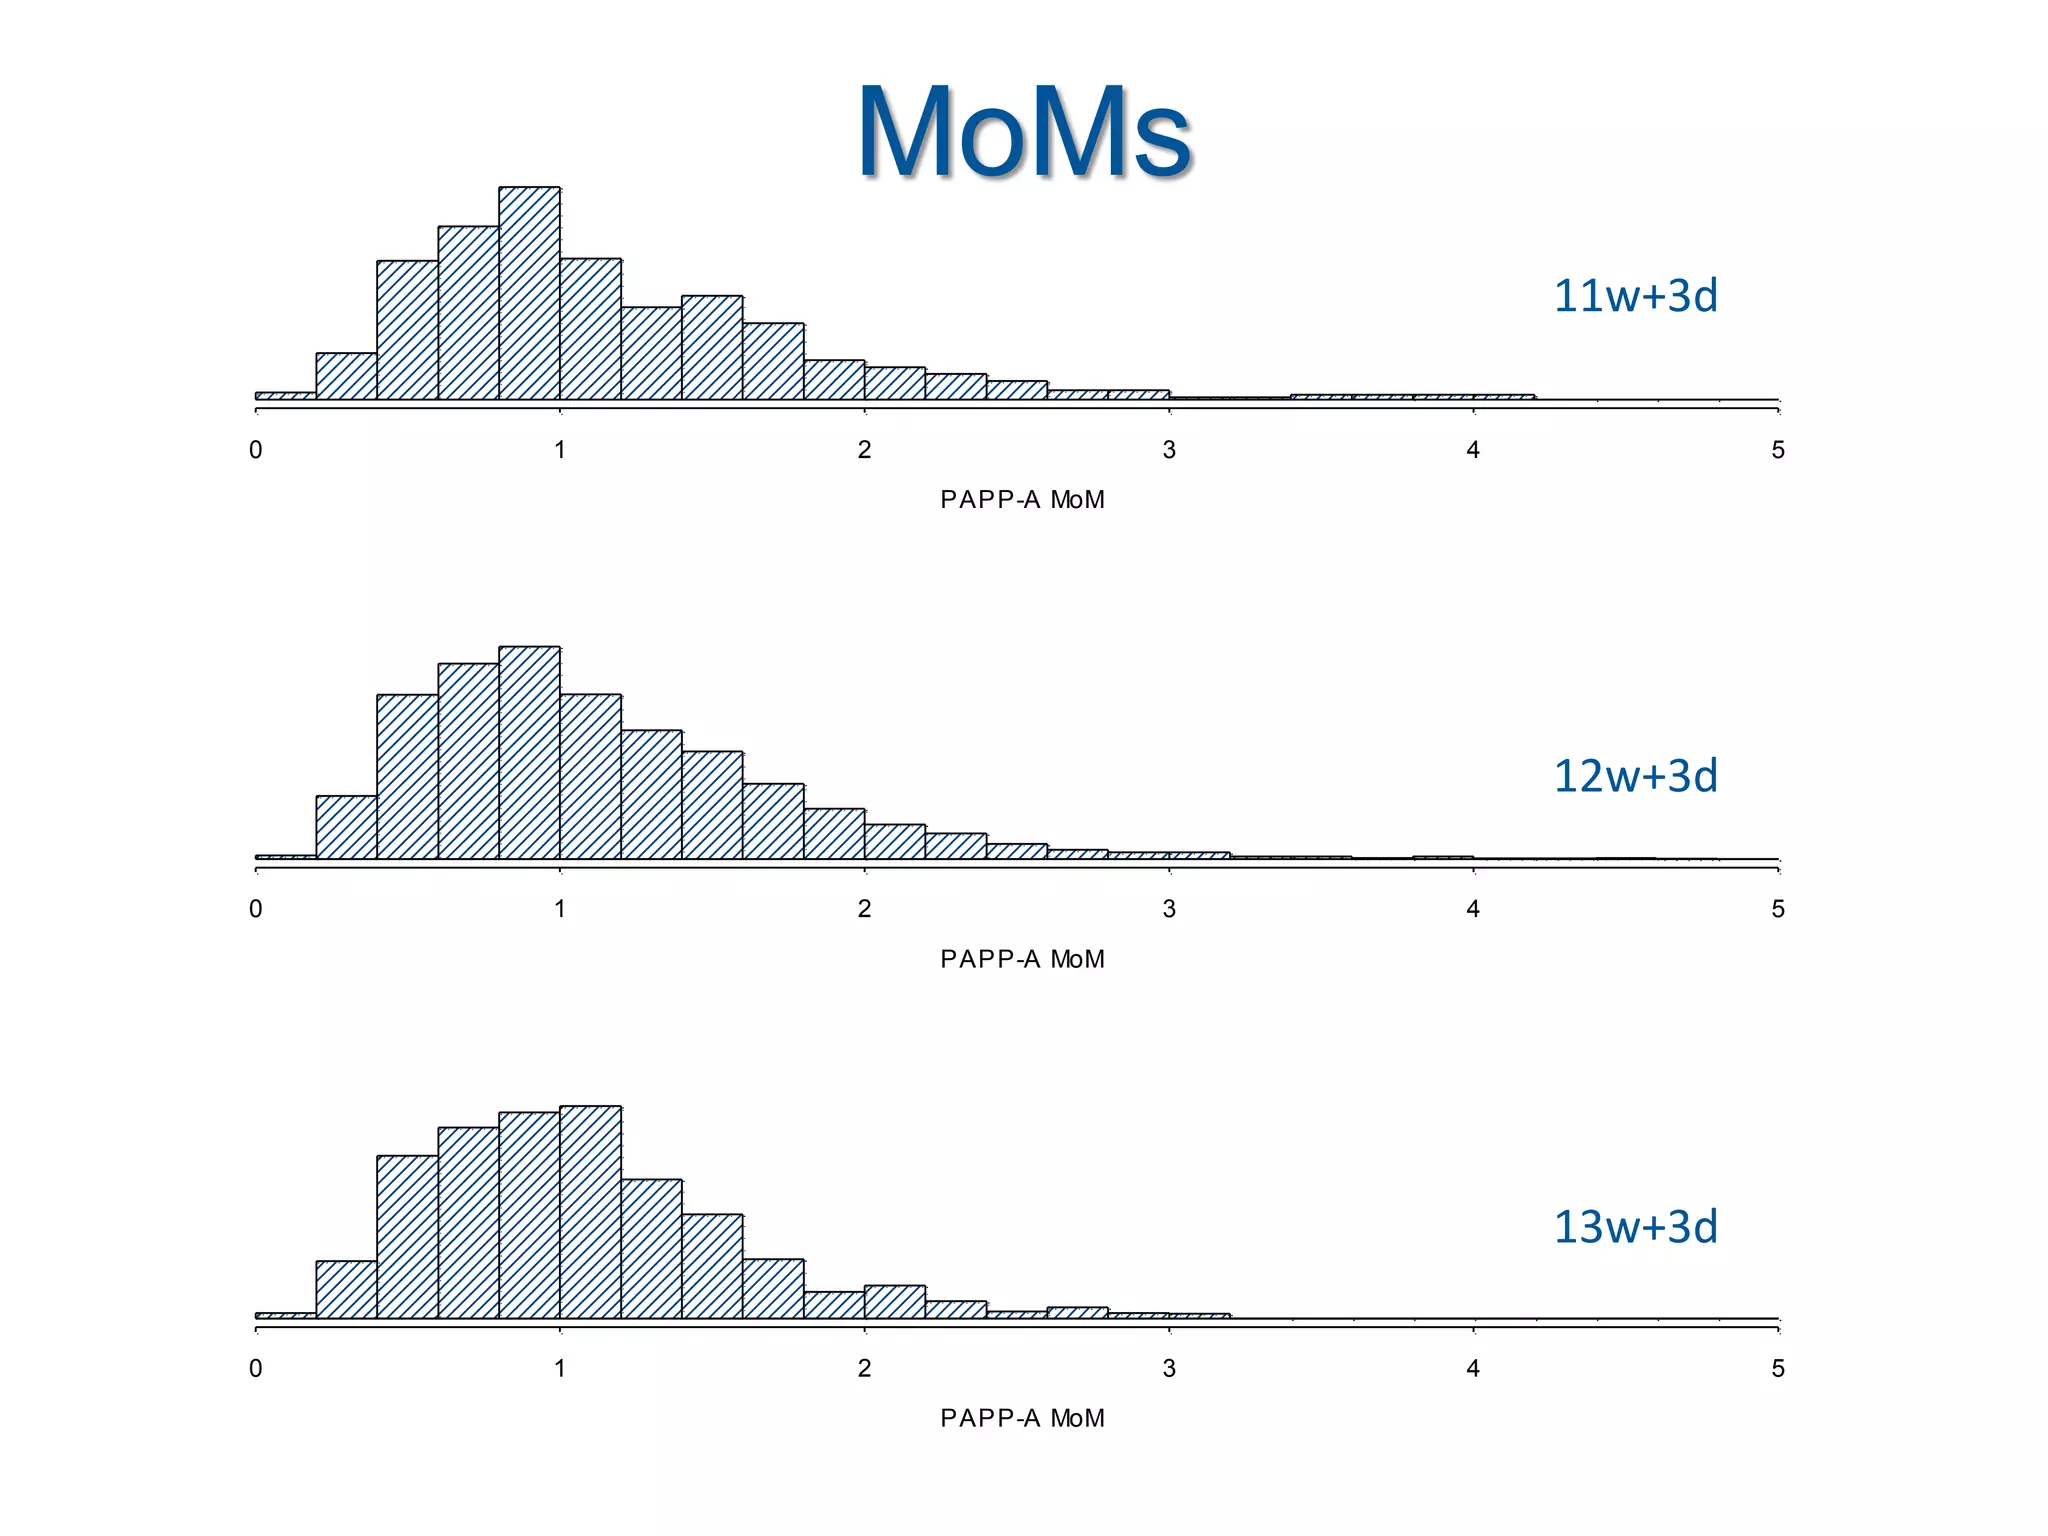
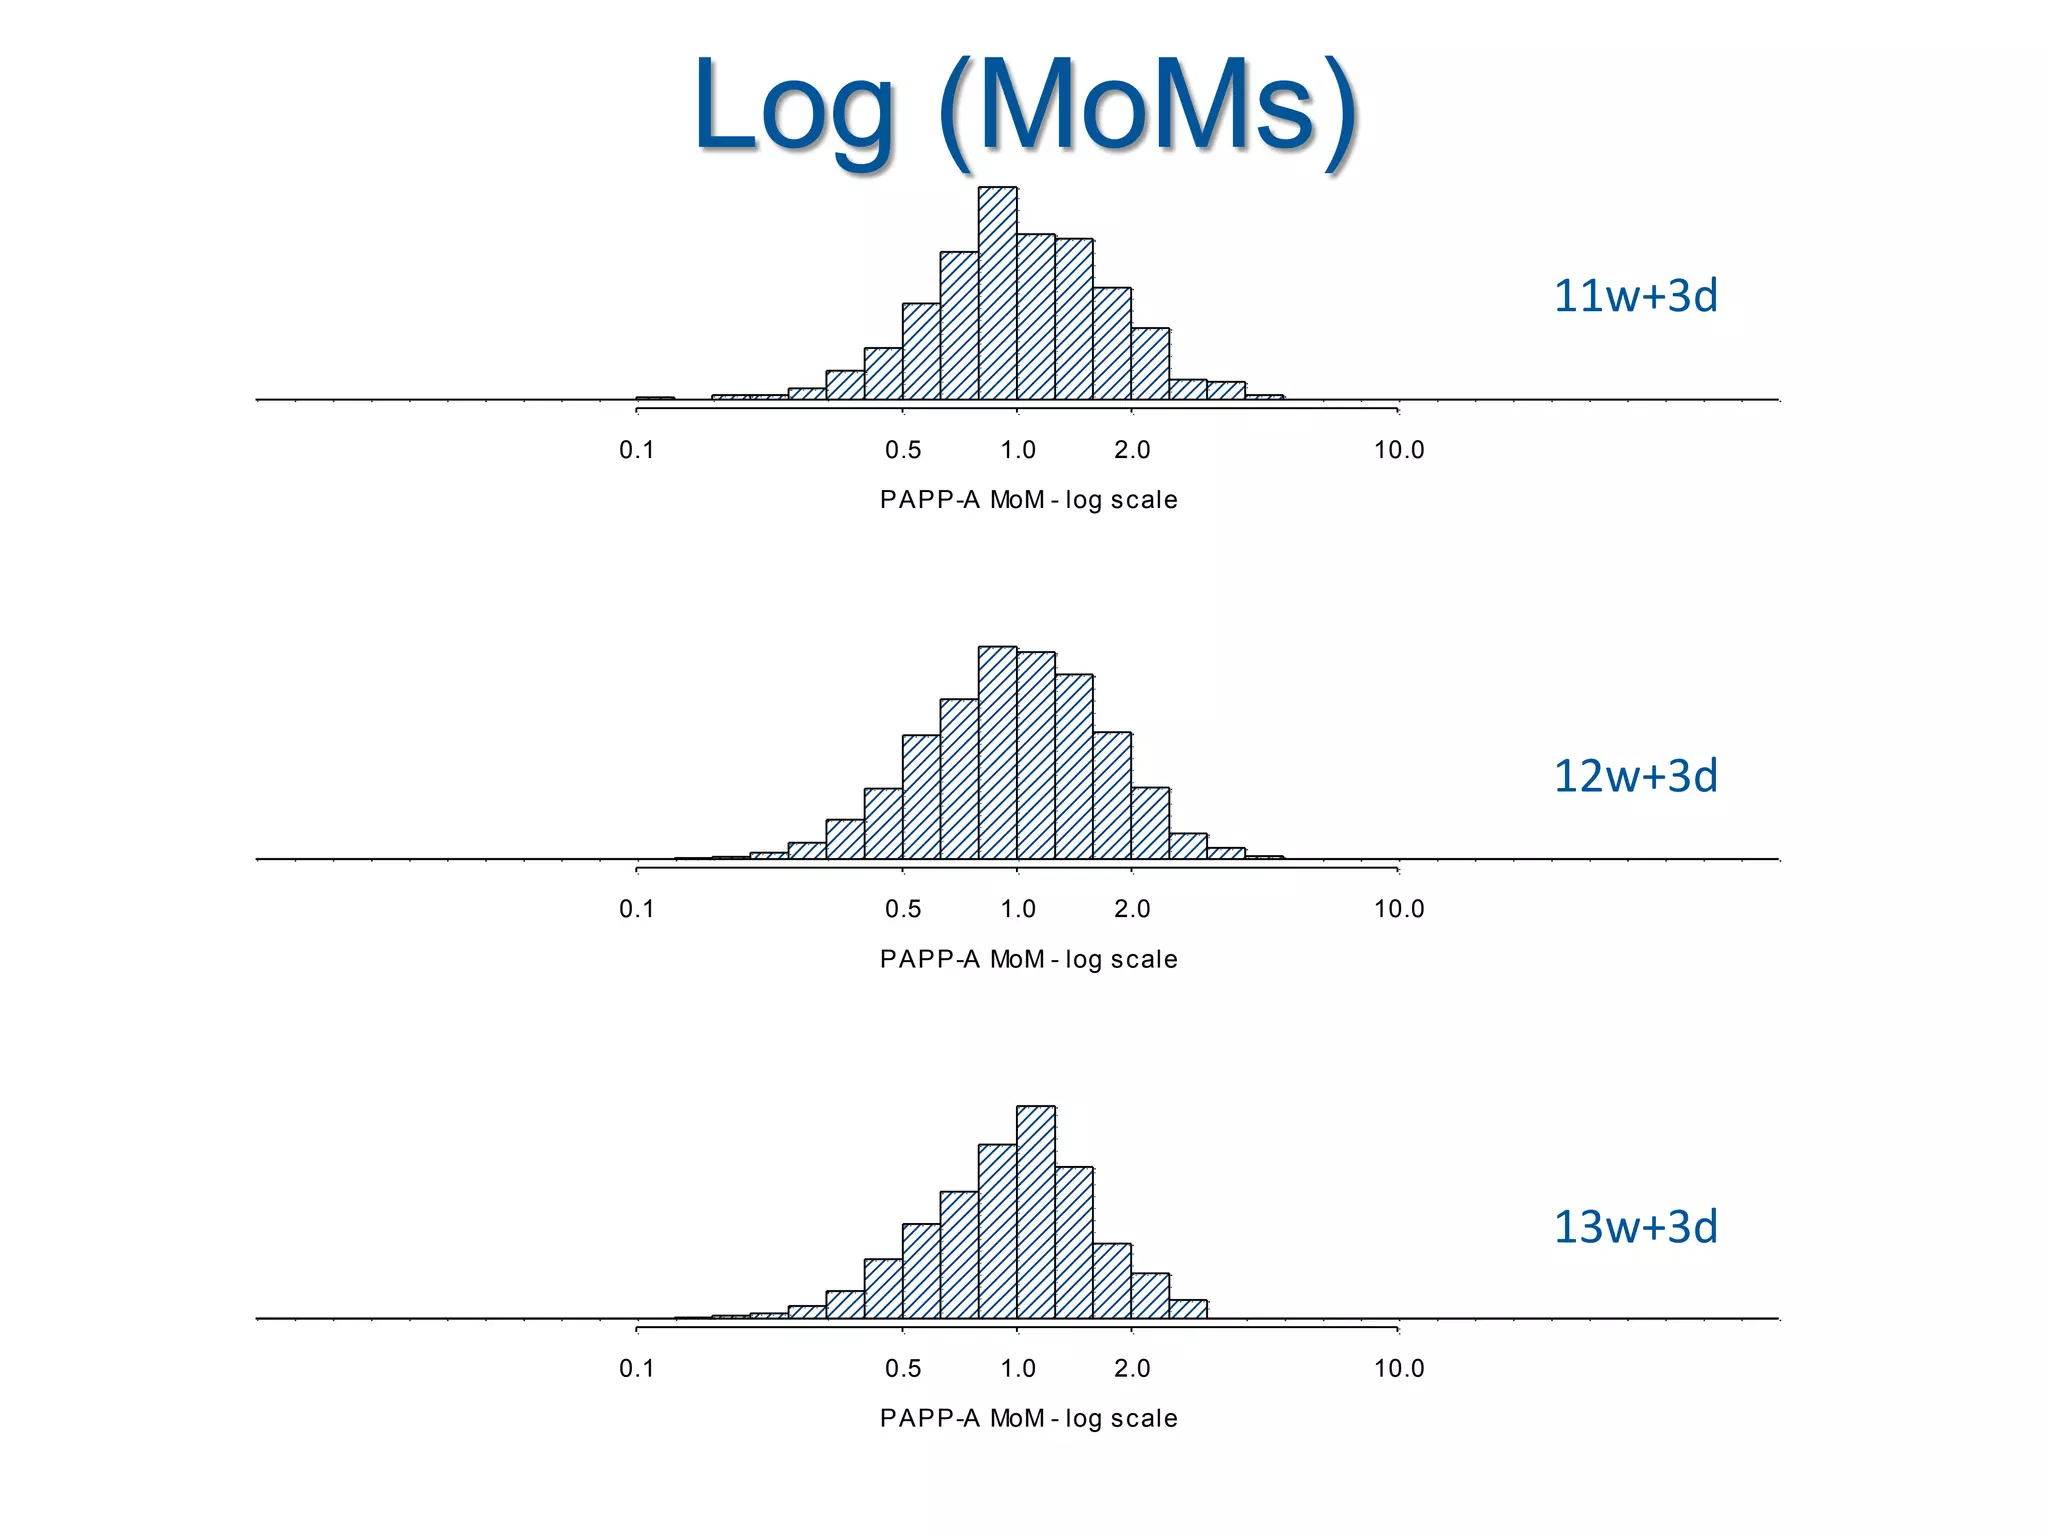
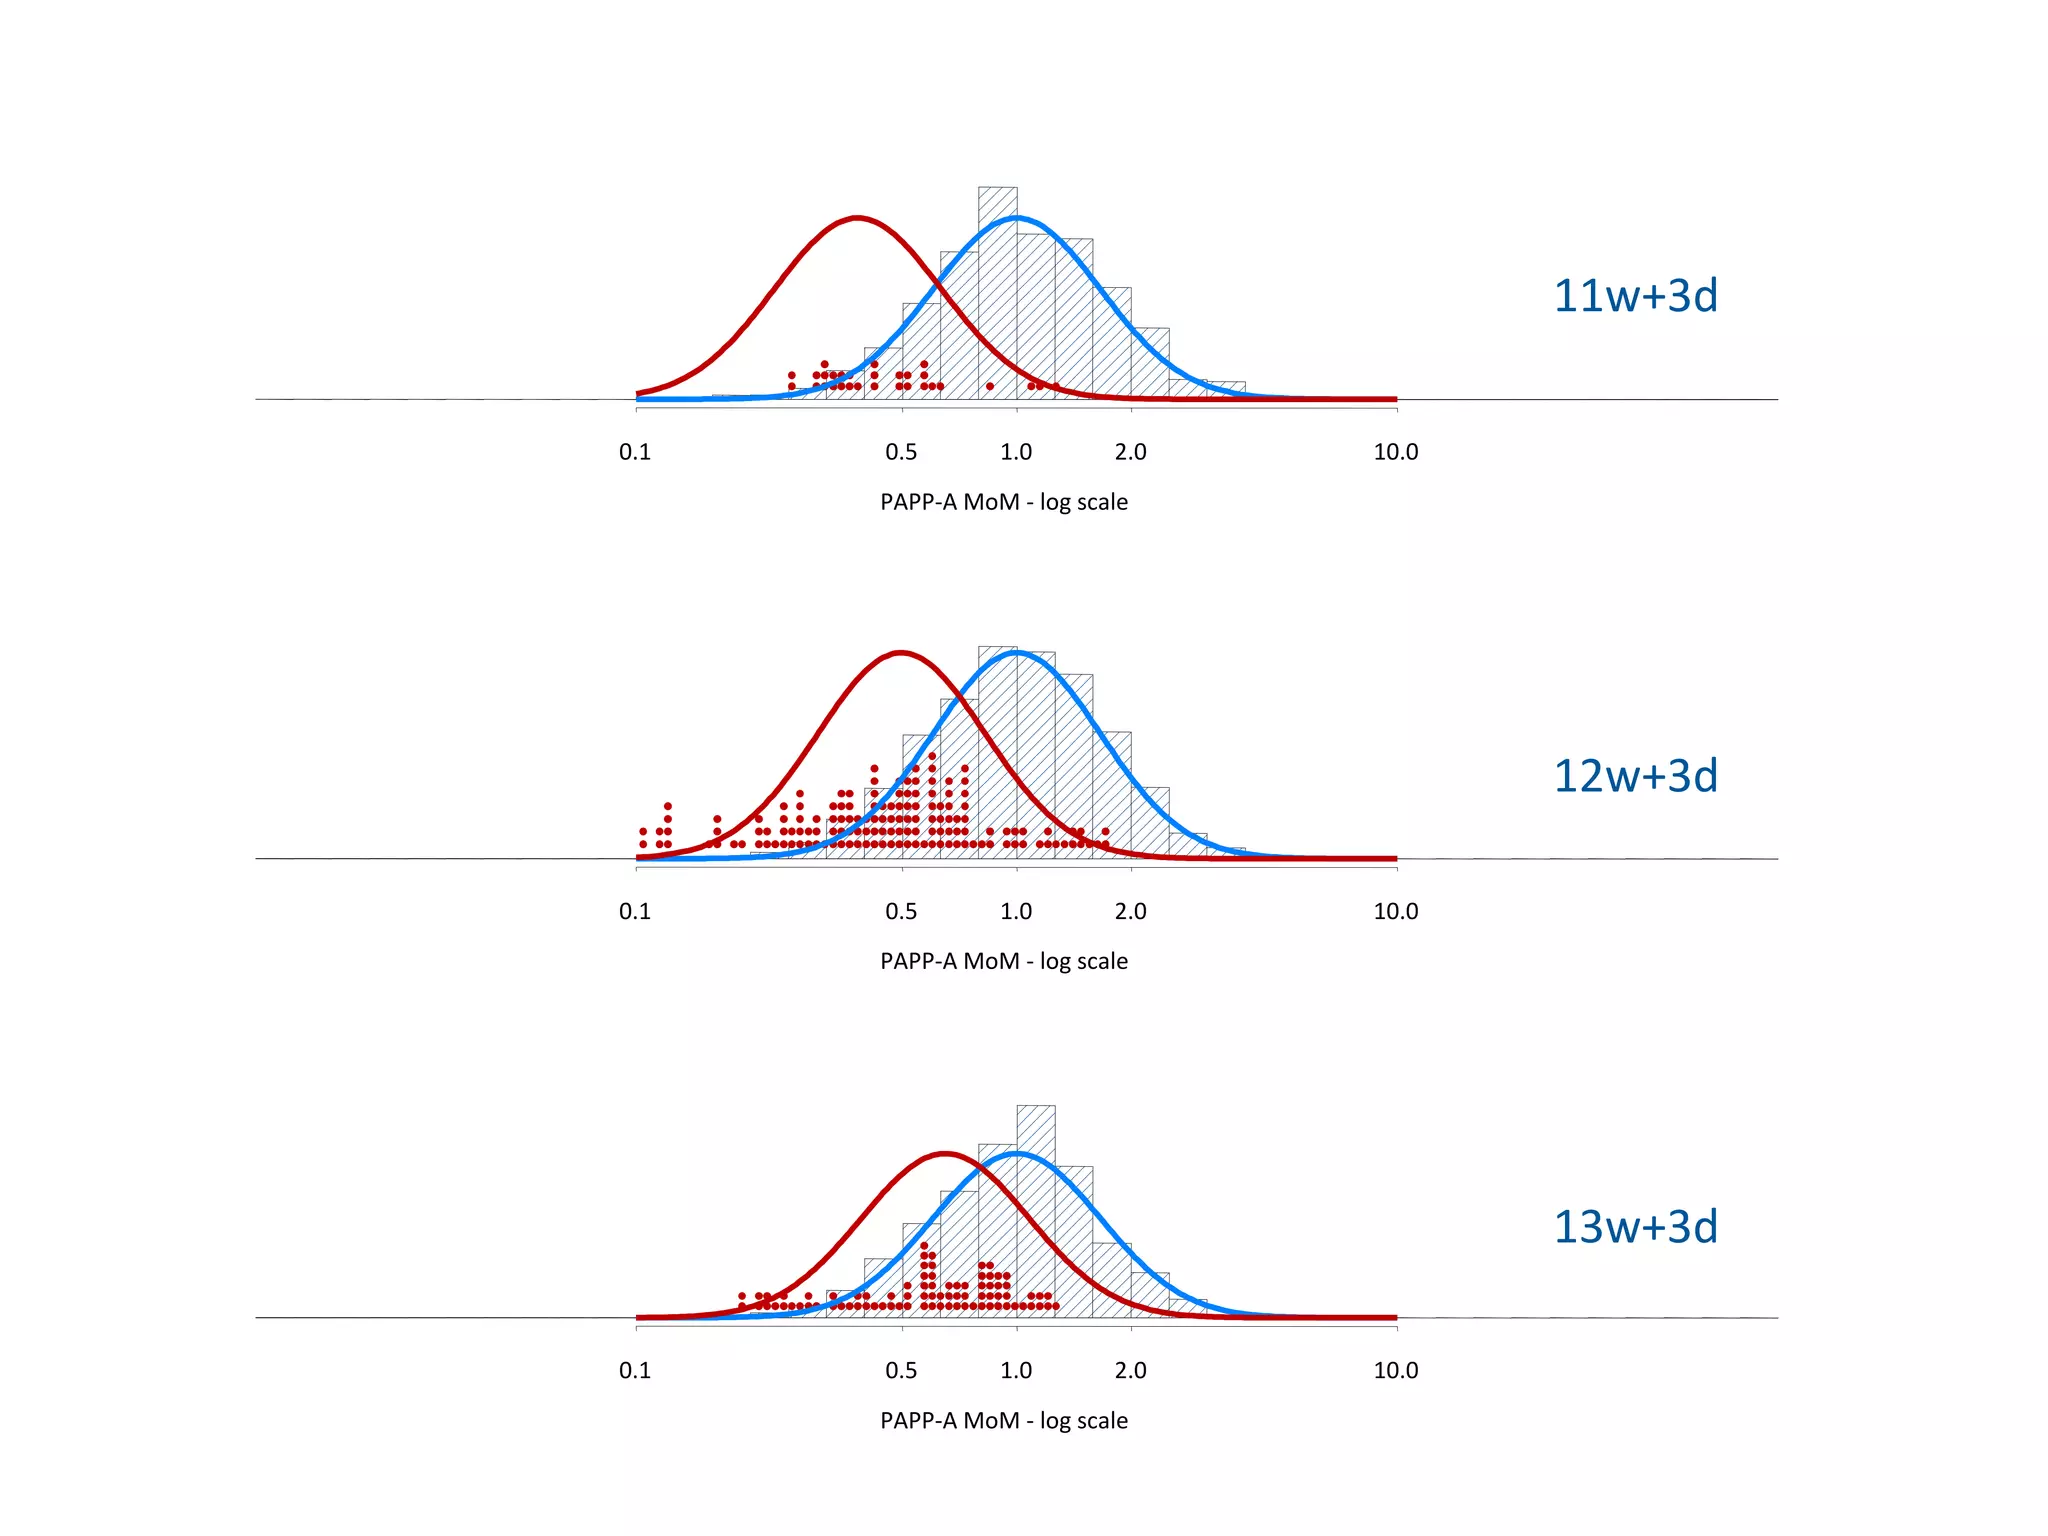
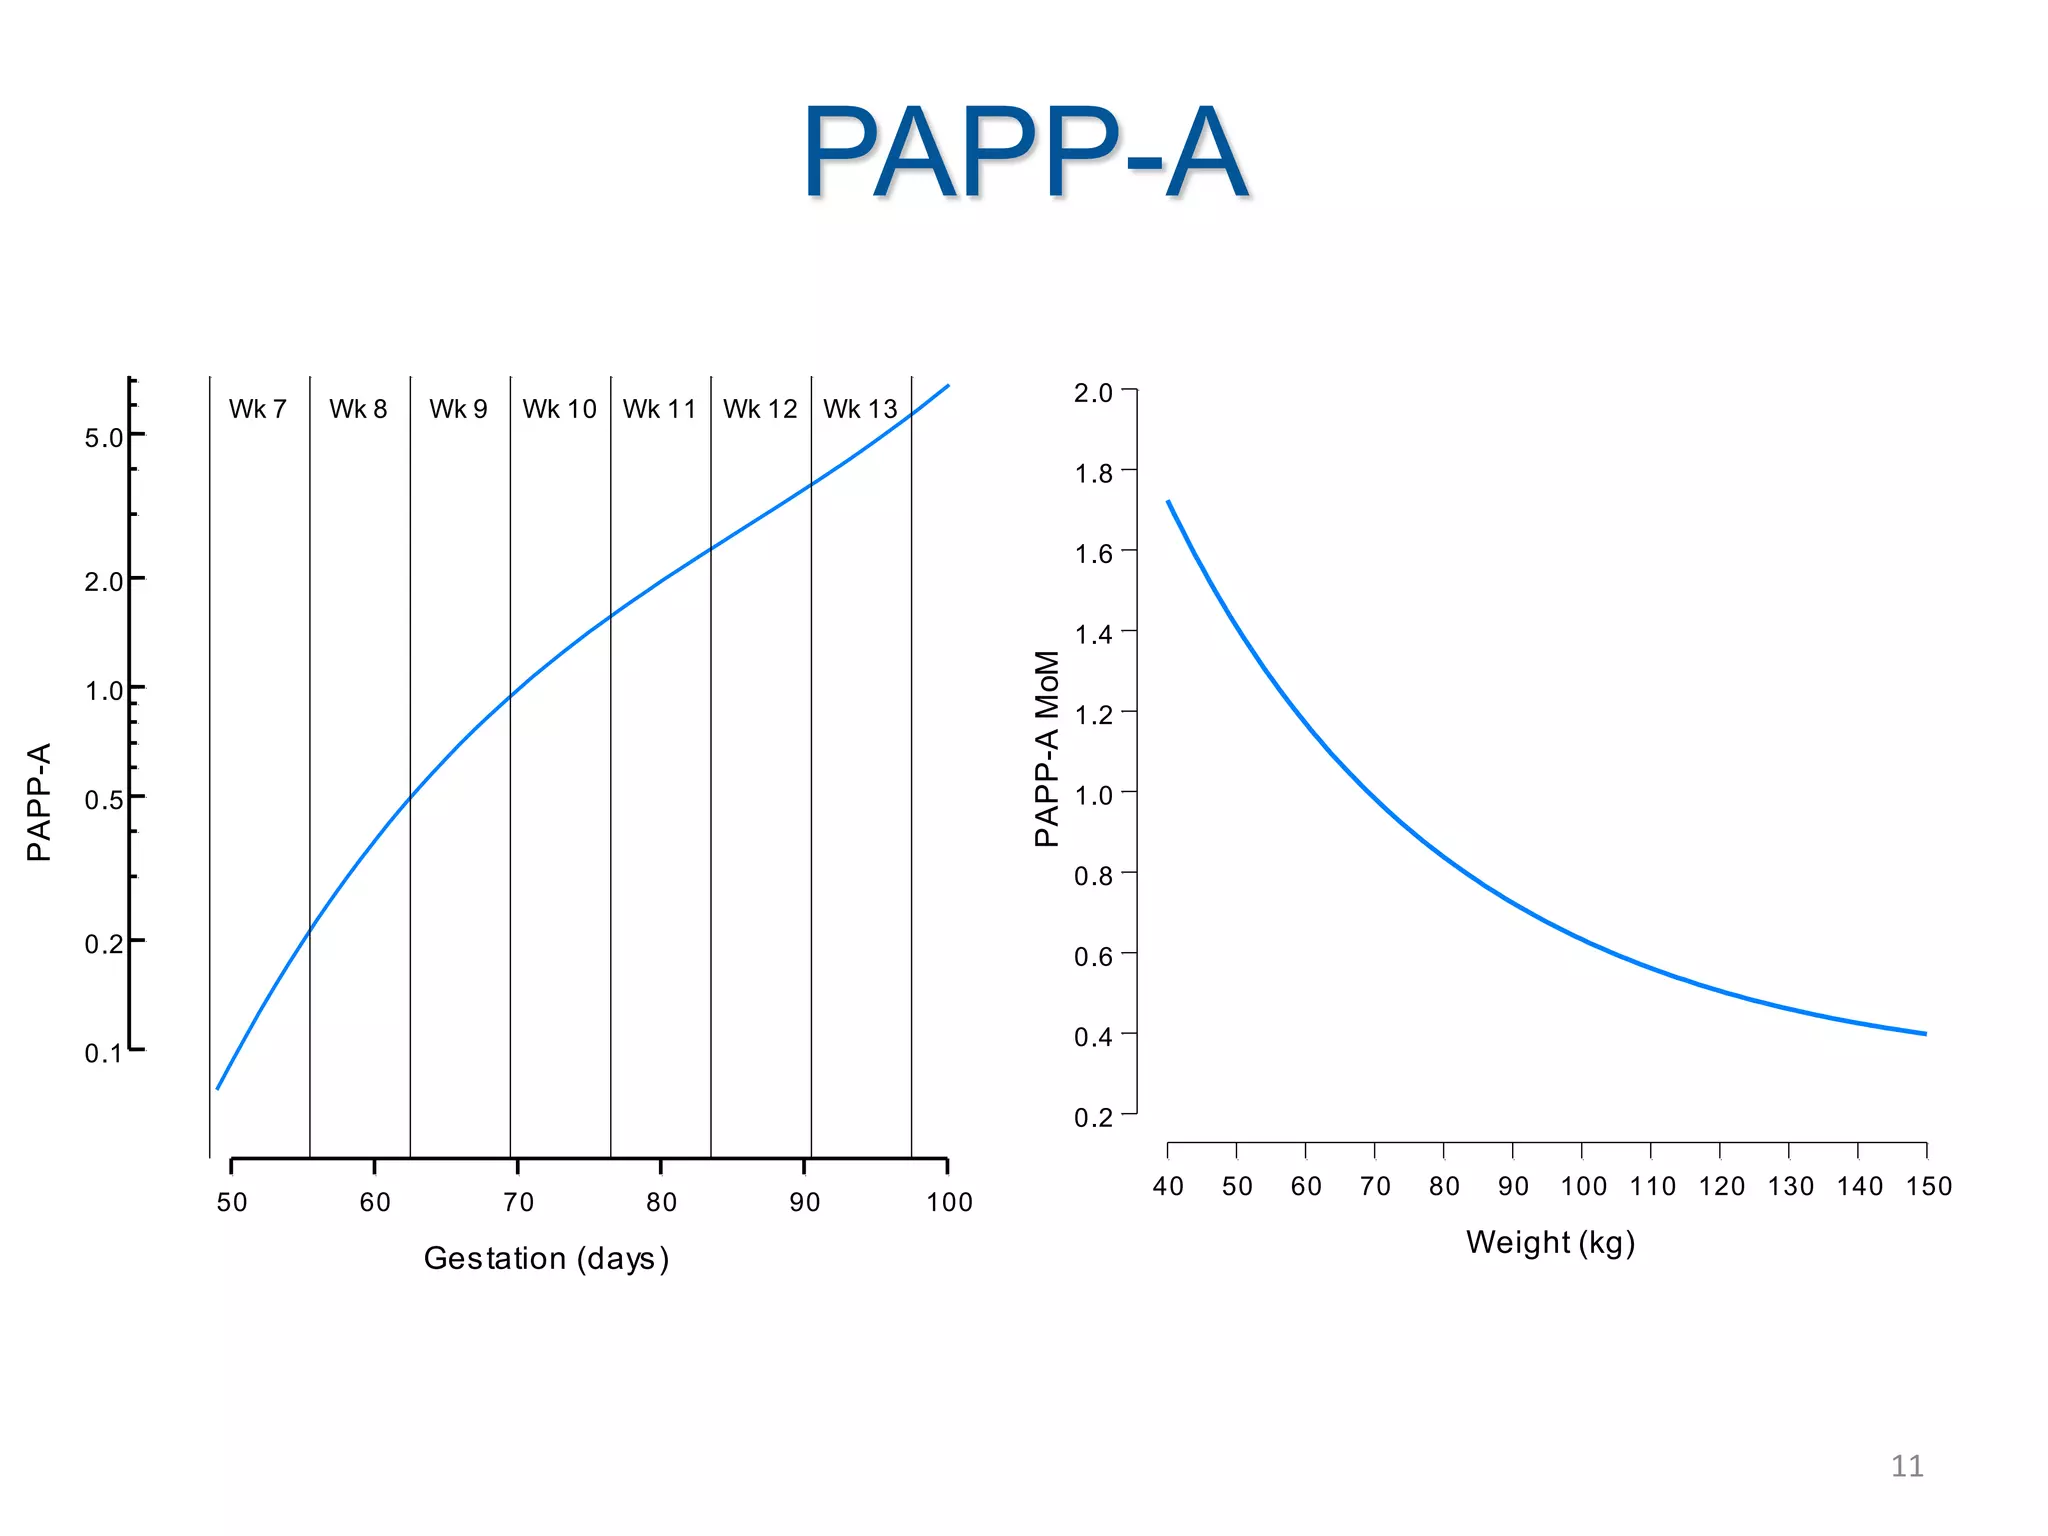
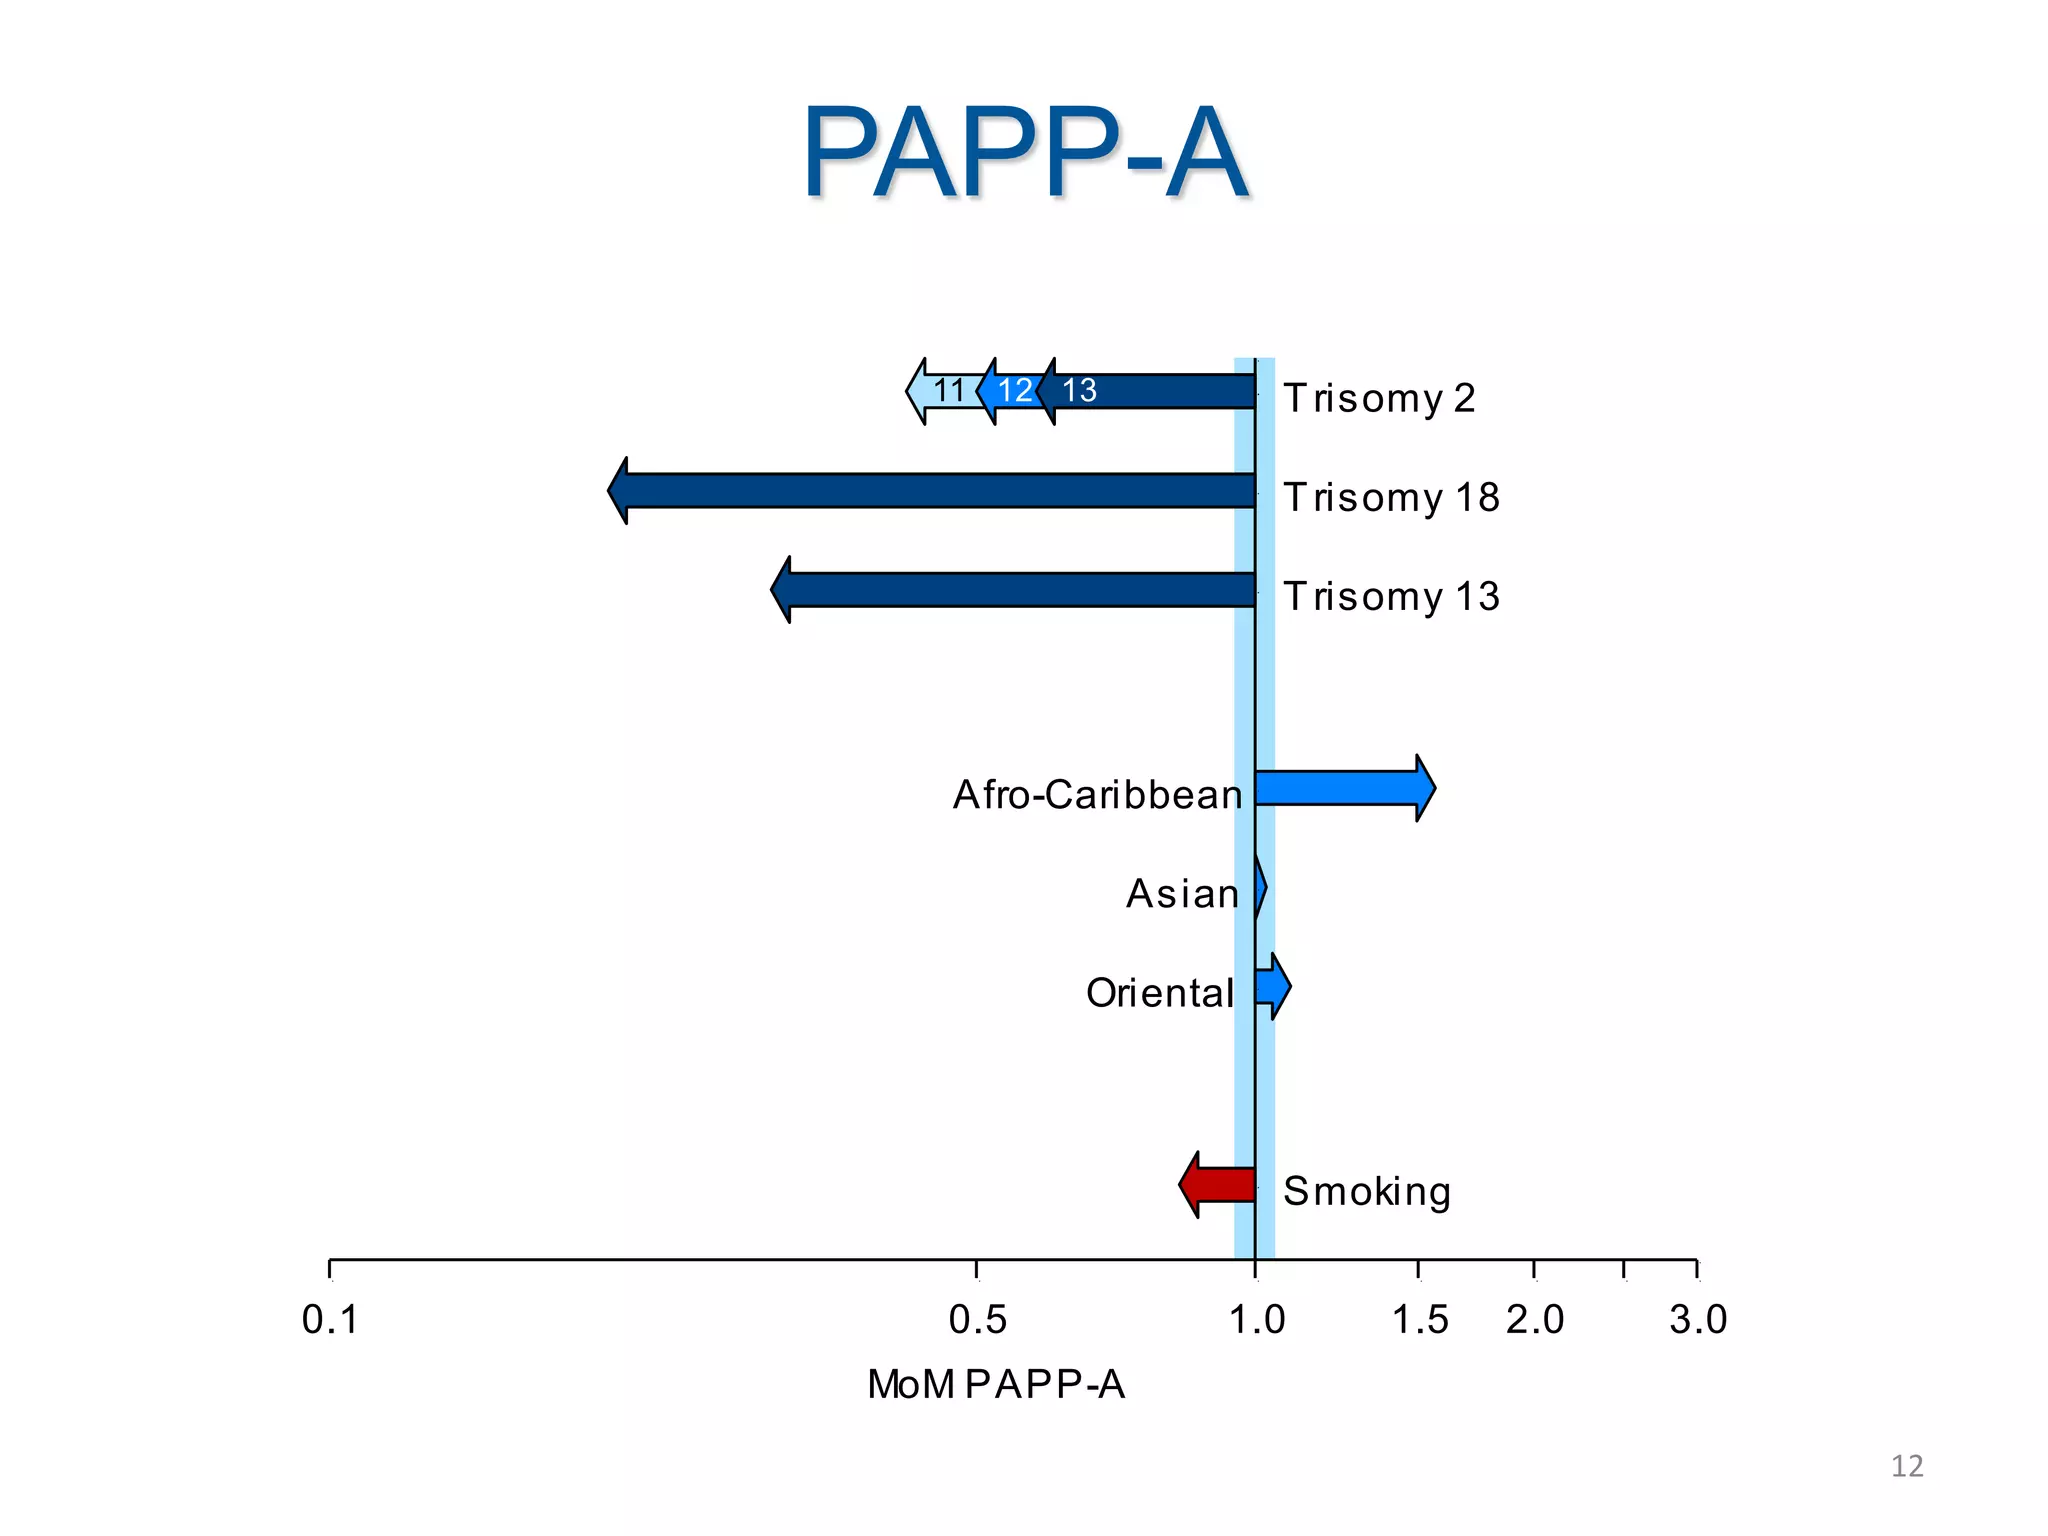
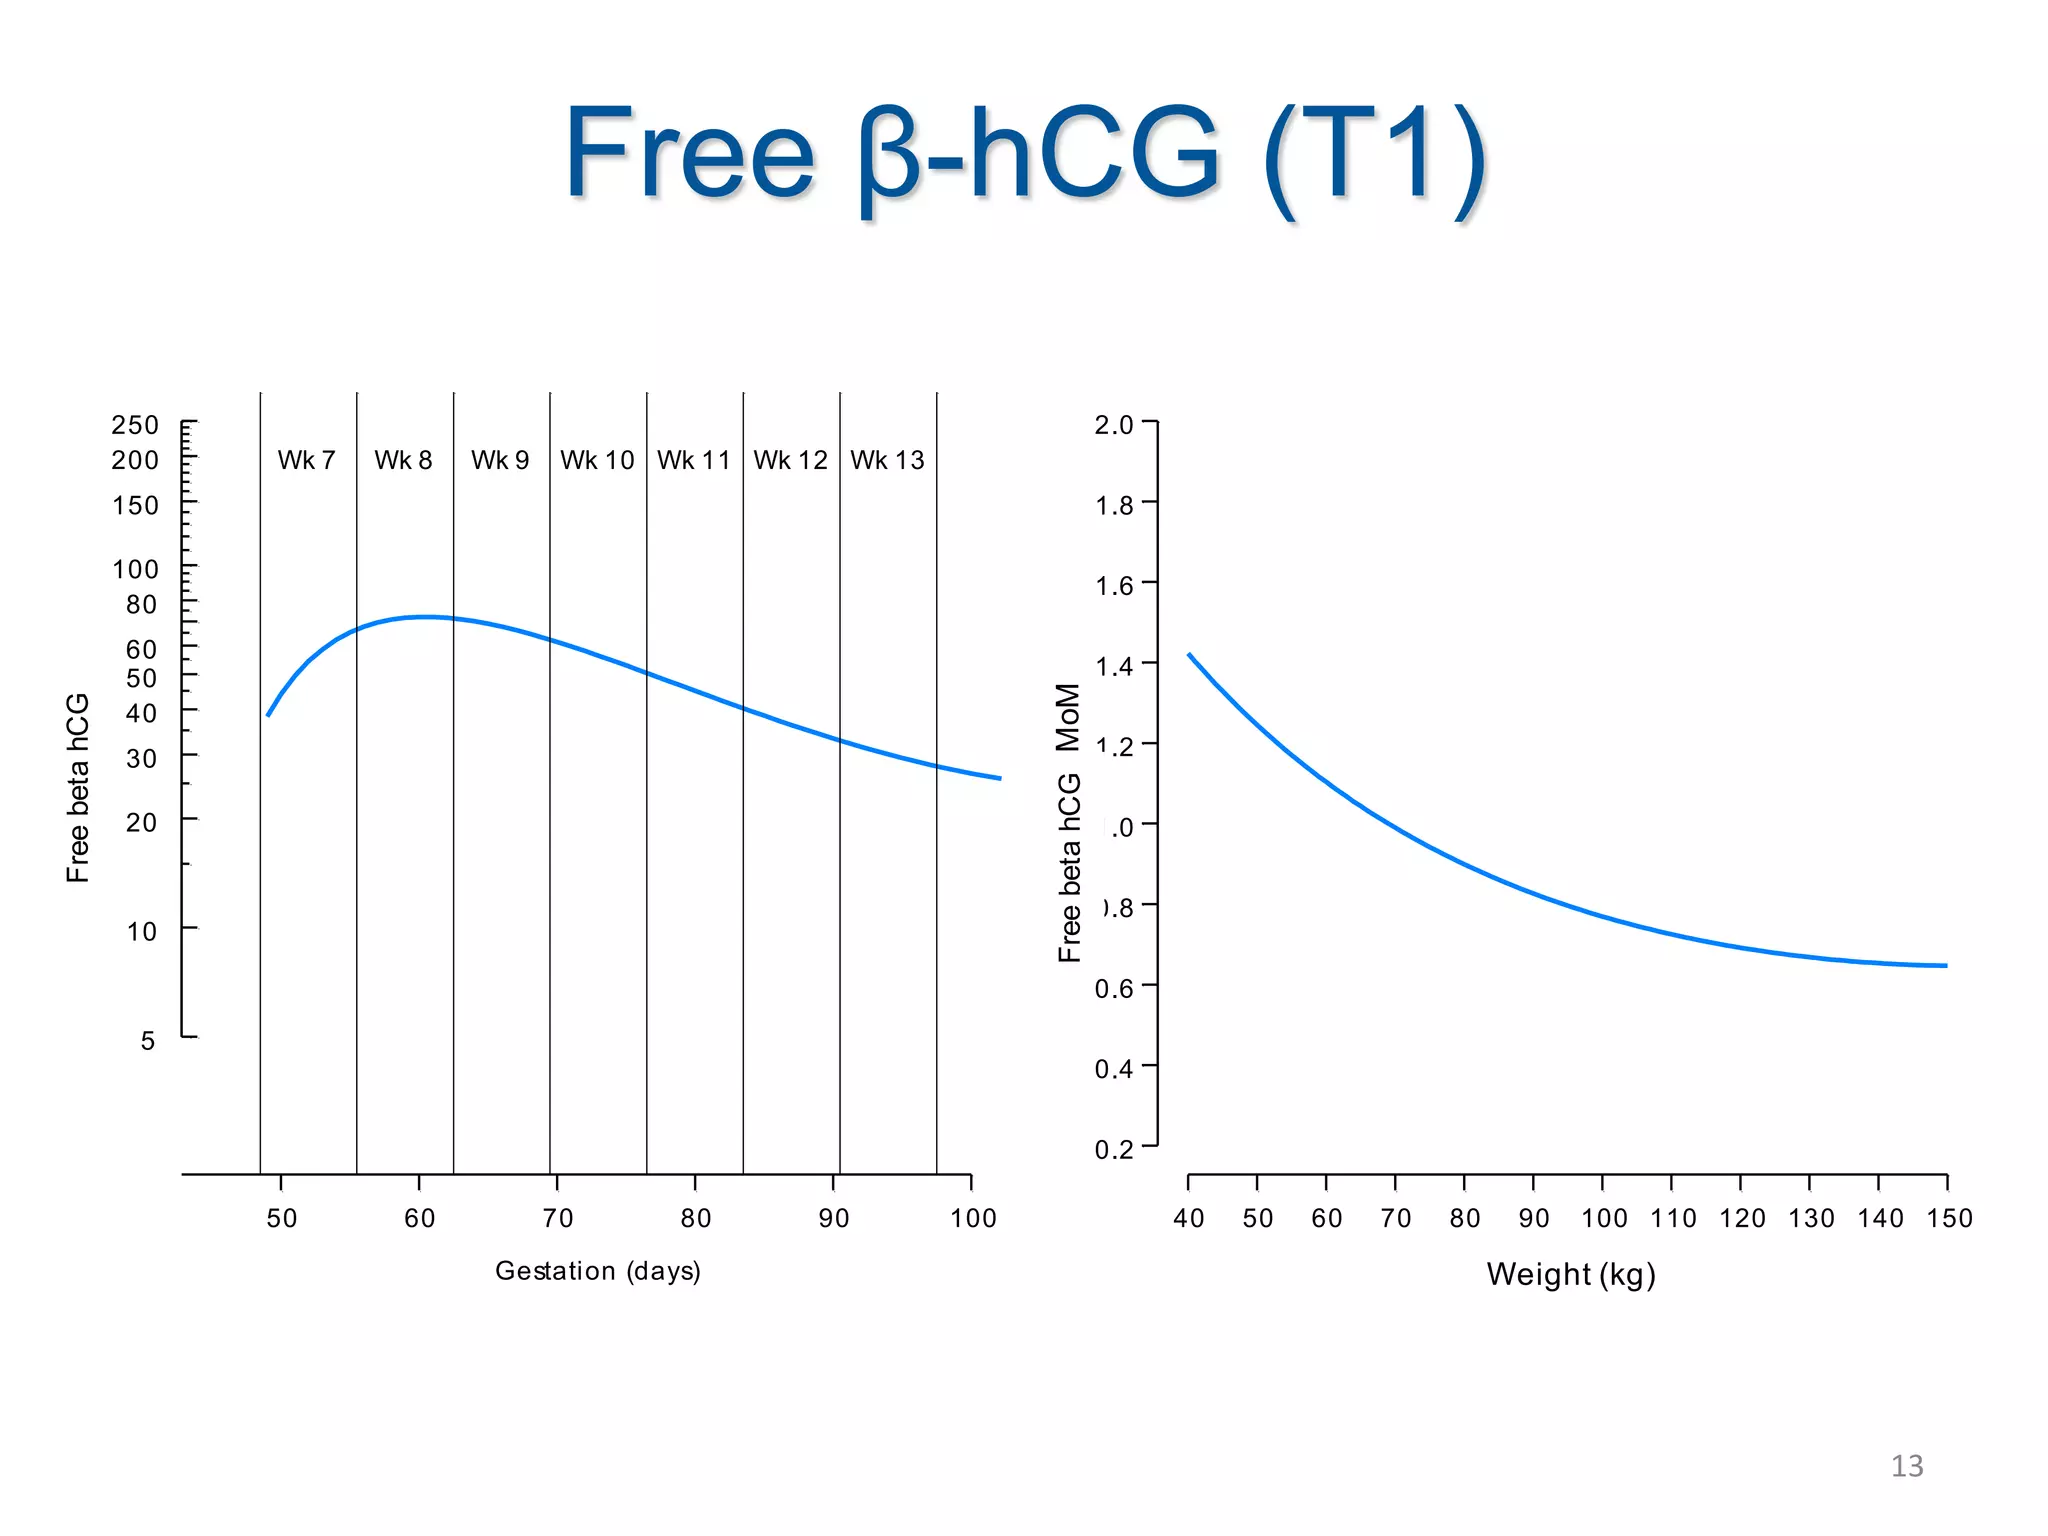
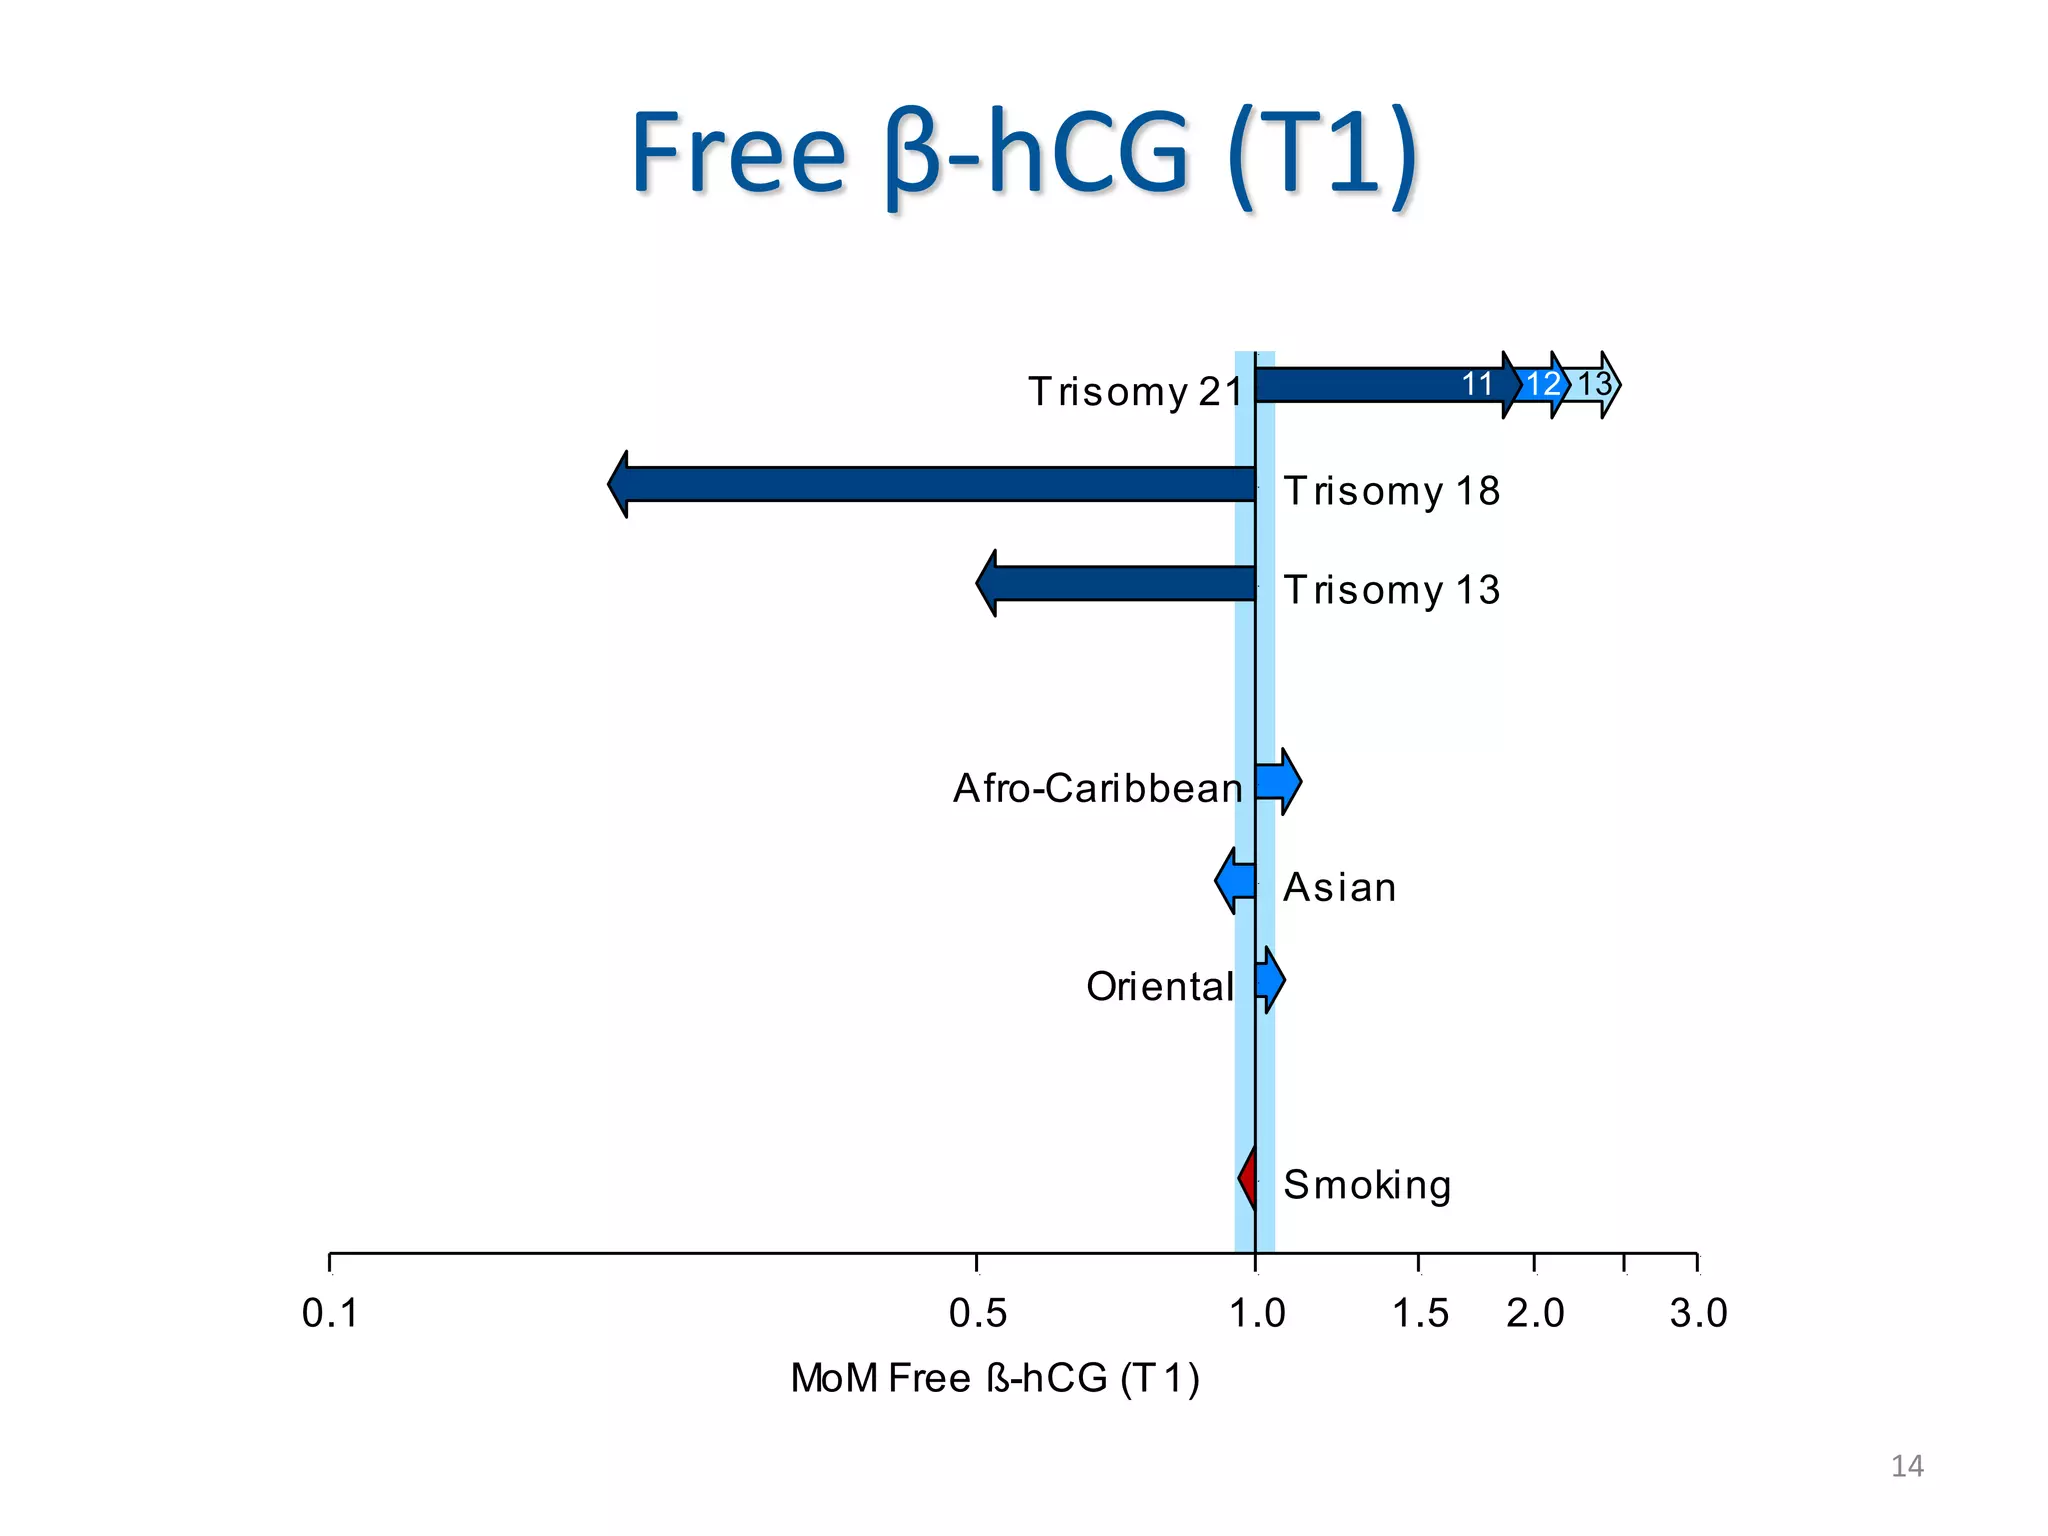
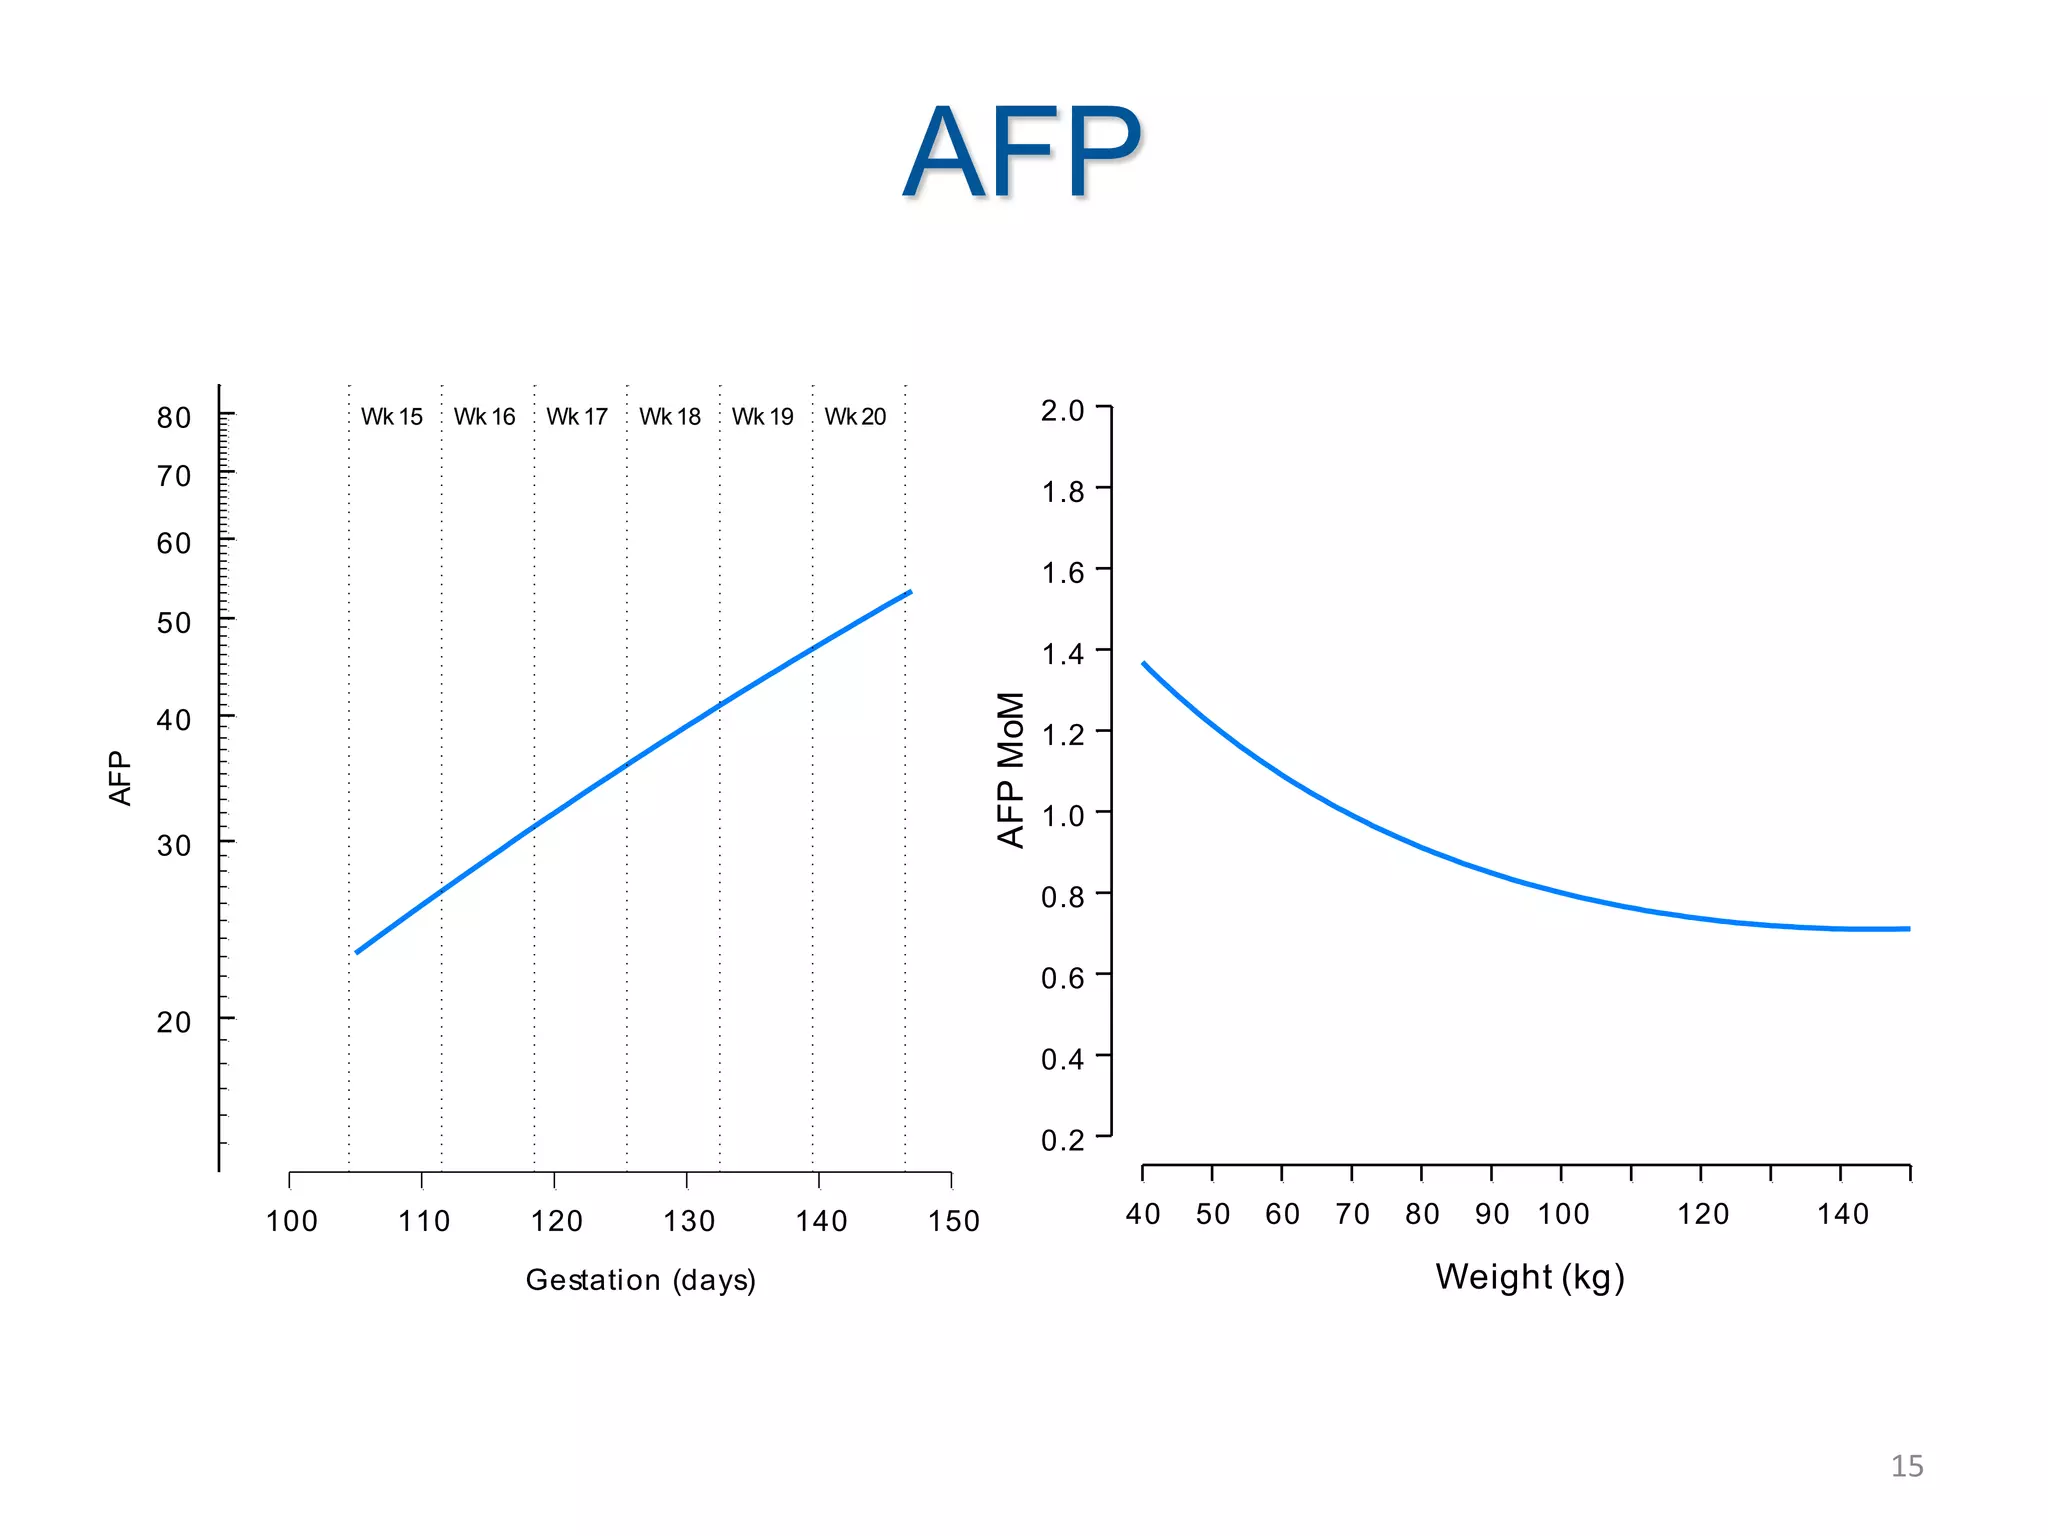
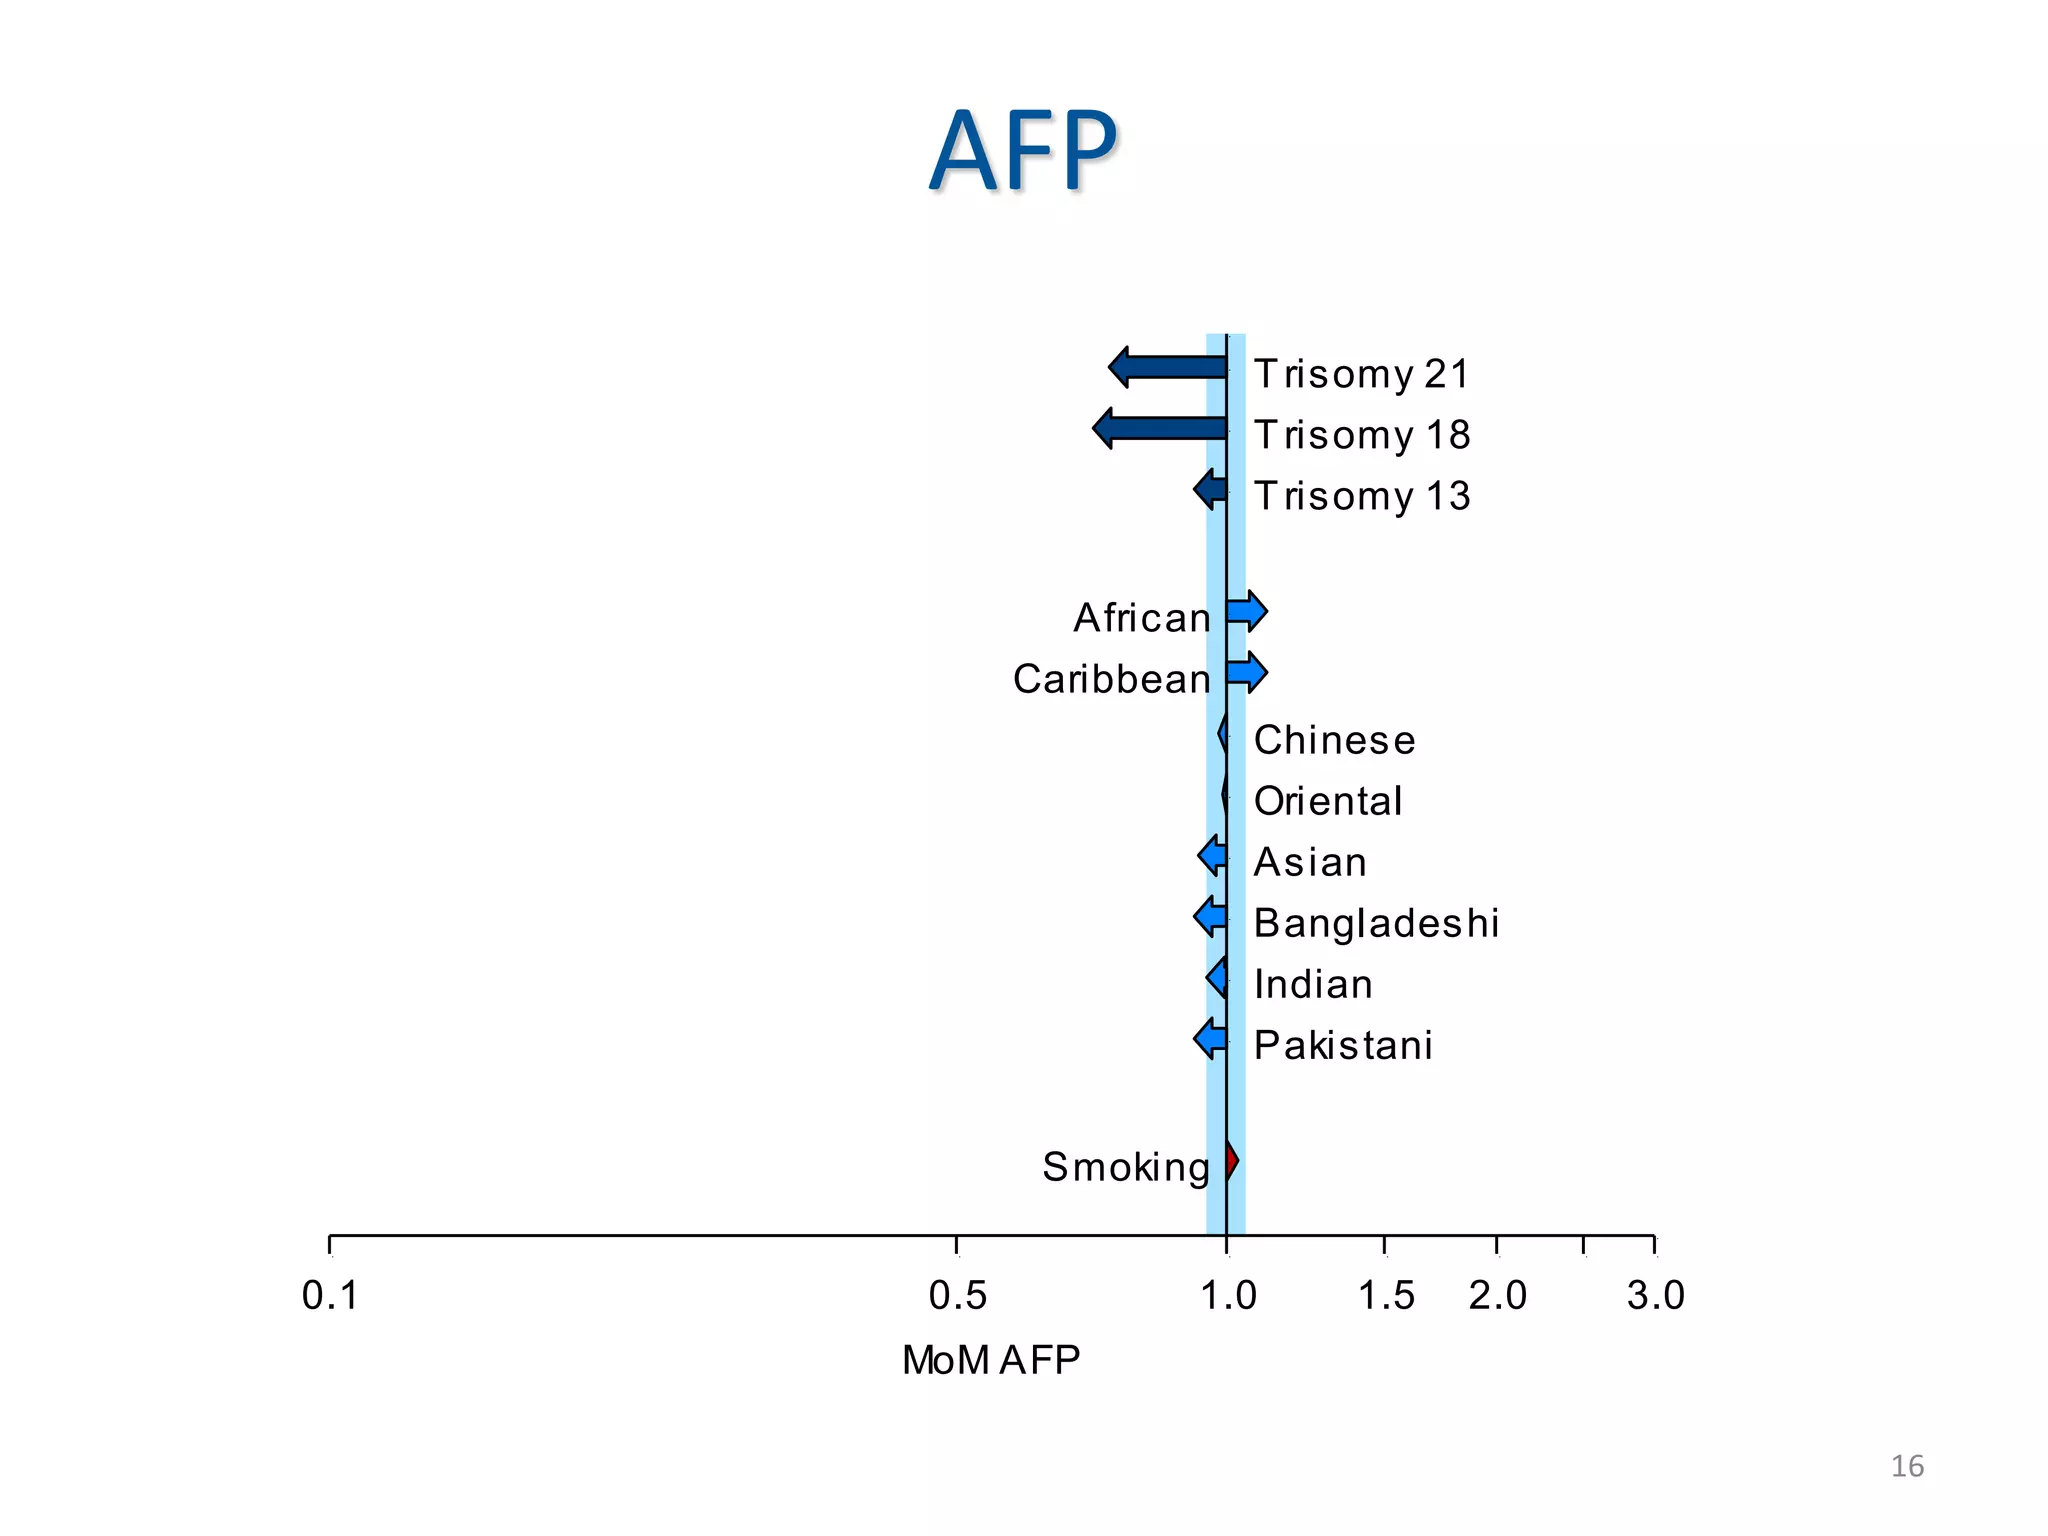
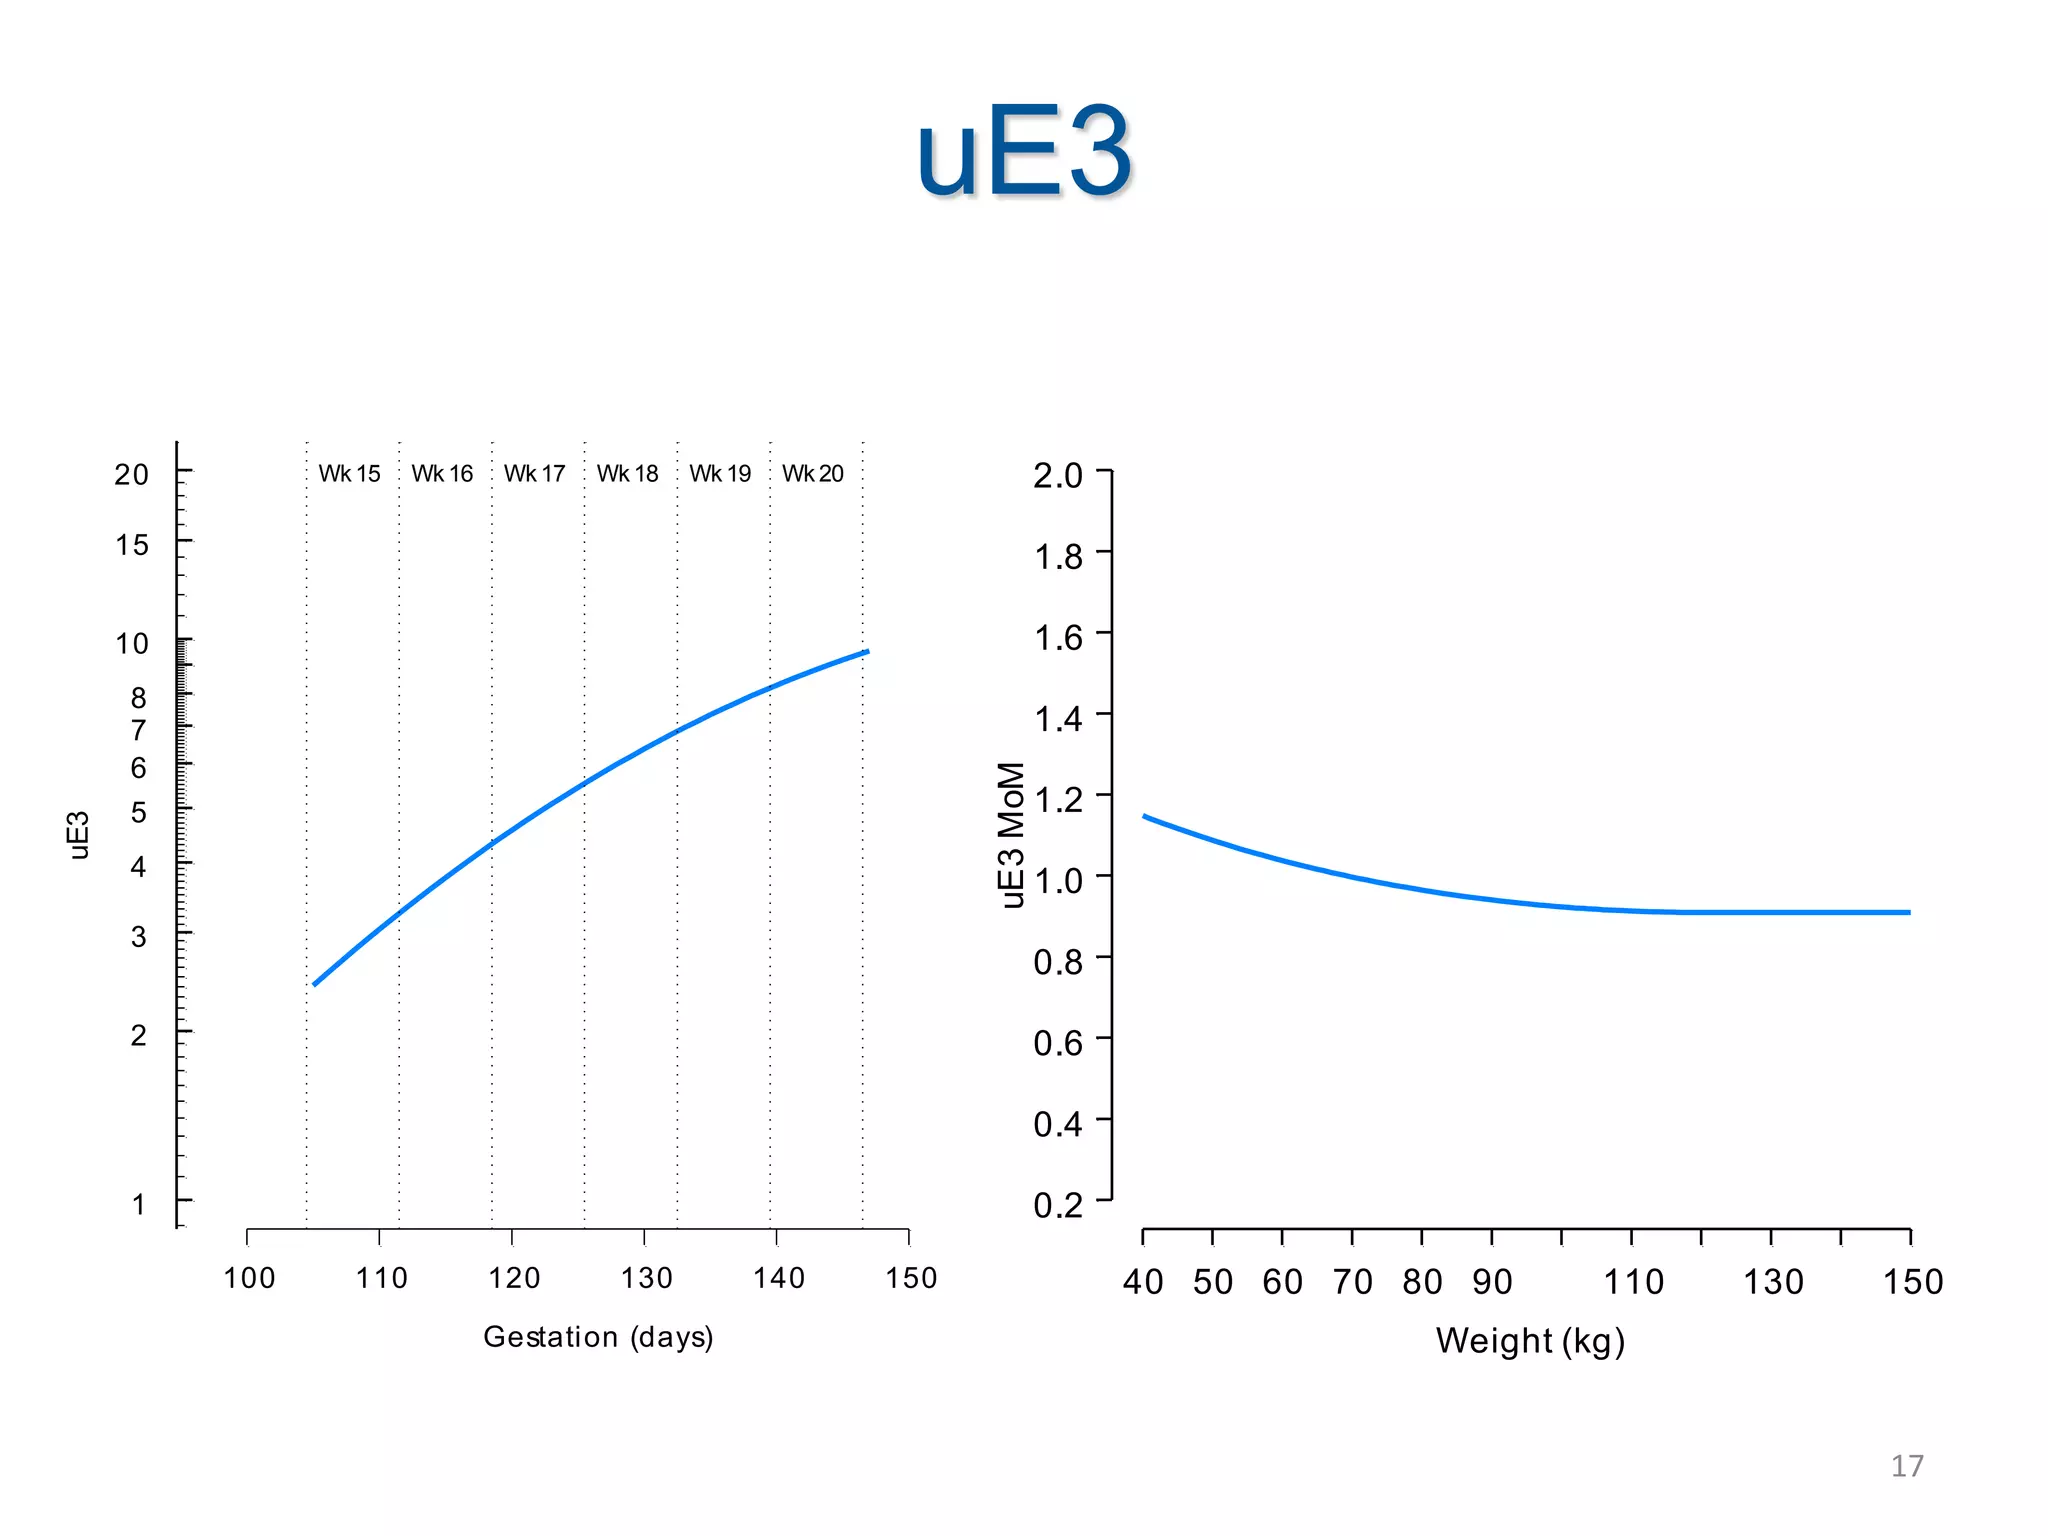
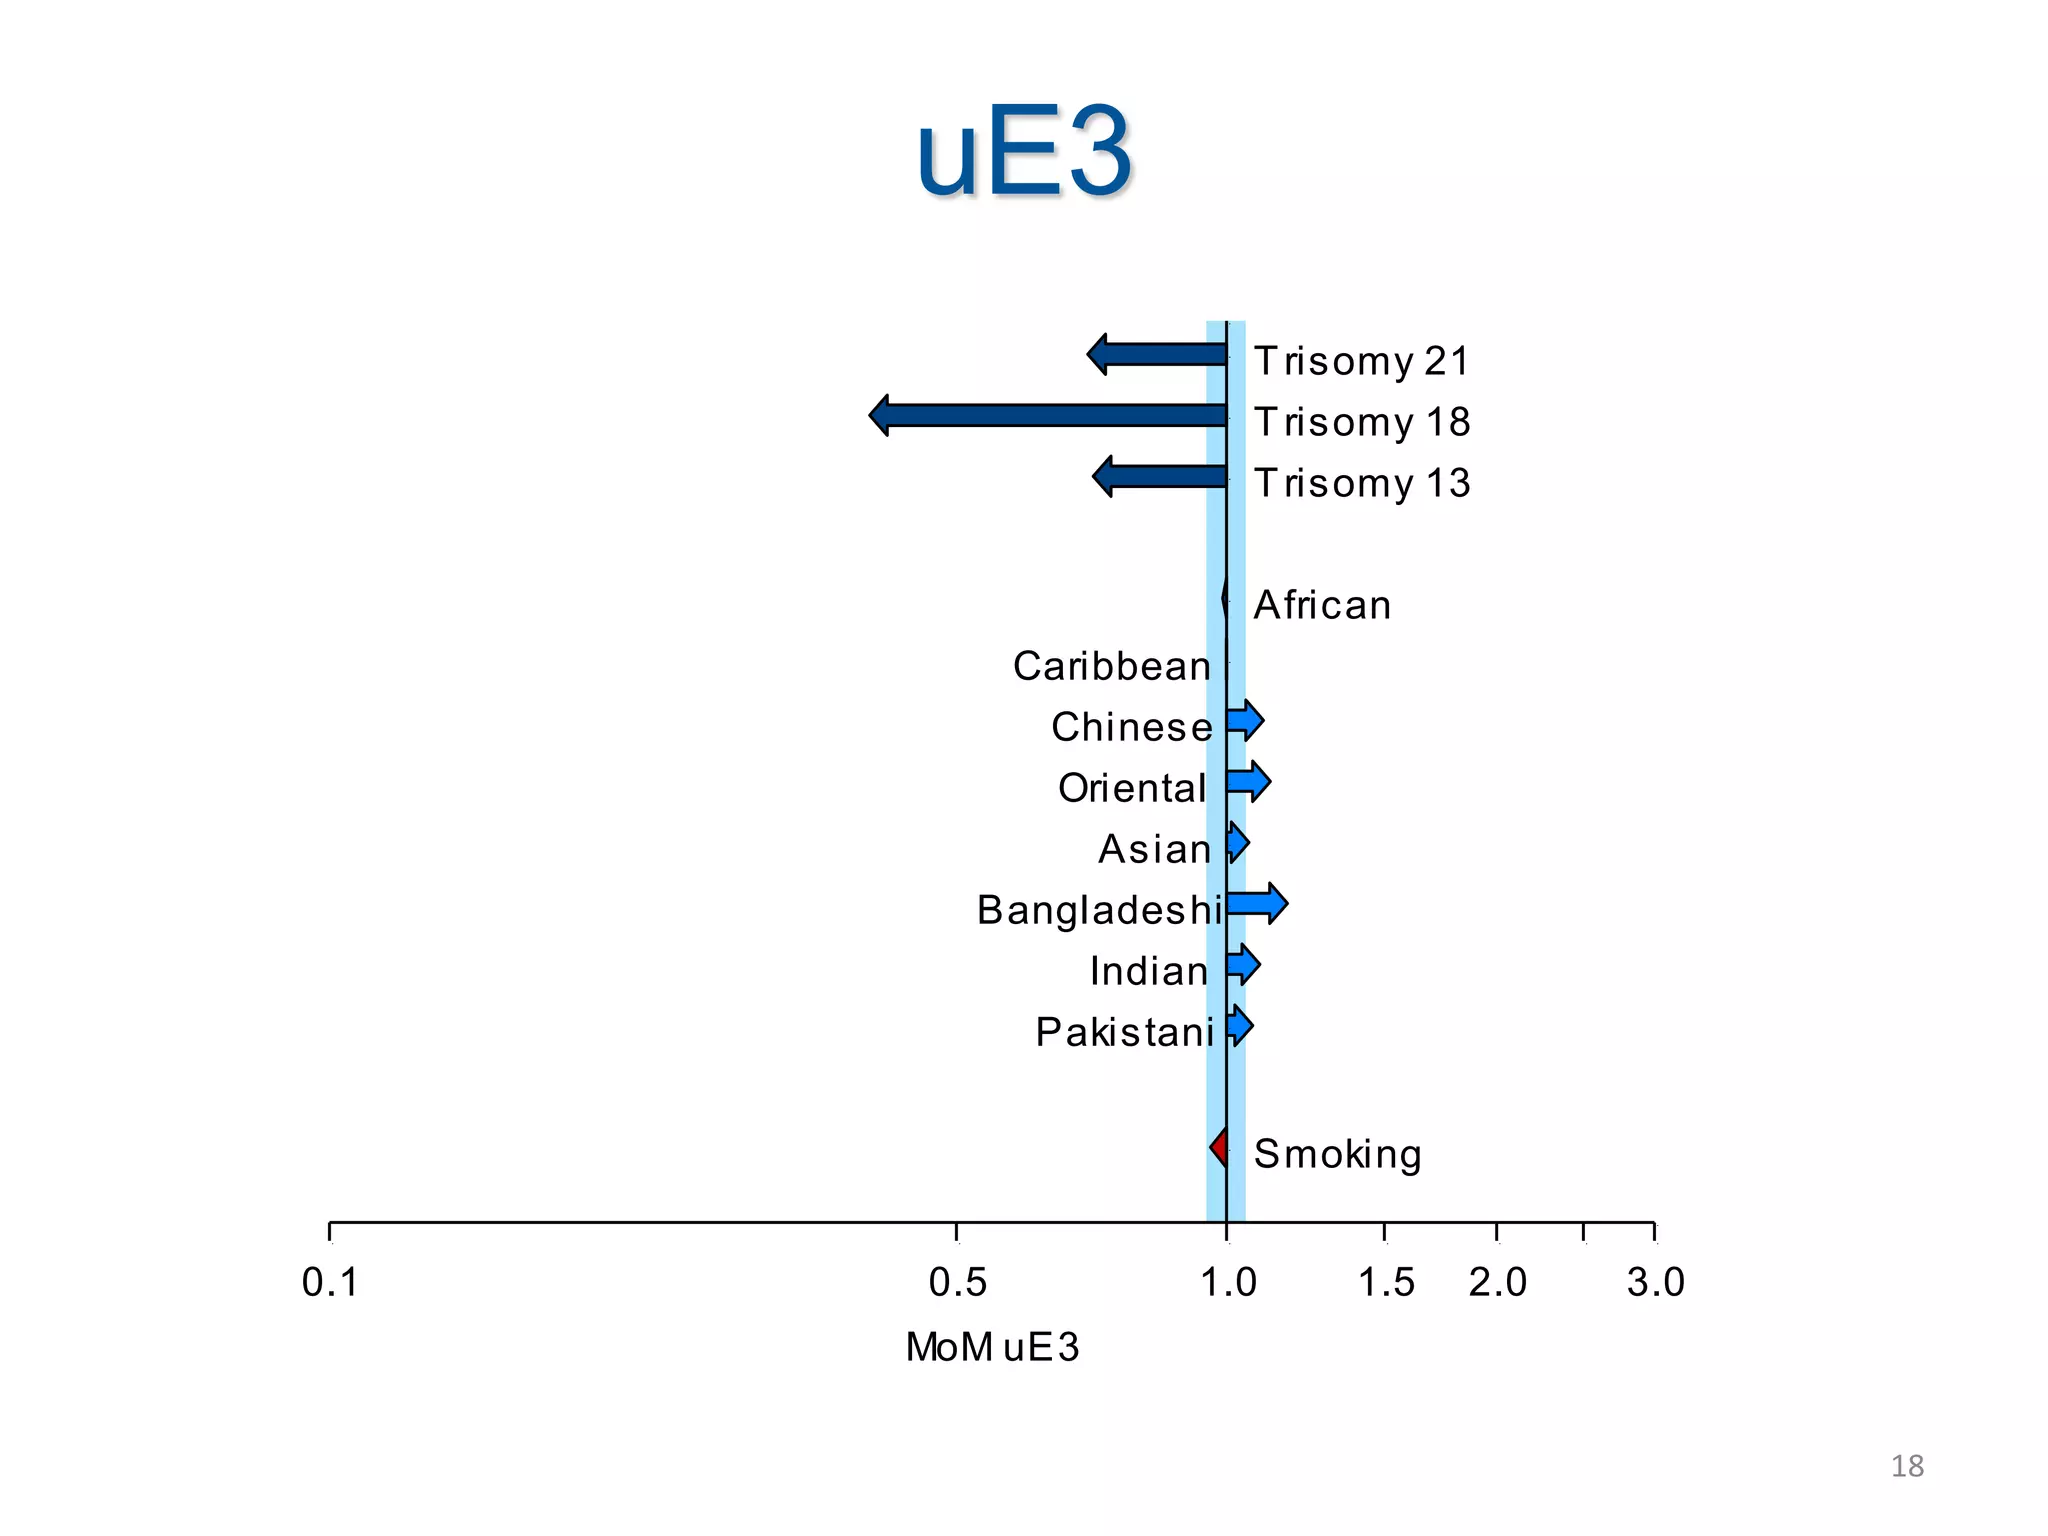
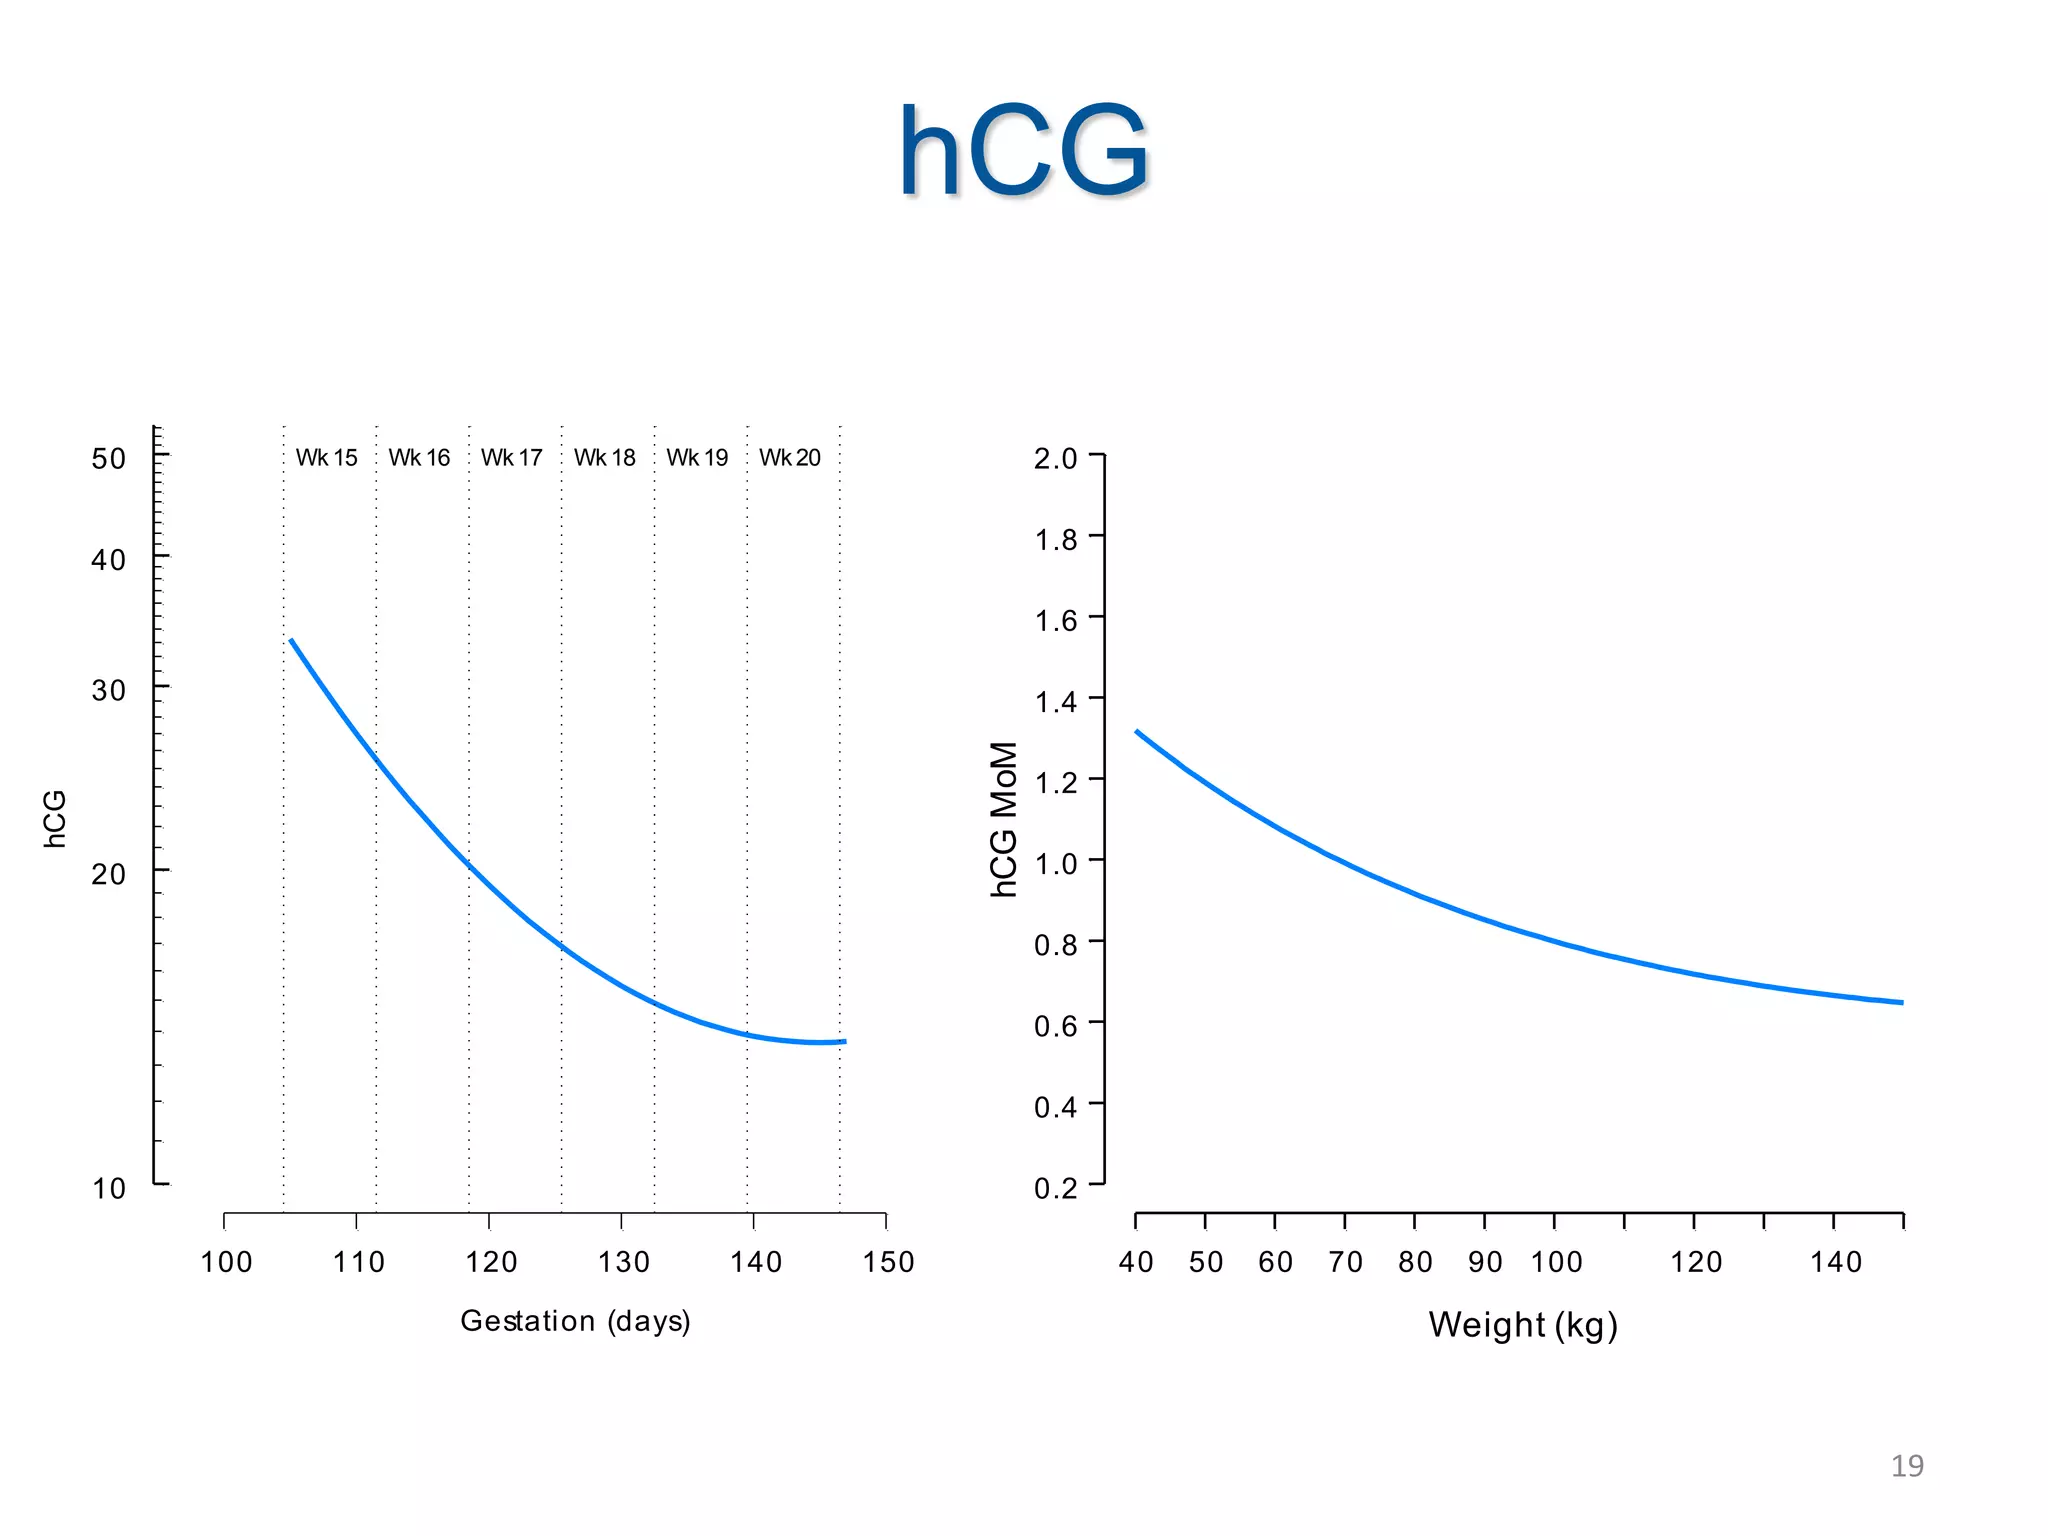
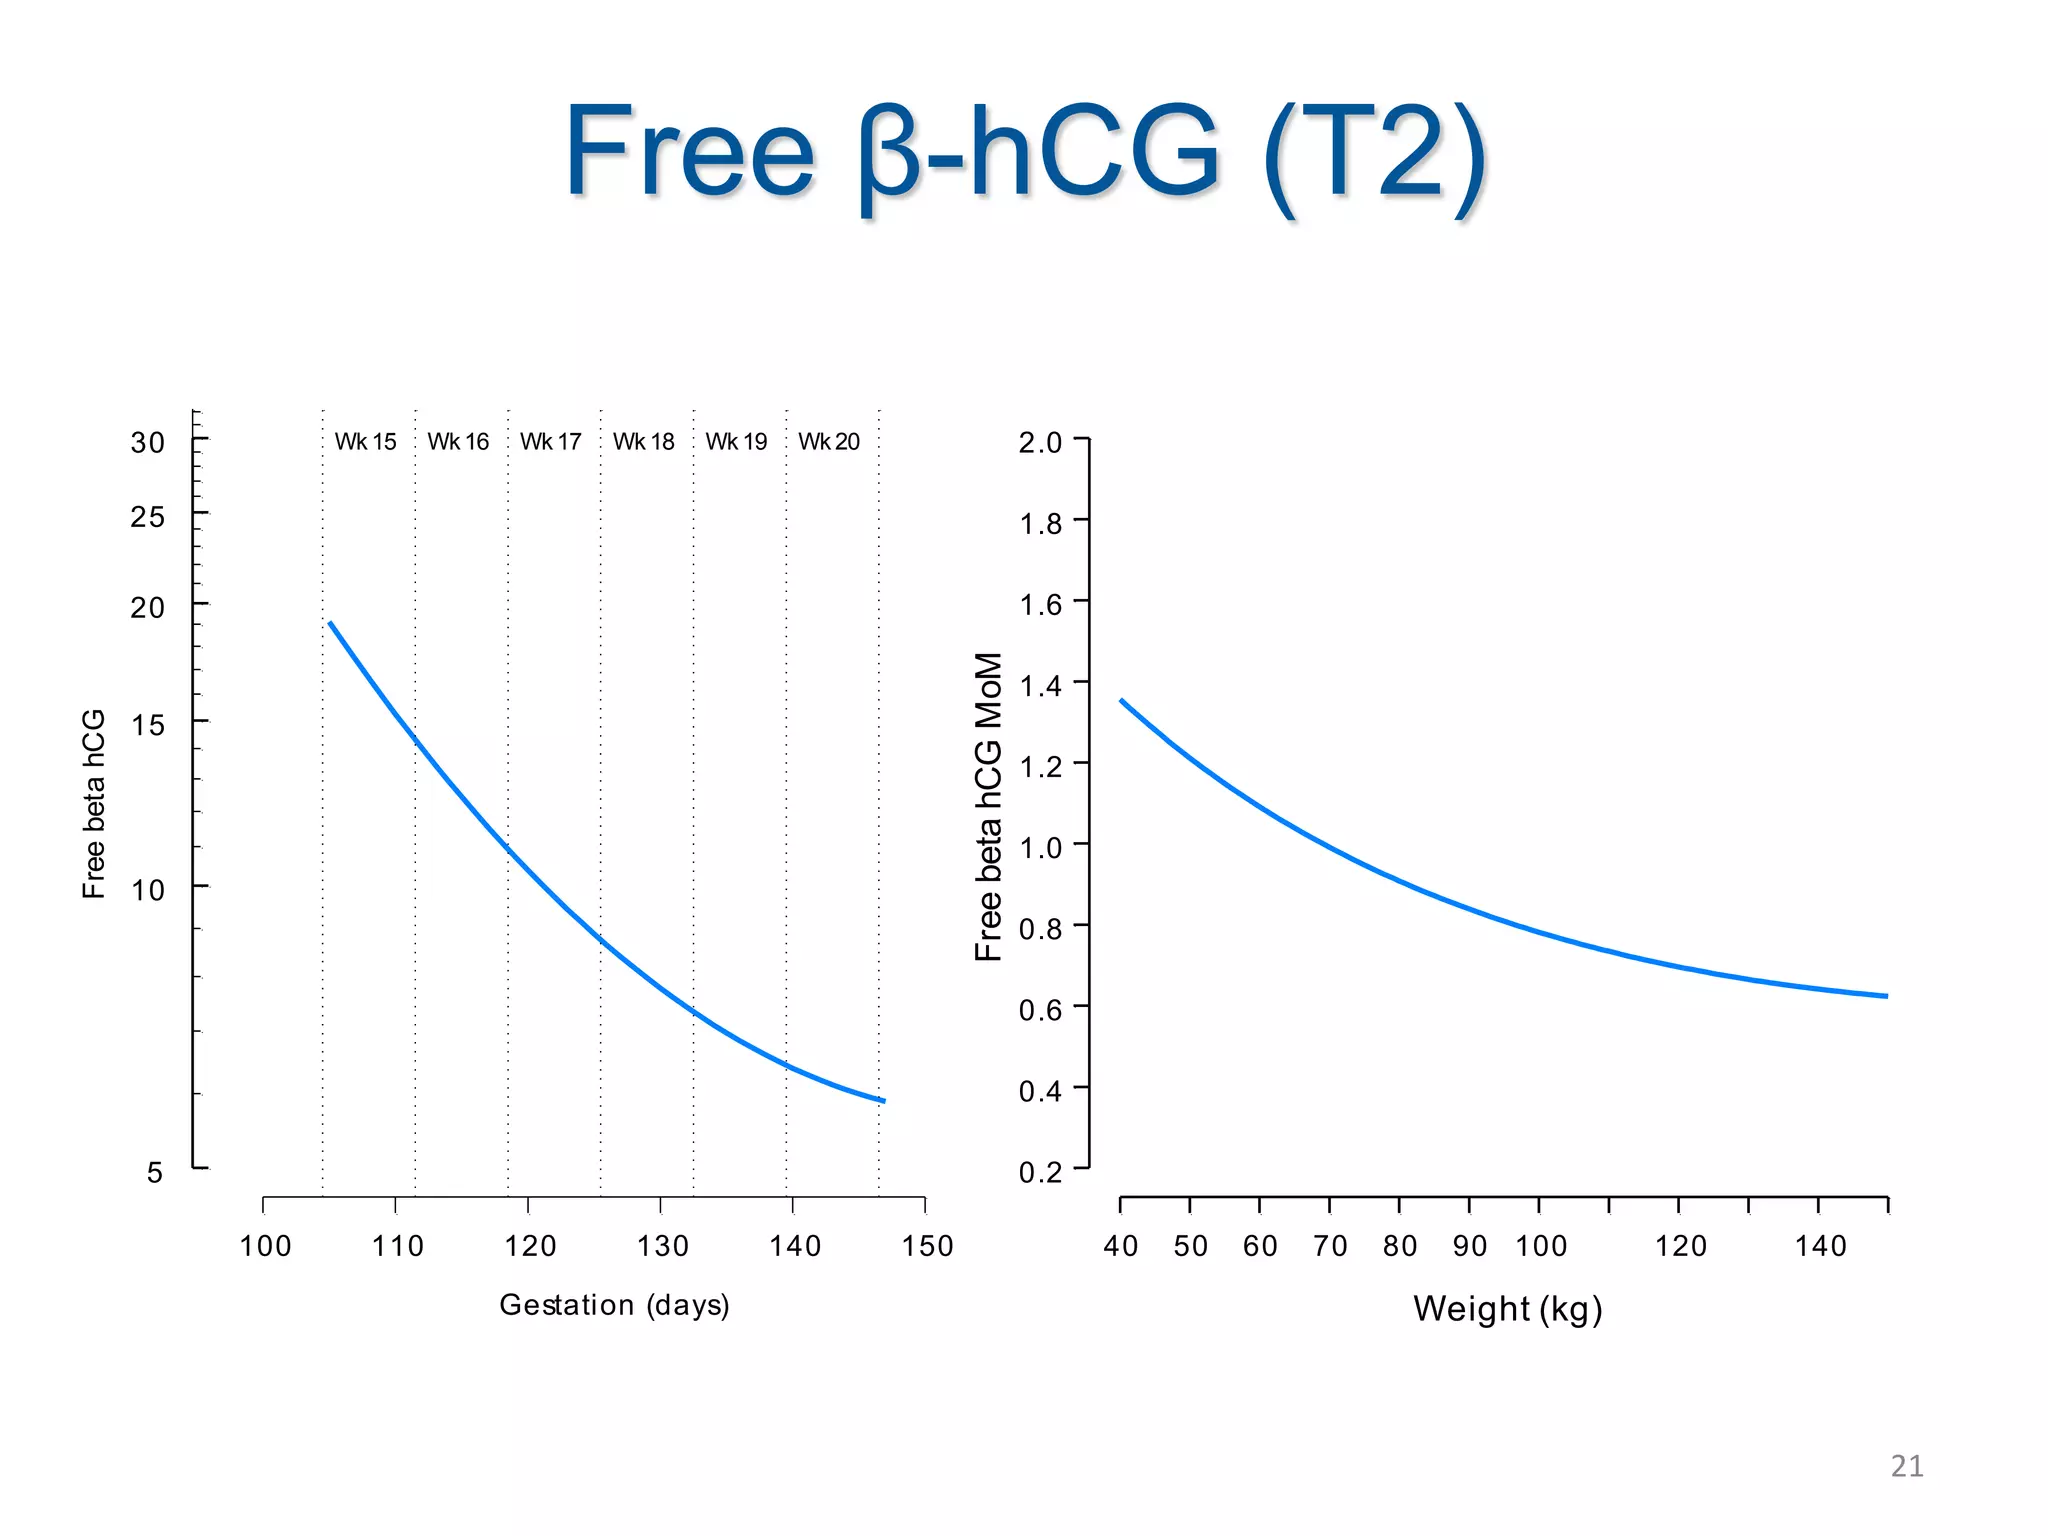
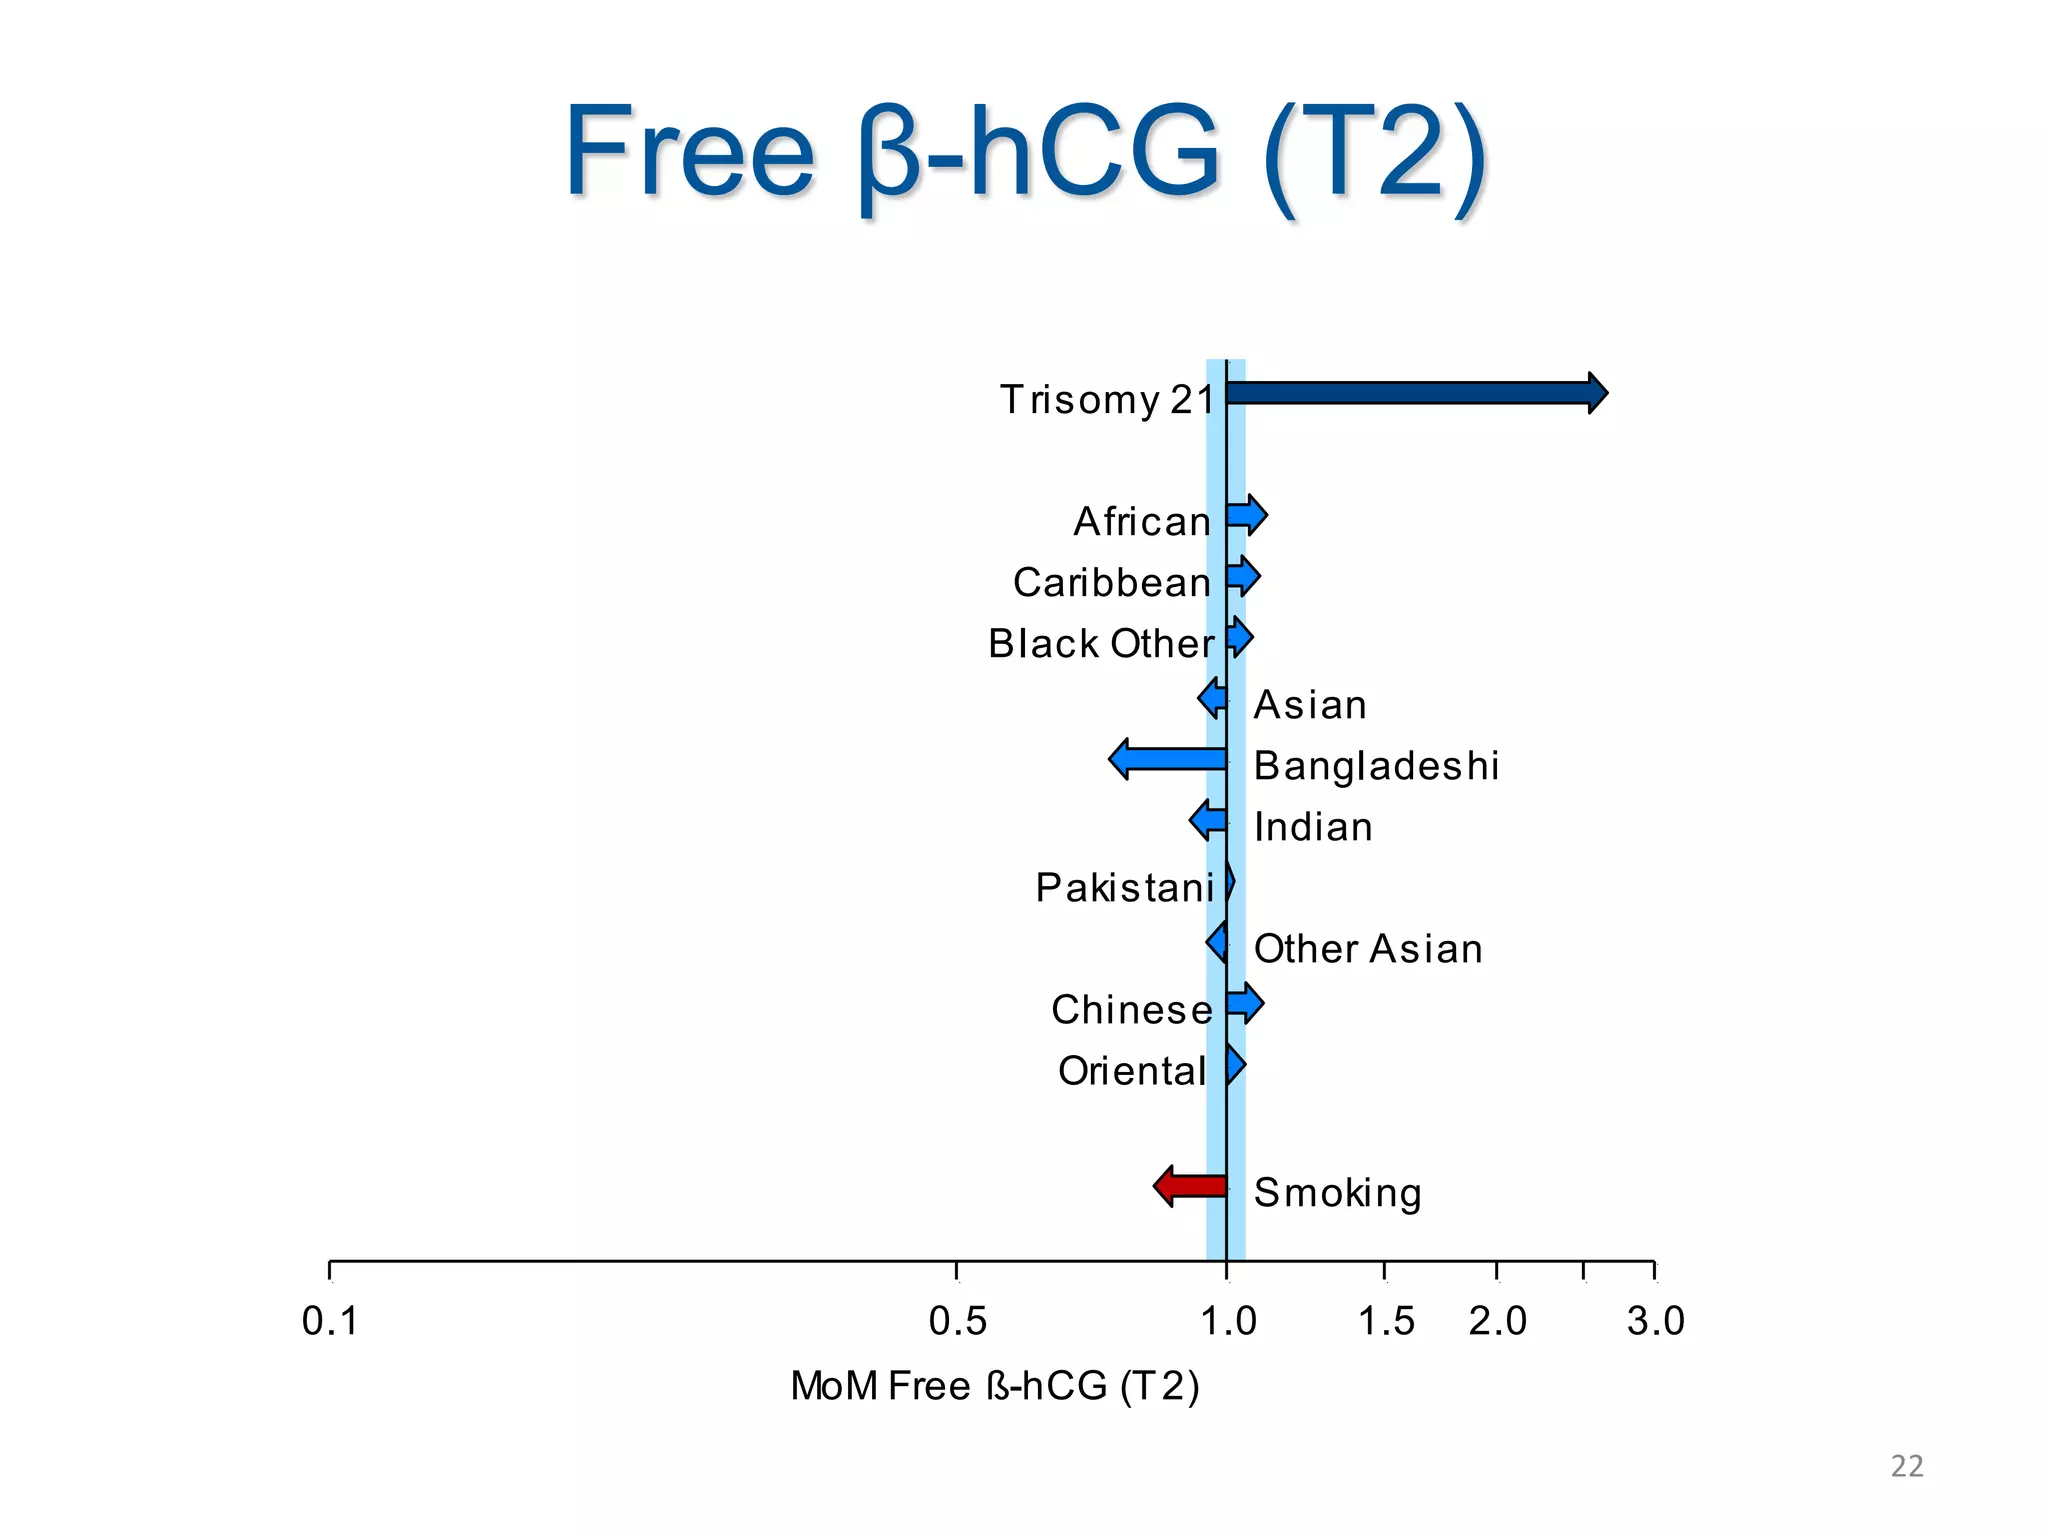
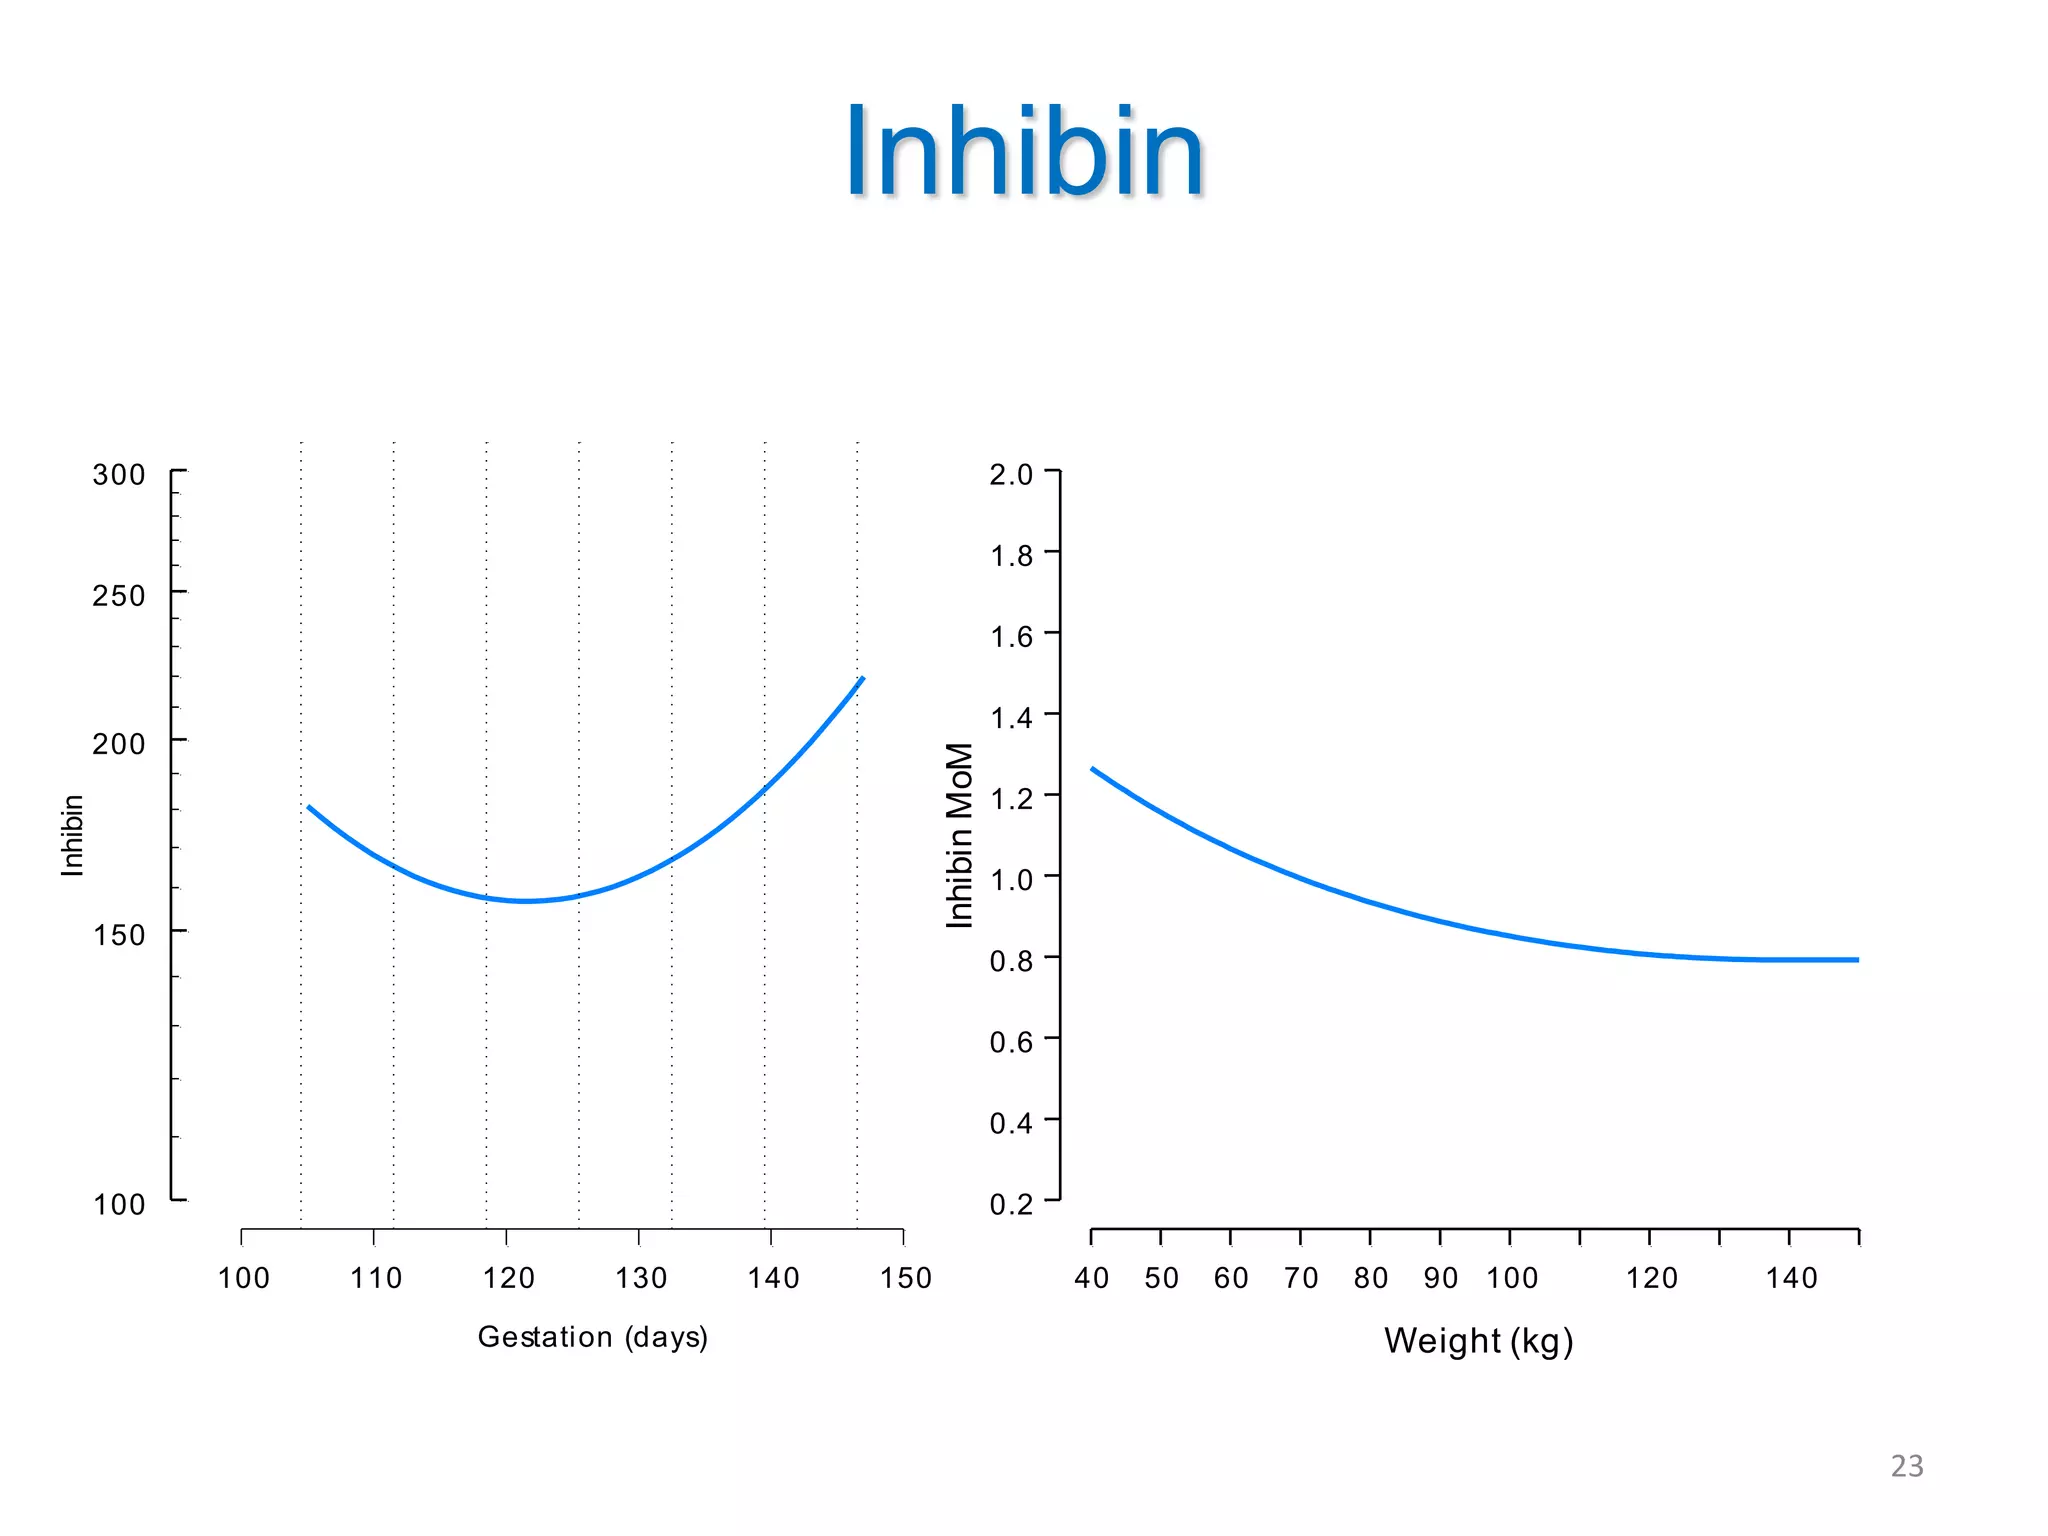
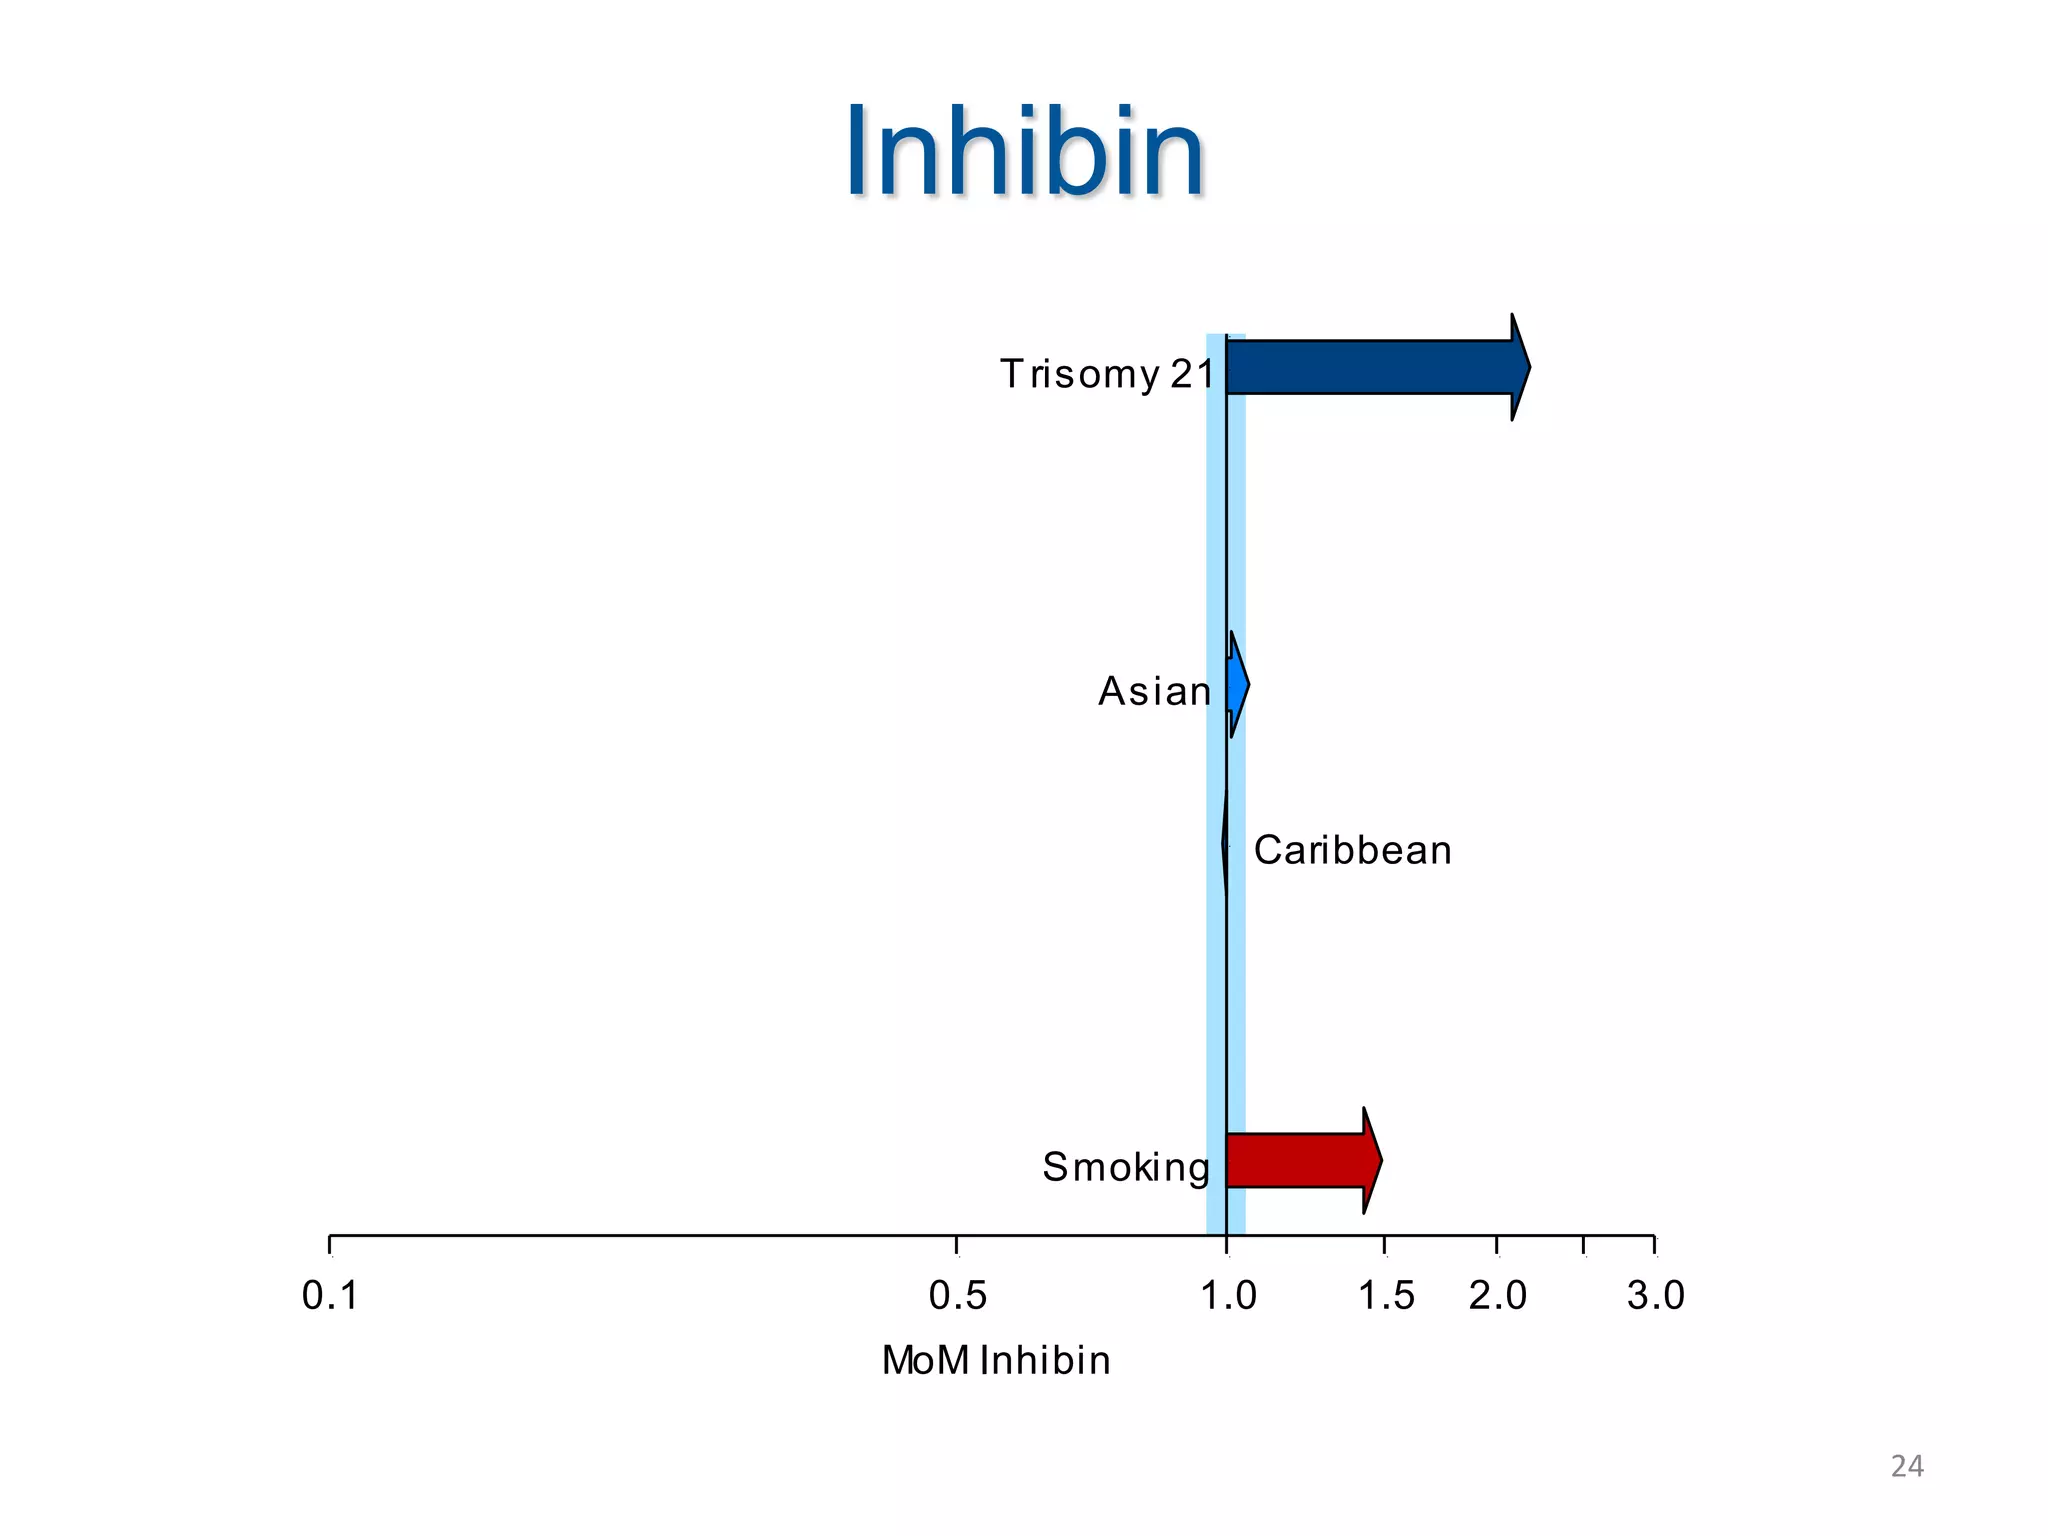
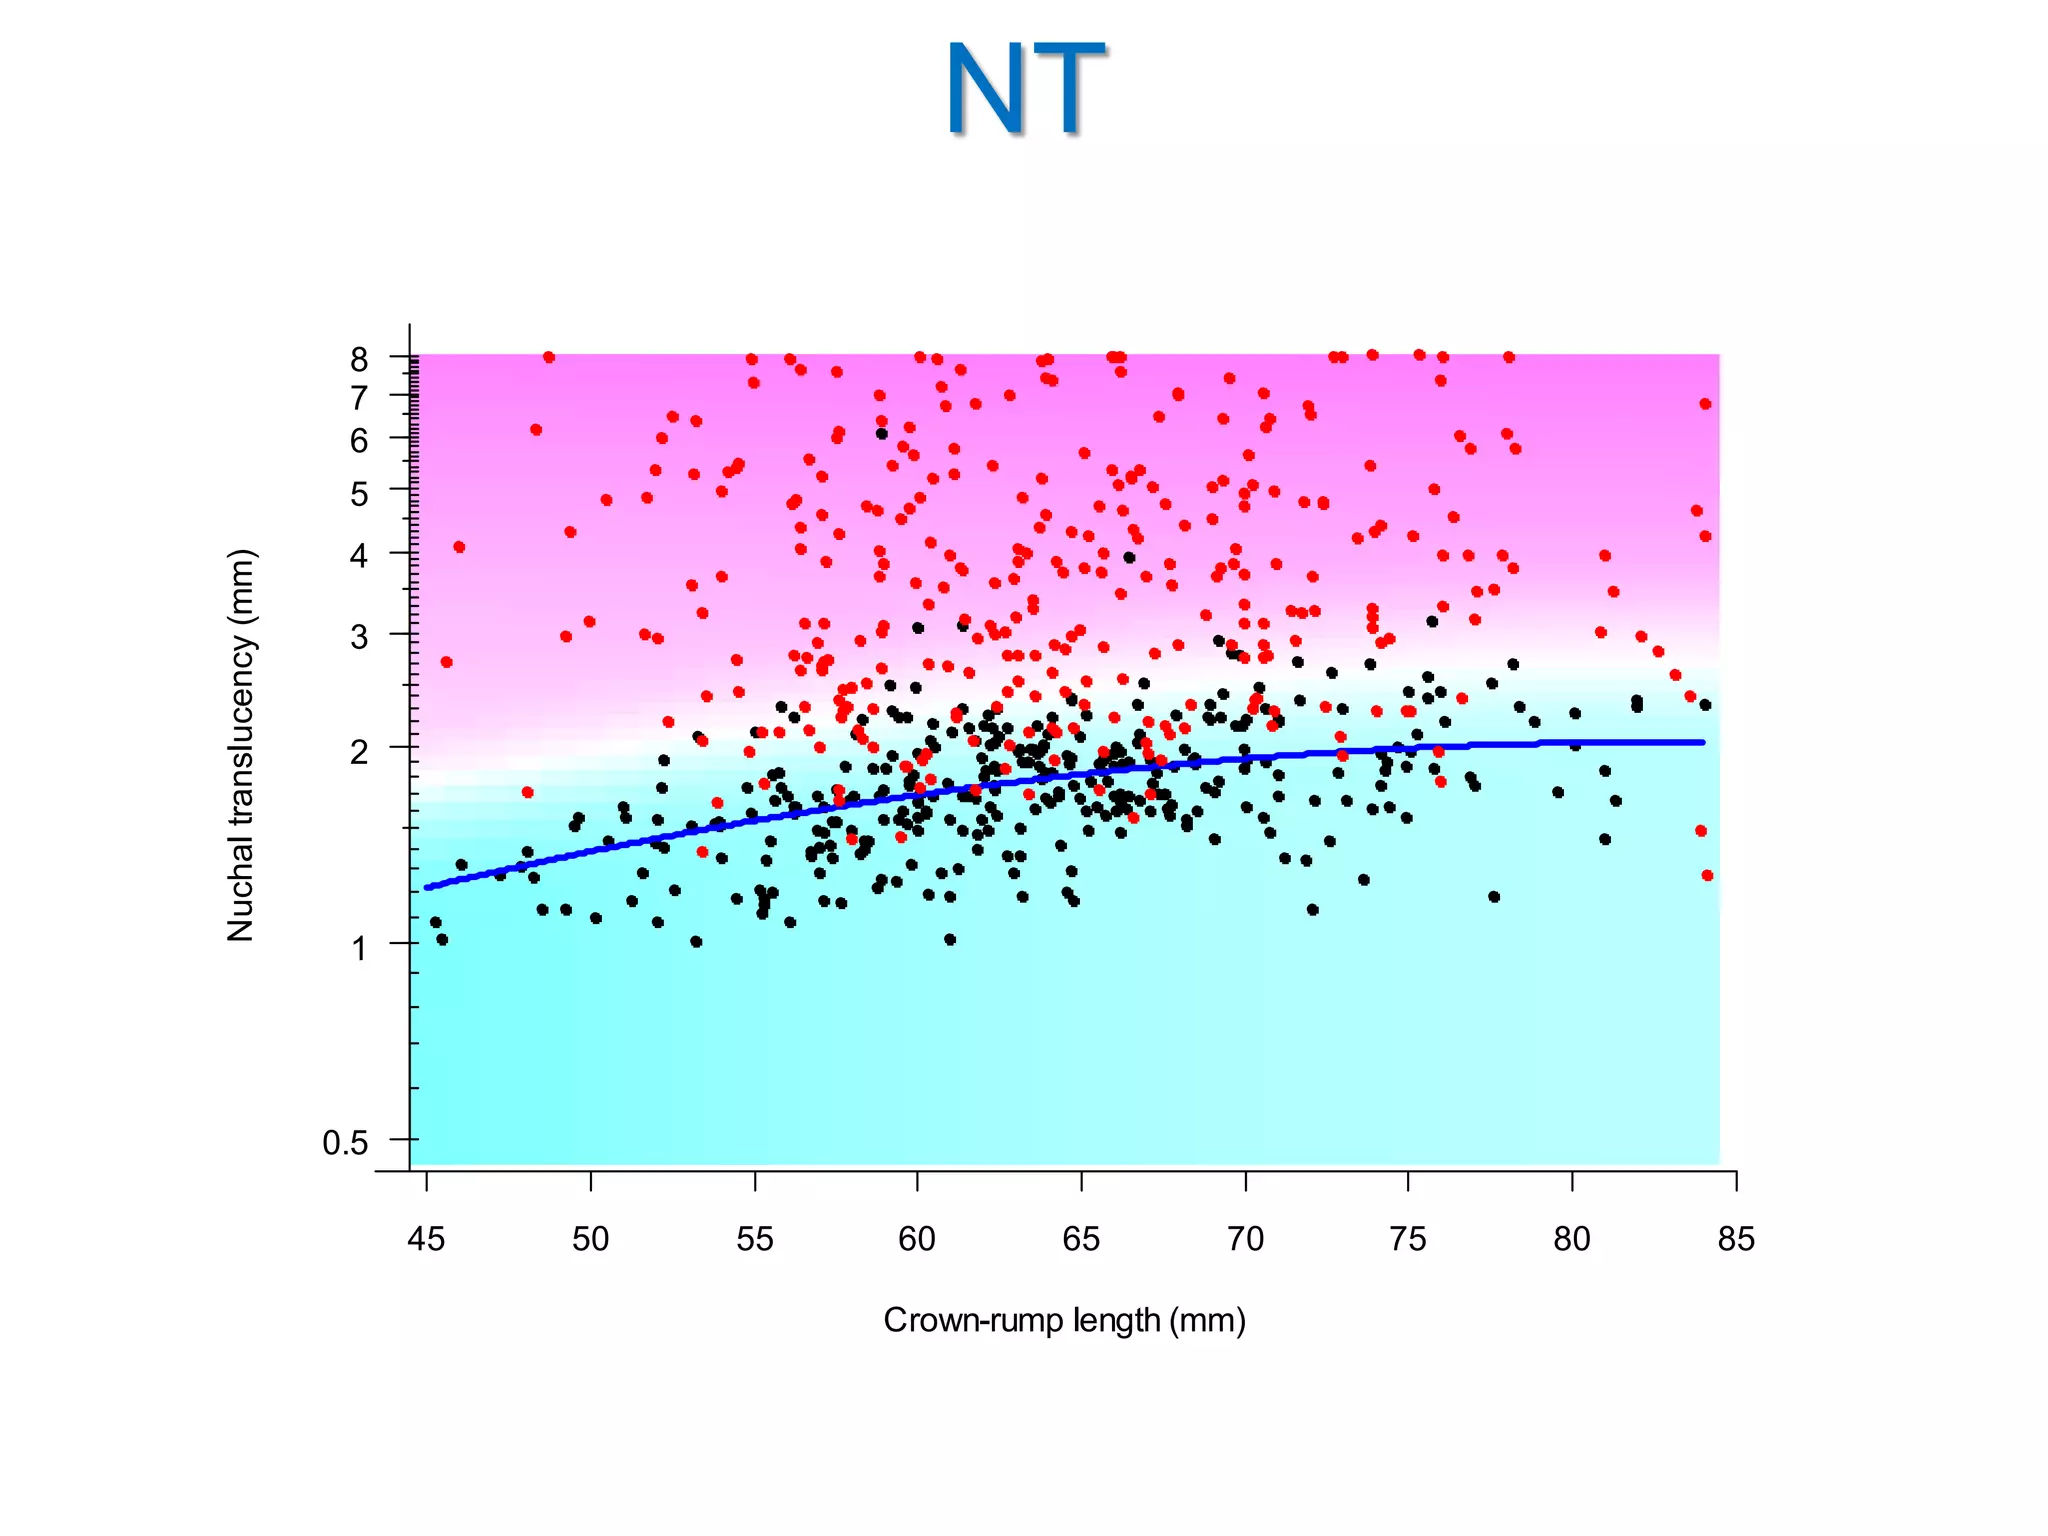
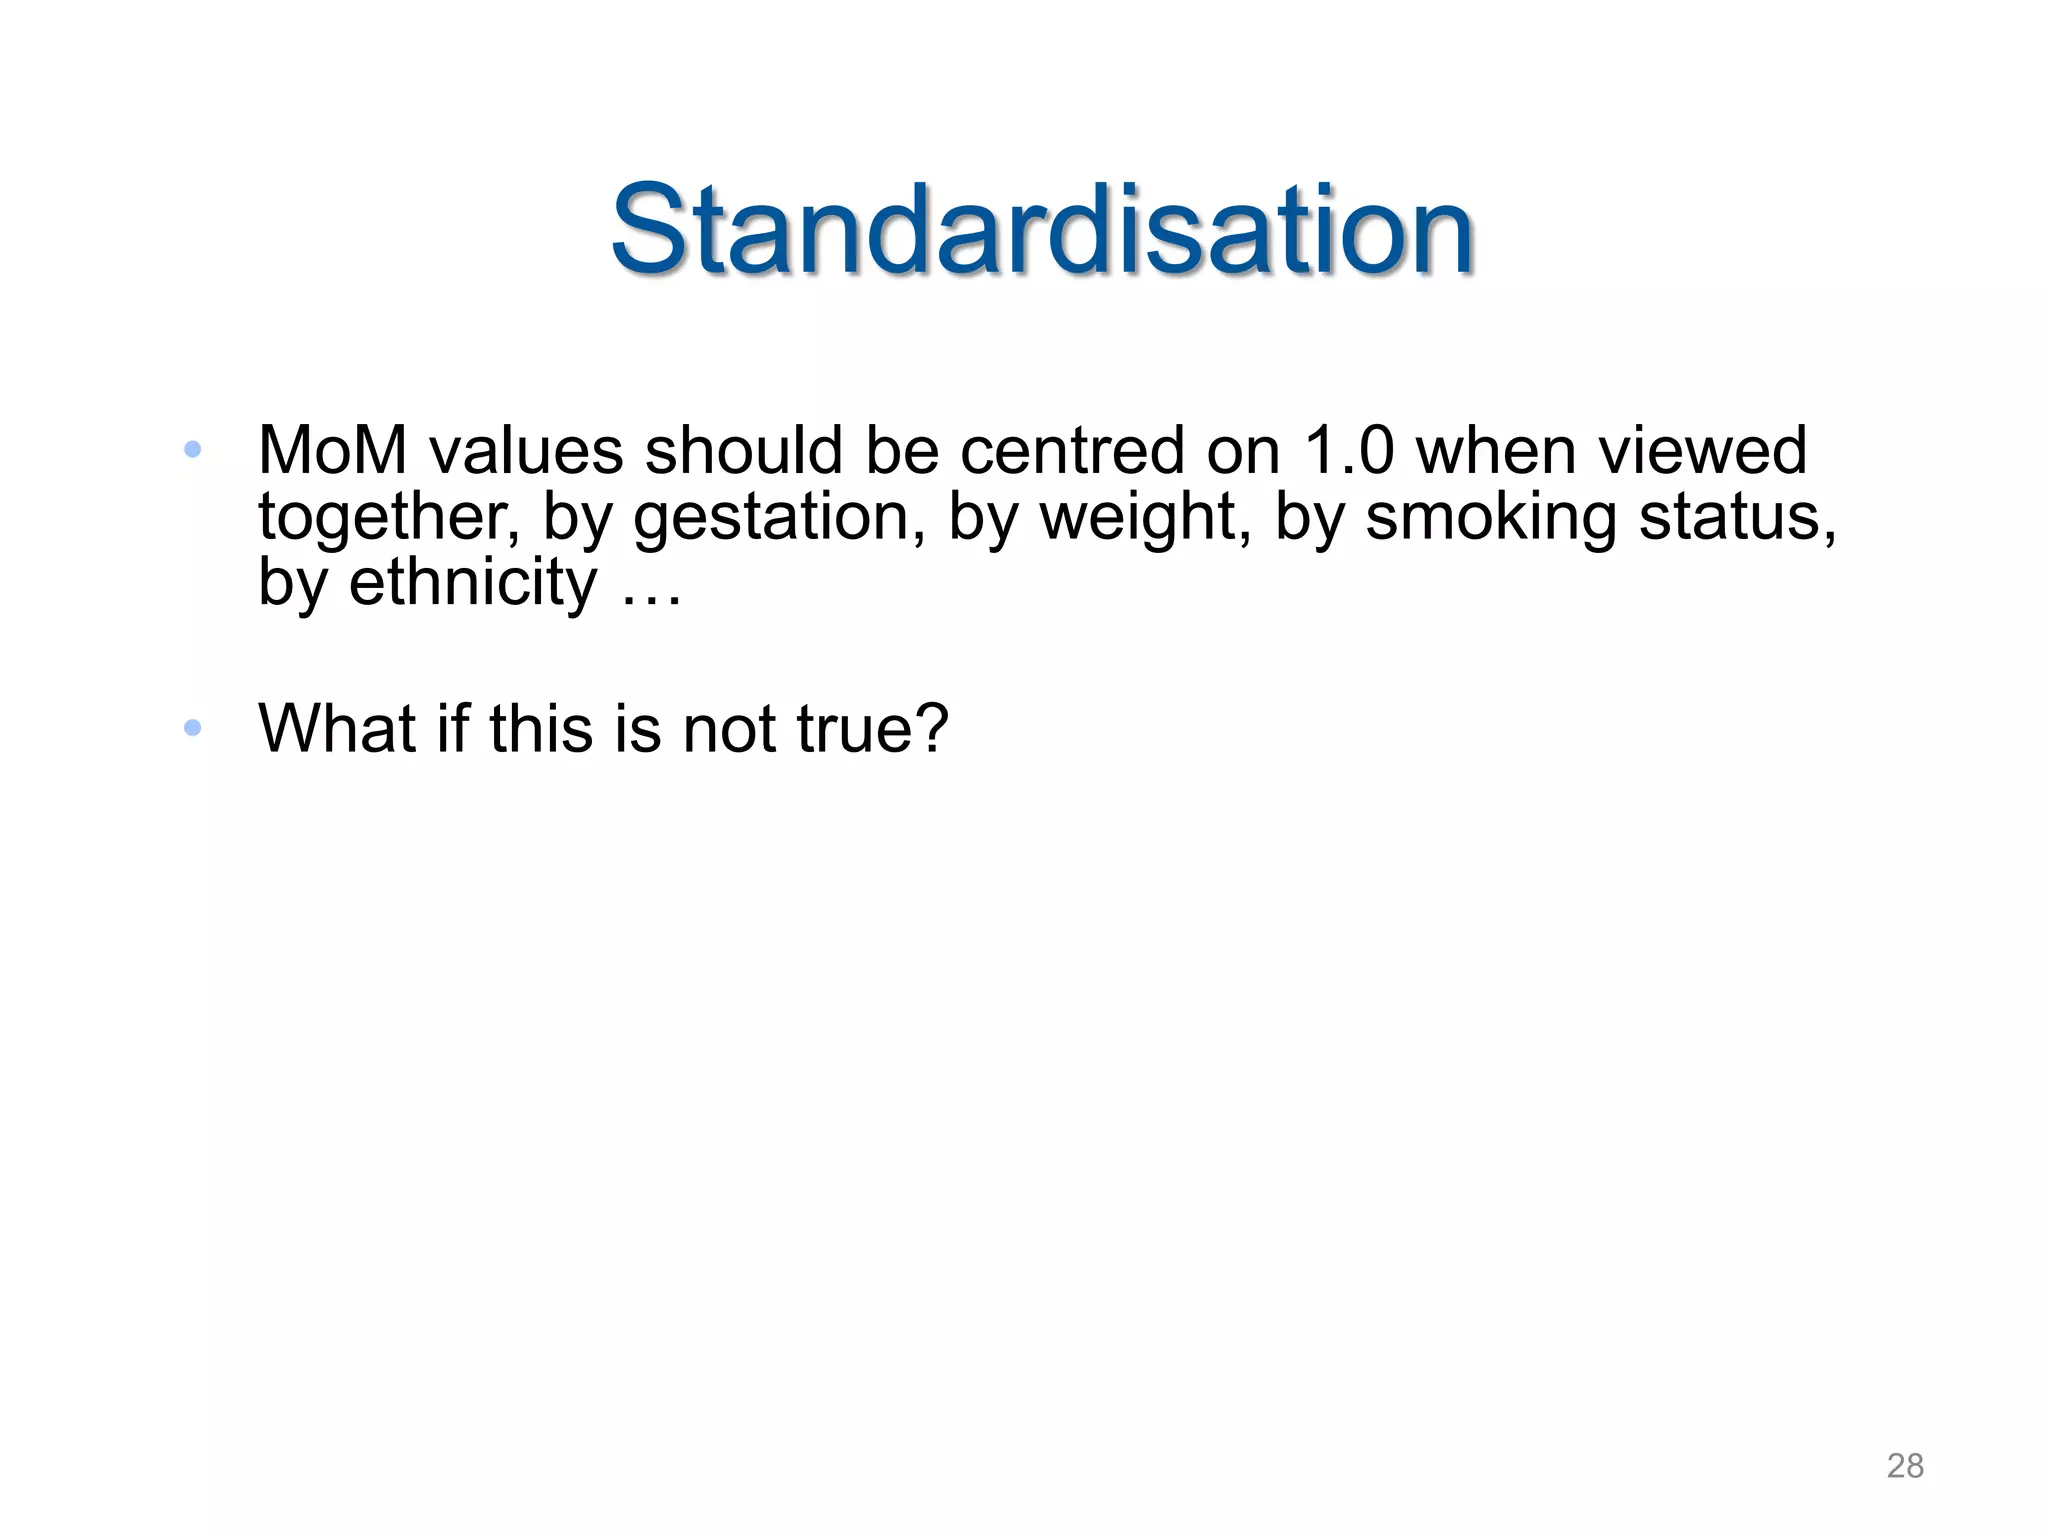
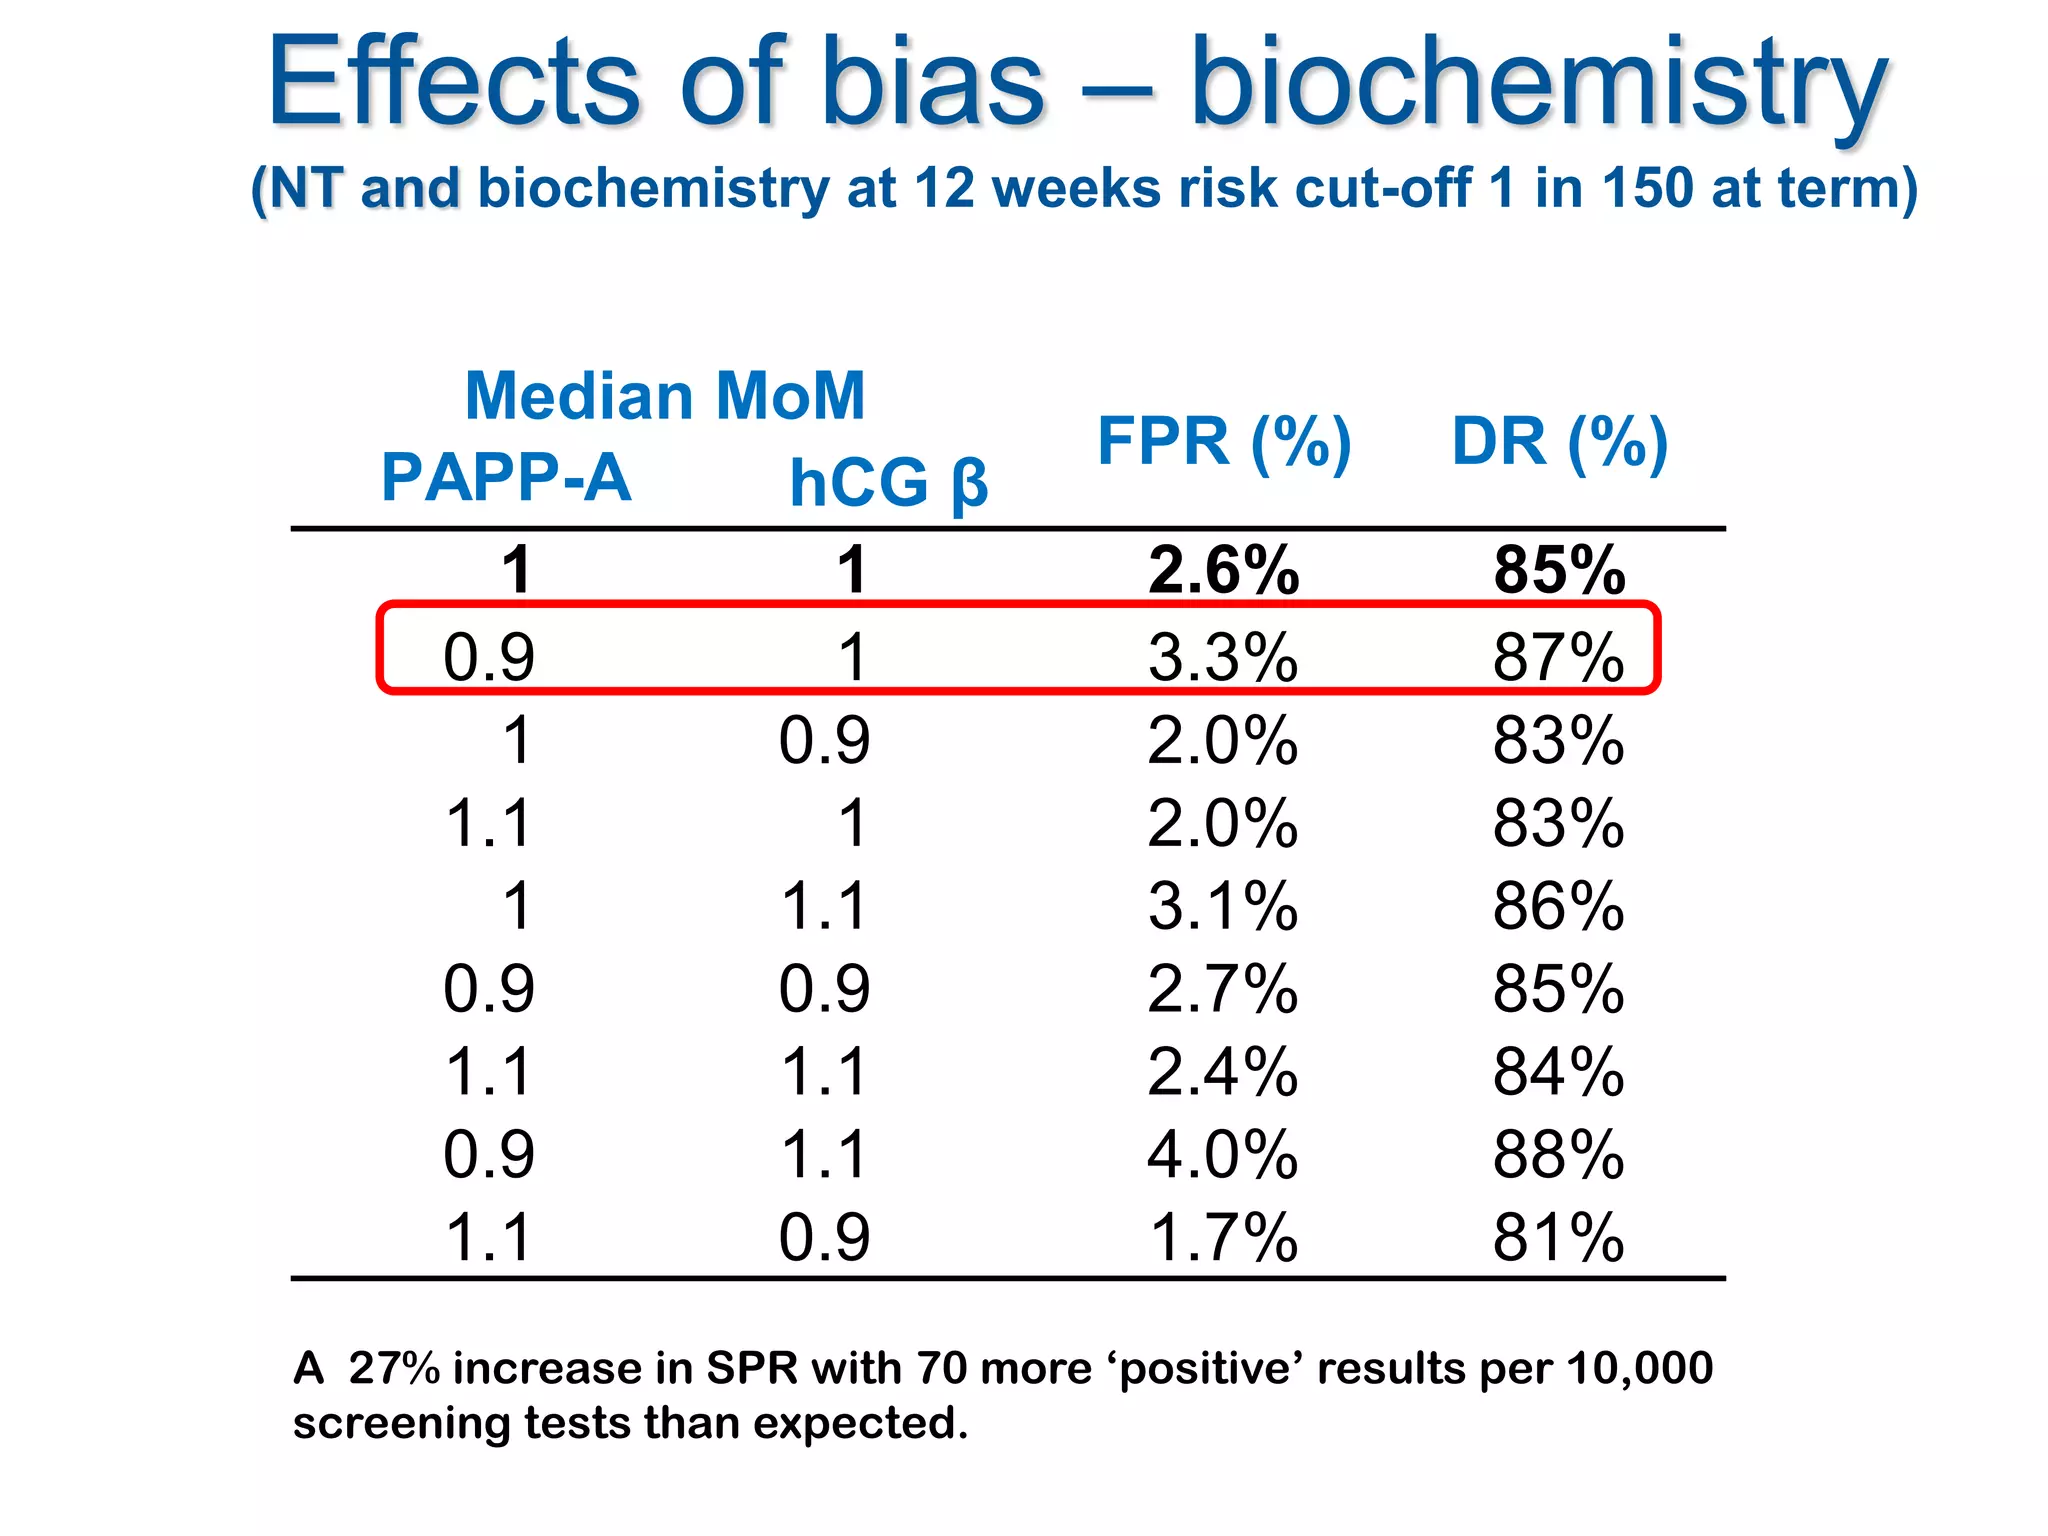
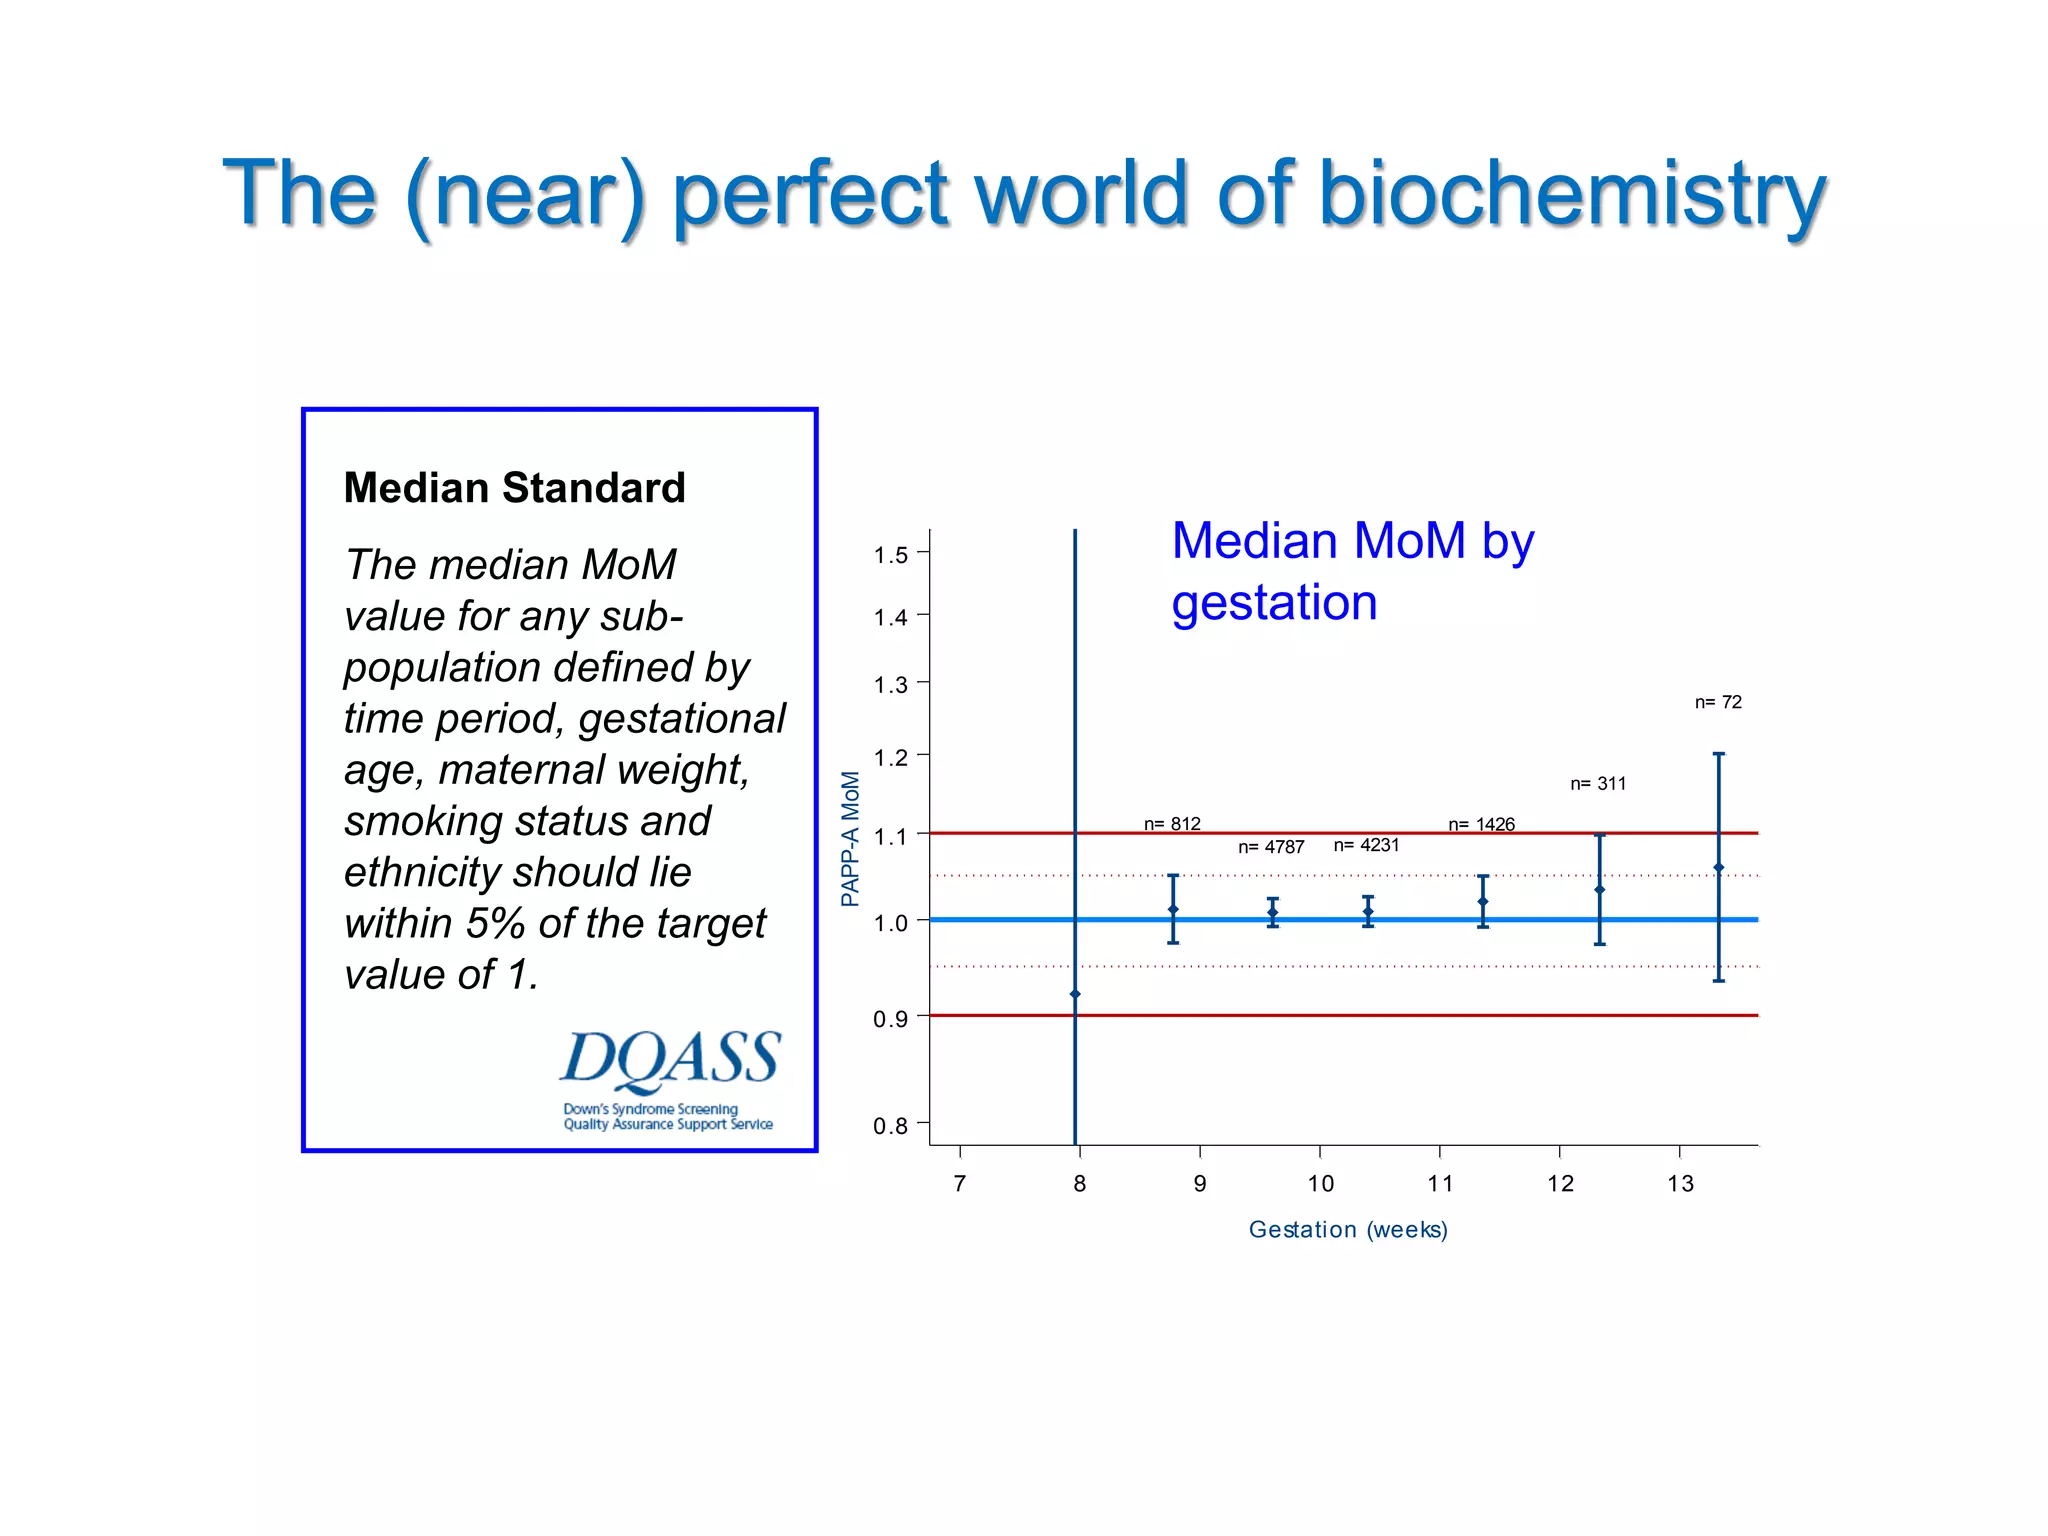
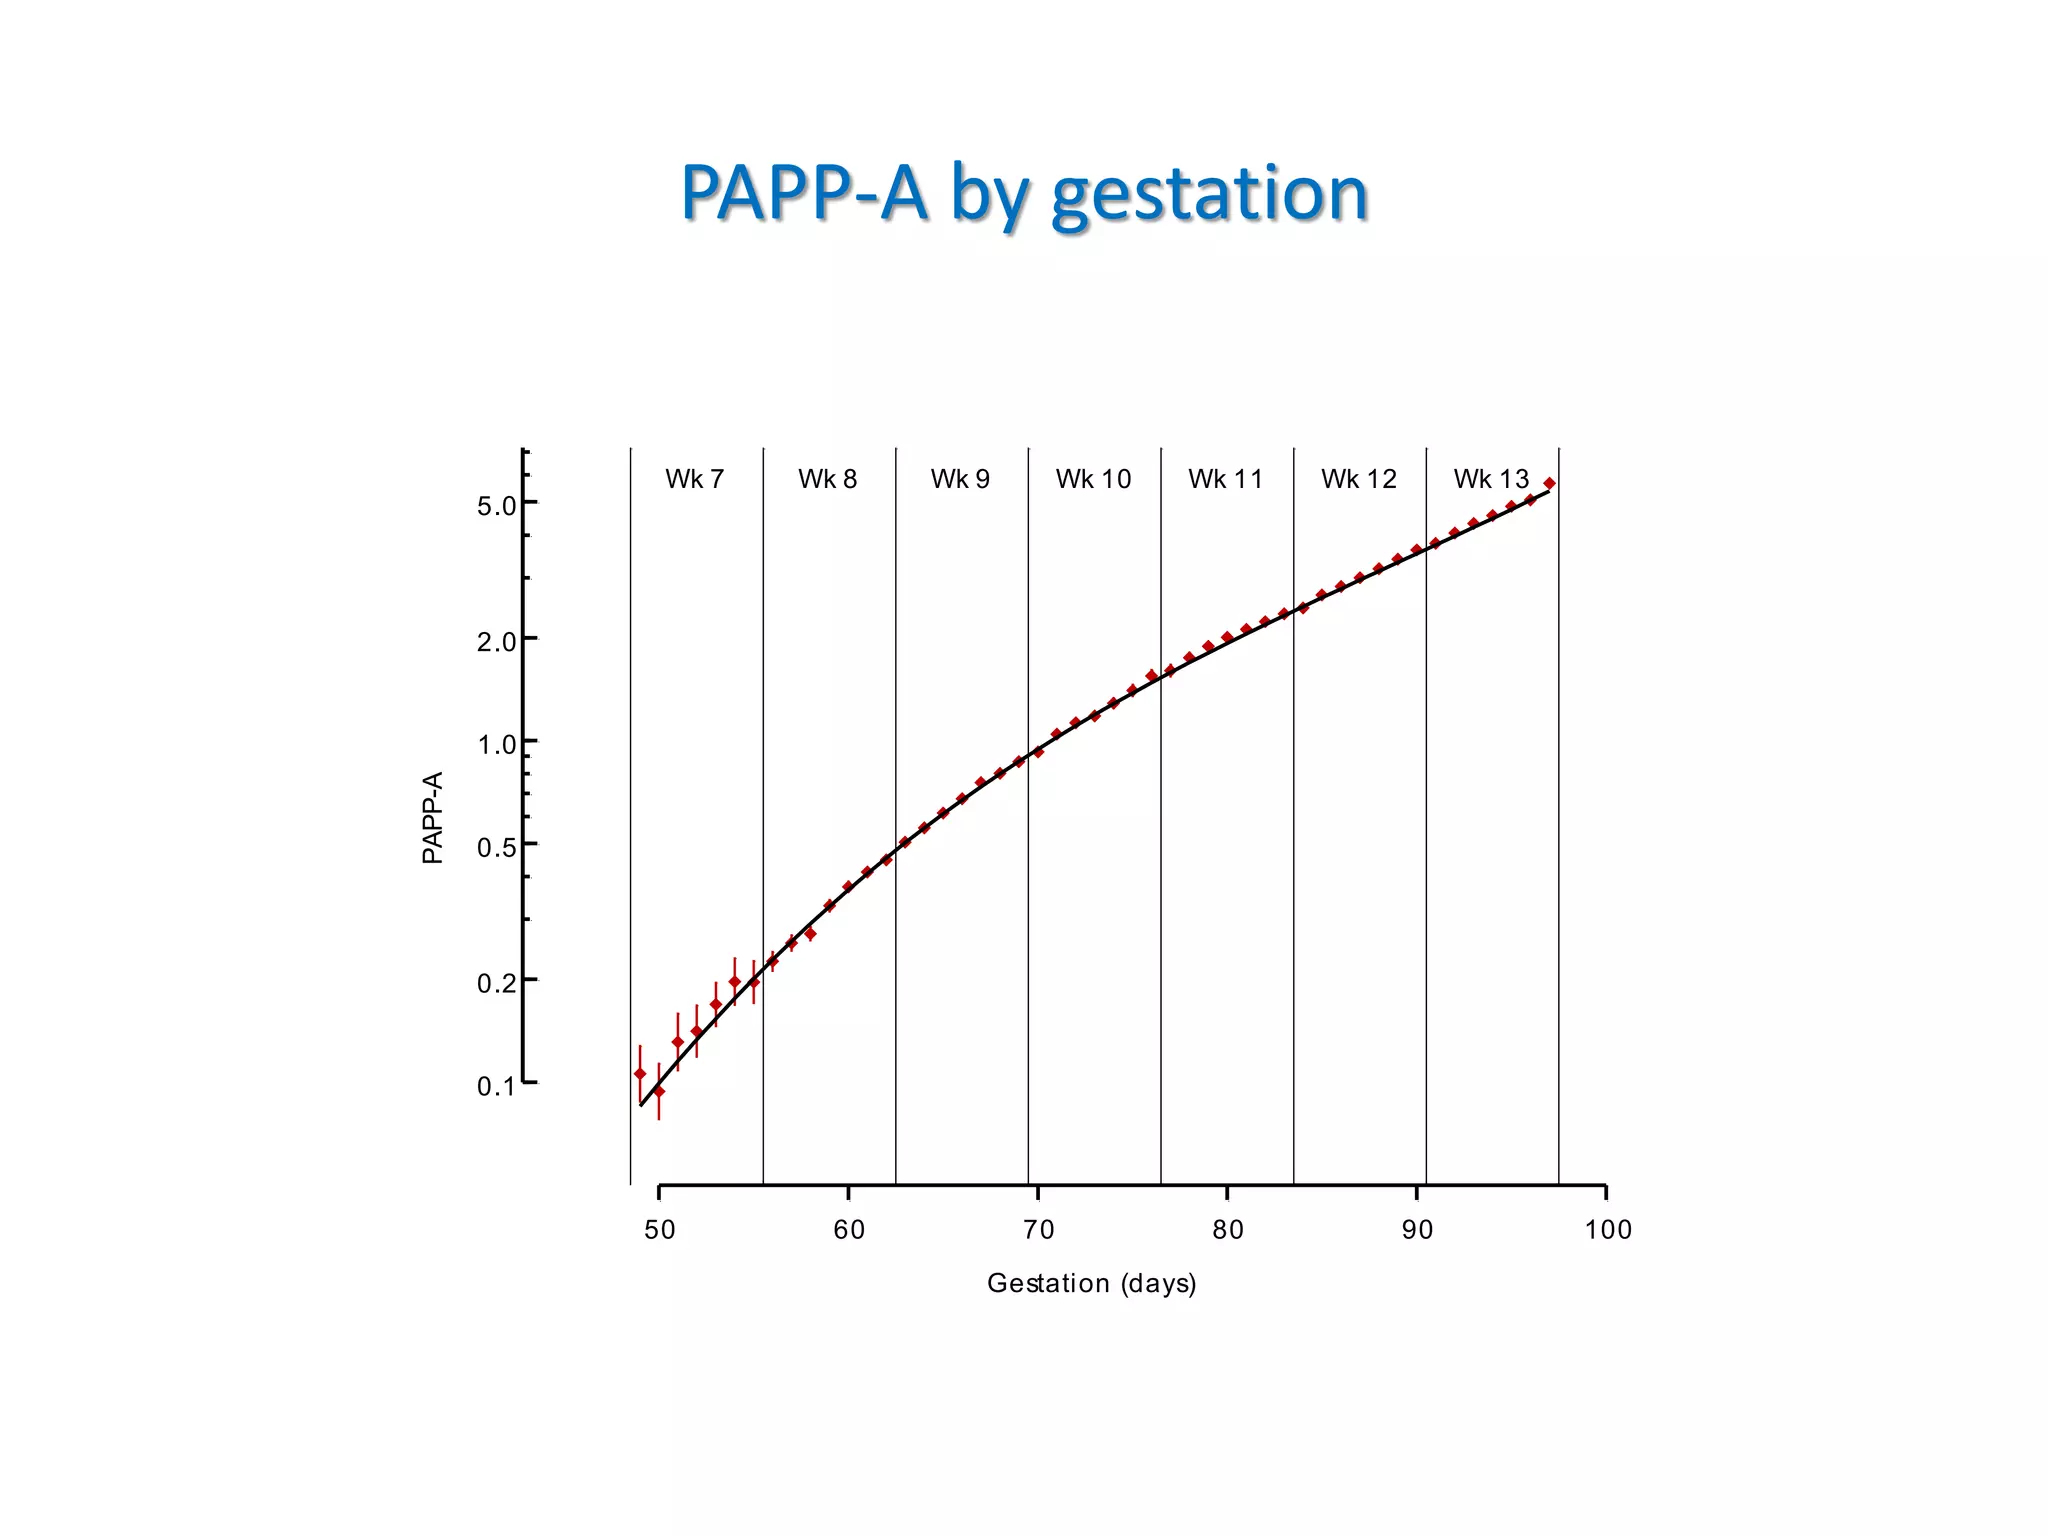
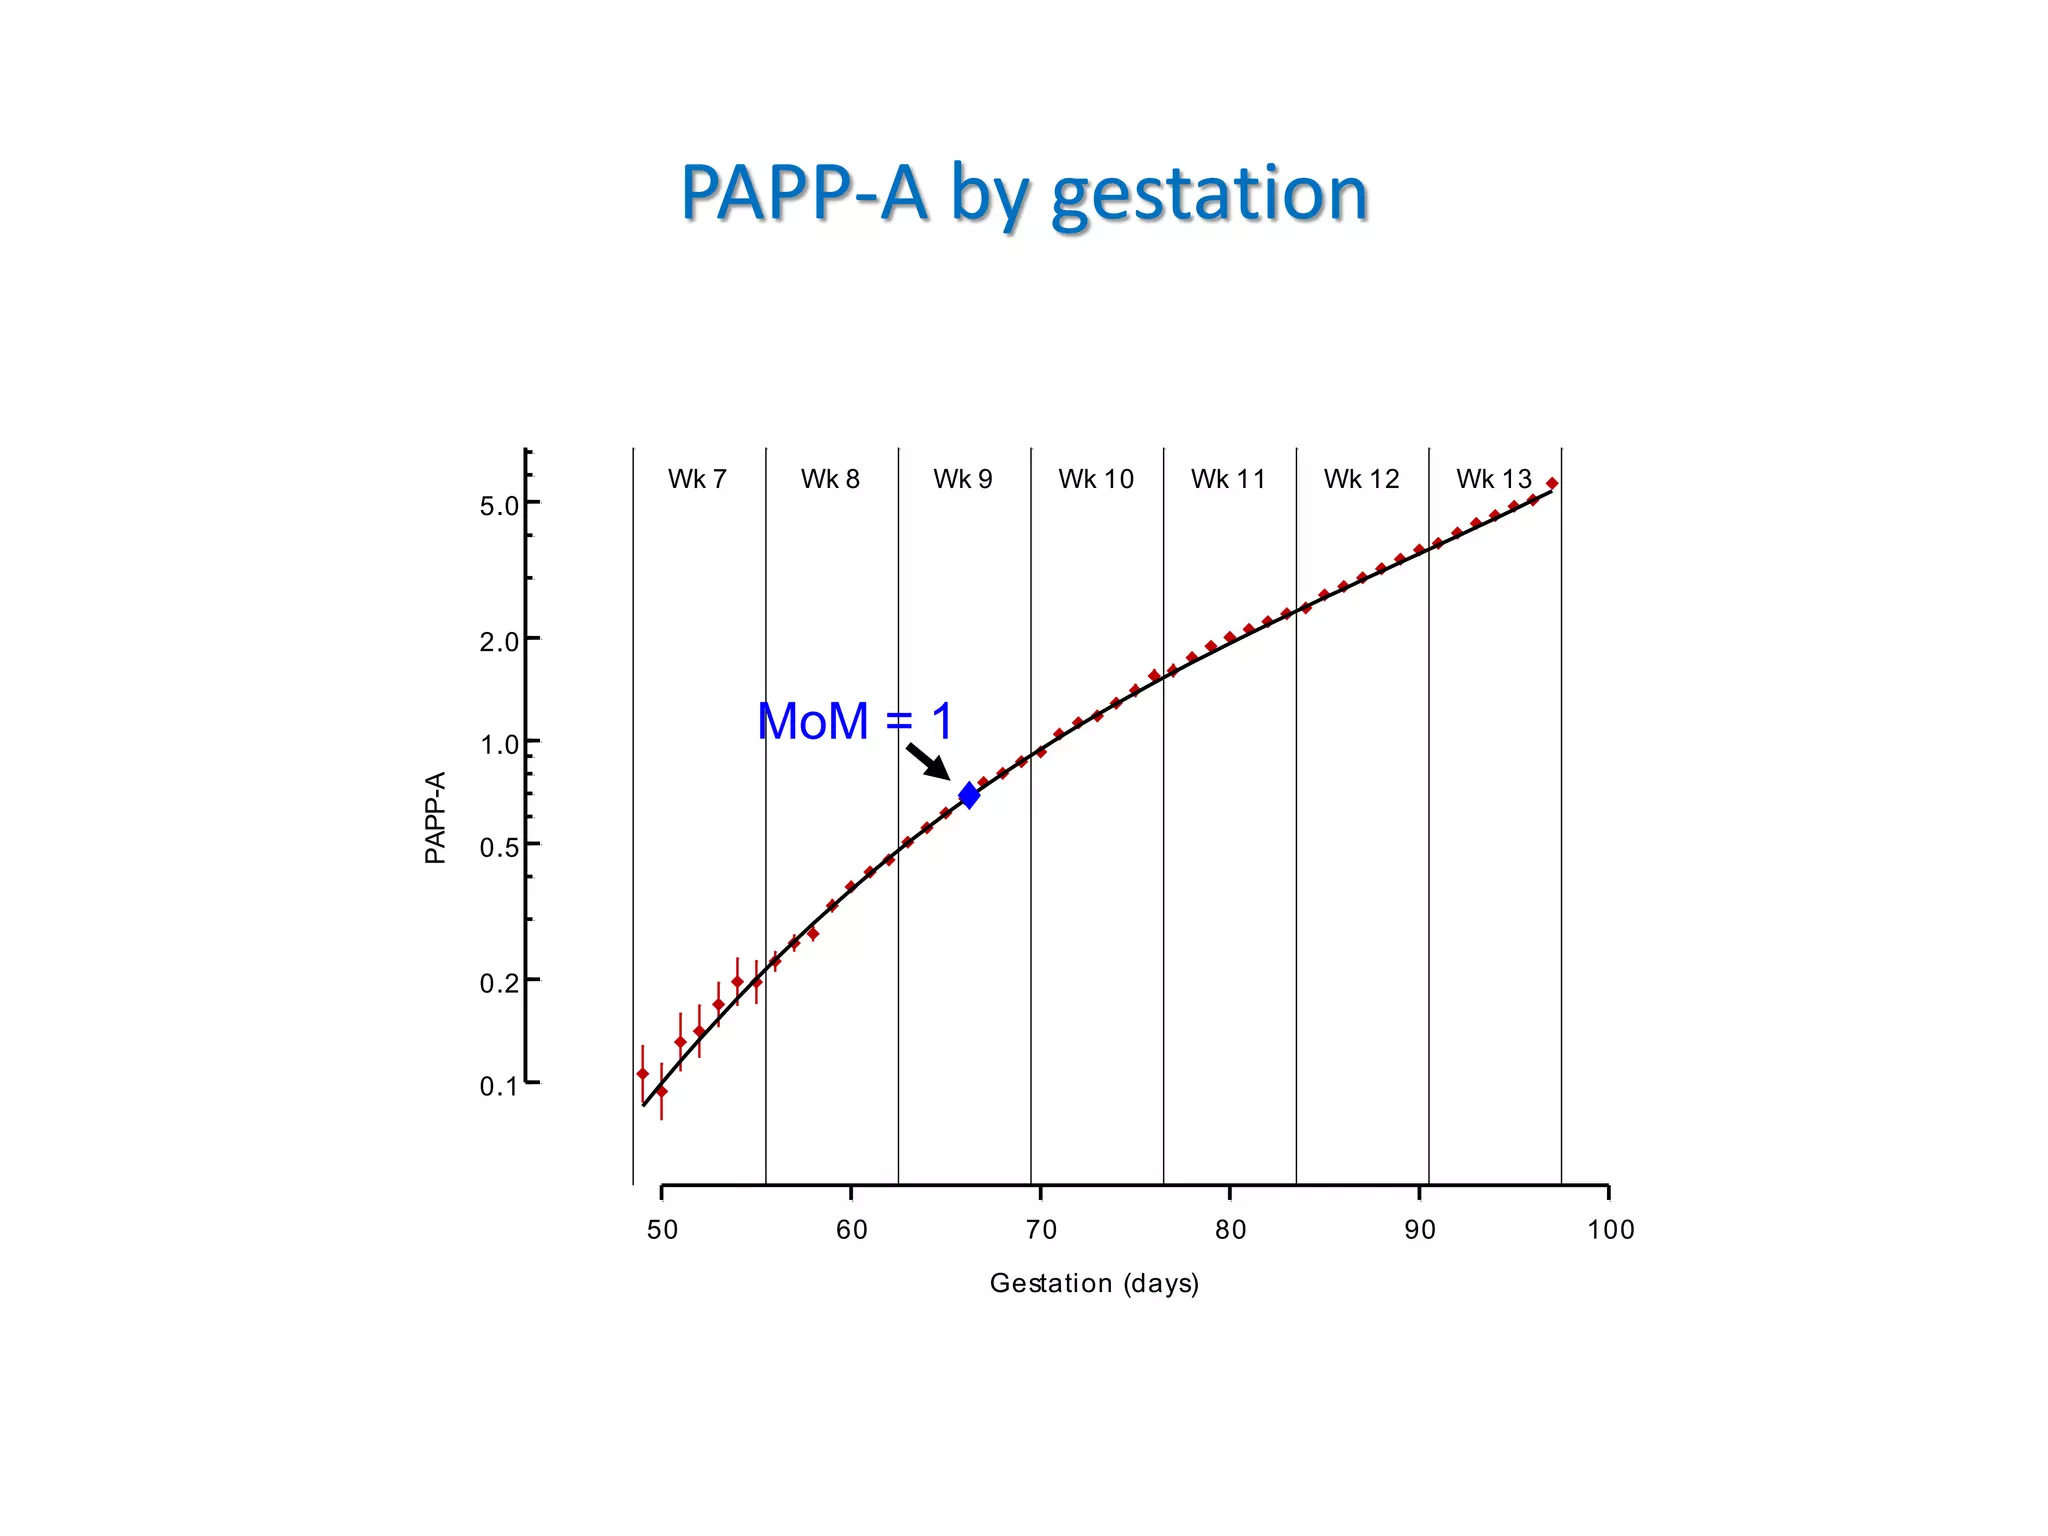
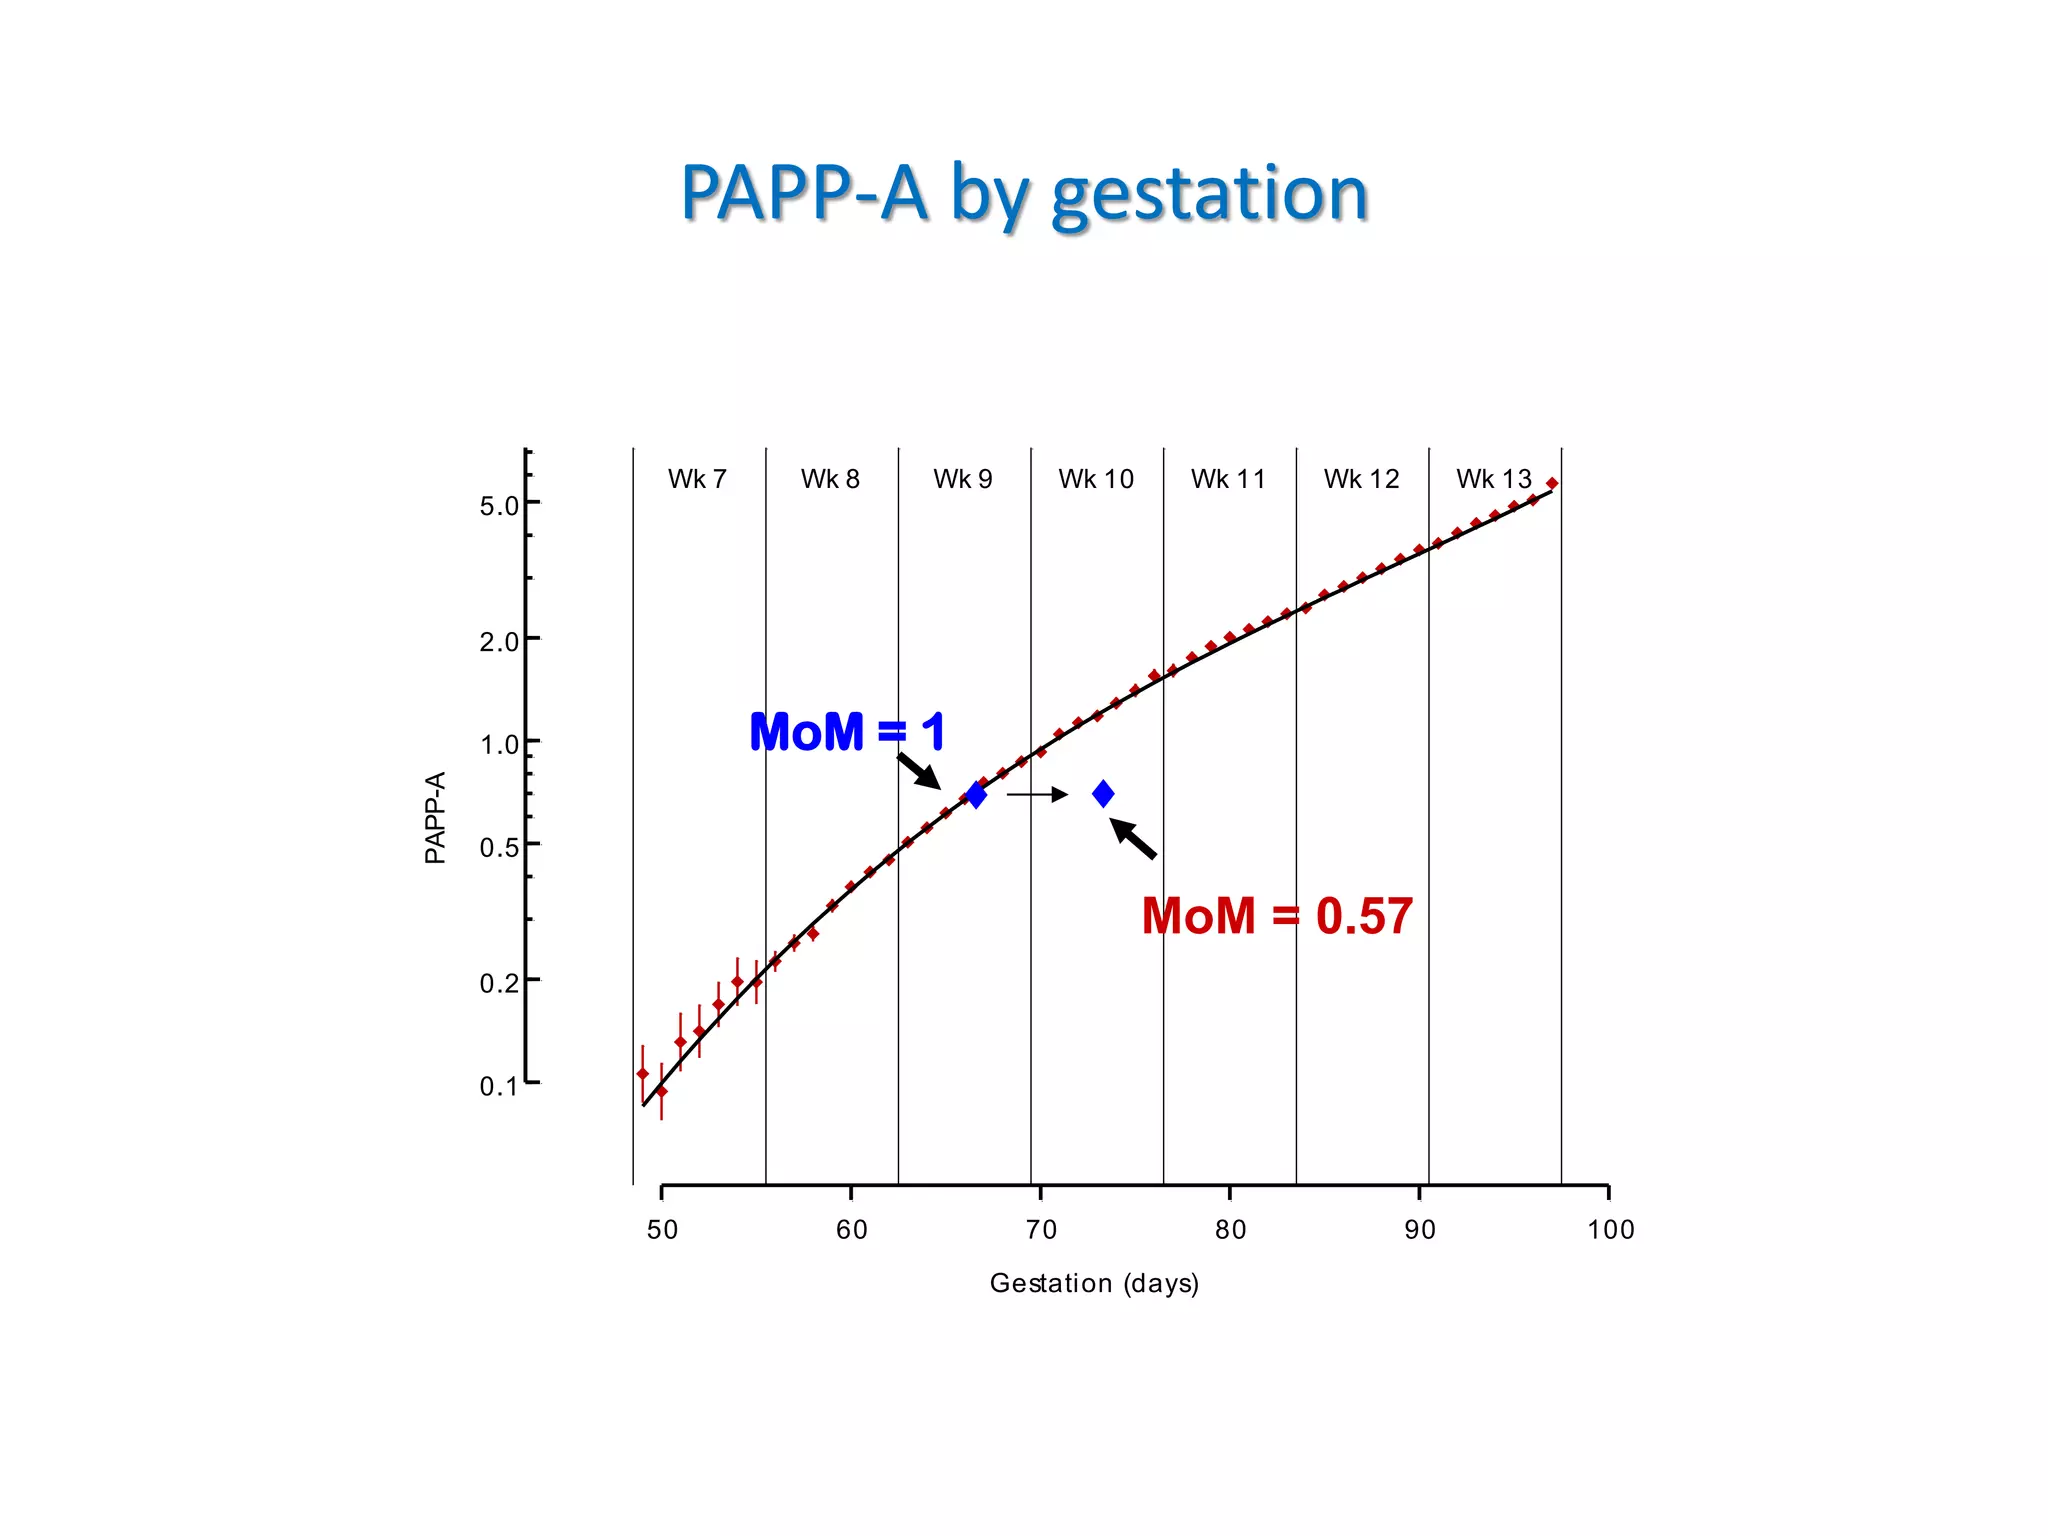
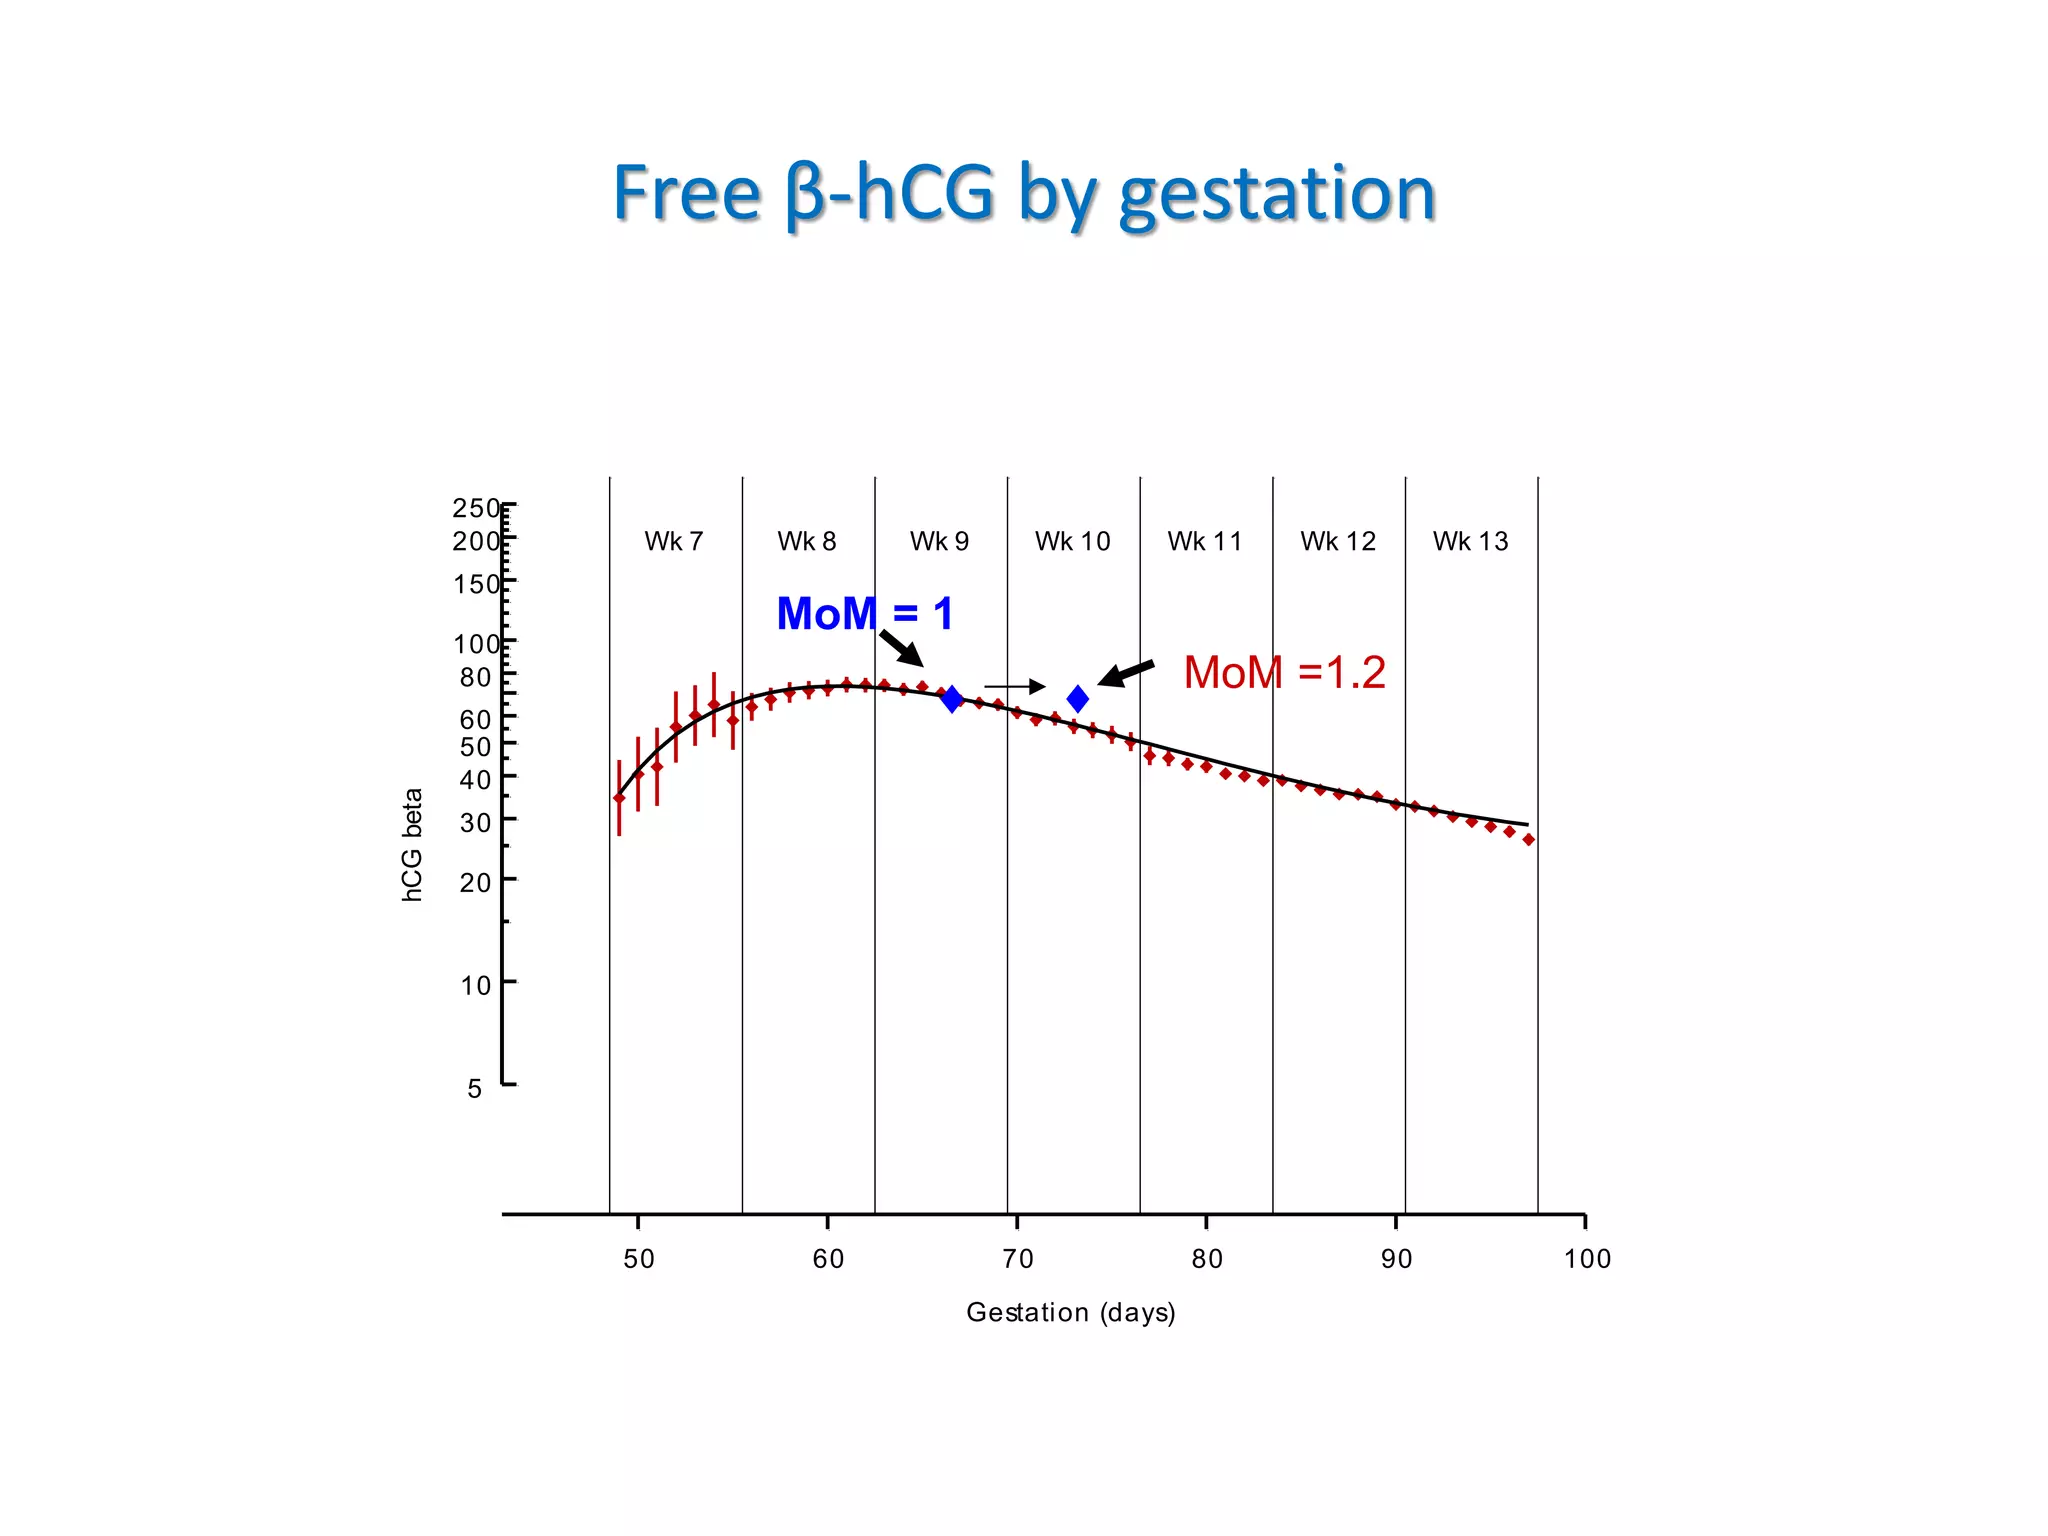
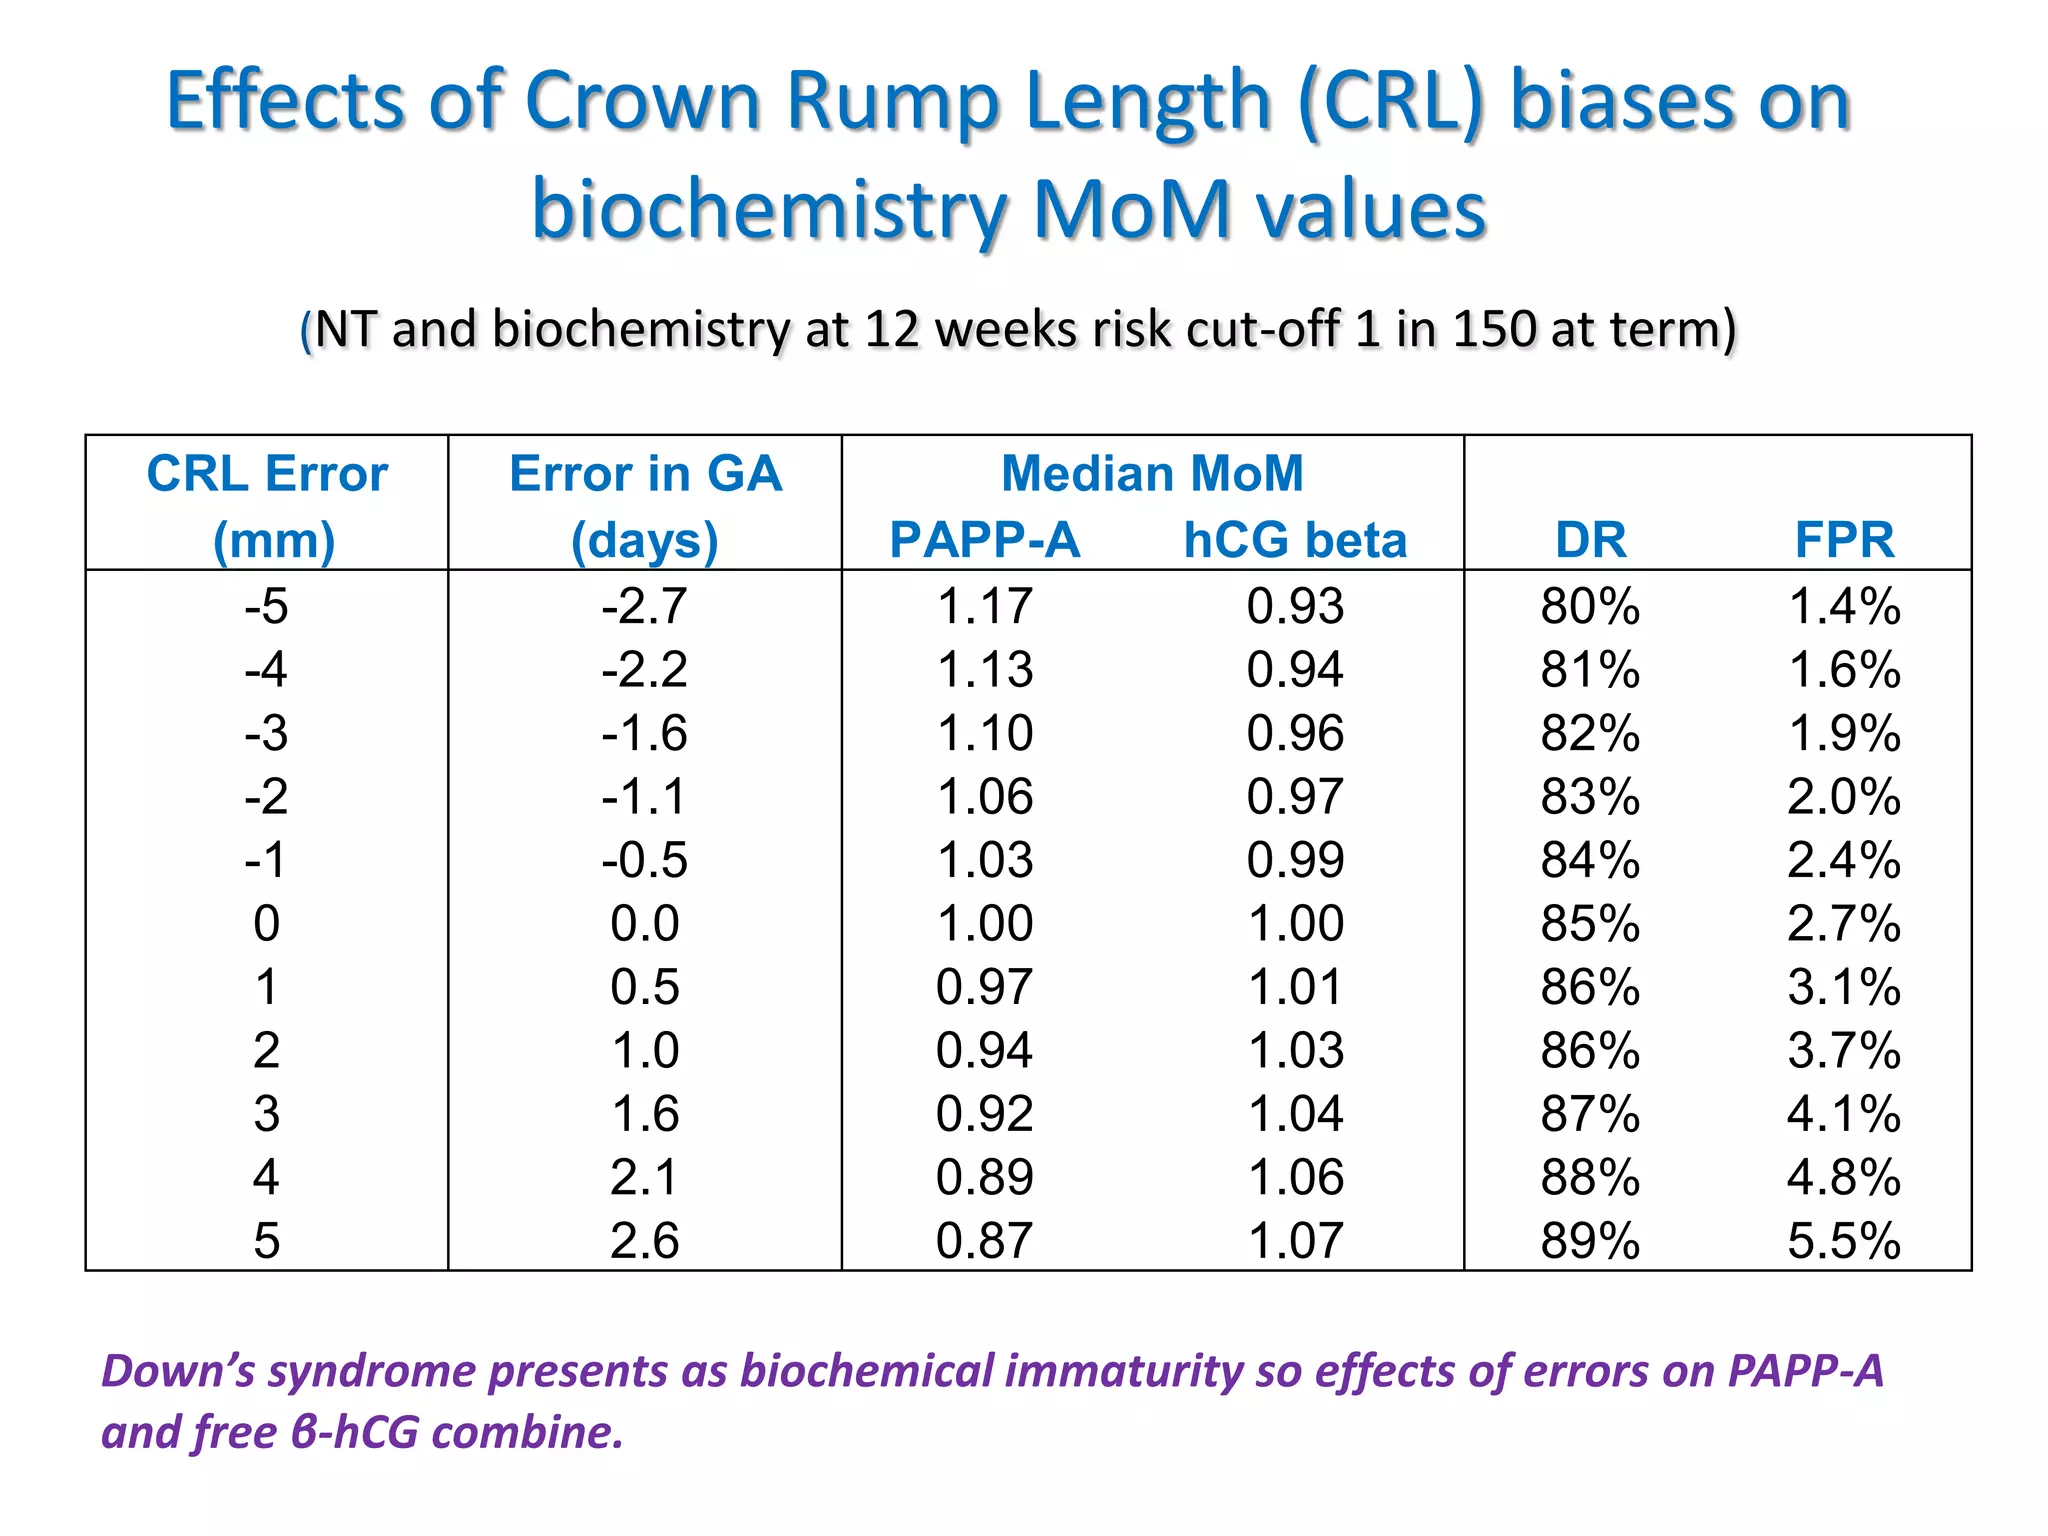
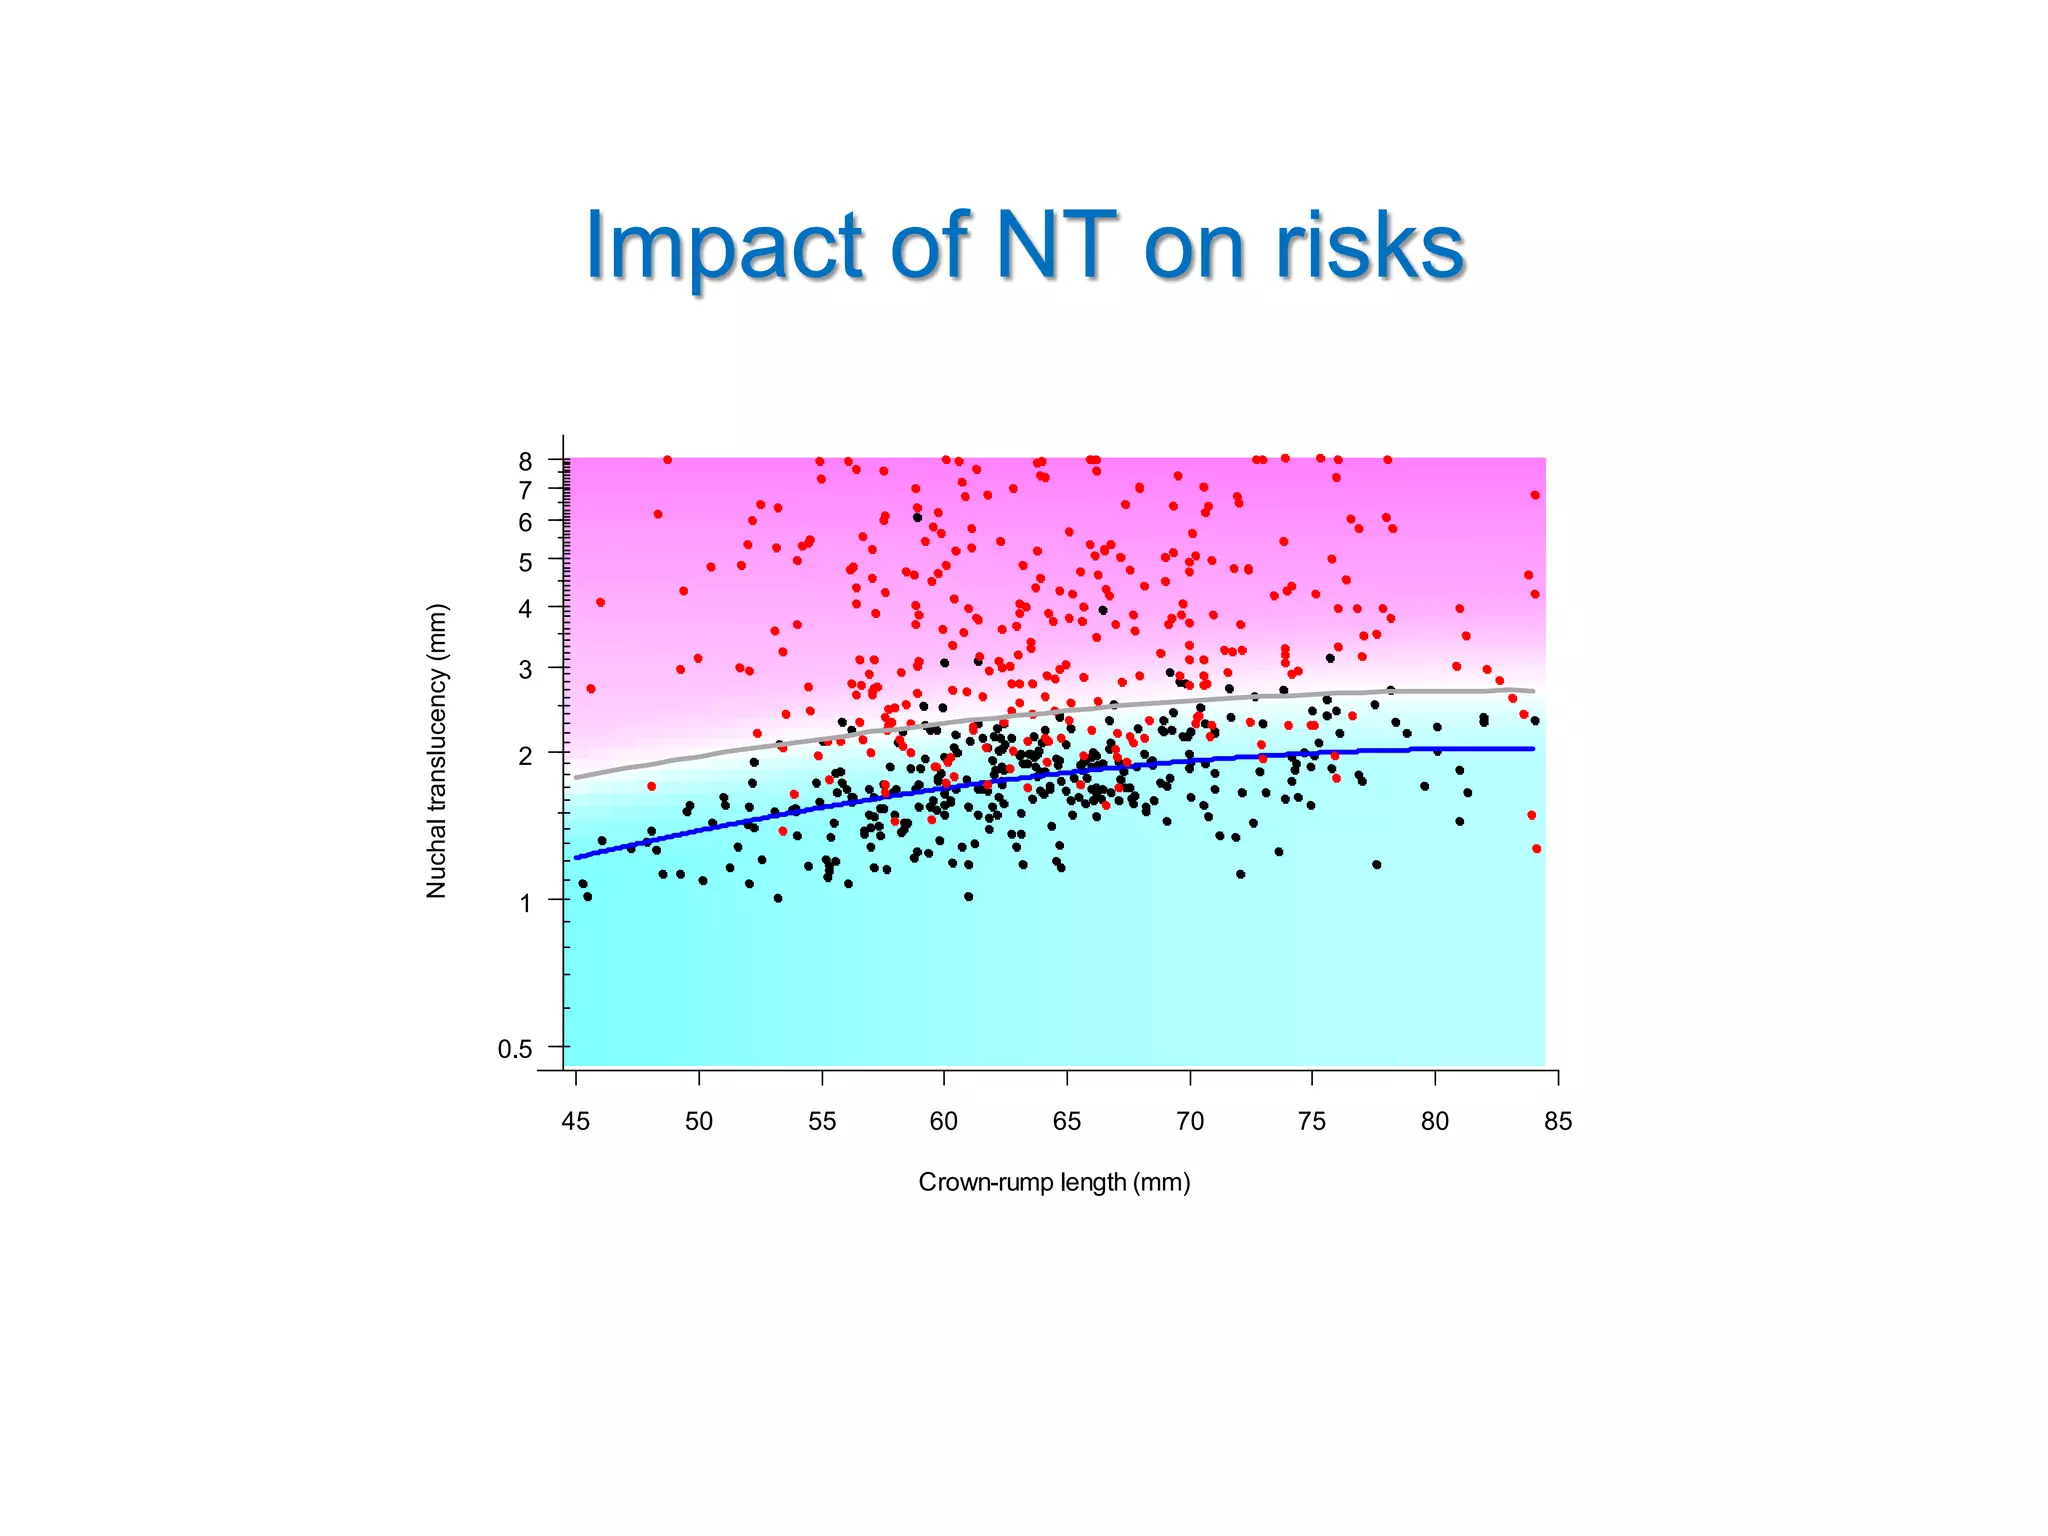
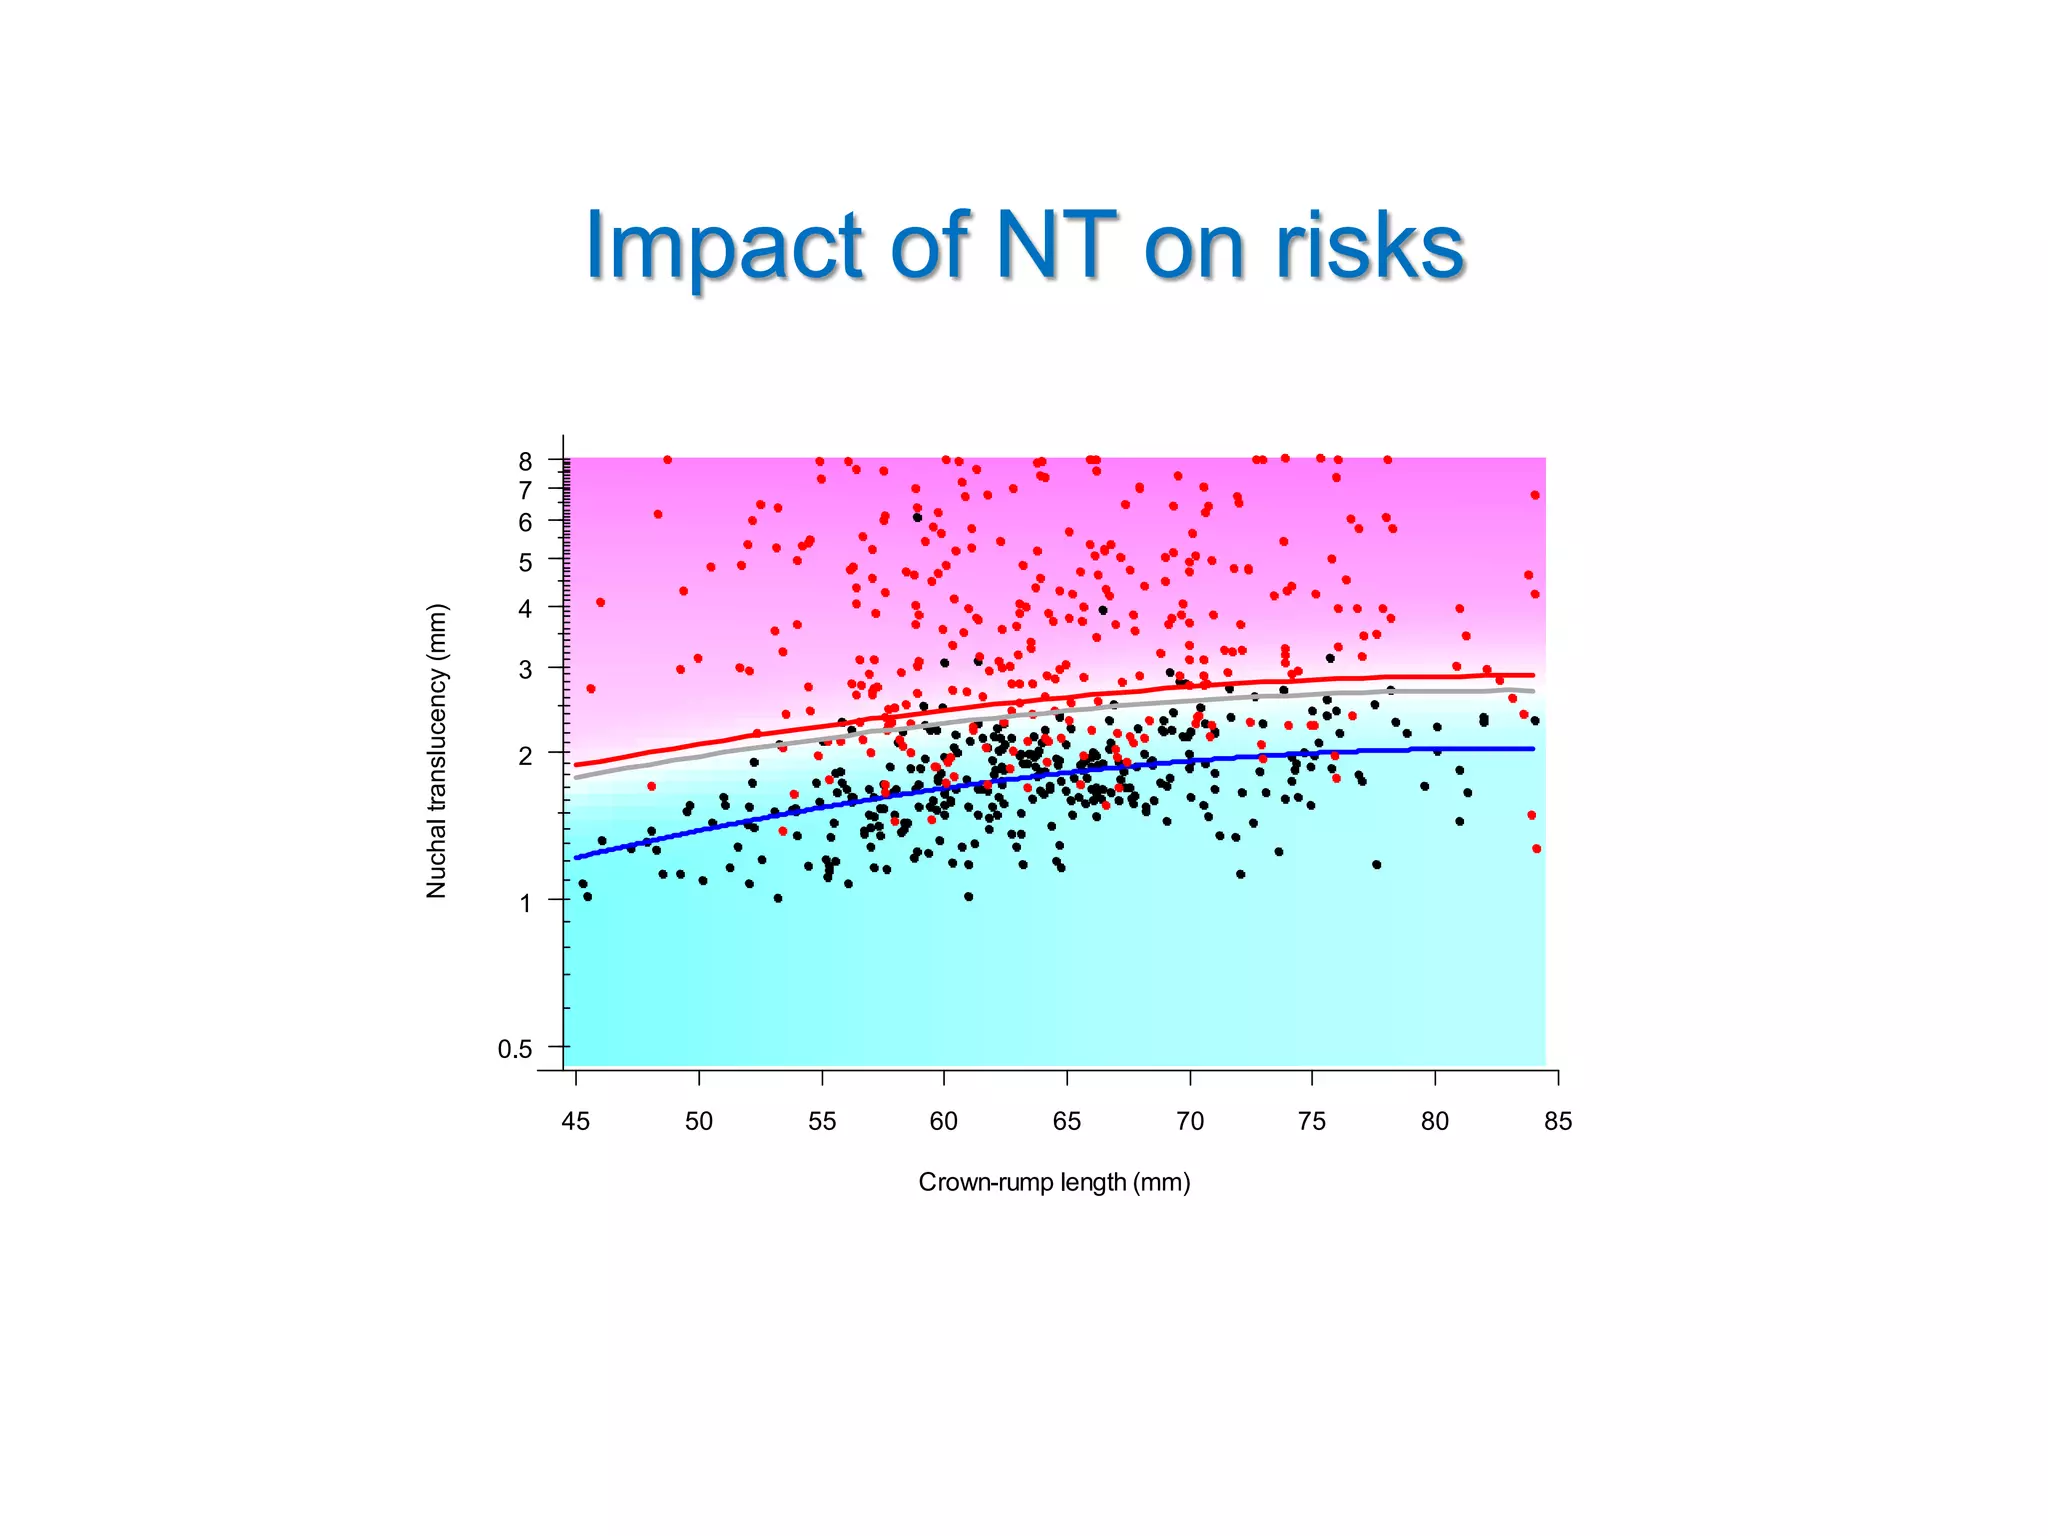
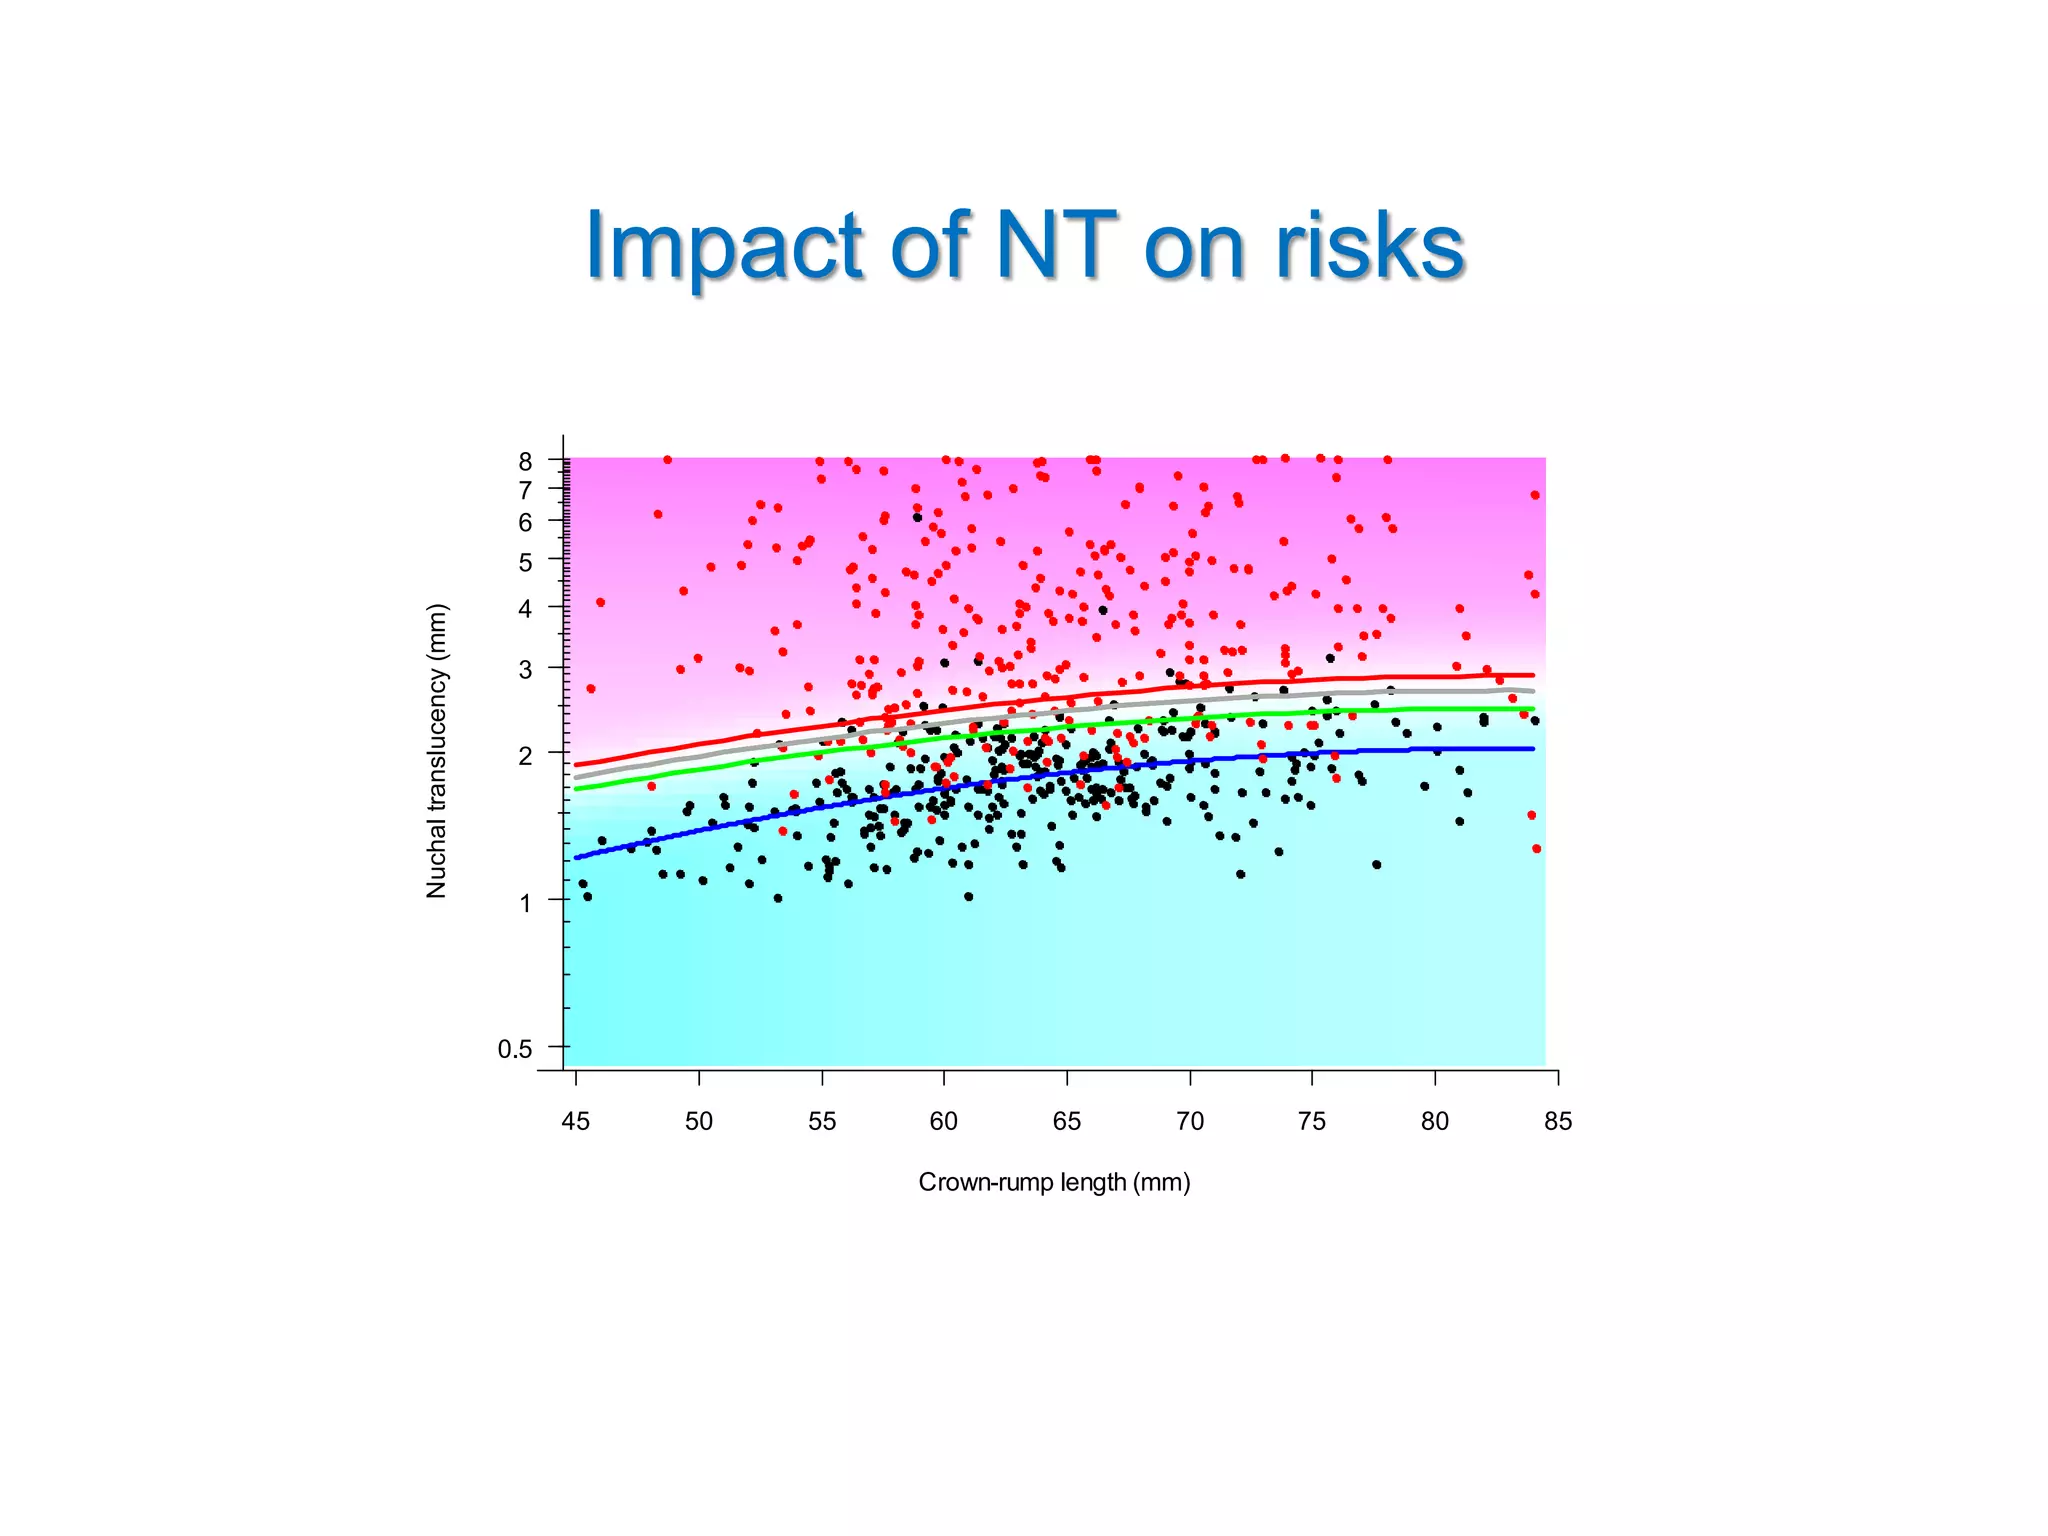
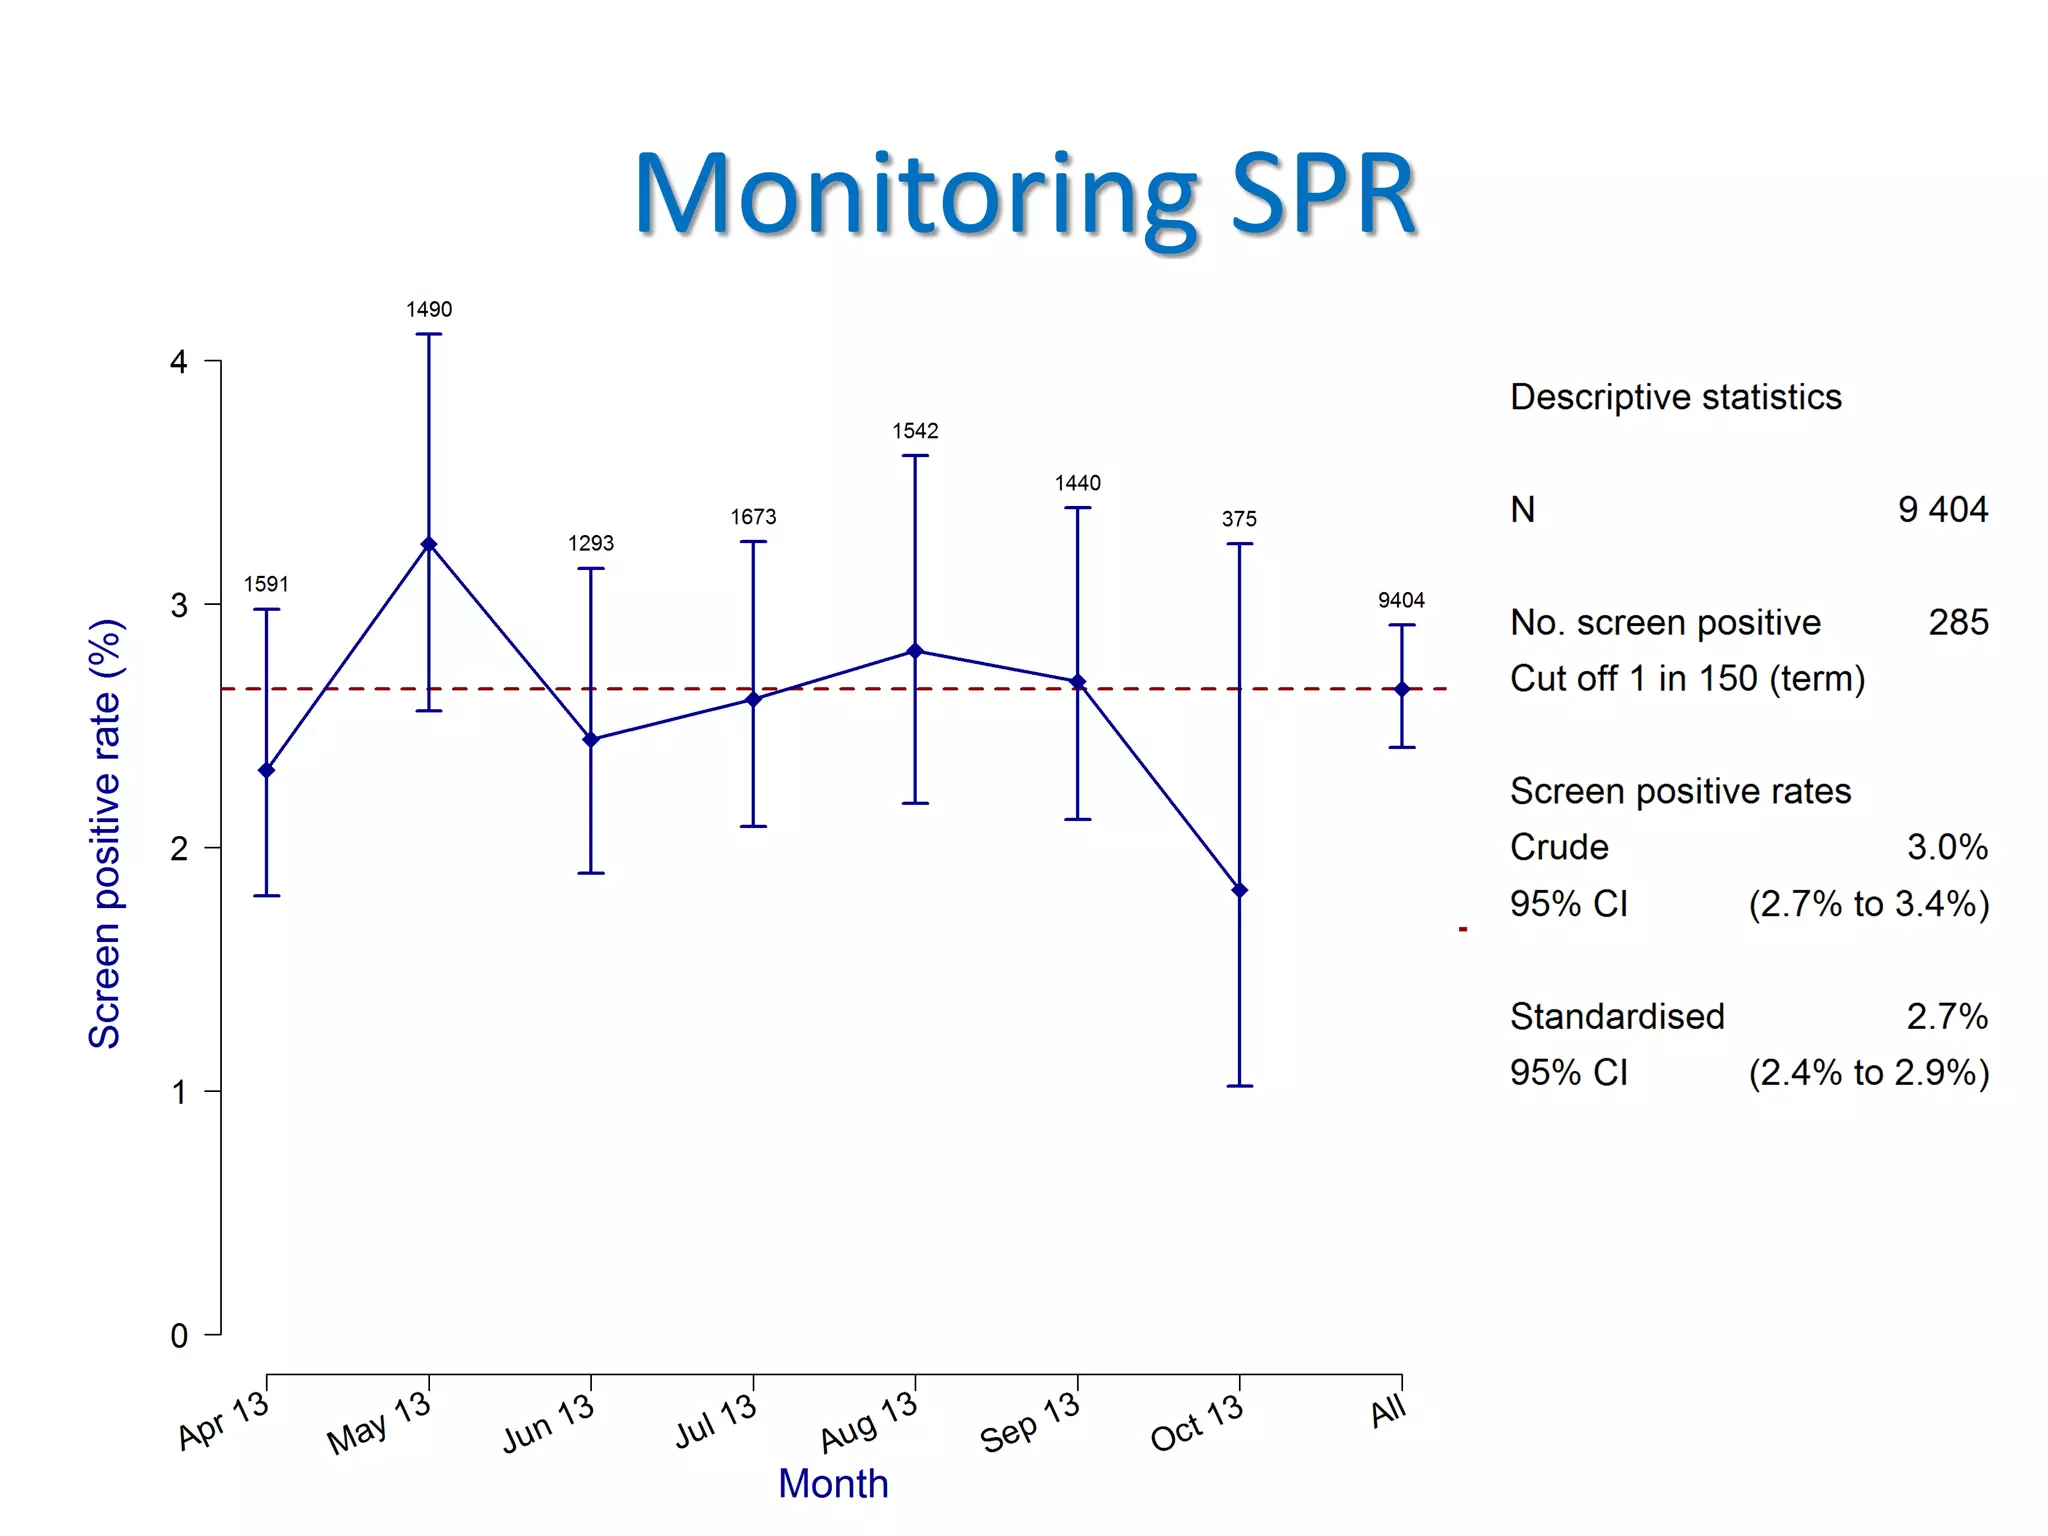
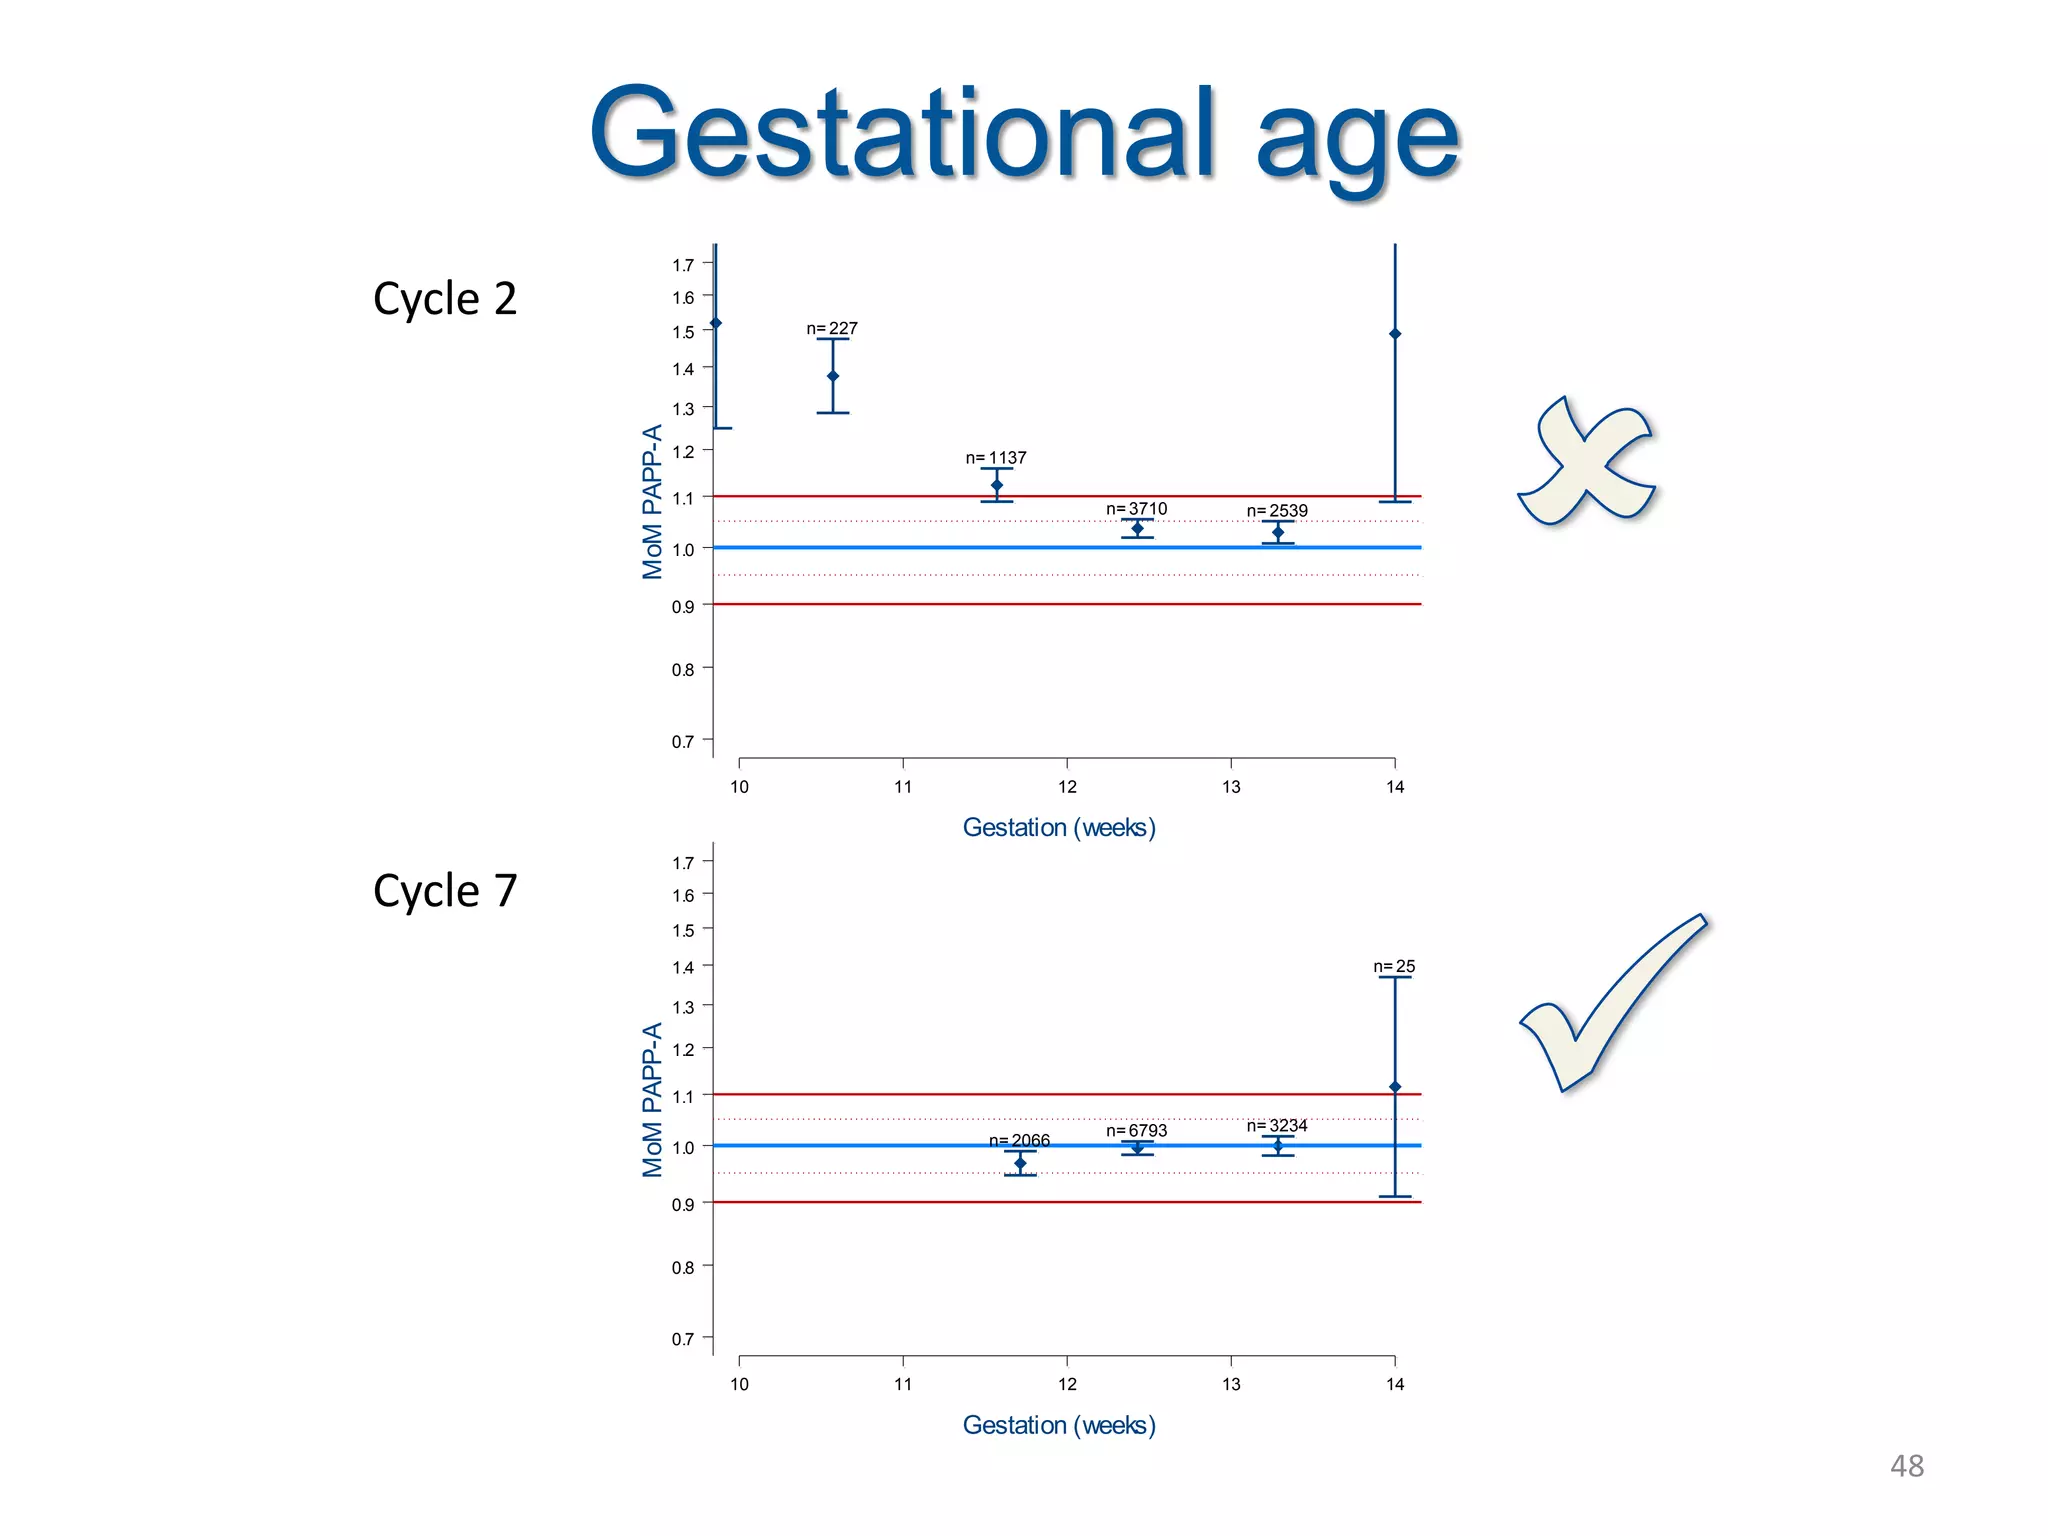
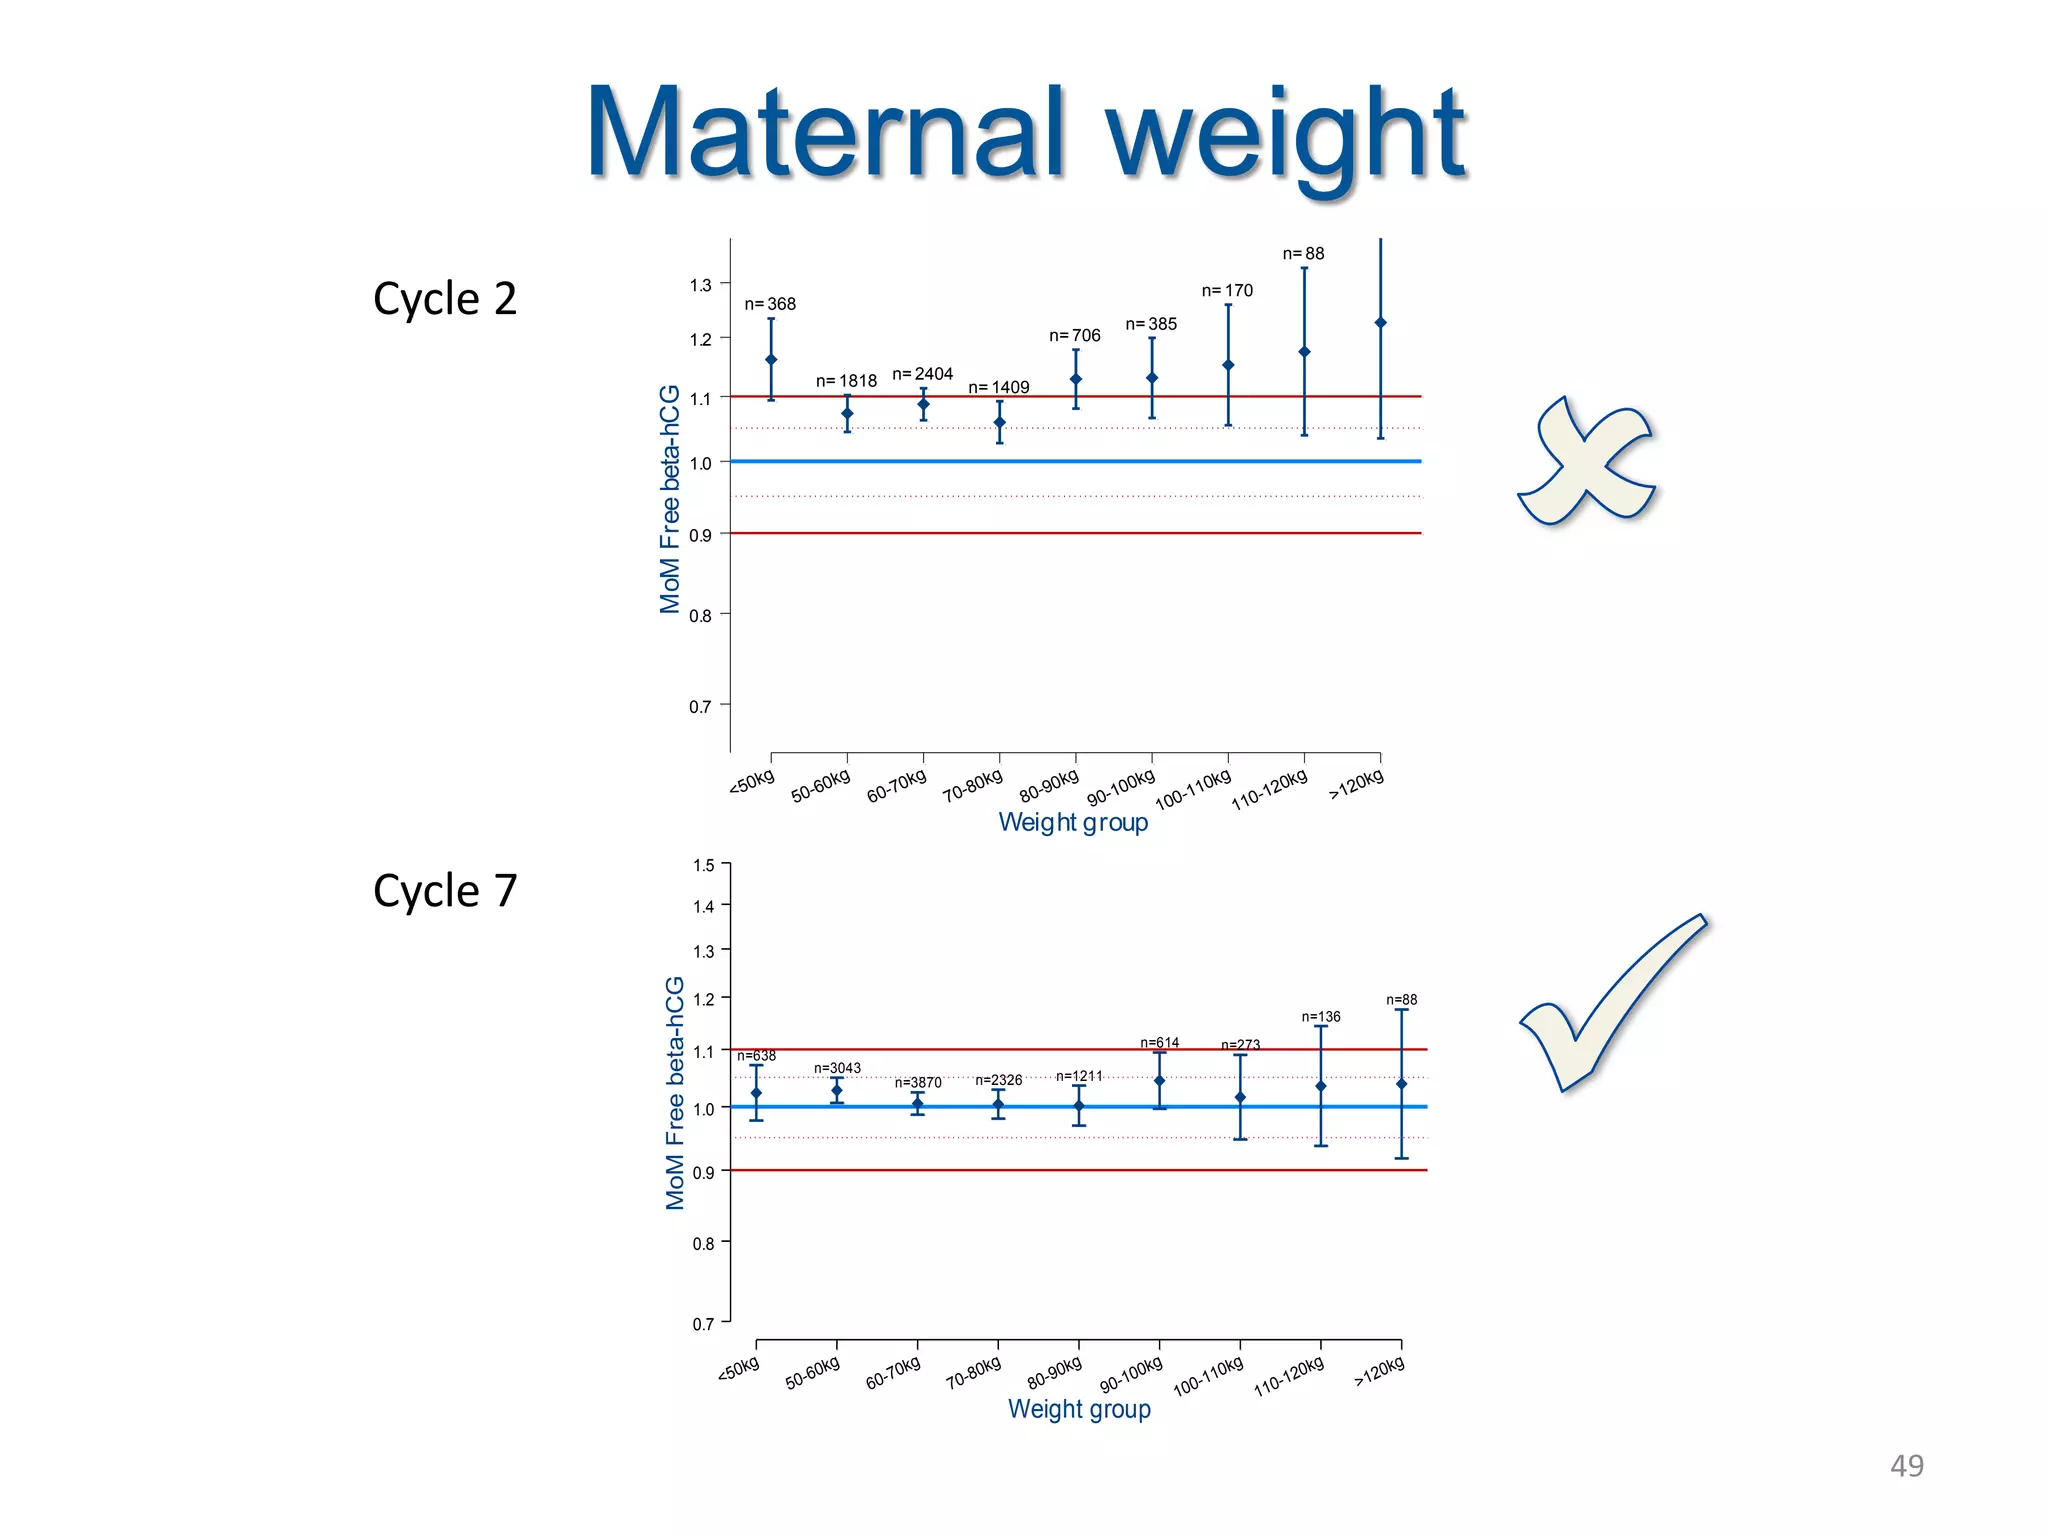
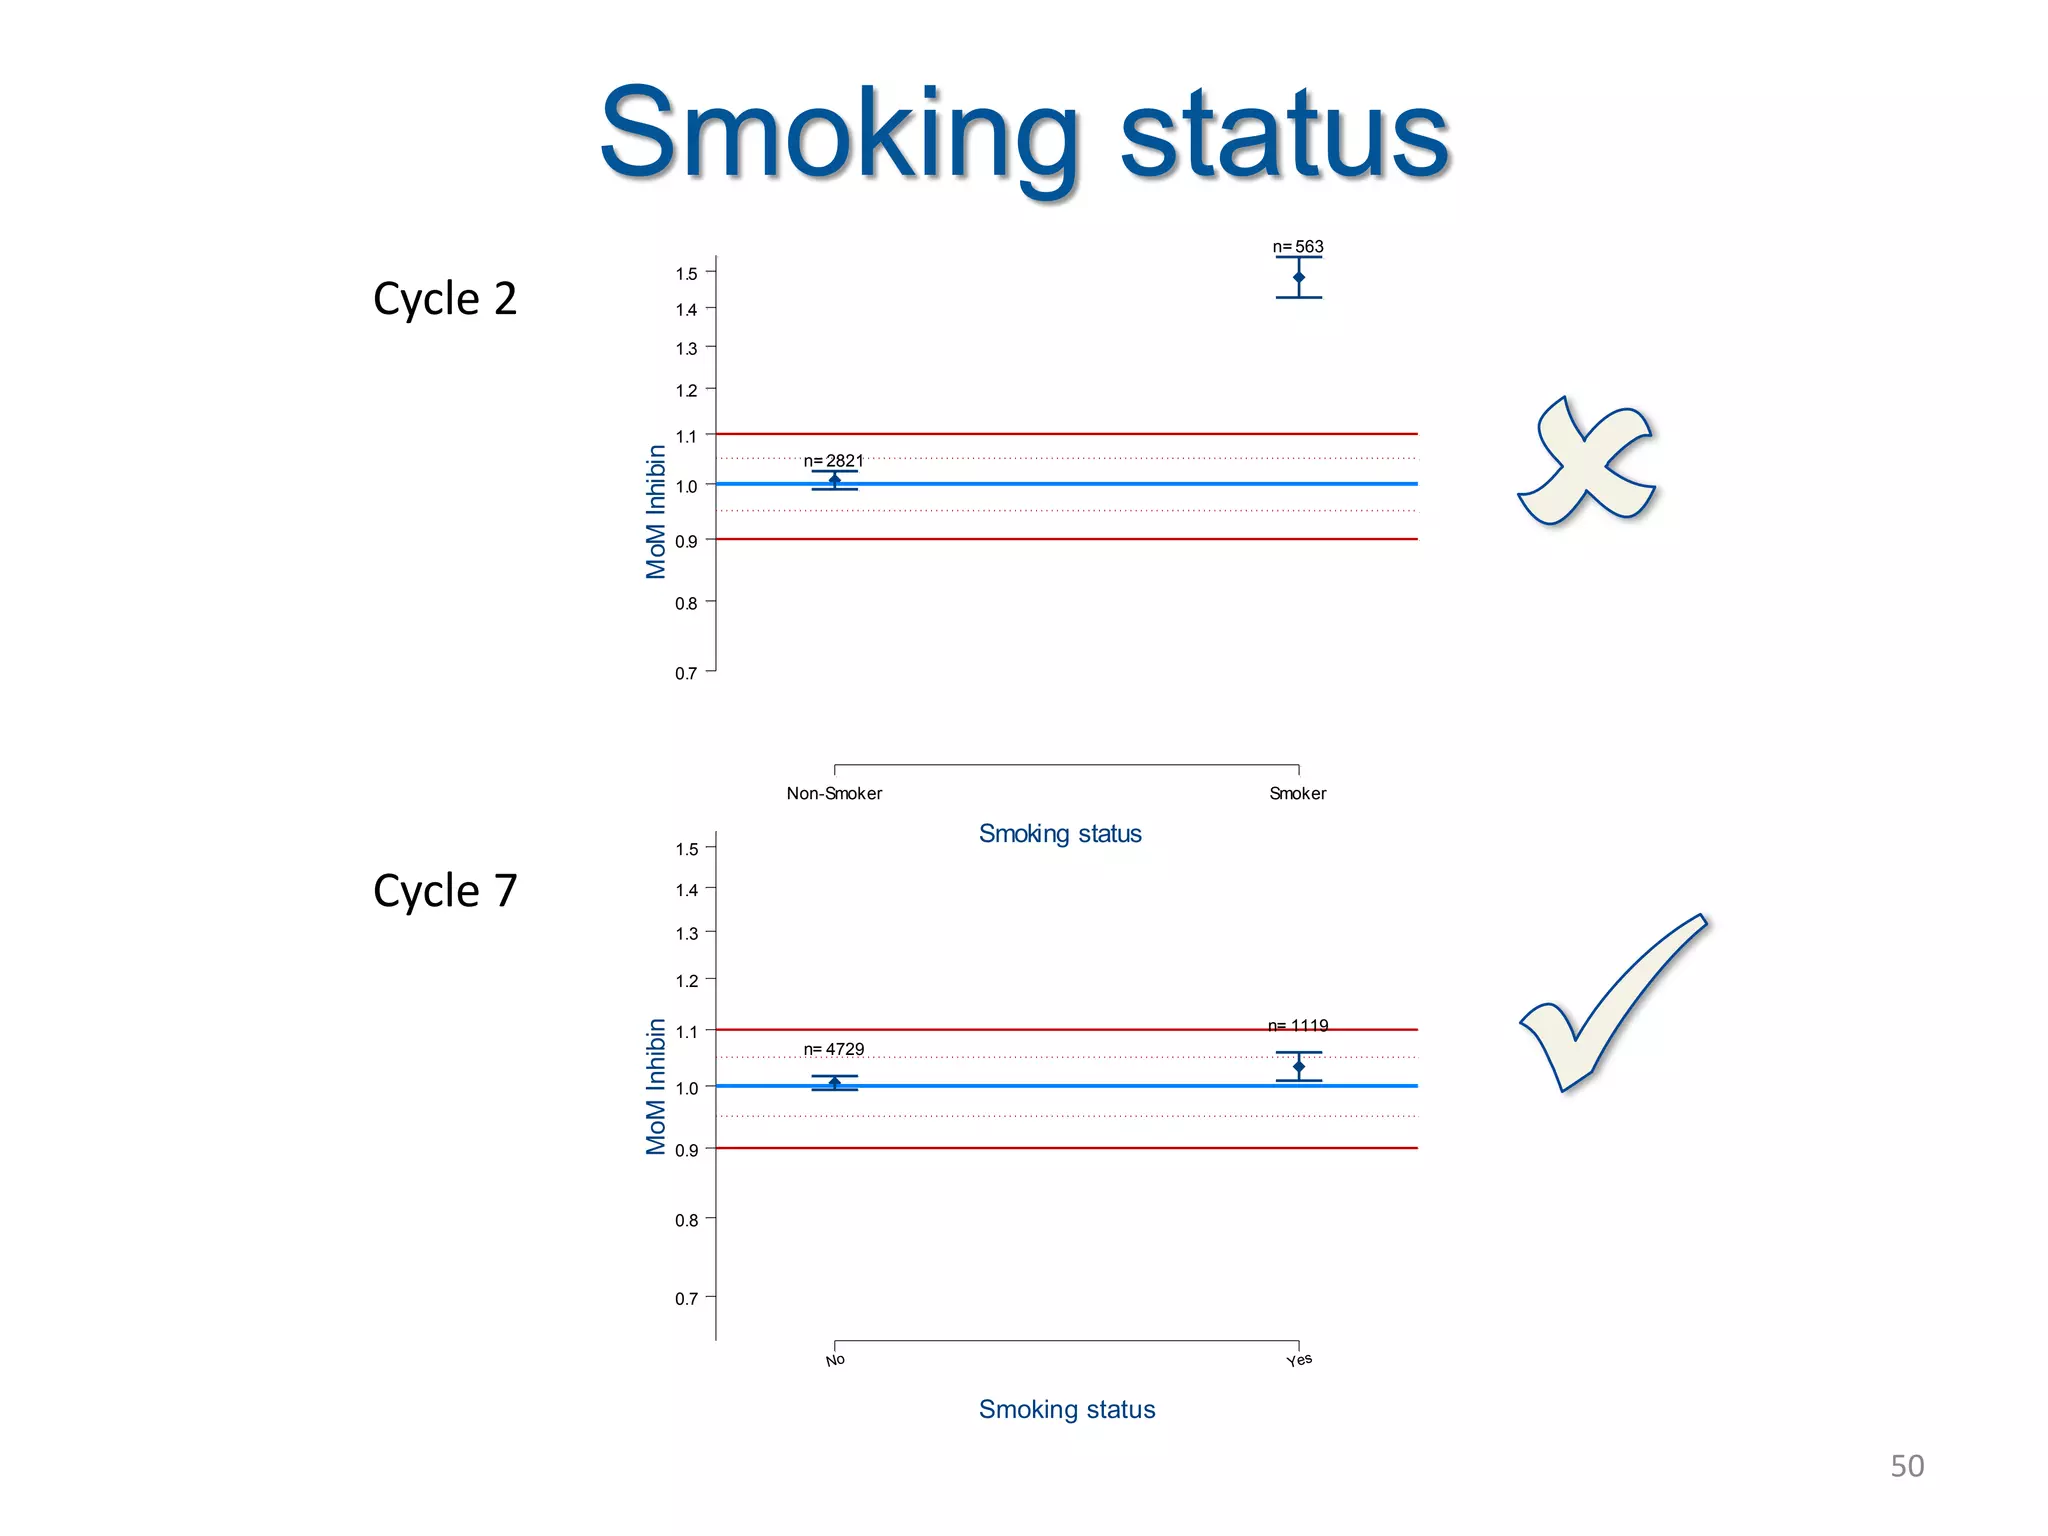
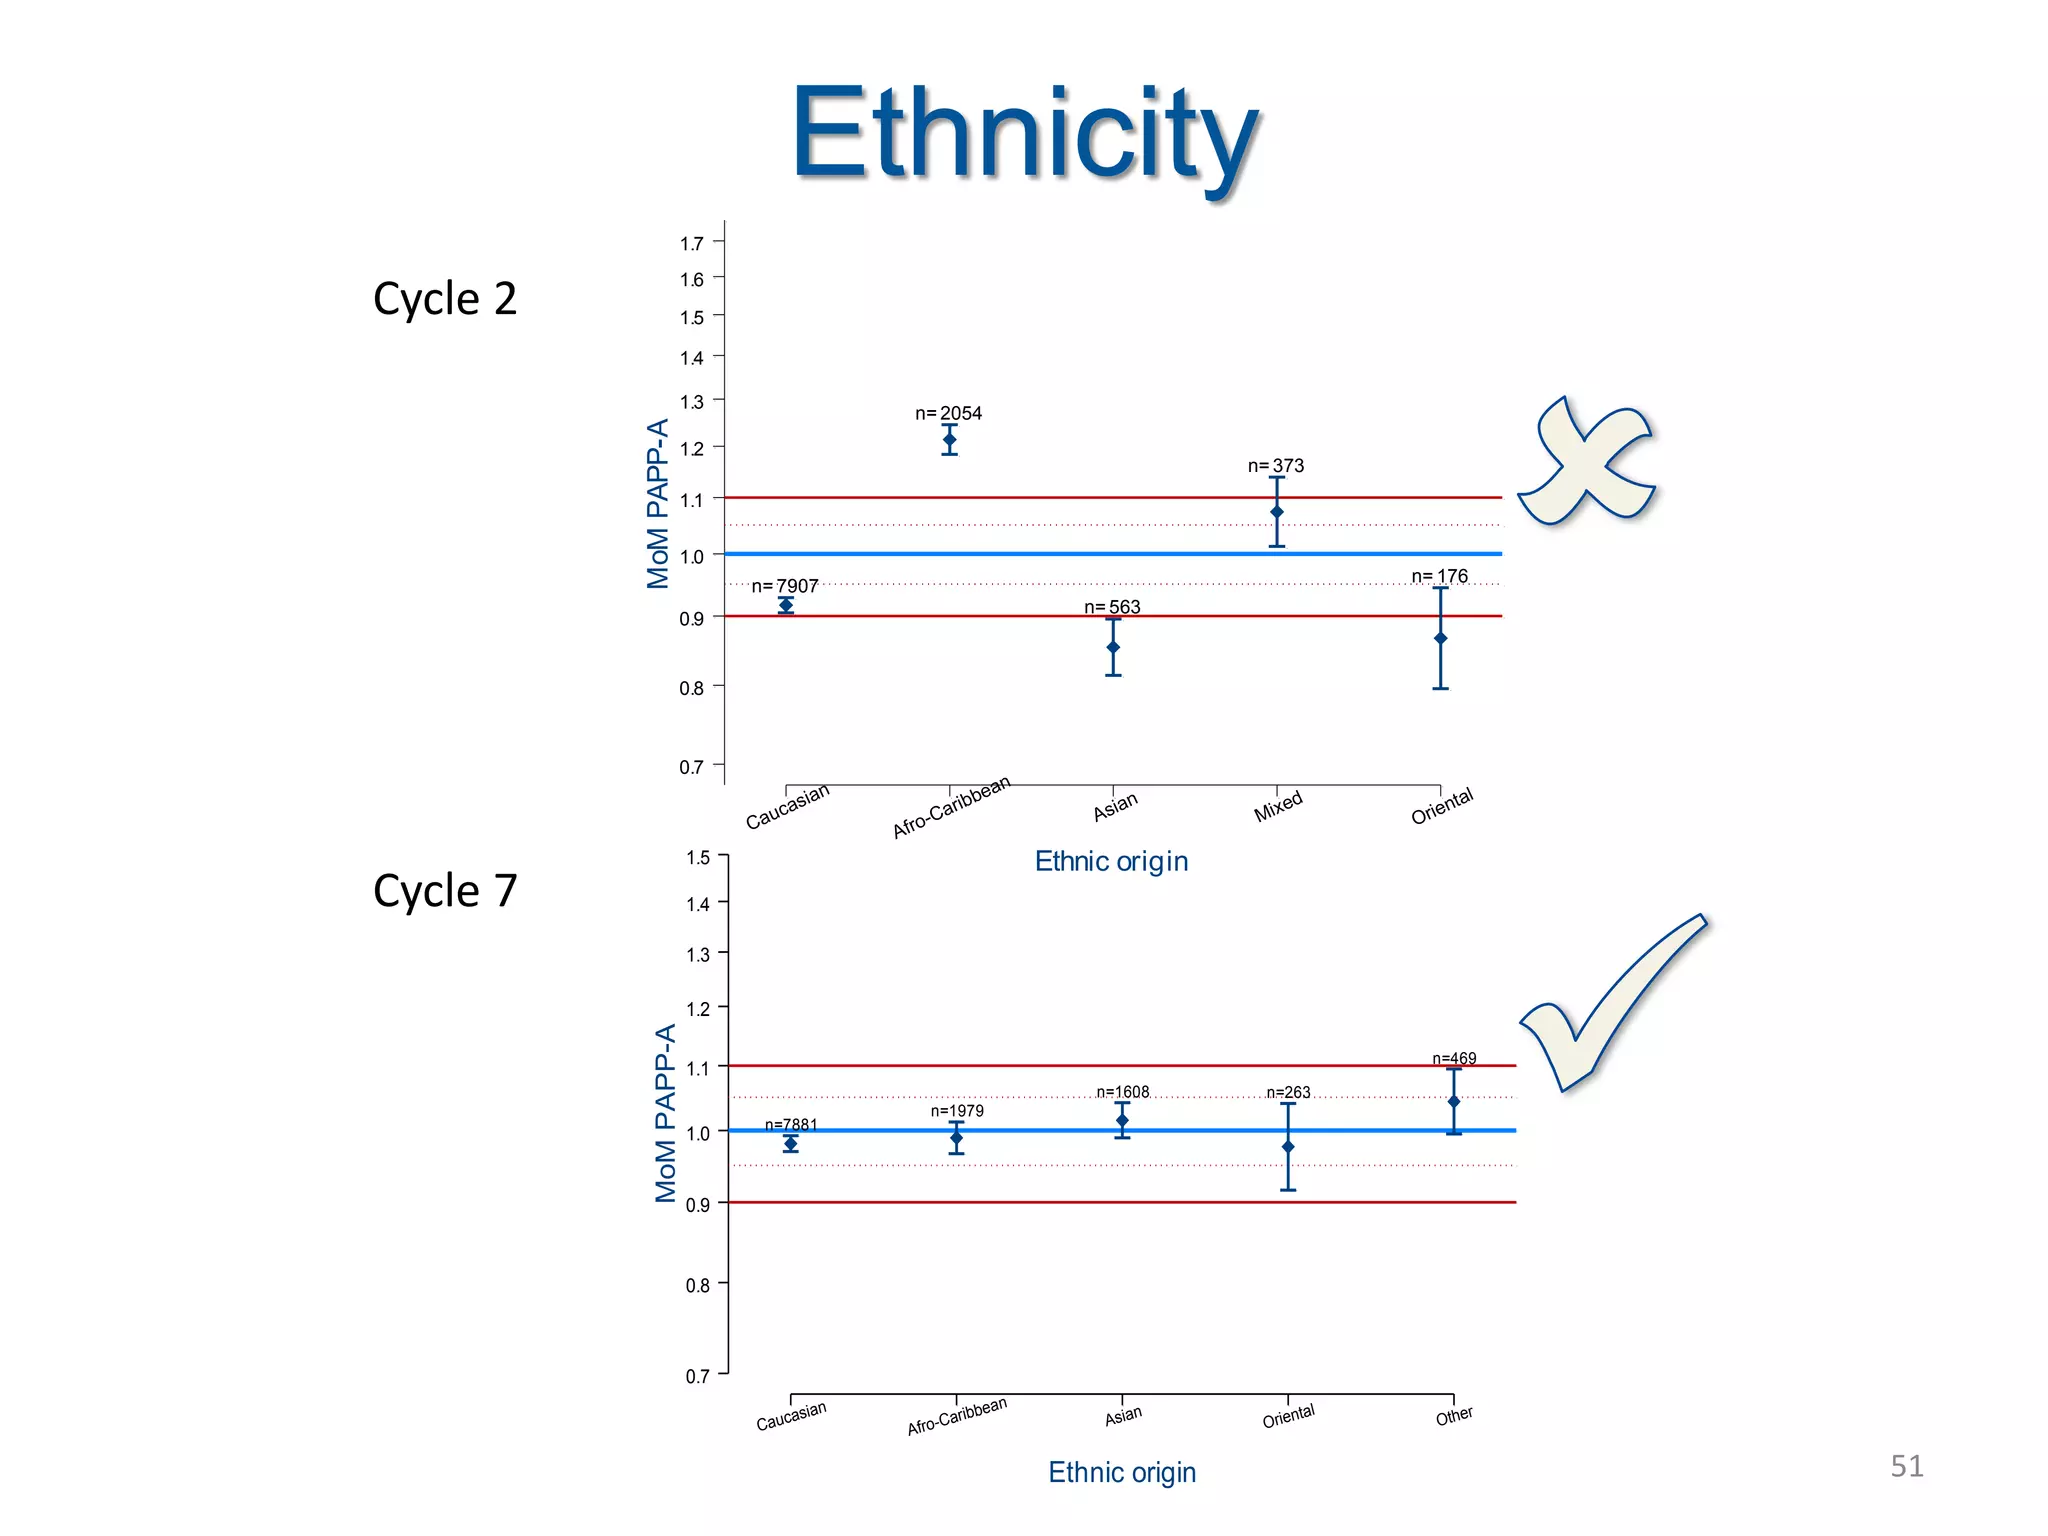
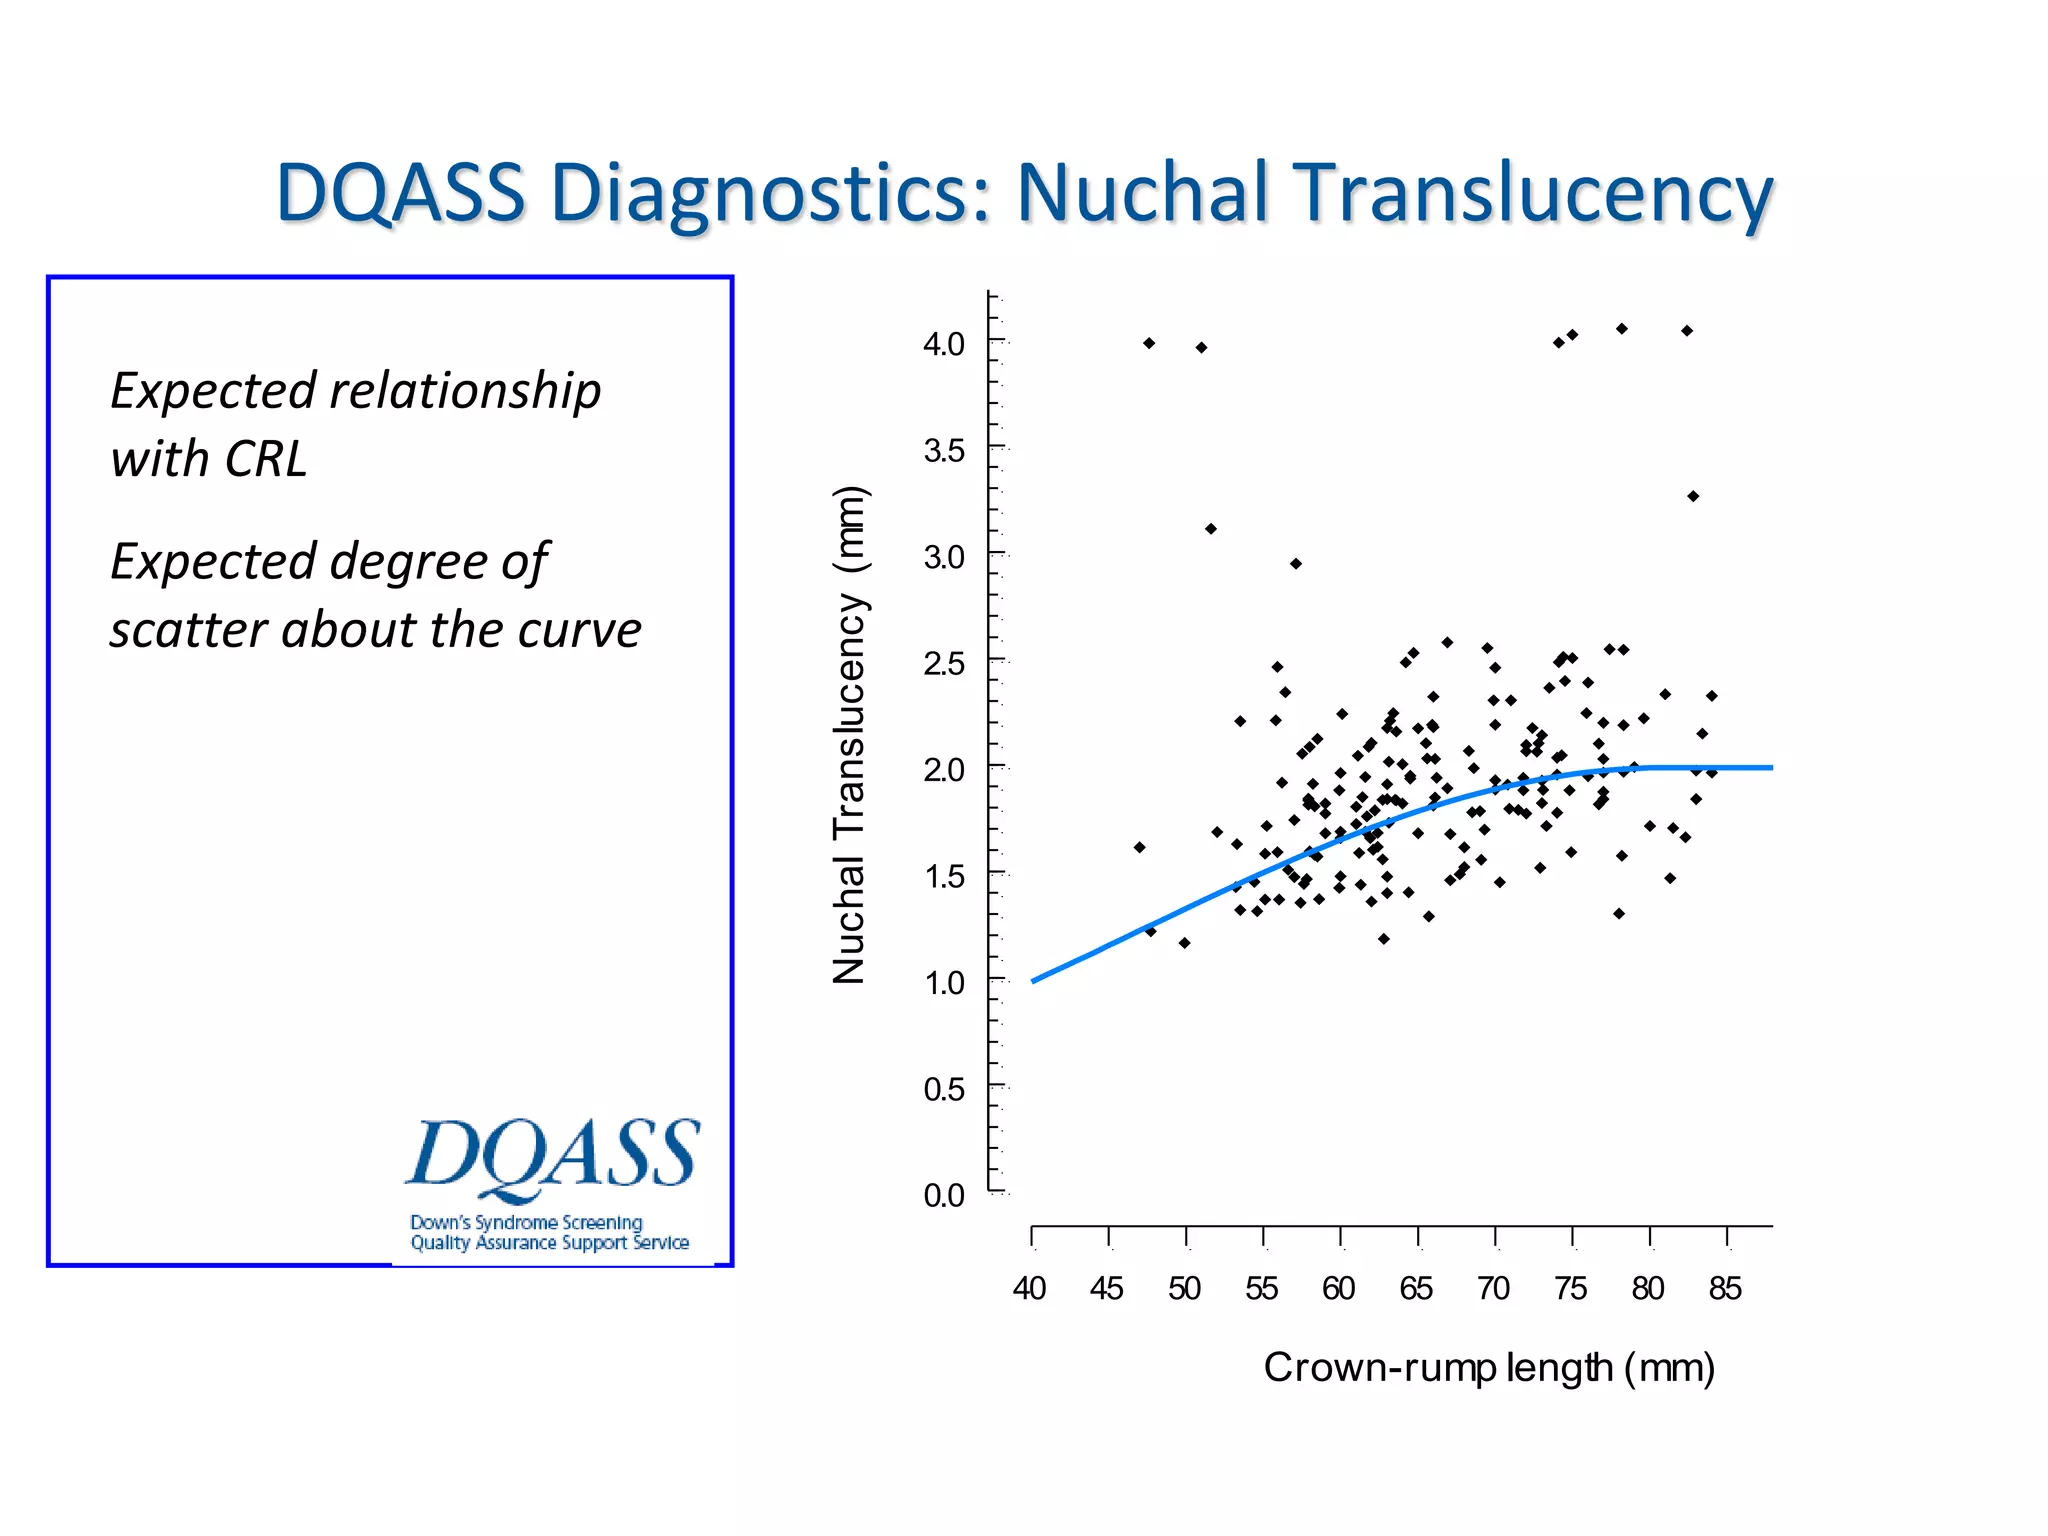
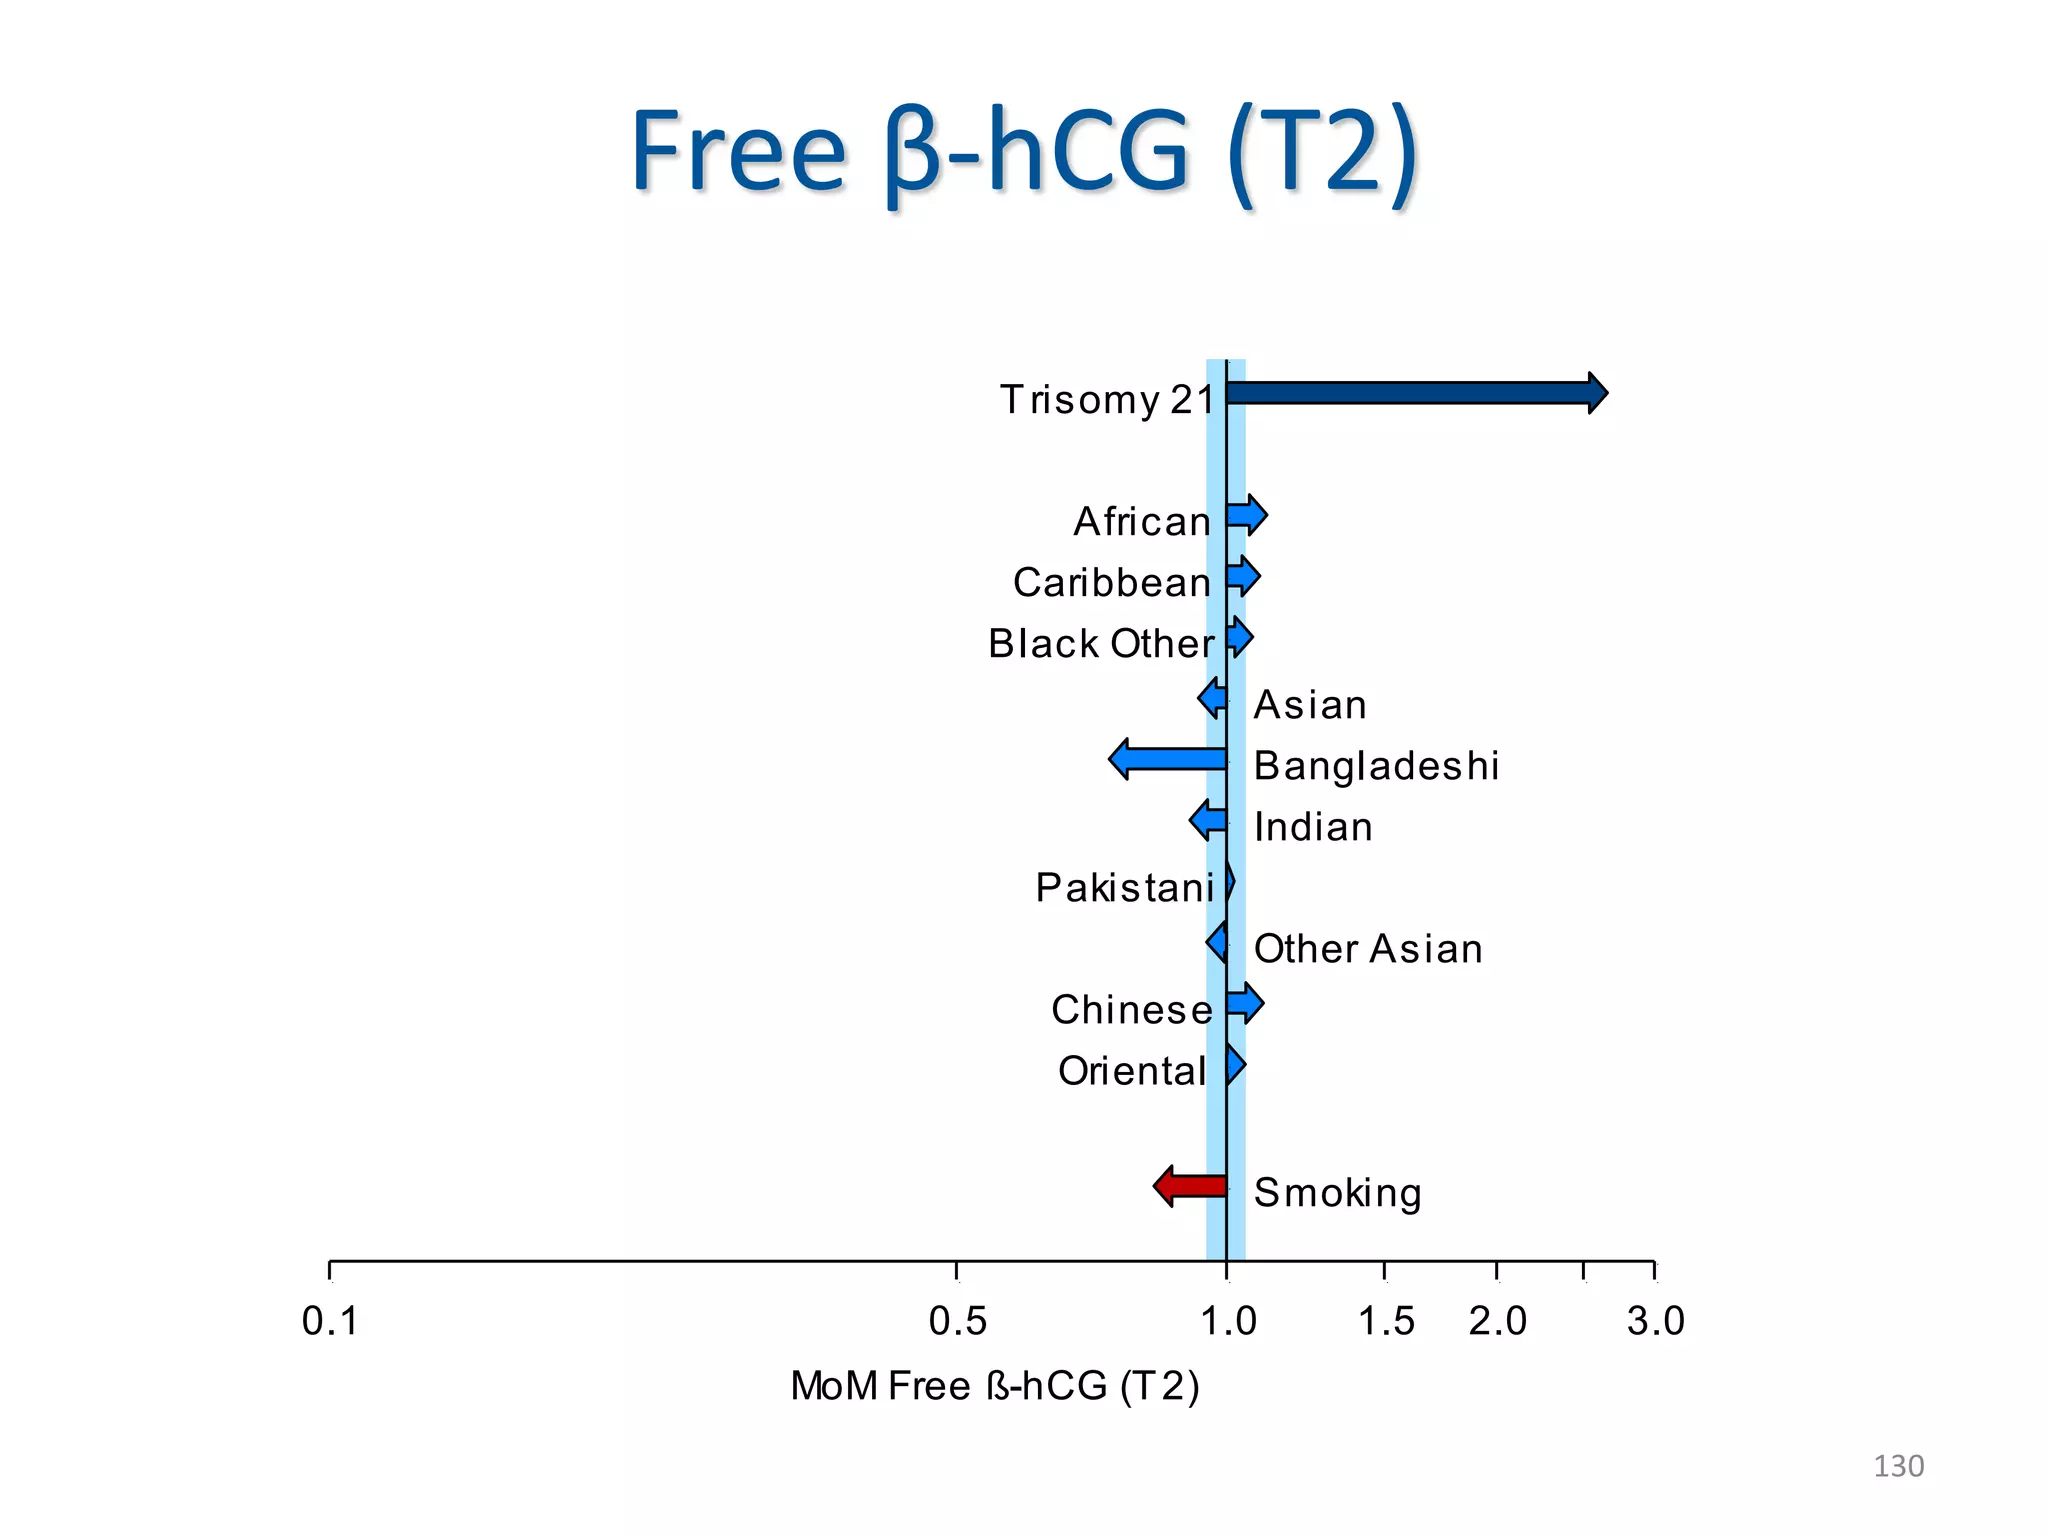
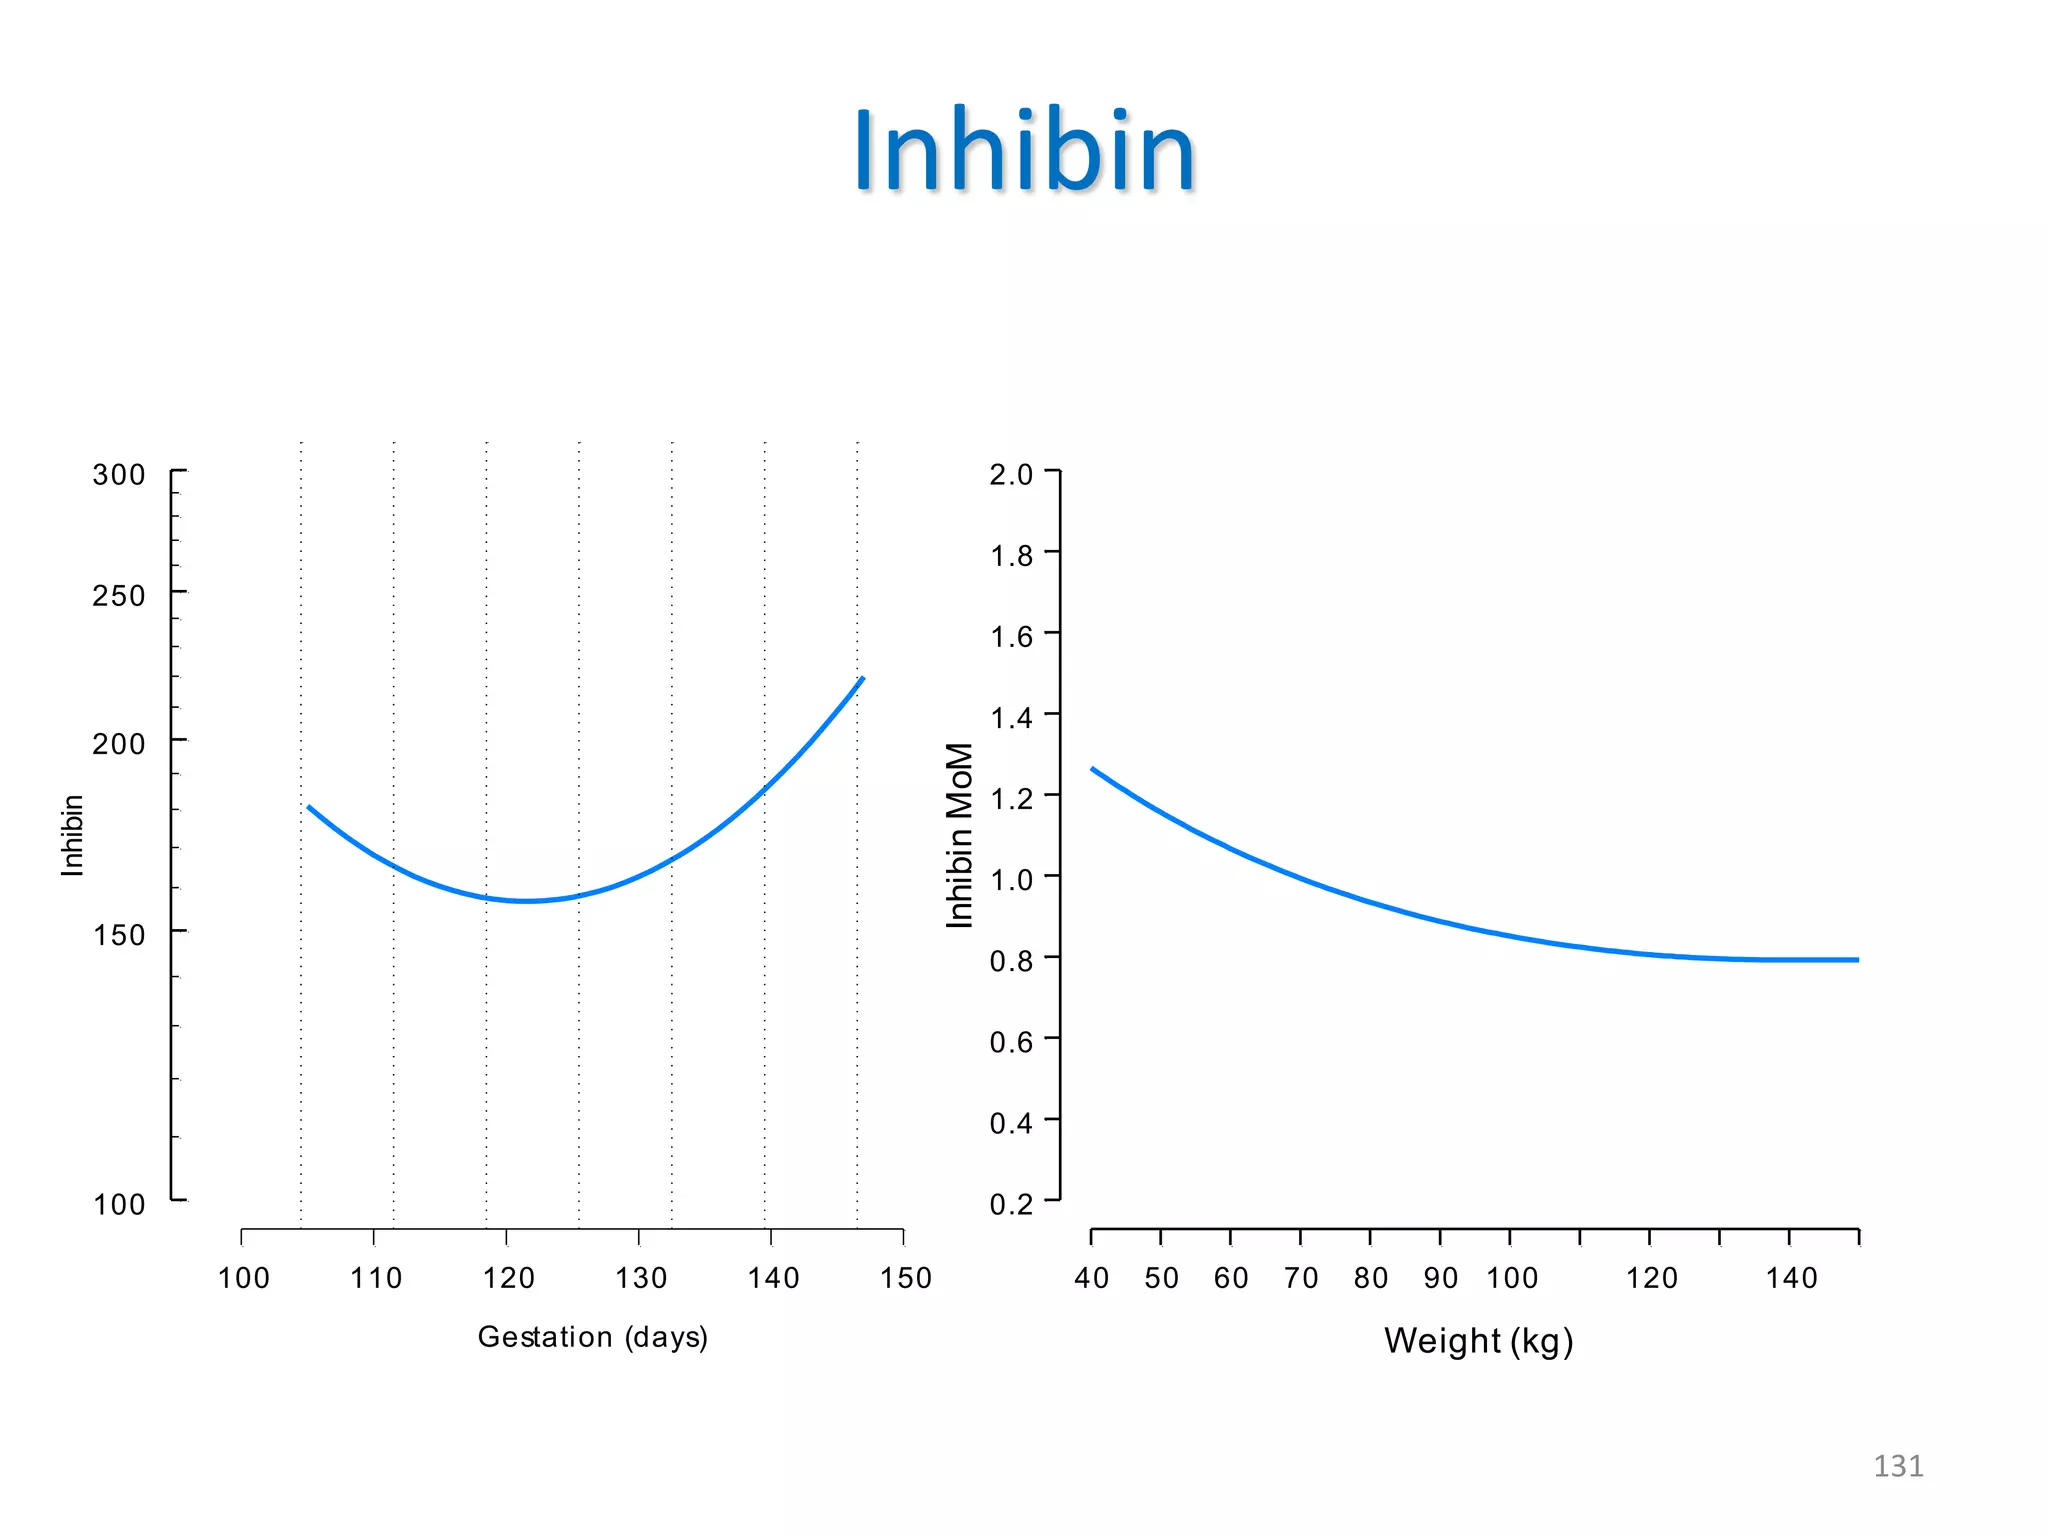
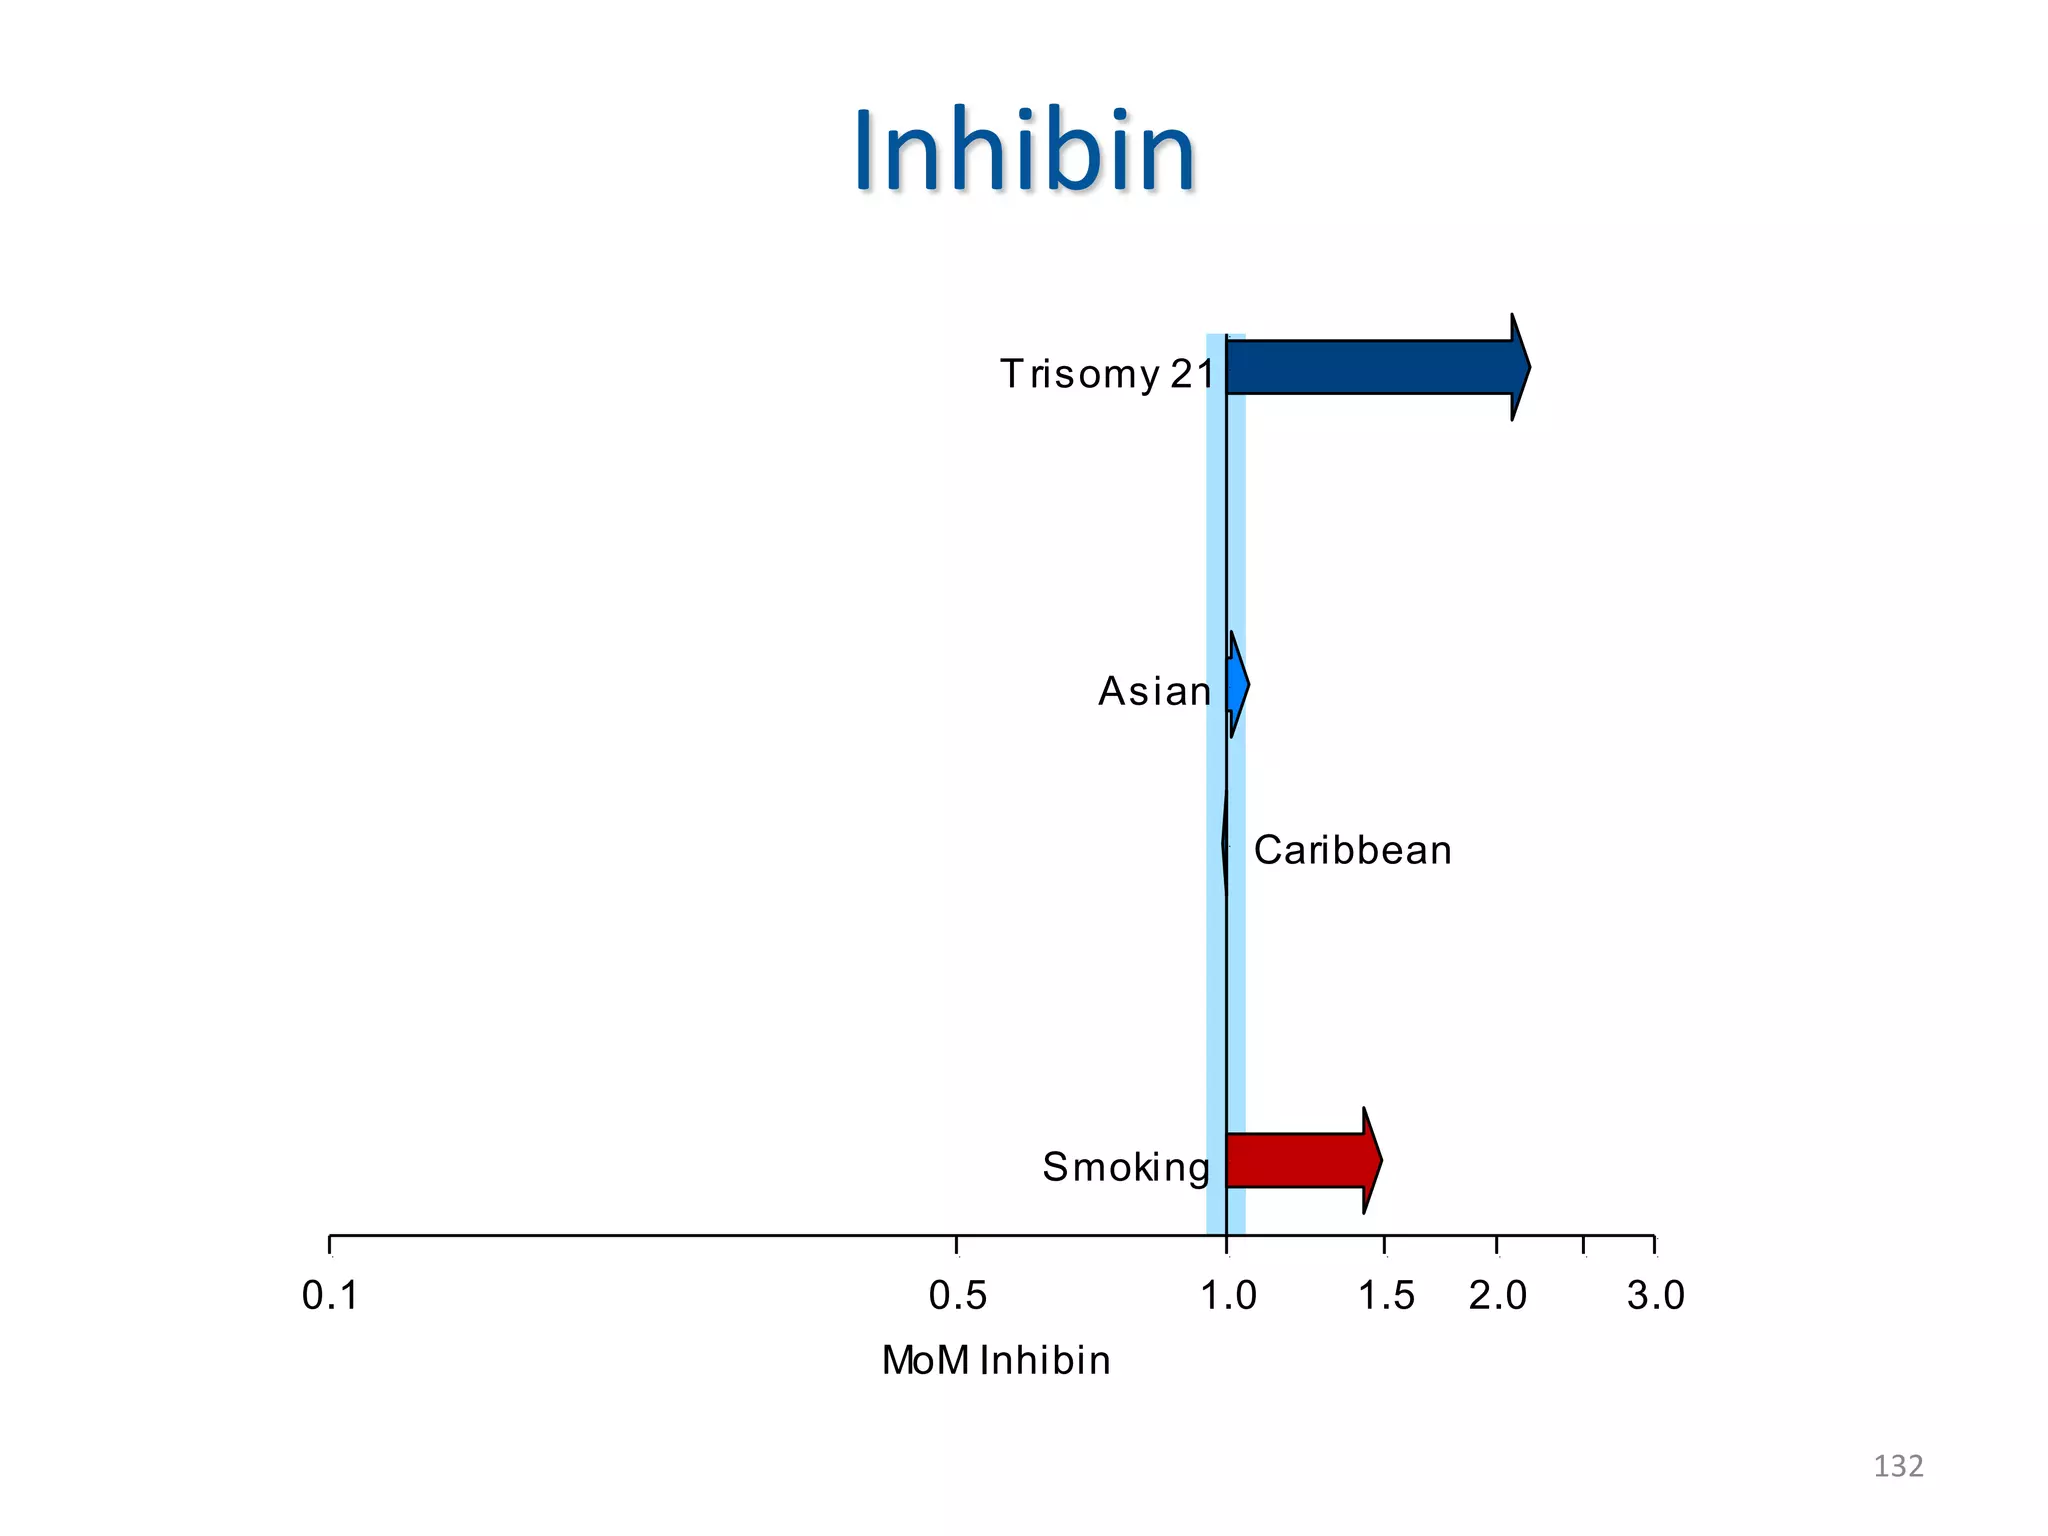
WHAT, WHY AND
HOW?
WHAT:
Some background
Probability
Model
Age risk model
Risk
MoM
values
Marker values
(PAPP-A, free  hCG, NT)
Gestational age (from
CRL)
Maternal weight
Smoking
Ethnicity
The process
Standardisation
Standardisation
Ideally markers should be independent of other
variables such as gestation, weight, ethnicity, .. so
that interpretation is easy
The reality is that marker levels depend, to various
degrees, on:
• Gestation
• Maternal weight
• Ethnicity
• Smoking status
• Multiple pregnancy
• IVF
• Machine
• Laboratory
• Reagent lot
• etc.
We standardise into MoM
values to remove the
effects of these
characteristics.
4
PAPP-A
0 5 10 15
PAPP-A
0 5 10 15
PAPP-A
0 5 10 15
Illustration PAPP-A
11w+3d
12w+3d
13w+3d
PAPP-A
0 5 10 15
PAPP-A
0 5 10 15
PAPP-A
0 5 10 15
11w+3d
12w+3d
13w+3d
PAPP-A
0 5 10 15
0.5 1.0 2.0
PAPP-A
0 5 10 15
0.5 1.0 2.0
PAPP-A
0 5 10 15
0.5 1.0 2.0
11w+3d
12w+3d
13w+3d
PAPP-A MoM
0 1 2 3 4 5
PAPP-A MoM
0 1 2 3 4 5
PAPP-A MoM
0 1 2 3 4 5
MoMs
11w+3d
12w+3d
13w+3d
PAPP-A MoM - log scale
0.1 0.5 1.0 2.0 10.0
PAPP-A MoM - log scale
0.1 0.5 1.0 2.0 10.0
PAPP-A MoM - log scale
0.1 0.5 1.0 2.0 10.0
Log (MoMs)
11w+3d
12w+3d
13w+3d
11w+3d
12w+3d
13w+3d
PAPP-A MoM - log scale
0.1 0.5 1.0 2.0 10.0
PAPP-A MoM - log scale
0.1 0.5 1.0 2.0 10.0
PAPP-A MoM - log scale
0.1 0.5 1.0 2.0 10.0
PAPP-A
Gestation (days)
PAPP-A(iU/l)
50 60 70 80 90 100
0.1
0.2
0.5
1.0
2.0
5.0
Wk 7 Wk 8 Wk 9 Wk 10 Wk 11 Wk 12 Wk 13
Weight (kg)
PAPP-AMoM
40 50 60 70 80 90 100 110 120 130 140 150
0.2
0.4
0.6
0.8
1.0
1.2
1.4
1.6
1.8
2.0
11
Effects on PAPP-A
MoM PAPP-A
0.1 0.5 1.0 1.5 2.0 3.0
Trisomy 21 - Wk 11-13
Trisomy 18
Trisomy 13
Afro-Caribbean
Asian
Oriental
Smoking
11 12 13
PAPP-A
12
Free β-hCG (T1)
Gestation (days)
hCGbeta
50 60 70 80 90 100
5
10
20
30
40
50
60
80
100
150
200
250
Wk 7 Wk 8 Wk 9 Wk 10 Wk 11 Wk 12 Wk 13
Gestation (days)
FreebetahCG
100 110 120 130 140 150
5
10
15
20
25
30 Wk 15 Wk 16 Wk 17 Wk 18 Wk 19 Wk 20
Weight (kg)
FreebetaMoM
40 50 60 70 80 90 100 110 120 130 140 150
0.2
0.4
0.6
0.8
1.0
1.2
1.4
1.6
1.8
2.0
Gestation (days)
FreebetahCG
100 110 120 130 140 150
5
10
15
20
25
30 Wk 15 Wk 16 Wk 17 Wk 18 Wk 19 Wk 20
13
Free β-hCG (T1)
Effects on Free ß-hCG (T1)
MoM Free ß-hCG (T1)
0.1 0.5 1.0 1.5 2.0 3.0
Trisomy 21
Trisomy 18
Trisomy 13
Afro-Caribbean
Asian
Oriental
Smoking
11 12 13
14
AFP
Weight (kg)
AFPMoM
40 50 60 70 80 90 100 120 140
0.2
0.4
0.6
0.8
1.0
1.2
1.4
1.6
1.8
2.0
Gestation (days)
AFP
100 110 120 130 140 150
20
30
40
50
60
70
80 Wk 15 Wk 16 Wk 17 Wk 18 Wk 19 Wk 20
15
AFP
Effects on AFP
MoM AFP
0.1 0.5 1.0 1.5 2.0 3.0
Trisomy 21
Trisomy 18
Trisomy 13
African
Caribbean
Chinese
Oriental
Asian
Bangladeshi
Indian
Pakistani
Smoking
16
uE3
Weight (kg)
uE3MoM
40 50 60 70 80 90 110 130 150
0.2
0.4
0.6
0.8
1.0
1.2
1.4
1.6
1.8
2.0
Gestation (days)
uE3
100 110 120 130 140 150
1
2
3
4
5
6
7
8
10
15
20 Wk 15 Wk 16 Wk 17 Wk 18 Wk 19 Wk 20
17
Effects on uE3
MoM uE3
0.1 0.5 1.0 1.5 2.0 3.0
Trisomy 21
Trisomy 18
Trisomy 13
African
Caribbean
Chinese
Oriental
Asian
Bangladeshi
Indian
Pakistani
Smoking
uE3
18
hCG
Weight (kg)
hCGMoM
40 50 60 70 80 90 100 120 140
0.2
0.4
0.6
0.8
1.0
1.2
1.4
1.6
1.8
2.0
Gestation (days)
hCG
100 110 120 130 140 150
10
20
30
40
50 Wk 15 Wk 16 Wk 17 Wk 18 Wk 19 Wk 20
19
hCG
Effects on hCG
MoM hCG
0.1 0.5 1.0 1.5 2.0 3.0
Trisomy 21
Trisomy 18
Trisomy 13
African
Caribbean
Chinese
Asian
Indian
Pakistani
Smoking
20
Free β-hCG (T2)
Weight (kg)
FreebetahCGMoM
40 50 60 70 80 90 100 120 140
0.2
0.4
0.6
0.8
1.0
1.2
1.4
1.6
1.8
2.0
Gestation (days)
FreebetahCG
100 110 120 130 140 150
5
10
15
20
25
30 Wk 15 Wk 16 Wk 17 Wk 18 Wk 19 Wk 20
21
Free β-hCG (T2)
Effects on Free ß-hCG (T2)
MoM Free ß-hCG (T2)
0.1 0.5 1.0 1.5 2.0 3.0
Trisomy 21
African
Caribbean
Black Other
Asian
Bangladeshi
Indian
Pakistani
Other Asian
Chinese
Oriental
Smoking
22
Gestation (days)
Inhibin
100 110 120 130 140 150
100
150
200
250
300
Weight (kg)
InhibinMoM
40 50 60 70 80 90 100 120 140
0.2
0.4
0.6
0.8
1.0
1.2
1.4
1.6
1.8
2.0
Inhibin
23
Effects on Inhibin
MoM Inhibin
0.1 0.5 1.0 1.5 2.0 3.0
Trisomy 21
Asian
Caribbean
Smoking
Inhibin
24
Nuchal
Translucency
NT
Crown-rump length (mm)
Nuchaltranslucency(mm)
45 50 55 60 65 70 75 80 85
0.5
1
2
3
4
5
6
7
8
WHY : the effect of
errors on the
screening program
Standardisation
• MoM values should be centred on 1.0 when viewed
together, by gestation, by weight, by smoking status,
by ethnicity …
• What if this is not true?
28
Inputs and
parameter
estimates
Risk
DR/FPR/SPR
Process
Amplification of errors
Effects of bias – biochemistry
(NT and biochemistry at 12 weeks risk cut-off 1 in 150 at term)
A 27% increase in SPR with 70 more ‘positive’ results per 10,000
screening tests than expected.
PAPP-A hCG β
1 1 2.6% 85%
0.9 1 3.3% 87%
1 0.9 2.0% 83%
1.1 1 2.0% 83%
1 1.1 3.1% 86%
0.9 0.9 2.7% 85%
1.1 1.1 2.4% 84%
0.9 1.1 4.0% 88%
1.1 0.9 1.7% 81%
Median MoM
FPR (%) DR (%)
The importance
of crown rump
length
The (near) perfect world of biochemistry
Cyprus
Gestation (weeks)
PAPP-AMoM
7 8 9 10 11 12 13
0.8
0.9
1.0
1.1
1.2
1.3
1.4
1.5
n= 812
n= 4787 n= 4231
n= 1426
n= 311
n= 72
n= 2
Median Standard
The median MoM
value for any sub-
population defined by
time period, gestational
age, maternal weight,
smoking status and
ethnicity should lie
within 5% of the target
value of 1.
Median MoM by
gestation
Operator
hCGbetaMoM
###
###
###
###
###
###
###
###
###
###
###
###
###
###
###
###
###
###
###
###
###
0.8
1.0
1.2
n = 2 7
n = 2 9
n = 3 3n = 3 4
n = 3 5
n = 3 7
n = 3 8
n = 4 7
n = 6 6
n = 6 8
n = 7 0
n = 7 5
n = 7 7
n = 7 9
n = 8 0
n = 9 9
n = 1 0 4
n = 1 0 4
n = 1 0 9
n = 1 5 3
n = 1 8 6
OperatorPAPP-AMoM
###
###
###
###
###
###
###
###
###
###
###
###
###
###
###
###
###
###
###
###
###
0.8
1.0
1.2 n = 2 7
n = 2 9
n = 3 3
n = 3 4
n = 3 5
n = 3 7
n = 3 8
n = 4 7
n = 6 6
n = 6 8
n = 7 0
n = 7 5
n = 7 7
n = 7 9
n = 8 0
n = 9 9
n = 1 0 4
n = 1 0 4
n = 1 0 9
n = 1 5 3
n = 1 8 6
PAPP-AMoMhCGβMoM
Operator
Operator
Why operator effects on biochemistry?
• Causes include
– case mix
– sample preparation
– storage
– transportation
– CRL measurement
PAPP-A by gestation
Gestation (days)
PAPP-A
50 60 70 80 90 100
0.1
0.2
0.5
1.0
2.0
5.0
Wk 7 Wk 8 Wk 9 Wk 10 Wk 11 Wk 12 Wk 13
PAPP-A by gestation
Gestation (days)
PAPP-A
50 60 70 80 90 100
0.1
0.2
0.5
1.0
2.0
5.0
Wk 7 Wk 8 Wk 9 Wk 10 Wk 11 Wk 12 Wk 13

MoM = 1
PAPP-A by gestation
Gestation (days)
PAPP-A
50 60 70 80 90 100
0.1
0.2
0.5
1.0
2.0
5.0
Wk 7 Wk 8 Wk 9 Wk 10 Wk 11 Wk 12 Wk 13

MoM = 1

MoM = 0.57
Free β-hCG by gestation
Gestation (days)
hCGbeta
50 60 70 80 90 100
5
10
20
30
40
50
60
80
100
150
200
250
Wk 7 Wk 8 Wk 9 Wk 10 Wk 11 Wk 12 Wk 13

MoM = 1
MoM =1.2

Effects of Crown Rump Length (CRL) biases on
biochemistry MoM values
(NT and biochemistry at 12 weeks risk cut-off 1 in 150 at term)
CRL Error Error in GA Median MoM
(mm) (days) PAPP-A hCG beta DR FPR
-5 -2.7 1.17 0.93 80% 1.4%
-4 -2.2 1.13 0.94 81% 1.6%
-3 -1.6 1.10 0.96 82% 1.9%
-2 -1.1 1.06 0.97 83% 2.0%
-1 -0.5 1.03 0.99 84% 2.4%
0 0.0 1.00 1.00 85% 2.7%
1 0.5 0.97 1.01 86% 3.1%
2 1.0 0.94 1.03 86% 3.7%
3 1.6 0.92 1.04 87% 4.1%
4 2.1 0.89 1.06 88% 4.8%
5 2.6 0.87 1.07 89% 5.5%
Down’s syndrome presents as biochemical immaturity so effects of errors on PAPP-A
and free β-hCG combine.
Crown-rump length (mm)
Nuchaltranslucency(mm)
45 50 55 60 65 70 75 80 85
0.5
1
2
3
4
5
6
7
8
Impact of NT on risks
Crown-rump length (mm)
Nuchaltranslucency(mm)
45 50 55 60 65 70 75 80 85
0.5
1
2
3
4
5
6
7
8
Impact of NT on risks
Crown-rump length (mm)
Nuchaltranslucency(mm)
45 50 55 60 65 70 75 80 85
0.5
1
2
3
4
5
6
7
8
How : DQASS
DQASS
• The aim is to monitor and support the quality and
effectiveness of screening
• Provide feedback on all aspects of the test to laboratories,
ultrasound departments and commercial suppliers.
• Through meta-analyses DQASS provides information on
effects of factors such a smoking that can be used to
improve screening performance.
Report
production
Feedback
& advice
Improvements
Data
submissions
Lab reports ~40
per year
Cycle reports
A Two Day Workshop
Thursday 17 and Friday 18 January 2008
DQASS Workshop on
Standardisation, Monitoring and
Updating Medians: Why, When
and How?
Presented by:
Amy Baker
Barry Nix
Dave Worthington
Dave Wright
Workshops
Individualised feedback to
all sonographers on all
scan measurements
~20002
(from April 2010)
NuchalTranslucency(mm)
ID: 49057 (n = 184)
Crown-rump length (mm)
Cycle 5
From: 16/05/2008
To: 31/10/2008
40 45 50 55 60 65 70 75 80 85 90
0.0
0.5
1.0
1.5
2.0
2.5
3.0
3.5
4.0
68(37%)
116(63%)
Bias =0.08mm
4NTvalues greaterthan4mmshownas 4mm
NuchalTranslucency(mm)
ID: 49057 (n = 184)
Crown-rump length (mm)
Cycle 5
From: 16/05/2008
To: 31/10/2008
40 45 50 55 60 65 70 75 80 85 90
0.0
0.5
1.0
1.5
2.0
2.5
3.0
3.5
4.0
68(37%)
116(63%)
Bias =0.08mm
4NTvalues greaterthan4mmshownas 4mm
NuchalTranslucency(mm)
ID: 49057 (n = 184)
Crown-rump length (mm)
Cycle 5
From: 16/05/2008
To: 31/10/2008
40 45 50 55 60 65 70 75 80 85 90
0.0
0.5
1.0
1.5
2.0
2.5
3.0
3.5
4.0
68(37%)
116(63%)
Bias =0.08mm
4NTvalues greaterthan4mmshownas 4mm
NuchalTranslucency(mm)
ID: 49057 (n = 184)
Crown-rump length (mm)
Cycle 5
From: 16/05/2008
To: 31/10/2008
40 45 50 55 60 65 70 75 80 85 90
0.0
0.5
1.0
1.5
2.0
2.5
3.0
3.5
4.0
68(37%)
116(63%)
Bias =0.08mm
4NTvalues greaterthan4mmshownas 4mm
DQASS
Monitoring SPR
DQASS diagnostics for
biochemistry
• MoM values should be centred on 1.0
when viewed together, by gestation,
by weight, by smoking status, by
ethnicity …
• Small deviations from this target can
have important implications for
screening
Gestational age
Gestation (weeks)
MoMPAPP-A
10 11 12 13 14
0.7
0.8
0.9
1.0
1.1
1.2
1.3
1.4
1.5
1.6
1.7
n= 28
n= 227
n= 1137
n= 3710 n= 2539
n= 11
Gestation (weeks)
MoMPAPP-A
10 11 12 13 14
0.7
0.8
0.9
1.0
1.1
1.2
1.3
1.4
1.5
1.6
1.7
n= 2066
n= 6793 n= 3234
n= 25
Cycle 2
Cycle 7
48
Maternal weight
Weight group
MoMFreebeta-hCG
<50kg
50-60kg
60-70kg
70-80kg
80-90kg
90-100kg
100-110kg
110-120kg
>120kg
0.7
0.8
0.9
1.0
1.1
1.2
1.3
n= 368
n= 1818 n= 2404
n= 1409
n= 706
n= 385
n= 170
n= 88
n= 46
Weight group
MoMFreebeta-hCG
<50kg
50-60kg
60-70kg
70-80kg
80-90kg
90-100kg
100-110kg
110-120kg
>120kg
0.7
0.8
0.9
1.0
1.1
1.2
1.3
1.4
1.5
n=638
n=3043
n=3870 n=2326 n=1211
n=614 n=273
n=136
n=88
Cycle 2
Cycle 7
49
Smoking status
Cycle 2
Cycle 7
Smoking status
MoMInhibin
No Yes
0.7
0.8
0.9
1.0
1.1
1.2
1.3
1.4
1.5
n= 4729
n= 1119
Smoking status
MoMInhibin
Non-Smoker Smoker
0.7
0.8
0.9
1.0
1.1
1.2
1.3
1.4
1.5
n= 2821
n= 563
50
Ethnicity
Cycle 2
Cycle 7
Ethnic origin
MoMPAPP-A
Caucasian
Afro-Caribbean
Asian
Mixed
Oriental
0.7
0.8
0.9
1.0
1.1
1.2
1.3
1.4
1.5
1.6
1.7
n= 7907
n= 2054
n= 563
n= 373
n= 176
Ethnic origin
MoMPAPP-A
Caucasian
Afro-Caribbean
Asian
Oriental
Other
0.7
0.8
0.9
1.0
1.1
1.2
1.3
1.4
1.5
n=7881
n=1979
n=1608 n=263
n=469
51
CUSUM
52
Time 1 2 3 4 5 6 7 8 9 10
Deviation from target 0 0 0 0 0.5 0.5 0.5 0.5 0.5 0.5
Cumulative sum 0 0 0 0 0.5 1 1.5 2 2.5 3
0
0.5
1
1.5
2
2.5
3
3.5
0 2 4 6 8 10 12
CUSUM
Time
Change points
A change of -10% was
introduced around the
middle of September.
This is detected
relatively quickly.
A change of -5% was
introduced around the
middle of September.
This takes longer to
detect.
53
CUSUM charts for detecting change
points
Diagnostics for NT
NuchalTranslucency(mm)
ID: 49057 (n = 184)
Crown-rump length (mm)
40 45 50 55 60 65 70 75 80 85 90
0.0
0.5
1.0
1.5
2.0
2.5
3.0
3.5
4.0
68 (37%)
116 (63%)
4 NTvalues greaterthan 4mmshownas 4mm
Expected relationship
with CRL
Expected degree of
scatter about the curve
DQASS Diagnostics: Nuchal Translucency
NuchalTranslucency(mm)
ID: Sample (n = 300)
Crown-rump length (mm)
Cycle
From: NA
To: NA
40 45 50 55 60 65 70 75 80 85 90
0.0
0.5
1.0
1.5
2.0
2.5
3.0
3.5
4.0
152 (51%)
148 (49%)
Bias = 0mm
NuchalTranslucency(mm)
ID: Sample (n = 300)
Crown-rump length (mm)
Cycle
From: NA
To: NA
40 45 50 55 60 65 70 75 80 85 90
0.0
0.5
1.0
1.5
2.0
2.5
3.0
3.5
4.0
152 (51%)
148 (49%)
Bias = 0mm
NuchalTranslucency(mm)
ID: Sample (n = 300)
Crown-rump length (mm)
Cycle
From: NA
To: NA
40 45 50 55 60 65 70 75 80 85 90
0.0
0.5
1.0
1.5
2.0
2.5
3.0
3.5
4.0
287 (96%)
13 (4%)
Bias = -0.58mm
Bias
NuchalTranslucency(mm)
ID: Sample (n = 300)
Crown-rump length (mm)
Cycle
From: NA
To: NA
40 45 50 55 60 65 70 75 80 85 90
0.0
0.5
1.0
1.5
2.0
2.5
3.0
3.5
4.0
152 (51%)
148 (49%)
Bias = 0mm
Bias
NuchalTranslucency(mm)
ID: Sample (n = 300)
Crown-rump length (mm)
Cycle
From: NA
To: NA
40 45 50 55 60 65 70 75 80 85 90
0.0
0.5
1.0
1.5
2.0
2.5
3.0
3.5
4.0
12 (4%)
288 (96%)
Bias = 0.55mm
1 NT value greater than 4mm shown as 4mm
Cycle Reports
Pareto Charts
Sonography
0.0 0.1 0.2 0.3 0.4 0.5 0.6
020406080100
Bias
(mm)
Proportionoftests
10% of all scans,
bias of 0.60mm
Illustration (n = 4 sonographers)
0.0 0.1 0.2 0.3 0.4 0.5 0.6
Bias
(mm)
Proportionoftests
Illustration (n = 4 sonographers)
30% of all
scans, bias of
0.34mm
020406080100
0.0 0.1 0.2 0.3 0.4 0.5 0.6
020406080100
Bias
(mm)
Proportionoftests
Area = Average bias
Illustration (n = 4 sonographers)
0.0 0.1 0.2 0.3 0.4 0.5 0.6
Bias
(mm)
Proportionoftests
Illustration (n = 4 sonographers)
020406080100
0.0 0.1 0.2 0.3 0.4 0.5 0.6
020406080100
Bias
(mm)
Proportionoftests
Illustration (n = 4 sonographers)
Cycle 18
Other outputs from DQASS
Parameter estimates for configuring
the screening program.
Example: Twin effect for Inhibin-A.
MoM
1.4 1.6 1.8 2 2.2 2.4 2.6 2.8 3 3.2 3.4
Cycle 18
Cycle 19
Pooled
Thank you!
END OF PRESENTATION
NuchalTranslucency(mm)
ID: Sample (n = 300)
Crown-rump length (mm)
Cycle
From: NA
To: NA
40 45 50 55 60 65 70 75 80 85 90
0.0
0.5
1.0
1.5
2.0
2.5
3.0
3.5
4.0
152 (51%)
148 (49%)
Bias = 0mm
Spread
NuchalTranslucency(mm)
ID: Sample (n = 300)
Crown-rump length (mm)
Cycle
From: NA
To: NA
40 45 50 55 60 65 70 75 80 85 90
0.0
0.5
1.0
1.5
2.0
2.5
3.0
3.5
4.0
159(53%)
141(47%)
Bias =-0.01mm
Spreaddecreased: 0.43
NuchalTranslucency(mm)
ID: Sample (n = 300)
Crown-rump length (mm)
Cycle
From: NA
To: NA
40 45 50 55 60 65 70 75 80 85 90
0.0
0.5
1.0
1.5
2.0
2.5
3.0
3.5
4.0
152 (51%)
148 (49%)
Bias = 0mm
Trend
NuchalTranslucency(mm)
ID: Sample (n = 300)
Crown-rump length (mm)
Cycle
From: NA
To: NA
40 45 50 55 60 65 70 75 80 85 90
0.0
0.5
1.0
1.5
2.0
2.5
3.0
3.5
4.0
130(43%)
170(57%)
Bias =0.09mm
Trenddeviation
2NTvalues greaterthan4mmshownas 4mm
NuchalTranslucency(mm)
ID: Sample (n = 300)
Crown-rump length (mm)
Cycle
From: NA
To: NA
40 45 50 55 60 65 70 75 80 85 90
0.0
0.5
1.0
1.5
2.0
2.5
3.0
3.5
4.0
152 (51%)
148 (49%)
Bias = 0mm
Trend
NuchalTranslucency(mm)
ID: Sample (n = 300)
Crown-rump length (mm)
Cycle
From: NA
To: NA
40 45 50 55 60 65 70 75 80 85 90
0.0
0.5
1.0
1.5
2.0
2.5
3.0
3.5
4.0
168 (56%)
132 (44%)
Bias = -0.07mm
Trend deviation
1 NT value greater than 4mm shown as 4mm
Hospital Summary Report
#####
#####
#####
#####
#####
#####
#####
#####
#####
#####
#####
#####
#####
#####
#####
#####
#####
#####
#####
#####
#####
#####
#####
#####
#####
#####
#####
#####
#####
#####
Hospital Summary Report
Cycle reports
End of cycle reports
Cycle 14 report
April 2013 to September 2013
Cycle reports for biochemistry-
PAPP-A
Estimated proportion of median MoMs outside 5%
Best
Worst
DQASS 88
DQASS 99
Cycle reports for NT - National
Cycle reports for NT - Region x
Laboratory
throughput
Rationale
• Need for sufficient precision to estimate
performance (standardised SPR)
• To enable monitoring of laboratory
medians and early detection of change
points
• For proficiency/expertise
log(MoM)
-50
-40
-30
-20
-10
0
10
20
log(MoM)
-50
-40
-30
-20
-10
0
10
20
log(MoM)
-50
-40
-30
-20
-10
0
10
20
log(MoM)
-50
-40
-30
-20
-10
0
10
20
Sample
log(MoM)
-50
-40
-30
-20
-10
0
10
20
0 200 400 600 800 1000
Sample
log(MoM) -250
-200
-150
-100
-50
0
50
0 2500 5000
5 labs 1,000 samples
1 lab5,000 samples
DQASS
• Feedback and support to sonographers
laboratories, hospitals and suppliers
• Monitoring at the local and national level
• A national database: evidence on
screening parameters, effects of smoking
ethnicity etc
Thank you!
MONITORING PROGRESS
REGIONALLY AND
NATIONALLY
Laboratory
Cycle by cycle feedback to individual
laboratories
0
10
20
30
40
50
60
AFP hCG uE3 Inhibin
Estimatedproportion(%)ofMoMvalues
outside5%
Cycle 1 Cycle 2 Cycle 3
Sonography
0.0 0.1 0.2 0.3 0.4 0.5 0.6
020406080100
Bias
(mm)
Proportionoftests
10% of all scans,
bias of 0.60mm
Illustration (n = 4 sonographers)
0.0 0.1 0.2 0.3 0.4 0.5 0.6
Bias
(mm)
Proportionoftests
Illustration (n = 4 sonographers)
30% of all
scans, bias of
0.34mm
020406080100
0.0 0.1 0.2 0.3 0.4 0.5 0.6
020406080100
Bias
(mm)
Proportionoftests
Area = Average bias
Illustration (n = 4 sonographers)
0.0 0.1 0.2 0.3 0.4 0.5 0.6
Bias
(mm)
Proportionoftests
Illustration (n = 4 sonographers)
020406080100
0.0 0.1 0.2 0.3 0.4 0.5 0.6
020406080100
Bias
(mm)
Proportionoftests
Illustration (n = 4 sonographers)
0.0 0.1 0.2 0.3 0.4 0.5 0.6 0.7
0
10
20
30
40
50
60
70
80
90
100
Bias (mm)
ProportionofWomenScreened
National
Cycle 8: Reference
Cycle 12:
Cycle 11:
Cycle 10:
Cycle 12:
1841 Sonographers
203601 Scans
1.24% < 25 scans
Cycle 11:
1759 Sonographers
188472 Scans
1.37% < 25 scans
Cycle 10:
1599 Sonographers
167944 Scans
1.91% < 25 scans
46.92% 42.38% 6.91% 3.79%
57.55% 38.40% 3.29% 0.77%
60.94% 36.39% 2.08% 0.59%
DQASS NT-QA
Highlights
• Consistency of provision
• Evidenced improvement is quality
• Improved outcomes
Consistent provision
March 2007: SPR 5.9% September 2012: SPR 2.5%
Combined
15%
Quadruple
9%
Triple
48%
Double
27%
Integrated
1%
Combined
Quadruple
Triple
Double
Integrated
Combined
80%
Quadruple
19%
Integrated
1%
Cycle Scans (000,s) Sonograhers (n) Green (%)
8 (Apr-Sep 2010) 102 884 35
9 128 1,160 39
10 168 1,599 47
11 188 1,759 58
12 (Apr-Sep 2012) 204 1,841 61
Improving Quality
0
10
20
30
40
50
60
70
80
90
100
8 9 10 11 12
Proportiongreen(%)
Cycle
Improving Quality
All
regions
What Next
• Choice of screening test
• Choice of risk cut-off
• QA of screening (what, why, how)
• DQASS Reports
• Monitoring program performance
CHOICE OF
SCREENING TEST
AND RISK CUT-OFF
Double Test: AFP + hCG
False Positive Rate (%)
DetectionRate(%)
0 2 4 6 8 10
020406080100
1 in 100
1 in 150
1 in 200
1 in 250
Double Test: AFP + free beta hCG
False Positive Rate (%)
DetectionRate(%)
0 2 4 6 8 10
020406080100
1 in 100
1 in 150
1 in 200
1 in 250
Triple Test: AFP + hCG + uE3
False Positive Rate (%)
DetectionRate(%)
0 2 4 6 8 10
020406080100
1 in 100
1 in 150
1 in 200
1 in 250
Triple Test: AFP + free beta hCG + uE3
False Positive Rate (%)
DetectionRate(%)
0 2 4 6 8 10
020406080100
1 in 100
1 in 150
1 in 200
1 in 250
Combined Test: NT + free beta hCG + PAPP-A
Week 11
False Positive Rate (%)
DetectionRate(%)
0 2 4 6 8 10
020406080100
1 in 100
1 in 150
1 in 200
1 in 250
Combined Test: NT + free beta hCG + PAPP-A
Week 12
False Positive Rate (%)
DetectionRate(%)
0 2 4 6 8 10
020406080100
1 in 100
1 in 150
1 in 200
1 in 250
Combined Test: NT + free beta hCG + PAPP-A
Week 13
False Positive Rate (%)
DetectionRate(%)
0 2 4 6 8 10
020406080100
1 in 100
1 in 150
1 in 200
1 in 250
Quad test (hCG)
False Positive Rate (%)
DetectionRate(%)
0 2 4 6 8 10
020406080100
1 in 100
1 in 150
1 in 200
1 in 250
Quad test (free beta hCG)
False Positive Rate (%)
DetectionRate(%)
0 2 4 6 8 10
020406080100
1 in 100
1 in 150
1 in 200
1 in 250
Integrated Test
Week 11
False Positive Rate (%)
DetectionRate(%)
0 2 4 6 8 10
020406080100
1 in 100
1 in 150
1 in 200
1 in 250
Integrated Test
Week 12
False Positive Rate (%)
DetectionRate(%)
0 2 4 6 8 10
020406080100
1 in 100
1 in 150
1 in 200
1 in 250
Integrated Test
Week 13
False Positive Rate (%)
DetectionRate(%)
0 2 4 6 8 10
020406080100
1 in 100
1 in 150
1 in 200
1 in 250
QA OF SCREENING
WHAT, WHY, HOW
Overview
• What
– Quick overview of first and second trimester
screening
• Why
– The effects of errors from different sources
• How
– The DQASS process
DQASS
A service, funded by the NHS, to
support the improvement of quality
and effectiveness of prenatal
screening in the UK
Based in Plymouth, Devon
Louise Armitage
Amy Baker
Andy Baker*
Nathan Eastwood*
Barry Nix
Paul Newell*
Dave Worthington
Dave Wright
Jade
Report
production
FeedbackImprovements
Data
submissions
Quality Assurance Support Service
People (2.8 full time equivalents):
Louise Armitage (admin)
Amy Baker
Andy Bailey
Paul Newell
Dave Wright
Dave Worthington (Biochemist)
Barry Nix (Statistician)
Statisticians
DQASS
Cycle 1 Cycle 2 Cycle 3 Cycle 4 Cycle 5 Cycle 6 Cycle 7 Cycle 8 Cycle 9
Oct-06 Mar 07 Apr 07 Sep-07 Oct-07 Mar-08 Apr 08 Sep-08 Oct-08 Mar-09 Apr 09Sep-09 Oct-09 Mar-10 Apr 10 Sep-10 Oct-10 Mar-11
20082011
PND
type
Number
2003/2004
Number
2004/2005
Number
2005/2006
Number
2006/2007
Number
2007/2008
Number
2008/2009
Number
2009/2010
Amnio
28,700 24,349 22,625 14,733 12,932 12,145 9,894
CVS 8,268 7,980 7,819 4, 781 4,681 3,520 3,701
*TOTA
L
36,968 32,329 30,444 19,514 17,613 15,665 13,595
Total screening tests
PND as % of screening tests
Total births
Percentage acceptance
365,775
4.81%
409,346
3.83%
427,527
3.18%
690,721 708, 711 706,248
52.95% 57.76% 60.53%
Improved Outcomes: Invasive Tests
0 1000 2000 3000 4000 5000
-100-50050
Sample
log(MoM)
Second trimester triple and
quadruple test
AFP
Weight (kg)
AFPMoM
40 50 60 70 80 90 100 120 140
0.2
0.4
0.6
0.8
1.0
1.2
1.4
1.6
1.8
2.0
Gestation (days)
AFP
100 110 120 130 140 150
20
30
40
50
60
70
80 Wk 15 Wk 16 Wk 17 Wk 18 Wk 19 Wk 20
123
AFP
Effects on AFP
MoM AFP
0.1 0.5 1.0 1.5 2.0 3.0
Trisomy 21
Trisomy 18
Trisomy 13
African
Caribbean
Chinese
Oriental
Asian
Bangladeshi
Indian
Pakistani
Smoking
124
uE3
Weight (kg)
uE3MoM
40 50 60 70 80 90 110 130 150
0.2
0.4
0.6
0.8
1.0
1.2
1.4
1.6
1.8
2.0
Gestation (days)
uE3
100 110 120 130 140 150
1
2
3
4
5
6
7
8
10
15
20 Wk 15 Wk 16 Wk 17 Wk 18 Wk 19 Wk 20
125
Effects on uE3
MoM uE3
0.1 0.5 1.0 1.5 2.0 3.0
Trisomy 21
Trisomy 18
Trisomy 13
African
Caribbean
Chinese
Oriental
Asian
Bangladeshi
Indian
Pakistani
Smoking
uE3
126
hCG
Weight (kg)
hCGMoM
40 50 60 70 80 90 100 120 140
0.2
0.4
0.6
0.8
1.0
1.2
1.4
1.6
1.8
2.0
Gestation (days)
hCG
100 110 120 130 140 150
10
20
30
40
50 Wk 15 Wk 16 Wk 17 Wk 18 Wk 19 Wk 20
127
hCG
Effects on hCG
MoM hCG
0.1 0.5 1.0 1.5 2.0 3.0
Trisomy 21
Trisomy 18
Trisomy 13
African
Caribbean
Chinese
Asian
Indian
Pakistani
Smoking
128
Free β-hCG (T2)
Weight (kg)
FreebetahCGMoM
40 50 60 70 80 90 100 120 140
0.2
0.4
0.6
0.8
1.0
1.2
1.4
1.6
1.8
2.0
Gestation (days)
FreebetahCG
100 110 120 130 140 150
5
10
15
20
25
30 Wk 15 Wk 16 Wk 17 Wk 18 Wk 19 Wk 20
129
Free β-hCG (T2)
Effects on Free ß-hCG (T2)
MoM Free ß-hCG (T2)
0.1 0.5 1.0 1.5 2.0 3.0
Trisomy 21
African
Caribbean
Black Other
Asian
Bangladeshi
Indian
Pakistani
Other Asian
Chinese
Oriental
Smoking
130
Gestation (days)
Inhibin
100 110 120 130 140 150
100
150
200
250
300
Weight (kg)
InhibinMoM
40 50 60 70 80 90 100 120 140
0.2
0.4
0.6
0.8
1.0
1.2
1.4
1.6
1.8
2.0
Inhibin
131
Effects on Inhibin
MoM Inhibin
0.1 0.5 1.0 1.5 2.0 3.0
Trisomy 21
Asian
Caribbean
Smoking
Inhibin
132
Crown rump length
The (near) perfect world of biochemistry
Cyprus
Gestation (weeks)
PAPP-AMoM
7 8 9 10 11 12 13
0.8
0.9
1.0
1.1
1.2
1.3
1.4
1.5
n= 812
n= 4787 n= 4231
n= 1426
n= 311
n= 72
n
Median Standard
The median MoM value
for any sub-population
defined by time period,
gestational age, maternal
weight, smoking status
and ethnicity should lie
within 5% of the target
value of 1.
Median MoM by gestation
Communication with sonographers
DQASS
Screening support
sonographers (165)
Sonographers (1,950)
Sonographer reports
Hospital reports
Cycle reports
Regional reports
Training
Regional meeting
Annual meetings

1. QA of screening for downs

  • 1.
  • 2.
  • 3.
    Probability Model Age risk model Risk MoM values Markervalues (PAPP-A, free  hCG, NT) Gestational age (from CRL) Maternal weight Smoking Ethnicity The process Standardisation
  • 4.
    Standardisation Ideally markers shouldbe independent of other variables such as gestation, weight, ethnicity, .. so that interpretation is easy The reality is that marker levels depend, to various degrees, on: • Gestation • Maternal weight • Ethnicity • Smoking status • Multiple pregnancy • IVF • Machine • Laboratory • Reagent lot • etc. We standardise into MoM values to remove the effects of these characteristics. 4
  • 5.
    PAPP-A 0 5 1015 PAPP-A 0 5 10 15 PAPP-A 0 5 10 15 Illustration PAPP-A 11w+3d 12w+3d 13w+3d
  • 6.
    PAPP-A 0 5 1015 PAPP-A 0 5 10 15 PAPP-A 0 5 10 15 11w+3d 12w+3d 13w+3d
  • 7.
    PAPP-A 0 5 1015 0.5 1.0 2.0 PAPP-A 0 5 10 15 0.5 1.0 2.0 PAPP-A 0 5 10 15 0.5 1.0 2.0 11w+3d 12w+3d 13w+3d
  • 8.
    PAPP-A MoM 0 12 3 4 5 PAPP-A MoM 0 1 2 3 4 5 PAPP-A MoM 0 1 2 3 4 5 MoMs 11w+3d 12w+3d 13w+3d
  • 9.
    PAPP-A MoM -log scale 0.1 0.5 1.0 2.0 10.0 PAPP-A MoM - log scale 0.1 0.5 1.0 2.0 10.0 PAPP-A MoM - log scale 0.1 0.5 1.0 2.0 10.0 Log (MoMs) 11w+3d 12w+3d 13w+3d
  • 10.
    11w+3d 12w+3d 13w+3d PAPP-A MoM -log scale 0.1 0.5 1.0 2.0 10.0 PAPP-A MoM - log scale 0.1 0.5 1.0 2.0 10.0 PAPP-A MoM - log scale 0.1 0.5 1.0 2.0 10.0
  • 11.
    PAPP-A Gestation (days) PAPP-A(iU/l) 50 6070 80 90 100 0.1 0.2 0.5 1.0 2.0 5.0 Wk 7 Wk 8 Wk 9 Wk 10 Wk 11 Wk 12 Wk 13 Weight (kg) PAPP-AMoM 40 50 60 70 80 90 100 110 120 130 140 150 0.2 0.4 0.6 0.8 1.0 1.2 1.4 1.6 1.8 2.0 11
  • 12.
    Effects on PAPP-A MoMPAPP-A 0.1 0.5 1.0 1.5 2.0 3.0 Trisomy 21 - Wk 11-13 Trisomy 18 Trisomy 13 Afro-Caribbean Asian Oriental Smoking 11 12 13 PAPP-A 12
  • 13.
    Free β-hCG (T1) Gestation(days) hCGbeta 50 60 70 80 90 100 5 10 20 30 40 50 60 80 100 150 200 250 Wk 7 Wk 8 Wk 9 Wk 10 Wk 11 Wk 12 Wk 13 Gestation (days) FreebetahCG 100 110 120 130 140 150 5 10 15 20 25 30 Wk 15 Wk 16 Wk 17 Wk 18 Wk 19 Wk 20 Weight (kg) FreebetaMoM 40 50 60 70 80 90 100 110 120 130 140 150 0.2 0.4 0.6 0.8 1.0 1.2 1.4 1.6 1.8 2.0 Gestation (days) FreebetahCG 100 110 120 130 140 150 5 10 15 20 25 30 Wk 15 Wk 16 Wk 17 Wk 18 Wk 19 Wk 20 13
  • 14.
    Free β-hCG (T1) Effectson Free ß-hCG (T1) MoM Free ß-hCG (T1) 0.1 0.5 1.0 1.5 2.0 3.0 Trisomy 21 Trisomy 18 Trisomy 13 Afro-Caribbean Asian Oriental Smoking 11 12 13 14
  • 15.
    AFP Weight (kg) AFPMoM 40 5060 70 80 90 100 120 140 0.2 0.4 0.6 0.8 1.0 1.2 1.4 1.6 1.8 2.0 Gestation (days) AFP 100 110 120 130 140 150 20 30 40 50 60 70 80 Wk 15 Wk 16 Wk 17 Wk 18 Wk 19 Wk 20 15
  • 16.
    AFP Effects on AFP MoMAFP 0.1 0.5 1.0 1.5 2.0 3.0 Trisomy 21 Trisomy 18 Trisomy 13 African Caribbean Chinese Oriental Asian Bangladeshi Indian Pakistani Smoking 16
  • 17.
    uE3 Weight (kg) uE3MoM 40 5060 70 80 90 110 130 150 0.2 0.4 0.6 0.8 1.0 1.2 1.4 1.6 1.8 2.0 Gestation (days) uE3 100 110 120 130 140 150 1 2 3 4 5 6 7 8 10 15 20 Wk 15 Wk 16 Wk 17 Wk 18 Wk 19 Wk 20 17
  • 18.
    Effects on uE3 MoMuE3 0.1 0.5 1.0 1.5 2.0 3.0 Trisomy 21 Trisomy 18 Trisomy 13 African Caribbean Chinese Oriental Asian Bangladeshi Indian Pakistani Smoking uE3 18
  • 19.
    hCG Weight (kg) hCGMoM 40 5060 70 80 90 100 120 140 0.2 0.4 0.6 0.8 1.0 1.2 1.4 1.6 1.8 2.0 Gestation (days) hCG 100 110 120 130 140 150 10 20 30 40 50 Wk 15 Wk 16 Wk 17 Wk 18 Wk 19 Wk 20 19
  • 20.
    hCG Effects on hCG MoMhCG 0.1 0.5 1.0 1.5 2.0 3.0 Trisomy 21 Trisomy 18 Trisomy 13 African Caribbean Chinese Asian Indian Pakistani Smoking 20
  • 21.
    Free β-hCG (T2) Weight(kg) FreebetahCGMoM 40 50 60 70 80 90 100 120 140 0.2 0.4 0.6 0.8 1.0 1.2 1.4 1.6 1.8 2.0 Gestation (days) FreebetahCG 100 110 120 130 140 150 5 10 15 20 25 30 Wk 15 Wk 16 Wk 17 Wk 18 Wk 19 Wk 20 21
  • 22.
    Free β-hCG (T2) Effectson Free ß-hCG (T2) MoM Free ß-hCG (T2) 0.1 0.5 1.0 1.5 2.0 3.0 Trisomy 21 African Caribbean Black Other Asian Bangladeshi Indian Pakistani Other Asian Chinese Oriental Smoking 22
  • 23.
    Gestation (days) Inhibin 100 110120 130 140 150 100 150 200 250 300 Weight (kg) InhibinMoM 40 50 60 70 80 90 100 120 140 0.2 0.4 0.6 0.8 1.0 1.2 1.4 1.6 1.8 2.0 Inhibin 23
  • 24.
    Effects on Inhibin MoMInhibin 0.1 0.5 1.0 1.5 2.0 3.0 Trisomy 21 Asian Caribbean Smoking Inhibin 24
  • 25.
  • 26.
    NT Crown-rump length (mm) Nuchaltranslucency(mm) 4550 55 60 65 70 75 80 85 0.5 1 2 3 4 5 6 7 8
  • 27.
    WHY : theeffect of errors on the screening program
  • 28.
    Standardisation • MoM valuesshould be centred on 1.0 when viewed together, by gestation, by weight, by smoking status, by ethnicity … • What if this is not true? 28
  • 29.
  • 30.
    Effects of bias– biochemistry (NT and biochemistry at 12 weeks risk cut-off 1 in 150 at term) A 27% increase in SPR with 70 more ‘positive’ results per 10,000 screening tests than expected. PAPP-A hCG β 1 1 2.6% 85% 0.9 1 3.3% 87% 1 0.9 2.0% 83% 1.1 1 2.0% 83% 1 1.1 3.1% 86% 0.9 0.9 2.7% 85% 1.1 1.1 2.4% 84% 0.9 1.1 4.0% 88% 1.1 0.9 1.7% 81% Median MoM FPR (%) DR (%)
  • 31.
  • 32.
    The (near) perfectworld of biochemistry Cyprus Gestation (weeks) PAPP-AMoM 7 8 9 10 11 12 13 0.8 0.9 1.0 1.1 1.2 1.3 1.4 1.5 n= 812 n= 4787 n= 4231 n= 1426 n= 311 n= 72 n= 2 Median Standard The median MoM value for any sub- population defined by time period, gestational age, maternal weight, smoking status and ethnicity should lie within 5% of the target value of 1. Median MoM by gestation
  • 33.
    Operator hCGbetaMoM ### ### ### ### ### ### ### ### ### ### ### ### ### ### ### ### ### ### ### ### ### 0.8 1.0 1.2 n = 27 n = 2 9 n = 3 3n = 3 4 n = 3 5 n = 3 7 n = 3 8 n = 4 7 n = 6 6 n = 6 8 n = 7 0 n = 7 5 n = 7 7 n = 7 9 n = 8 0 n = 9 9 n = 1 0 4 n = 1 0 4 n = 1 0 9 n = 1 5 3 n = 1 8 6 OperatorPAPP-AMoM ### ### ### ### ### ### ### ### ### ### ### ### ### ### ### ### ### ### ### ### ### 0.8 1.0 1.2 n = 2 7 n = 2 9 n = 3 3 n = 3 4 n = 3 5 n = 3 7 n = 3 8 n = 4 7 n = 6 6 n = 6 8 n = 7 0 n = 7 5 n = 7 7 n = 7 9 n = 8 0 n = 9 9 n = 1 0 4 n = 1 0 4 n = 1 0 9 n = 1 5 3 n = 1 8 6 PAPP-AMoMhCGβMoM Operator Operator
  • 34.
    Why operator effectson biochemistry? • Causes include – case mix – sample preparation – storage – transportation – CRL measurement
  • 35.
    PAPP-A by gestation Gestation(days) PAPP-A 50 60 70 80 90 100 0.1 0.2 0.5 1.0 2.0 5.0 Wk 7 Wk 8 Wk 9 Wk 10 Wk 11 Wk 12 Wk 13
  • 36.
    PAPP-A by gestation Gestation(days) PAPP-A 50 60 70 80 90 100 0.1 0.2 0.5 1.0 2.0 5.0 Wk 7 Wk 8 Wk 9 Wk 10 Wk 11 Wk 12 Wk 13  MoM = 1
  • 37.
    PAPP-A by gestation Gestation(days) PAPP-A 50 60 70 80 90 100 0.1 0.2 0.5 1.0 2.0 5.0 Wk 7 Wk 8 Wk 9 Wk 10 Wk 11 Wk 12 Wk 13  MoM = 1  MoM = 0.57
  • 38.
    Free β-hCG bygestation Gestation (days) hCGbeta 50 60 70 80 90 100 5 10 20 30 40 50 60 80 100 150 200 250 Wk 7 Wk 8 Wk 9 Wk 10 Wk 11 Wk 12 Wk 13  MoM = 1 MoM =1.2 
  • 39.
    Effects of CrownRump Length (CRL) biases on biochemistry MoM values (NT and biochemistry at 12 weeks risk cut-off 1 in 150 at term) CRL Error Error in GA Median MoM (mm) (days) PAPP-A hCG beta DR FPR -5 -2.7 1.17 0.93 80% 1.4% -4 -2.2 1.13 0.94 81% 1.6% -3 -1.6 1.10 0.96 82% 1.9% -2 -1.1 1.06 0.97 83% 2.0% -1 -0.5 1.03 0.99 84% 2.4% 0 0.0 1.00 1.00 85% 2.7% 1 0.5 0.97 1.01 86% 3.1% 2 1.0 0.94 1.03 86% 3.7% 3 1.6 0.92 1.04 87% 4.1% 4 2.1 0.89 1.06 88% 4.8% 5 2.6 0.87 1.07 89% 5.5% Down’s syndrome presents as biochemical immaturity so effects of errors on PAPP-A and free β-hCG combine.
  • 40.
    Crown-rump length (mm) Nuchaltranslucency(mm) 4550 55 60 65 70 75 80 85 0.5 1 2 3 4 5 6 7 8 Impact of NT on risks
  • 41.
    Crown-rump length (mm) Nuchaltranslucency(mm) 4550 55 60 65 70 75 80 85 0.5 1 2 3 4 5 6 7 8 Impact of NT on risks
  • 42.
    Impact of NTon risks Crown-rump length (mm) Nuchaltranslucency(mm) 45 50 55 60 65 70 75 80 85 0.5 1 2 3 4 5 6 7 8
  • 43.
  • 44.
    DQASS • The aimis to monitor and support the quality and effectiveness of screening • Provide feedback on all aspects of the test to laboratories, ultrasound departments and commercial suppliers. • Through meta-analyses DQASS provides information on effects of factors such a smoking that can be used to improve screening performance.
  • 45.
    Report production Feedback & advice Improvements Data submissions Lab reports~40 per year Cycle reports A Two Day Workshop Thursday 17 and Friday 18 January 2008 DQASS Workshop on Standardisation, Monitoring and Updating Medians: Why, When and How? Presented by: Amy Baker Barry Nix Dave Worthington Dave Wright Workshops Individualised feedback to all sonographers on all scan measurements ~20002 (from April 2010) NuchalTranslucency(mm) ID: 49057 (n = 184) Crown-rump length (mm) Cycle 5 From: 16/05/2008 To: 31/10/2008 40 45 50 55 60 65 70 75 80 85 90 0.0 0.5 1.0 1.5 2.0 2.5 3.0 3.5 4.0 68(37%) 116(63%) Bias =0.08mm 4NTvalues greaterthan4mmshownas 4mm NuchalTranslucency(mm) ID: 49057 (n = 184) Crown-rump length (mm) Cycle 5 From: 16/05/2008 To: 31/10/2008 40 45 50 55 60 65 70 75 80 85 90 0.0 0.5 1.0 1.5 2.0 2.5 3.0 3.5 4.0 68(37%) 116(63%) Bias =0.08mm 4NTvalues greaterthan4mmshownas 4mm NuchalTranslucency(mm) ID: 49057 (n = 184) Crown-rump length (mm) Cycle 5 From: 16/05/2008 To: 31/10/2008 40 45 50 55 60 65 70 75 80 85 90 0.0 0.5 1.0 1.5 2.0 2.5 3.0 3.5 4.0 68(37%) 116(63%) Bias =0.08mm 4NTvalues greaterthan4mmshownas 4mm NuchalTranslucency(mm) ID: 49057 (n = 184) Crown-rump length (mm) Cycle 5 From: 16/05/2008 To: 31/10/2008 40 45 50 55 60 65 70 75 80 85 90 0.0 0.5 1.0 1.5 2.0 2.5 3.0 3.5 4.0 68(37%) 116(63%) Bias =0.08mm 4NTvalues greaterthan4mmshownas 4mm DQASS
  • 46.
  • 47.
    DQASS diagnostics for biochemistry •MoM values should be centred on 1.0 when viewed together, by gestation, by weight, by smoking status, by ethnicity … • Small deviations from this target can have important implications for screening
  • 48.
    Gestational age Gestation (weeks) MoMPAPP-A 1011 12 13 14 0.7 0.8 0.9 1.0 1.1 1.2 1.3 1.4 1.5 1.6 1.7 n= 28 n= 227 n= 1137 n= 3710 n= 2539 n= 11 Gestation (weeks) MoMPAPP-A 10 11 12 13 14 0.7 0.8 0.9 1.0 1.1 1.2 1.3 1.4 1.5 1.6 1.7 n= 2066 n= 6793 n= 3234 n= 25 Cycle 2 Cycle 7 48
  • 49.
    Maternal weight Weight group MoMFreebeta-hCG <50kg 50-60kg 60-70kg 70-80kg 80-90kg 90-100kg 100-110kg 110-120kg >120kg 0.7 0.8 0.9 1.0 1.1 1.2 1.3 n=368 n= 1818 n= 2404 n= 1409 n= 706 n= 385 n= 170 n= 88 n= 46 Weight group MoMFreebeta-hCG <50kg 50-60kg 60-70kg 70-80kg 80-90kg 90-100kg 100-110kg 110-120kg >120kg 0.7 0.8 0.9 1.0 1.1 1.2 1.3 1.4 1.5 n=638 n=3043 n=3870 n=2326 n=1211 n=614 n=273 n=136 n=88 Cycle 2 Cycle 7 49
  • 50.
    Smoking status Cycle 2 Cycle7 Smoking status MoMInhibin No Yes 0.7 0.8 0.9 1.0 1.1 1.2 1.3 1.4 1.5 n= 4729 n= 1119 Smoking status MoMInhibin Non-Smoker Smoker 0.7 0.8 0.9 1.0 1.1 1.2 1.3 1.4 1.5 n= 2821 n= 563 50
  • 51.
    Ethnicity Cycle 2 Cycle 7 Ethnicorigin MoMPAPP-A Caucasian Afro-Caribbean Asian Mixed Oriental 0.7 0.8 0.9 1.0 1.1 1.2 1.3 1.4 1.5 1.6 1.7 n= 7907 n= 2054 n= 563 n= 373 n= 176 Ethnic origin MoMPAPP-A Caucasian Afro-Caribbean Asian Oriental Other 0.7 0.8 0.9 1.0 1.1 1.2 1.3 1.4 1.5 n=7881 n=1979 n=1608 n=263 n=469 51
  • 52.
    CUSUM 52 Time 1 23 4 5 6 7 8 9 10 Deviation from target 0 0 0 0 0.5 0.5 0.5 0.5 0.5 0.5 Cumulative sum 0 0 0 0 0.5 1 1.5 2 2.5 3 0 0.5 1 1.5 2 2.5 3 3.5 0 2 4 6 8 10 12 CUSUM Time
  • 53.
    Change points A changeof -10% was introduced around the middle of September. This is detected relatively quickly. A change of -5% was introduced around the middle of September. This takes longer to detect. 53
  • 54.
    CUSUM charts fordetecting change points
  • 55.
  • 56.
    NuchalTranslucency(mm) ID: 49057 (n= 184) Crown-rump length (mm) 40 45 50 55 60 65 70 75 80 85 90 0.0 0.5 1.0 1.5 2.0 2.5 3.0 3.5 4.0 68 (37%) 116 (63%) 4 NTvalues greaterthan 4mmshownas 4mm Expected relationship with CRL Expected degree of scatter about the curve DQASS Diagnostics: Nuchal Translucency
  • 57.
    NuchalTranslucency(mm) ID: Sample (n= 300) Crown-rump length (mm) Cycle From: NA To: NA 40 45 50 55 60 65 70 75 80 85 90 0.0 0.5 1.0 1.5 2.0 2.5 3.0 3.5 4.0 152 (51%) 148 (49%) Bias = 0mm
  • 58.
    NuchalTranslucency(mm) ID: Sample (n= 300) Crown-rump length (mm) Cycle From: NA To: NA 40 45 50 55 60 65 70 75 80 85 90 0.0 0.5 1.0 1.5 2.0 2.5 3.0 3.5 4.0 152 (51%) 148 (49%) Bias = 0mm NuchalTranslucency(mm) ID: Sample (n = 300) Crown-rump length (mm) Cycle From: NA To: NA 40 45 50 55 60 65 70 75 80 85 90 0.0 0.5 1.0 1.5 2.0 2.5 3.0 3.5 4.0 287 (96%) 13 (4%) Bias = -0.58mm Bias
  • 59.
    NuchalTranslucency(mm) ID: Sample (n= 300) Crown-rump length (mm) Cycle From: NA To: NA 40 45 50 55 60 65 70 75 80 85 90 0.0 0.5 1.0 1.5 2.0 2.5 3.0 3.5 4.0 152 (51%) 148 (49%) Bias = 0mm Bias NuchalTranslucency(mm) ID: Sample (n = 300) Crown-rump length (mm) Cycle From: NA To: NA 40 45 50 55 60 65 70 75 80 85 90 0.0 0.5 1.0 1.5 2.0 2.5 3.0 3.5 4.0 12 (4%) 288 (96%) Bias = 0.55mm 1 NT value greater than 4mm shown as 4mm
  • 60.
  • 61.
  • 62.
  • 63.
    0.0 0.1 0.20.3 0.4 0.5 0.6 020406080100 Bias (mm) Proportionoftests 10% of all scans, bias of 0.60mm Illustration (n = 4 sonographers)
  • 64.
    0.0 0.1 0.20.3 0.4 0.5 0.6 Bias (mm) Proportionoftests Illustration (n = 4 sonographers) 30% of all scans, bias of 0.34mm 020406080100
  • 65.
    0.0 0.1 0.20.3 0.4 0.5 0.6 020406080100 Bias (mm) Proportionoftests Area = Average bias Illustration (n = 4 sonographers)
  • 66.
    0.0 0.1 0.20.3 0.4 0.5 0.6 Bias (mm) Proportionoftests Illustration (n = 4 sonographers) 020406080100
  • 67.
    0.0 0.1 0.20.3 0.4 0.5 0.6 020406080100 Bias (mm) Proportionoftests Illustration (n = 4 sonographers)
  • 68.
  • 69.
    Other outputs fromDQASS Parameter estimates for configuring the screening program. Example: Twin effect for Inhibin-A. MoM 1.4 1.6 1.8 2 2.2 2.4 2.6 2.8 3 3.2 3.4 Cycle 18 Cycle 19 Pooled
  • 70.
  • 71.
  • 72.
    NuchalTranslucency(mm) ID: Sample (n= 300) Crown-rump length (mm) Cycle From: NA To: NA 40 45 50 55 60 65 70 75 80 85 90 0.0 0.5 1.0 1.5 2.0 2.5 3.0 3.5 4.0 152 (51%) 148 (49%) Bias = 0mm Spread NuchalTranslucency(mm) ID: Sample (n = 300) Crown-rump length (mm) Cycle From: NA To: NA 40 45 50 55 60 65 70 75 80 85 90 0.0 0.5 1.0 1.5 2.0 2.5 3.0 3.5 4.0 159(53%) 141(47%) Bias =-0.01mm Spreaddecreased: 0.43
  • 73.
    NuchalTranslucency(mm) ID: Sample (n= 300) Crown-rump length (mm) Cycle From: NA To: NA 40 45 50 55 60 65 70 75 80 85 90 0.0 0.5 1.0 1.5 2.0 2.5 3.0 3.5 4.0 152 (51%) 148 (49%) Bias = 0mm Trend NuchalTranslucency(mm) ID: Sample (n = 300) Crown-rump length (mm) Cycle From: NA To: NA 40 45 50 55 60 65 70 75 80 85 90 0.0 0.5 1.0 1.5 2.0 2.5 3.0 3.5 4.0 130(43%) 170(57%) Bias =0.09mm Trenddeviation 2NTvalues greaterthan4mmshownas 4mm
  • 74.
    NuchalTranslucency(mm) ID: Sample (n= 300) Crown-rump length (mm) Cycle From: NA To: NA 40 45 50 55 60 65 70 75 80 85 90 0.0 0.5 1.0 1.5 2.0 2.5 3.0 3.5 4.0 152 (51%) 148 (49%) Bias = 0mm Trend NuchalTranslucency(mm) ID: Sample (n = 300) Crown-rump length (mm) Cycle From: NA To: NA 40 45 50 55 60 65 70 75 80 85 90 0.0 0.5 1.0 1.5 2.0 2.5 3.0 3.5 4.0 168 (56%) 132 (44%) Bias = -0.07mm Trend deviation 1 NT value greater than 4mm shown as 4mm
  • 75.
  • 76.
  • 77.
  • 78.
  • 79.
    End of cyclereports Cycle 14 report April 2013 to September 2013
  • 80.
    Cycle reports forbiochemistry- PAPP-A Estimated proportion of median MoMs outside 5% Best Worst DQASS 88 DQASS 99
  • 81.
    Cycle reports forNT - National
  • 82.
    Cycle reports forNT - Region x
  • 83.
  • 84.
    Rationale • Need forsufficient precision to estimate performance (standardised SPR) • To enable monitoring of laboratory medians and early detection of change points • For proficiency/expertise
  • 85.
  • 86.
    DQASS • Feedback andsupport to sonographers laboratories, hospitals and suppliers • Monitoring at the local and national level • A national database: evidence on screening parameters, effects of smoking ethnicity etc
  • 87.
  • 88.
  • 89.
  • 90.
    Cycle by cyclefeedback to individual laboratories 0 10 20 30 40 50 60 AFP hCG uE3 Inhibin Estimatedproportion(%)ofMoMvalues outside5% Cycle 1 Cycle 2 Cycle 3
  • 91.
  • 92.
    0.0 0.1 0.20.3 0.4 0.5 0.6 020406080100 Bias (mm) Proportionoftests 10% of all scans, bias of 0.60mm Illustration (n = 4 sonographers)
  • 93.
    0.0 0.1 0.20.3 0.4 0.5 0.6 Bias (mm) Proportionoftests Illustration (n = 4 sonographers) 30% of all scans, bias of 0.34mm 020406080100
  • 94.
    0.0 0.1 0.20.3 0.4 0.5 0.6 020406080100 Bias (mm) Proportionoftests Area = Average bias Illustration (n = 4 sonographers)
  • 95.
    0.0 0.1 0.20.3 0.4 0.5 0.6 Bias (mm) Proportionoftests Illustration (n = 4 sonographers) 020406080100
  • 96.
    0.0 0.1 0.20.3 0.4 0.5 0.6 020406080100 Bias (mm) Proportionoftests Illustration (n = 4 sonographers)
  • 97.
    0.0 0.1 0.20.3 0.4 0.5 0.6 0.7 0 10 20 30 40 50 60 70 80 90 100 Bias (mm) ProportionofWomenScreened National Cycle 8: Reference Cycle 12: Cycle 11: Cycle 10: Cycle 12: 1841 Sonographers 203601 Scans 1.24% < 25 scans Cycle 11: 1759 Sonographers 188472 Scans 1.37% < 25 scans Cycle 10: 1599 Sonographers 167944 Scans 1.91% < 25 scans 46.92% 42.38% 6.91% 3.79% 57.55% 38.40% 3.29% 0.77% 60.94% 36.39% 2.08% 0.59% DQASS NT-QA
  • 98.
    Highlights • Consistency ofprovision • Evidenced improvement is quality • Improved outcomes
  • 99.
    Consistent provision March 2007:SPR 5.9% September 2012: SPR 2.5% Combined 15% Quadruple 9% Triple 48% Double 27% Integrated 1% Combined Quadruple Triple Double Integrated Combined 80% Quadruple 19% Integrated 1%
  • 100.
    Cycle Scans (000,s)Sonograhers (n) Green (%) 8 (Apr-Sep 2010) 102 884 35 9 128 1,160 39 10 168 1,599 47 11 188 1,759 58 12 (Apr-Sep 2012) 204 1,841 61 Improving Quality
  • 101.
    0 10 20 30 40 50 60 70 80 90 100 8 9 1011 12 Proportiongreen(%) Cycle Improving Quality All regions
  • 102.
    What Next • Choiceof screening test • Choice of risk cut-off • QA of screening (what, why, how) • DQASS Reports • Monitoring program performance
  • 103.
  • 104.
    Double Test: AFP+ hCG False Positive Rate (%) DetectionRate(%) 0 2 4 6 8 10 020406080100 1 in 100 1 in 150 1 in 200 1 in 250
  • 105.
    Double Test: AFP+ free beta hCG False Positive Rate (%) DetectionRate(%) 0 2 4 6 8 10 020406080100 1 in 100 1 in 150 1 in 200 1 in 250
  • 106.
    Triple Test: AFP+ hCG + uE3 False Positive Rate (%) DetectionRate(%) 0 2 4 6 8 10 020406080100 1 in 100 1 in 150 1 in 200 1 in 250
  • 107.
    Triple Test: AFP+ free beta hCG + uE3 False Positive Rate (%) DetectionRate(%) 0 2 4 6 8 10 020406080100 1 in 100 1 in 150 1 in 200 1 in 250
  • 108.
    Combined Test: NT+ free beta hCG + PAPP-A Week 11 False Positive Rate (%) DetectionRate(%) 0 2 4 6 8 10 020406080100 1 in 100 1 in 150 1 in 200 1 in 250
  • 109.
    Combined Test: NT+ free beta hCG + PAPP-A Week 12 False Positive Rate (%) DetectionRate(%) 0 2 4 6 8 10 020406080100 1 in 100 1 in 150 1 in 200 1 in 250
  • 110.
    Combined Test: NT+ free beta hCG + PAPP-A Week 13 False Positive Rate (%) DetectionRate(%) 0 2 4 6 8 10 020406080100 1 in 100 1 in 150 1 in 200 1 in 250
  • 111.
    Quad test (hCG) FalsePositive Rate (%) DetectionRate(%) 0 2 4 6 8 10 020406080100 1 in 100 1 in 150 1 in 200 1 in 250
  • 112.
    Quad test (freebeta hCG) False Positive Rate (%) DetectionRate(%) 0 2 4 6 8 10 020406080100 1 in 100 1 in 150 1 in 200 1 in 250
  • 113.
    Integrated Test Week 11 FalsePositive Rate (%) DetectionRate(%) 0 2 4 6 8 10 020406080100 1 in 100 1 in 150 1 in 200 1 in 250
  • 114.
    Integrated Test Week 12 FalsePositive Rate (%) DetectionRate(%) 0 2 4 6 8 10 020406080100 1 in 100 1 in 150 1 in 200 1 in 250
  • 115.
    Integrated Test Week 13 FalsePositive Rate (%) DetectionRate(%) 0 2 4 6 8 10 020406080100 1 in 100 1 in 150 1 in 200 1 in 250
  • 116.
  • 117.
    Overview • What – Quickoverview of first and second trimester screening • Why – The effects of errors from different sources • How – The DQASS process
  • 118.
    DQASS A service, fundedby the NHS, to support the improvement of quality and effectiveness of prenatal screening in the UK Based in Plymouth, Devon Louise Armitage Amy Baker Andy Baker* Nathan Eastwood* Barry Nix Paul Newell* Dave Worthington Dave Wright Jade
  • 119.
    Report production FeedbackImprovements Data submissions Quality Assurance SupportService People (2.8 full time equivalents): Louise Armitage (admin) Amy Baker Andy Bailey Paul Newell Dave Wright Dave Worthington (Biochemist) Barry Nix (Statistician) Statisticians DQASS Cycle 1 Cycle 2 Cycle 3 Cycle 4 Cycle 5 Cycle 6 Cycle 7 Cycle 8 Cycle 9 Oct-06 Mar 07 Apr 07 Sep-07 Oct-07 Mar-08 Apr 08 Sep-08 Oct-08 Mar-09 Apr 09Sep-09 Oct-09 Mar-10 Apr 10 Sep-10 Oct-10 Mar-11
  • 120.
    20082011 PND type Number 2003/2004 Number 2004/2005 Number 2005/2006 Number 2006/2007 Number 2007/2008 Number 2008/2009 Number 2009/2010 Amnio 28,700 24,349 22,62514,733 12,932 12,145 9,894 CVS 8,268 7,980 7,819 4, 781 4,681 3,520 3,701 *TOTA L 36,968 32,329 30,444 19,514 17,613 15,665 13,595 Total screening tests PND as % of screening tests Total births Percentage acceptance 365,775 4.81% 409,346 3.83% 427,527 3.18% 690,721 708, 711 706,248 52.95% 57.76% 60.53% Improved Outcomes: Invasive Tests
  • 121.
    0 1000 20003000 4000 5000 -100-50050 Sample log(MoM)
  • 122.
    Second trimester tripleand quadruple test
  • 123.
    AFP Weight (kg) AFPMoM 40 5060 70 80 90 100 120 140 0.2 0.4 0.6 0.8 1.0 1.2 1.4 1.6 1.8 2.0 Gestation (days) AFP 100 110 120 130 140 150 20 30 40 50 60 70 80 Wk 15 Wk 16 Wk 17 Wk 18 Wk 19 Wk 20 123
  • 124.
    AFP Effects on AFP MoMAFP 0.1 0.5 1.0 1.5 2.0 3.0 Trisomy 21 Trisomy 18 Trisomy 13 African Caribbean Chinese Oriental Asian Bangladeshi Indian Pakistani Smoking 124
  • 125.
    uE3 Weight (kg) uE3MoM 40 5060 70 80 90 110 130 150 0.2 0.4 0.6 0.8 1.0 1.2 1.4 1.6 1.8 2.0 Gestation (days) uE3 100 110 120 130 140 150 1 2 3 4 5 6 7 8 10 15 20 Wk 15 Wk 16 Wk 17 Wk 18 Wk 19 Wk 20 125
  • 126.
    Effects on uE3 MoMuE3 0.1 0.5 1.0 1.5 2.0 3.0 Trisomy 21 Trisomy 18 Trisomy 13 African Caribbean Chinese Oriental Asian Bangladeshi Indian Pakistani Smoking uE3 126
  • 127.
    hCG Weight (kg) hCGMoM 40 5060 70 80 90 100 120 140 0.2 0.4 0.6 0.8 1.0 1.2 1.4 1.6 1.8 2.0 Gestation (days) hCG 100 110 120 130 140 150 10 20 30 40 50 Wk 15 Wk 16 Wk 17 Wk 18 Wk 19 Wk 20 127
  • 128.
    hCG Effects on hCG MoMhCG 0.1 0.5 1.0 1.5 2.0 3.0 Trisomy 21 Trisomy 18 Trisomy 13 African Caribbean Chinese Asian Indian Pakistani Smoking 128
  • 129.
    Free β-hCG (T2) Weight(kg) FreebetahCGMoM 40 50 60 70 80 90 100 120 140 0.2 0.4 0.6 0.8 1.0 1.2 1.4 1.6 1.8 2.0 Gestation (days) FreebetahCG 100 110 120 130 140 150 5 10 15 20 25 30 Wk 15 Wk 16 Wk 17 Wk 18 Wk 19 Wk 20 129
  • 130.
    Free β-hCG (T2) Effectson Free ß-hCG (T2) MoM Free ß-hCG (T2) 0.1 0.5 1.0 1.5 2.0 3.0 Trisomy 21 African Caribbean Black Other Asian Bangladeshi Indian Pakistani Other Asian Chinese Oriental Smoking 130
  • 131.
    Gestation (days) Inhibin 100 110120 130 140 150 100 150 200 250 300 Weight (kg) InhibinMoM 40 50 60 70 80 90 100 120 140 0.2 0.4 0.6 0.8 1.0 1.2 1.4 1.6 1.8 2.0 Inhibin 131
  • 132.
    Effects on Inhibin MoMInhibin 0.1 0.5 1.0 1.5 2.0 3.0 Trisomy 21 Asian Caribbean Smoking Inhibin 132
  • 133.
  • 134.
    The (near) perfectworld of biochemistry Cyprus Gestation (weeks) PAPP-AMoM 7 8 9 10 11 12 13 0.8 0.9 1.0 1.1 1.2 1.3 1.4 1.5 n= 812 n= 4787 n= 4231 n= 1426 n= 311 n= 72 n Median Standard The median MoM value for any sub-population defined by time period, gestational age, maternal weight, smoking status and ethnicity should lie within 5% of the target value of 1. Median MoM by gestation
  • 135.
    Communication with sonographers DQASS Screeningsupport sonographers (165) Sonographers (1,950) Sonographer reports Hospital reports Cycle reports Regional reports Training Regional meeting Annual meetings