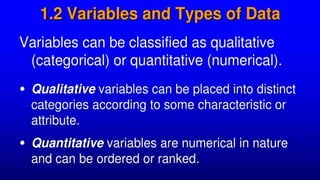
DEFINITION OF STATISTICS
➢The word statistics have been derived from
Latin word “ Status” or the Italian word
“ Statista” which means “ Political States “
or a Government.
➢ STATISTICS is the science of conducting
studies to collect, organize, summarize,
analyze, and draw conclusions from data.
7.
APPLICATION OF STATISTICS
➢In Education
➢ In business & economics
➢ In Government
➢ In sociology and population
dynamics
➢ In research
8.
APPLICATION OF STATISTICS
InEducation
➢ Statistics gives information about school’s population
change ( statistics in enrollment and dropout rate)
➢ helps in processing certain evaluations and surveys
given to improve the school system
➢ determine the relationship of educational
performance to other factors such as socioeconomic
background
➢ analyzes the achievement, grades and in preparations
of test (proficiency level)
9.
APPLICATION OF STATISTICS
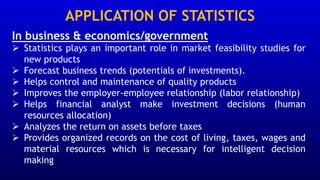
Inbusiness & economics/government
➢ Statistics plays an important role in market feasibility studies for
new products
➢ Forecast business trends (potentials of investments).
➢ Helps control and maintenance of quality products
➢ Improves the employer-employee relationship (labor relationship)
➢ Helps financial analyst make investment decisions (human
resources allocation)
➢ Analyzes the return on assets before taxes
➢ Provides organized records on the cost of living, taxes, wages and
material resources which is necessary for intelligent decision
making
10.
APPLICATION OF STATISTICS
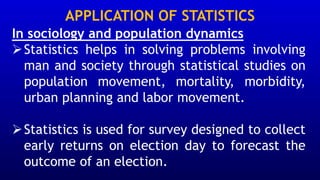
Insociology and population dynamics
➢Statistics helps in solving problems involving
man and society through statistical studies on
population movement, mortality, morbidity,
urban planning and labor movement.
➢Statistics is used for survey designed to collect
early returns on election day to forecast the
outcome of an election.
11.
APPLICATION OF STATISTICS
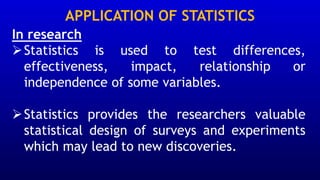
Inresearch
➢Statistics is used to test differences,
effectiveness, impact, relationship or
independence of some variables.
➢Statistics provides the researchers valuable
statistical design of surveys and experiments
which may lead to new discoveries.
12.
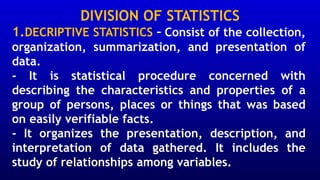
DIVISION OF STATISTICS
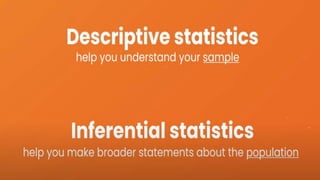
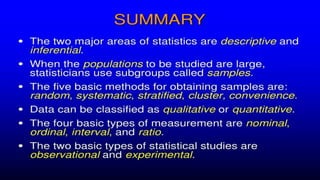
1.DECRIPTIVESTATISTICS – Consist of the collection,
organization, summarization, and presentation of
data.
- It is statistical procedure concerned with
describing the characteristics and properties of a
group of persons, places or things that was based
on easily verifiable facts.
- It organizes the presentation, description, and
interpretation of data gathered. It includes the
study of relationships among variables.
13.
DIVISION OF STATISTICS
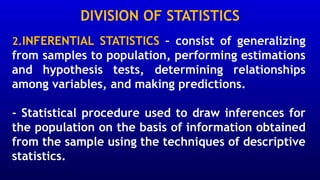
2.INFERENTIALSTATISTICS – consist of generalizing
from samples to population, performing estimations
and hypothesis tests, determining relationships
among variables, and making predictions.
- Statistical procedure used to draw inferences for
the population on the basis of information obtained
from the sample using the techniques of descriptive
statistics.
14.
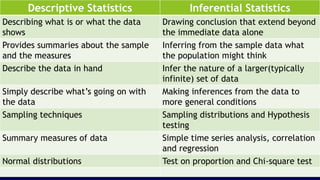
Descriptive Statistics InferentialStatistics
Describing what is or what the data
shows
Drawing conclusion that extend beyond
the immediate data alone
Provides summaries about the sample
and the measures
Inferring from the sample data what
the population might think
Describe the data in hand Infer the nature of a larger(typically
infinite) set of data
Simply describe what’s going on with
the data
Making inferences from the data to
more general conditions
Sampling techniques Sampling distributions and Hypothesis
testing
Summary measures of data Simple time series analysis, correlation
and regression
Normal distributions Test on proportion and Chi-square test
15.
Descriptive Statistics InferentialStatistics
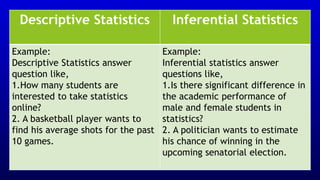
Example:
Descriptive Statistics answer
question like,
1.How many students are
interested to take statistics
online?
2. A basketball player wants to
find his average shots for the past
10 games.
Example:
Inferential statistics answer
questions like,
1.Is there significant difference in
the academic performance of
male and female students in
statistics?
2. A politician wants to estimate
his chance of winning in the
upcoming senatorial election.
50.
"Mathematics is thelanguage with
which God has written the universe.
In our modern world, it helps us
unlock the mysteries of science,
technology, and innovation.“
THANK You!