Đề tieng anh thpt 2024 danh cho cac ban hoc sinh
1- Arrange your calculated SO2 emission intensity for the Chinese prov.pdf
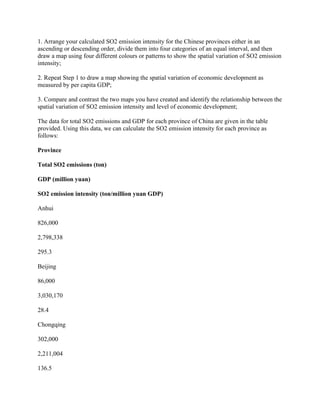
1. 1. Arrange your calculated SO2 emission intensity for the Chinese provinces either in an
ascending or descending order, divide them into four categories of an equal interval, and then
draw a map using four different colours or patterns to show the spatial variation of SO2 emission
intensity;
2. Repeat Step 1 to draw a map showing the spatial variation of economic development as
measured by per capita GDP;
3. Compare and contrast the two maps you have created and identify the relationship between the
spatial variation of SO2 emission intensity and level of economic development;
The data for total SO2 emissions and GDP for each province of China are given in the table
provided. Using this data, we can calculate the SO2 emission intensity for each province as
follows:
Province
Total SO2 emissions (ton)
GDP (million yuan)
SO2 emission intensity (ton/million yuan GDP)
Anhui
826,000
2,798,338
295.3
Beijing
86,000
3,030,170
28.4
Chongqing
302,000
2,211,004
136.5