
Recommended
More Related Content
What's hot
What's hot (20)
Similar to Dose response relationship
Similar to Dose response relationship (20)
More from Heena Parveen
More from Heena Parveen (20)
Recently uploaded
Recently uploaded (20)
Dose response relationship
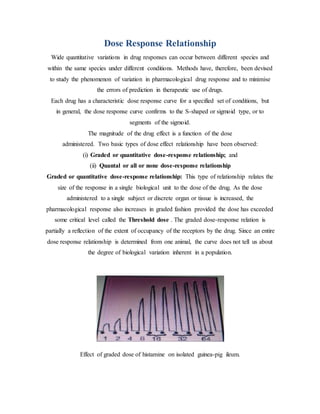
- 1. Dose Response Relationship Wide quantitative variations in drug responses can occur between different species and within the same species under different conditions. Methods have, therefore, been devised to study the phenomenon of variation in pharmacological drug response and to minimise the errors of prediction in therapeutic use of drugs. Each drug has a characteristic dose response curve for a specified set of conditions, but in general, the dose response curve confirms to the S-shaped or sigmoid type, or to segments of the sigmoid. The magnitude of the drug effect is a function of the dose administered. Two basic types of dose effect relationship have been observed: (i) Graded or quantitative dose-response relationship; and (ii) Quantal or all or none dose-response relationship Graded or quantitative dose-response relationship: This type of relationship relates the size of the response in a single biological unit to the dose of the drug. As the dose administered to a single subject or discrete organ or tissue is increased, the pharmacological response also increases in graded fashion provided the dose has exceeded some critical level called the Threshold dose . The graded dose-response relation is partially a reflection of the extent of occupancy of the receptors by the drug. Since an entire dose response relationship is determined from one animal, the curve does not tell us about the degree of biological variation inherent in a population. Effect of graded dose of histamine on isolated guinea-pig ileum.
- 2. The degree of response produced by increasing doses of a drug eventually reaches a steady level, termed as the ceiling response, and the dose with which it is obtained is the ceiling dose. If the dose exceeds the ceiling dose, there is no further increase in the therapeutic effect. In fact, such a dose may provoke different and possibly undesirable responses. The ceiling dose allows us to compare the therapeutic efficacy of various compounds. The latter is particularly useful for the comparison of various compounds. Dose-response relationship curve from the data in Same dose-response relationship plotted on logarithmic scale.
- 3. Quantal or all or none dose-response relationship: In contrast to graded responses, the quantal responses are all or none. The quantal curve shows the frequency with which any dose of a drug evokes a stated, fixed (all or none) pharmacological response in a subject population. It is, therefore, essentially a frequency distribution of the responders (actual numbers or percentage of the total number of subjects) to different doses of the drug. Each subject is categorised as responding or non-responding, according to a prior decided criterion of response. While studying an anti-epileptic drug in animals, each animal is classified as responding (seizure-free) or not responding at a specified time after the drug treatment. Obviously, sensitive animals will respond to smaller doses while some will be resistant and need very large doses. Usually, the sensitivity of animals to different doses is distributed normally with respect to the logarithm of the dose. Thus, for a given drug, if log dose is plotted on the horizontal axis and the % responding to the various dose levels is plotted on the vertical axis, a Gaussian (normal) distribution is obtained . The curve represents the distribution of sensitivity of a group of animals to the given drug. In this figure about 10 % of the animals in a given population remain seizure-free at a dose level of log dose ‘0’, while another 10 % do not respond until the dose is increased to log dose ‘2’. Majority of the animals, however, respond at doses between ‘0.5’ and ‘1.5’ on the log scale. The same data, plotted as the cumulative number of animals that responded against log dose, would give an S shaped cumulative frequency curve. For a given dose of a drug, a cumulative frequency curve gives the per cent of animals responding to that dose and to lower doses. Quantal dose response curve
- 4. The quantal dose response curve, however, is not always exactly symmetrical or bell-shaped but may show ‘skewing’ or ‘truncation’. This shows that besides polygenic random variation, non-random but inter-coupled events like other actions of the drug and experimental limitations influence the quantal dose response curve. Therapeutic Index: Therapeutic index (TI) : It is an approximate assessment of the safety of the drug. It is expressed as the ratio of the median lethal dose to the median effective dose. Effective Dose: The median effective dose or ED50 : This is the dose (mg/kg) which produces a desired response in 50 per cent of the test population. The quantal dose–response curve represents estimates of the frequency with which each dose elicits the desired response in the population. In addition to this information, it also would be useful to have some way to express the average sensitivity of the entire population to phenobarbital. This is done through the calculation of an ED50 (effective dose, 50%; i.e., the dose that would protect 50% of the animals). This value can be obtained from the dose–response curve. The ED50 for phenobarbital in this population is approximately 4mg/kg. Lethal Dose: The median lethal dose or LD50 : This is the dose (mg/kg) which would be expected to kill one-half of an unlimited population of the same species and strain. Another important characteristic of a drug’s activity is its toxic effect. Obviously, the ultimate toxic effect is death. A curve similar to that already discussed can be constructed by plotting percent of animals killed by phenobarbital against dose. From this curve, one can calculate the LD50 (lethal dose, 50%). Since the degree of safety associated with drug administration depends on an adequate separation between doses producing a therapeutic effect (e.g., ED50) and doses producing toxic effects (e.g., LD50), one can use a comparison of these two doses to estimate drug safety. Thus, one estimate of a drug’s margin of safety is the ratio LD50/ED50; this is the therapeutic index. The therapeutic index for phenobarbital used as an anticonvulsant is approximately 40/4,or 10 .
- 5. As a general rule, a drug should have a high therapeutic index; however, some important therapeutic agents have low indices. For example, although the therapeutic index of the cardiac glycosides is only about 2 for the treatment and control of cardiac failure, these drugs are important for many cases of cardiac failure. Therefore, in spite of a low margin of safety, they are often used for this condition. The identification of a low margin of safety, however, dictates particular caution in its use; the appropriate dose for each individual must be determined separately. It has been suggested that a more realistic estimate of drug safety would include a comparison of the lowest dose that produces toxicity (e.g., LD1) and the highest dose that produces a maximal therapeutic response (e.g., ED99). A ratio less than unity would indicate that a dose effective in 99% of the population will be lethal in more than 1% of the individuals taking that dose. Figure indicates that Phenobarbital’s ratio LD1/ED99 is approximately 2. The margin of safety is the difference between the therapeutic and the lethal doses. As the drug metabolism varies from species to species, the TI would also vary. Therapeutic index supplies reliable information when both the LD50 and ED50 are determined for the same strain of a given species. ED50 can be obtained from either quantal or graded dose response curves. As LD50 cannot be worked out in humans, the formula for TI in humans can be restated as: The larger the TI, the safer is the drug. For safe therapeutic application of a compound, its TI must be more than one. Such drugs have very little dose-related toxicity. Thus, penicillin has a very high TI while it is much smaller for digoxin, aminophylline and lidocaine. In practice, no drug produces only a single effect but has a spectrum of effects. Further, a drug may be selective in one respect but nonselective in another. Thus, although antihistaminics selectively block histamine actions, most of them cause significant sedation. For therapeutic purposes, selectivity of a drug effect is clearly one of its more important properties. Thus depending upon its effect, a drug may have many therapeutic
- 6. indices. Example: The margin of safety of aspirin when used for headache is far greater than its margin of safety for the relief of arthritic pain or in rheumatic fever. This is because the latter use requires much larger doses. In clinical practice, there is often a need to use two or more drugs concurrently. The resultant effect may vary depending on the combination used. There may be: (1) Additive effect (Summation): When the total pharmacological action of two or more drugs administered together is equivalent to the sum of their individual pharmacological actions (1+1=2), the phenomenon is termed as an additive effect e.g. combination of aspirin and paracetamol in the treatment of pain and fever. (2) Synergism: Facilitation of a pharmacological response by the concomitant use of two or more drugs is called drug synergism. The word synergism is derived from the two Greek words, ergo (work) and syn (with) and indicates a pharmacologic co-operation. This co-operation usually results in a total effect greater than the sum of their independent actions (1+1>2), e.g. codeine and aspirin for pain; hydrochlorothiazide and atenolol for hypertension. If the synergism results in prolongation of action of one of the drugs, it is termed time synergism, e.g. procaine and adrenaline combination increases the duration of action of procaine. The term potentiation is often loosely employed for synergism and should be avoided, as the word ‘potentiate’ means ‘to endow with power’, which no drug is really capable of achieving.