SlideShare a Scribd company logo
1 of 2
Download to read offline
University of Santo Tomas Junior High School
GRADE 8 MATHEMATICS
First Quarter
S.Y. 2015 – 2016
“DO NO HARM.” Notes # 9
CN: ________
NAME: ________________________________________________________________________________________ DATE: SEPTEMBER 02, 2015
SECTION:_________________________________________________________________ TEACHER:__________________________________________
HANDOUT: Frequency Distribution Table
Frequency Distribution – It is a collection of observations produced by sorting them into classes and
showing their frequency (or numbers) of occurrences in each class
A. Ungrouped Frequency Distribution – It results when observations are sorted into
_______________________________________________________________.
B. Grouped Frequency Distribution – It results when observations are sorted into
_______________________________________________________________.
Steps in Constructing a Grouped Frequency Distribution Table:
1. Find the range. Formula: R = _________________________
2. Decide on the number of classes. A ____________ is a grouping or category. Statisticians said that
the ideal number of classes is between 5 and 20.
3. Determine the class size or class width (i). ____________________________ is the size of each class.
*Note: Class widths are always rounded up.
Formula: i = ________________________________
desired number of classes
4. Determine the classes.
5. Tally the observations.
6. Determine the frequency.
Challenge yourself! 
Height of 45 Grade 8 students in cm
170 185 193 169 187 177 165 173 167
173 190 164 175 185 190 178 170 172
178 187 164 190 186 165 165 161 155
176 180 167 189 160 180 164 171 162
185 155 163 165 184 189 170 180 180
Class Tally f Xm f Xm LB UB <cf >cf
7. Find the class marks of each class.
8. Determine the class boundaries.
9. Create columns for the cumulative frequencies.
Committed to Truth;
……Enkindled by Charity
University of Santo Tomas Junior High School
GRADE 8 MATHEMATICS
First Quarter
S.Y. 2015 – 2016
“DO NO HARM.” Notes # 9
Important Terms:
Range – the difference between the highest and lowest score in a set of data.
Frequency – the number of observations belonging to a class interval.
Class Intervals or Class Limits – refers to a grouping defined by a lower limit and an upper
limit. The lower limit of a class is the smallest data value that can be included in the class, and the
upper limit is the largest data value that can be included in the class.
For example:
In the class 19 – 21: lower limit = ________ upper limit = ________
In the class 45 – 47: lower limit = ________ upper limit = ________
Class Boundaries – These are often described as the true limits because these are more
precise expressions of class limits. The lower boundary of a class is 0.5 less than its lower limit,
and the upper boundary is 0.5 more than its upper limit.
For example:
In the class 19 – 21: lower boundary = ________ upper boundary = ________
In the class 45 – 47: lower boundary = ________ upper boundary = ________
Class Mark – It is the midpoint or the middle value in a class. It is obtained by finding the
average of the lower limit and the upper limit.
Class Size or Class Width – refers to the difference between the upper class boundary and the
lower class boundary of a class interval.
Cumulative Frequency – shows how many scores fall below or above a certain level
Assignment for September 03, 2015
Construct a frequency distribution table for the following set of data.
29 27 28 27 34 29 27 27 28
25 23 35 25 29 33 23 27 33
27 22 40 27 21 29 22 25 29
25 21 20 21 23 25 30 20 28
30 29 28 30 27 27 27 19 30

More Related Content

What's hot

Mode of Grouped Data - Math 7 (4th Quarter)
Mode of Grouped Data - Math 7 (4th Quarter)Mode of Grouped Data - Math 7 (4th Quarter)
Mode of Grouped Data - Math 7 (4th Quarter)Carlo Luna
 
Determining measures of central tendency for grouped data
Determining measures of central tendency for grouped dataDetermining measures of central tendency for grouped data
Determining measures of central tendency for grouped dataAlona Hall
 
Measures of Central Tendency
Measures of Central TendencyMeasures of Central Tendency
Measures of Central TendencyRegina Cruz
 
Gr. 7 math lm (q1 to 4)
Gr. 7 math lm (q1 to 4)Gr. 7 math lm (q1 to 4)
Gr. 7 math lm (q1 to 4)rodsanton
 
Summative Test on Measures of Position
Summative Test on Measures of PositionSummative Test on Measures of Position
Summative Test on Measures of PositionJoey Valdriz
 
Lesson Plan- Measures of Central tendency of Data
Lesson Plan- Measures of Central tendency of DataLesson Plan- Measures of Central tendency of Data
Lesson Plan- Measures of Central tendency of DataElton John Embodo
 
Detailed Lesson Plan on Measures of Variability of Grouped and Ungrouped Data
Detailed Lesson Plan on Measures of Variability of Grouped and Ungrouped DataDetailed Lesson Plan on Measures of Variability of Grouped and Ungrouped Data
Detailed Lesson Plan on Measures of Variability of Grouped and Ungrouped DataJunila Tejada
 
Mathematics 9 Six Trigonometric Ratios
Mathematics 9 Six Trigonometric RatiosMathematics 9 Six Trigonometric Ratios
Mathematics 9 Six Trigonometric RatiosJuan Miguel Palero
 
Geometric sequences and geometric means
Geometric sequences and geometric meansGeometric sequences and geometric means
Geometric sequences and geometric meansDenmar Marasigan
 
Circle and Terms related to it.pptx
Circle and Terms related to it.pptxCircle and Terms related to it.pptx
Circle and Terms related to it.pptxJeraldelEncepto
 
Measures of Variability of Grouped and Ungrouped Data
Measures of Variability of Grouped and Ungrouped DataMeasures of Variability of Grouped and Ungrouped Data
Measures of Variability of Grouped and Ungrouped DataJunila Tejada
 
Measures of central tendency (ungrouped data)
Measures of central tendency (ungrouped data)Measures of central tendency (ungrouped data)
Measures of central tendency (ungrouped data)LilianneSoriano
 
MEASURES OF POSITION FOR UNGROUPED DATA : QUARTILES , DECILES , & PERCENTILES
MEASURES OF POSITION FOR UNGROUPED DATA : QUARTILES , DECILES , & PERCENTILESMEASURES OF POSITION FOR UNGROUPED DATA : QUARTILES , DECILES , & PERCENTILES
MEASURES OF POSITION FOR UNGROUPED DATA : QUARTILES , DECILES , & PERCENTILESChuckry Maunes
 
Mathematics 10 - Lesson 1: Number Pattern
Mathematics 10 - Lesson 1: Number PatternMathematics 10 - Lesson 1: Number Pattern
Mathematics 10 - Lesson 1: Number PatternJuan Miguel Palero
 
Percentile For Grouped Data
Percentile For Grouped Data Percentile For Grouped Data
Percentile For Grouped Data Veronica Jomadiao
 
Probability of Simple and Compound Events
Probability of Simple and Compound EventsProbability of Simple and Compound Events
Probability of Simple and Compound EventsJoey Valdriz
 

What's hot (20)

Mode of Grouped Data - Math 7 (4th Quarter)
Mode of Grouped Data - Math 7 (4th Quarter)Mode of Grouped Data - Math 7 (4th Quarter)
Mode of Grouped Data - Math 7 (4th Quarter)
 
Determining measures of central tendency for grouped data
Determining measures of central tendency for grouped dataDetermining measures of central tendency for grouped data
Determining measures of central tendency for grouped data
 
Measures of Central Tendency
Measures of Central TendencyMeasures of Central Tendency
Measures of Central Tendency
 
Gr. 7 math lm (q1 to 4)
Gr. 7 math lm (q1 to 4)Gr. 7 math lm (q1 to 4)
Gr. 7 math lm (q1 to 4)
 
Summative Test on Measures of Position
Summative Test on Measures of PositionSummative Test on Measures of Position
Summative Test on Measures of Position
 
Lesson Plan- Measures of Central tendency of Data
Lesson Plan- Measures of Central tendency of DataLesson Plan- Measures of Central tendency of Data
Lesson Plan- Measures of Central tendency of Data
 
Detailed Lesson Plan on Measures of Variability of Grouped and Ungrouped Data
Detailed Lesson Plan on Measures of Variability of Grouped and Ungrouped DataDetailed Lesson Plan on Measures of Variability of Grouped and Ungrouped Data
Detailed Lesson Plan on Measures of Variability of Grouped and Ungrouped Data
 
Mathematics 9 Six Trigonometric Ratios
Mathematics 9 Six Trigonometric RatiosMathematics 9 Six Trigonometric Ratios
Mathematics 9 Six Trigonometric Ratios
 
Geometric sequences and geometric means
Geometric sequences and geometric meansGeometric sequences and geometric means
Geometric sequences and geometric means
 
Circle and Terms related to it.pptx
Circle and Terms related to it.pptxCircle and Terms related to it.pptx
Circle and Terms related to it.pptx
 
PERCENTILE RANK
PERCENTILE RANKPERCENTILE RANK
PERCENTILE RANK
 
Measures of Variability of Grouped and Ungrouped Data
Measures of Variability of Grouped and Ungrouped DataMeasures of Variability of Grouped and Ungrouped Data
Measures of Variability of Grouped and Ungrouped Data
 
Measures of central tendency (ungrouped data)
Measures of central tendency (ungrouped data)Measures of central tendency (ungrouped data)
Measures of central tendency (ungrouped data)
 
MEASURES OF POSITION FOR UNGROUPED DATA : QUARTILES , DECILES , & PERCENTILES
MEASURES OF POSITION FOR UNGROUPED DATA : QUARTILES , DECILES , & PERCENTILESMEASURES OF POSITION FOR UNGROUPED DATA : QUARTILES , DECILES , & PERCENTILES
MEASURES OF POSITION FOR UNGROUPED DATA : QUARTILES , DECILES , & PERCENTILES
 
Mathematics 10 - Lesson 1: Number Pattern
Mathematics 10 - Lesson 1: Number PatternMathematics 10 - Lesson 1: Number Pattern
Mathematics 10 - Lesson 1: Number Pattern
 
Percentile For Grouped Data
Percentile For Grouped Data Percentile For Grouped Data
Percentile For Grouped Data
 
Probability of Simple and Compound Events
Probability of Simple and Compound EventsProbability of Simple and Compound Events
Probability of Simple and Compound Events
 
Mean for Grouped Data
Mean for Grouped DataMean for Grouped Data
Mean for Grouped Data
 
Math grade 7 learner's module
Math grade 7 learner's moduleMath grade 7 learner's module
Math grade 7 learner's module
 
Lesson plan (inset demo)
Lesson plan (inset demo)Lesson plan (inset demo)
Lesson plan (inset demo)
 

Similar to Frequency Distribution Table Handout

1) Chapter#02 Presentation of Data.ppt
1) Chapter#02 Presentation of Data.ppt1) Chapter#02 Presentation of Data.ppt
1) Chapter#02 Presentation of Data.pptMuntazirMehdi43
 
Utilization of Data: Introduction to Statistics
Utilization of Data: Introduction to StatisticsUtilization of Data: Introduction to Statistics
Utilization of Data: Introduction to StatisticsChristine Mejino
 
Graphical presentation of data
Graphical presentation of dataGraphical presentation of data
Graphical presentation of dataprince irfan
 
Statistics
StatisticsStatistics
Statisticspikuoec
 
Unit 12 lesson 5 measures of variability
Unit 12 lesson 5 measures of variabilityUnit 12 lesson 5 measures of variability
Unit 12 lesson 5 measures of variabilitymlabuski
 
ORGANISATION OF DATA.pptx
ORGANISATION OF DATA.pptxORGANISATION OF DATA.pptx
ORGANISATION OF DATA.pptxajesh ps
 
Tabulation of Data, Frequency Distribution, Contingency table
Tabulation of Data, Frequency Distribution, Contingency tableTabulation of Data, Frequency Distribution, Contingency table
Tabulation of Data, Frequency Distribution, Contingency tableJagdish Powar
 
Mathematics 7 Frequency Distribution Table.pptx
Mathematics 7 Frequency Distribution Table.pptxMathematics 7 Frequency Distribution Table.pptx
Mathematics 7 Frequency Distribution Table.pptxJeraldelEncepto
 
CHAPTER 3: FREQUENCY DISTRIBUTION ..pptx
CHAPTER 3: FREQUENCY DISTRIBUTION ..pptxCHAPTER 3: FREQUENCY DISTRIBUTION ..pptx
CHAPTER 3: FREQUENCY DISTRIBUTION ..pptxBeverlyAmoraSerada
 
Stastistics
StastisticsStastistics
StastisticsRivan001
 
Utilization-of-assessment-data-assessmentinLearning1.pptx
Utilization-of-assessment-data-assessmentinLearning1.pptxUtilization-of-assessment-data-assessmentinLearning1.pptx
Utilization-of-assessment-data-assessmentinLearning1.pptxEdeleneGetes
 
Steps in Constructing a Frequency Distribution Table.pptx
Steps in Constructing a Frequency Distribution Table.pptxSteps in Constructing a Frequency Distribution Table.pptx
Steps in Constructing a Frequency Distribution Table.pptxPinakaShunga1
 
MCA_UNIT-3_Computer Oriented Numerical Statistical Methods
MCA_UNIT-3_Computer Oriented Numerical Statistical MethodsMCA_UNIT-3_Computer Oriented Numerical Statistical Methods
MCA_UNIT-3_Computer Oriented Numerical Statistical MethodsRai University
 
fraction pieces reporting in mathematics
fraction pieces reporting in mathematicsfraction pieces reporting in mathematics
fraction pieces reporting in mathematicsBabyAnnMotar
 

Similar to Frequency Distribution Table Handout (20)

Jes al1 report
Jes al1 reportJes al1 report
Jes al1 report
 
Elementary Statistics
Elementary Statistics Elementary Statistics
Elementary Statistics
 
1) Chapter#02 Presentation of Data.ppt
1) Chapter#02 Presentation of Data.ppt1) Chapter#02 Presentation of Data.ppt
1) Chapter#02 Presentation of Data.ppt
 
Utilization of Data: Introduction to Statistics
Utilization of Data: Introduction to StatisticsUtilization of Data: Introduction to Statistics
Utilization of Data: Introduction to Statistics
 
Lecture 03.
Lecture 03.Lecture 03.
Lecture 03.
 
Graphical presentation of data
Graphical presentation of dataGraphical presentation of data
Graphical presentation of data
 
Statistics
StatisticsStatistics
Statistics
 
Unit 12 lesson 5 measures of variability
Unit 12 lesson 5 measures of variabilityUnit 12 lesson 5 measures of variability
Unit 12 lesson 5 measures of variability
 
ORGANISATION OF DATA.pptx
ORGANISATION OF DATA.pptxORGANISATION OF DATA.pptx
ORGANISATION OF DATA.pptx
 
Tabulation of Data, Frequency Distribution, Contingency table
Tabulation of Data, Frequency Distribution, Contingency tableTabulation of Data, Frequency Distribution, Contingency table
Tabulation of Data, Frequency Distribution, Contingency table
 
Mathematics 7 Frequency Distribution Table.pptx
Mathematics 7 Frequency Distribution Table.pptxMathematics 7 Frequency Distribution Table.pptx
Mathematics 7 Frequency Distribution Table.pptx
 
CHAPTER 3: FREQUENCY DISTRIBUTION ..pptx
CHAPTER 3: FREQUENCY DISTRIBUTION ..pptxCHAPTER 3: FREQUENCY DISTRIBUTION ..pptx
CHAPTER 3: FREQUENCY DISTRIBUTION ..pptx
 
Stastistics
StastisticsStastistics
Stastistics
 
Utilization-of-assessment-data-assessmentinLearning1.pptx
Utilization-of-assessment-data-assessmentinLearning1.pptxUtilization-of-assessment-data-assessmentinLearning1.pptx
Utilization-of-assessment-data-assessmentinLearning1.pptx
 
Steps in Constructing a Frequency Distribution Table.pptx
Steps in Constructing a Frequency Distribution Table.pptxSteps in Constructing a Frequency Distribution Table.pptx
Steps in Constructing a Frequency Distribution Table.pptx
 
Statistics(Basic)
Statistics(Basic)Statistics(Basic)
Statistics(Basic)
 
MCA_UNIT-3_Computer Oriented Numerical Statistical Methods
MCA_UNIT-3_Computer Oriented Numerical Statistical MethodsMCA_UNIT-3_Computer Oriented Numerical Statistical Methods
MCA_UNIT-3_Computer Oriented Numerical Statistical Methods
 
Assessment compiled
Assessment compiledAssessment compiled
Assessment compiled
 
Statistics Homework Help
Statistics Homework HelpStatistics Homework Help
Statistics Homework Help
 
fraction pieces reporting in mathematics
fraction pieces reporting in mathematicsfraction pieces reporting in mathematics
fraction pieces reporting in mathematics
 

More from sheisirenebkm

Worksheet on Ractangular Coordinate System
Worksheet on Ractangular Coordinate SystemWorksheet on Ractangular Coordinate System
Worksheet on Ractangular Coordinate Systemsheisirenebkm
 
Worksheet on the Applications of Rational Algebraic Expressions
Worksheet on the Applications of Rational Algebraic ExpressionsWorksheet on the Applications of Rational Algebraic Expressions
Worksheet on the Applications of Rational Algebraic Expressionssheisirenebkm
 
Worksheet on Simplifying Rational Algebraic Expressions
Worksheet on Simplifying Rational Algebraic ExpressionsWorksheet on Simplifying Rational Algebraic Expressions
Worksheet on Simplifying Rational Algebraic Expressionssheisirenebkm
 
Worksheet on Operations on Rational Algebraic Expressions
Worksheet on Operations on Rational Algebraic ExpressionsWorksheet on Operations on Rational Algebraic Expressions
Worksheet on Operations on Rational Algebraic Expressionssheisirenebkm
 
Worksheet on Factoring Techniques in Algebra
Worksheet on Factoring Techniques in AlgebraWorksheet on Factoring Techniques in Algebra
Worksheet on Factoring Techniques in Algebrasheisirenebkm
 
Worksheet on Special Products
Worksheet on Special ProductsWorksheet on Special Products
Worksheet on Special Productssheisirenebkm
 
Worksheet on Special Products
Worksheet on Special Products Worksheet on Special Products
Worksheet on Special Products sheisirenebkm
 
Worksheet on Special Products
Worksheet on Special ProductsWorksheet on Special Products
Worksheet on Special Productssheisirenebkm
 
Functions and Relations
Functions and RelationsFunctions and Relations
Functions and Relationssheisirenebkm
 
Linear Equations in Two Variables
Linear Equations in Two VariablesLinear Equations in Two Variables
Linear Equations in Two Variablessheisirenebkm
 
Education Leaders' Empowerment Symposium
Education Leaders' Empowerment SymposiumEducation Leaders' Empowerment Symposium
Education Leaders' Empowerment Symposiumsheisirenebkm
 
Stem-and-Leaf Plot and Line Plot
Stem-and-Leaf Plot and Line PlotStem-and-Leaf Plot and Line Plot
Stem-and-Leaf Plot and Line Plotsheisirenebkm
 
Presentation of Data - How to Construct Graphs
Presentation of Data - How to Construct GraphsPresentation of Data - How to Construct Graphs
Presentation of Data - How to Construct Graphssheisirenebkm
 
Measures of Central Tendency and Variability for Grouped Data
Measures of Central Tendency and Variability for Grouped DataMeasures of Central Tendency and Variability for Grouped Data
Measures of Central Tendency and Variability for Grouped Datasheisirenebkm
 
Introduction to Statistics - Basic Statistical Terms
Introduction to Statistics - Basic Statistical TermsIntroduction to Statistics - Basic Statistical Terms
Introduction to Statistics - Basic Statistical Termssheisirenebkm
 
Differentiating Instruction
Differentiating InstructionDifferentiating Instruction
Differentiating Instructionsheisirenebkm
 
Reviewer for Mathematics Part 2
Reviewer for Mathematics Part 2Reviewer for Mathematics Part 2
Reviewer for Mathematics Part 2sheisirenebkm
 
Reviewer for Mathematics Part 1
Reviewer for Mathematics Part 1Reviewer for Mathematics Part 1
Reviewer for Mathematics Part 1sheisirenebkm
 
Conditional Statements | If-then Statements
Conditional Statements | If-then StatementsConditional Statements | If-then Statements
Conditional Statements | If-then Statementssheisirenebkm
 

More from sheisirenebkm (20)

Worksheet on Ractangular Coordinate System
Worksheet on Ractangular Coordinate SystemWorksheet on Ractangular Coordinate System
Worksheet on Ractangular Coordinate System
 
Worksheet on the Applications of Rational Algebraic Expressions
Worksheet on the Applications of Rational Algebraic ExpressionsWorksheet on the Applications of Rational Algebraic Expressions
Worksheet on the Applications of Rational Algebraic Expressions
 
Worksheet on Simplifying Rational Algebraic Expressions
Worksheet on Simplifying Rational Algebraic ExpressionsWorksheet on Simplifying Rational Algebraic Expressions
Worksheet on Simplifying Rational Algebraic Expressions
 
Worksheet on Operations on Rational Algebraic Expressions
Worksheet on Operations on Rational Algebraic ExpressionsWorksheet on Operations on Rational Algebraic Expressions
Worksheet on Operations on Rational Algebraic Expressions
 
Worksheet on Factoring Techniques in Algebra
Worksheet on Factoring Techniques in AlgebraWorksheet on Factoring Techniques in Algebra
Worksheet on Factoring Techniques in Algebra
 
Worksheet on Special Products
Worksheet on Special ProductsWorksheet on Special Products
Worksheet on Special Products
 
Worksheet on Special Products
Worksheet on Special Products Worksheet on Special Products
Worksheet on Special Products
 
Worksheet on Special Products
Worksheet on Special ProductsWorksheet on Special Products
Worksheet on Special Products
 
Functions and Relations
Functions and RelationsFunctions and Relations
Functions and Relations
 
Equations of a Line
Equations of a LineEquations of a Line
Equations of a Line
 
Linear Equations in Two Variables
Linear Equations in Two VariablesLinear Equations in Two Variables
Linear Equations in Two Variables
 
Education Leaders' Empowerment Symposium
Education Leaders' Empowerment SymposiumEducation Leaders' Empowerment Symposium
Education Leaders' Empowerment Symposium
 
Stem-and-Leaf Plot and Line Plot
Stem-and-Leaf Plot and Line PlotStem-and-Leaf Plot and Line Plot
Stem-and-Leaf Plot and Line Plot
 
Presentation of Data - How to Construct Graphs
Presentation of Data - How to Construct GraphsPresentation of Data - How to Construct Graphs
Presentation of Data - How to Construct Graphs
 
Measures of Central Tendency and Variability for Grouped Data
Measures of Central Tendency and Variability for Grouped DataMeasures of Central Tendency and Variability for Grouped Data
Measures of Central Tendency and Variability for Grouped Data
 
Introduction to Statistics - Basic Statistical Terms
Introduction to Statistics - Basic Statistical TermsIntroduction to Statistics - Basic Statistical Terms
Introduction to Statistics - Basic Statistical Terms
 
Differentiating Instruction
Differentiating InstructionDifferentiating Instruction
Differentiating Instruction
 
Reviewer for Mathematics Part 2
Reviewer for Mathematics Part 2Reviewer for Mathematics Part 2
Reviewer for Mathematics Part 2
 
Reviewer for Mathematics Part 1
Reviewer for Mathematics Part 1Reviewer for Mathematics Part 1
Reviewer for Mathematics Part 1
 
Conditional Statements | If-then Statements
Conditional Statements | If-then StatementsConditional Statements | If-then Statements
Conditional Statements | If-then Statements
 

Recently uploaded

18-04-UA_REPORT_MEDIALITERAСY_INDEX-DM_23-1-final-eng.pdf
18-04-UA_REPORT_MEDIALITERAСY_INDEX-DM_23-1-final-eng.pdf18-04-UA_REPORT_MEDIALITERAСY_INDEX-DM_23-1-final-eng.pdf
18-04-UA_REPORT_MEDIALITERAСY_INDEX-DM_23-1-final-eng.pdfssuser54595a
 
Software Engineering Methodologies (overview)
Software Engineering Methodologies (overview)Software Engineering Methodologies (overview)
Software Engineering Methodologies (overview)eniolaolutunde
 
Introduction to ArtificiaI Intelligence in Higher Education
Introduction to ArtificiaI Intelligence in Higher EducationIntroduction to ArtificiaI Intelligence in Higher Education
Introduction to ArtificiaI Intelligence in Higher Educationpboyjonauth
 
Enzyme, Pharmaceutical Aids, Miscellaneous Last Part of Chapter no 5th.pdf
Enzyme, Pharmaceutical Aids, Miscellaneous Last Part of Chapter no 5th.pdfEnzyme, Pharmaceutical Aids, Miscellaneous Last Part of Chapter no 5th.pdf
Enzyme, Pharmaceutical Aids, Miscellaneous Last Part of Chapter no 5th.pdfSumit Tiwari
 
Organic Name Reactions for the students and aspirants of Chemistry12th.pptx
Organic Name Reactions  for the students and aspirants of Chemistry12th.pptxOrganic Name Reactions  for the students and aspirants of Chemistry12th.pptx
Organic Name Reactions for the students and aspirants of Chemistry12th.pptxVS Mahajan Coaching Centre
 
Solving Puzzles Benefits Everyone (English).pptx
Solving Puzzles Benefits Everyone (English).pptxSolving Puzzles Benefits Everyone (English).pptx
Solving Puzzles Benefits Everyone (English).pptxOH TEIK BIN
 
Biting mechanism of poisonous snakes.pdf
Biting mechanism of poisonous snakes.pdfBiting mechanism of poisonous snakes.pdf
Biting mechanism of poisonous snakes.pdfadityarao40181
 
Proudly South Africa powerpoint Thorisha.pptx
Proudly South Africa powerpoint Thorisha.pptxProudly South Africa powerpoint Thorisha.pptx
Proudly South Africa powerpoint Thorisha.pptxthorishapillay1
 
“Oh GOSH! Reflecting on Hackteria's Collaborative Practices in a Global Do-It...
“Oh GOSH! Reflecting on Hackteria's Collaborative Practices in a Global Do-It...“Oh GOSH! Reflecting on Hackteria's Collaborative Practices in a Global Do-It...
“Oh GOSH! Reflecting on Hackteria's Collaborative Practices in a Global Do-It...Marc Dusseiller Dusjagr
 
Kisan Call Centre - To harness potential of ICT in Agriculture by answer farm...
Kisan Call Centre - To harness potential of ICT in Agriculture by answer farm...Kisan Call Centre - To harness potential of ICT in Agriculture by answer farm...
Kisan Call Centre - To harness potential of ICT in Agriculture by answer farm...Krashi Coaching
 
Sanyam Choudhary Chemistry practical.pdf
Sanyam Choudhary Chemistry practical.pdfSanyam Choudhary Chemistry practical.pdf
Sanyam Choudhary Chemistry practical.pdfsanyamsingh5019
 
Computed Fields and api Depends in the Odoo 17
Computed Fields and api Depends in the Odoo 17Computed Fields and api Depends in the Odoo 17
Computed Fields and api Depends in the Odoo 17Celine George
 
How to Configure Email Server in Odoo 17
How to Configure Email Server in Odoo 17How to Configure Email Server in Odoo 17
How to Configure Email Server in Odoo 17Celine George
 
call girls in Kamla Market (DELHI) 🔝 >༒9953330565🔝 genuine Escort Service 🔝✔️✔️
call girls in Kamla Market (DELHI) 🔝 >༒9953330565🔝 genuine Escort Service 🔝✔️✔️call girls in Kamla Market (DELHI) 🔝 >༒9953330565🔝 genuine Escort Service 🔝✔️✔️
call girls in Kamla Market (DELHI) 🔝 >༒9953330565🔝 genuine Escort Service 🔝✔️✔️9953056974 Low Rate Call Girls In Saket, Delhi NCR
 
Science lesson Moon for 4th quarter lesson
Science lesson Moon for 4th quarter lessonScience lesson Moon for 4th quarter lesson
Science lesson Moon for 4th quarter lessonJericReyAuditor
 
Blooming Together_ Growing a Community Garden Worksheet.docx
Blooming Together_ Growing a Community Garden Worksheet.docxBlooming Together_ Growing a Community Garden Worksheet.docx
Blooming Together_ Growing a Community Garden Worksheet.docxUnboundStockton
 
_Math 4-Q4 Week 5.pptx Steps in Collecting Data
_Math 4-Q4 Week 5.pptx Steps in Collecting Data_Math 4-Q4 Week 5.pptx Steps in Collecting Data
_Math 4-Q4 Week 5.pptx Steps in Collecting DataJhengPantaleon
 
SOCIAL AND HISTORICAL CONTEXT - LFTVD.pptx
SOCIAL AND HISTORICAL CONTEXT - LFTVD.pptxSOCIAL AND HISTORICAL CONTEXT - LFTVD.pptx
SOCIAL AND HISTORICAL CONTEXT - LFTVD.pptxiammrhaywood
 
POINT- BIOCHEMISTRY SEM 2 ENZYMES UNIT 5.pptx
POINT- BIOCHEMISTRY SEM 2 ENZYMES UNIT 5.pptxPOINT- BIOCHEMISTRY SEM 2 ENZYMES UNIT 5.pptx
POINT- BIOCHEMISTRY SEM 2 ENZYMES UNIT 5.pptxSayali Powar
 

Recently uploaded (20)

18-04-UA_REPORT_MEDIALITERAСY_INDEX-DM_23-1-final-eng.pdf
18-04-UA_REPORT_MEDIALITERAСY_INDEX-DM_23-1-final-eng.pdf18-04-UA_REPORT_MEDIALITERAСY_INDEX-DM_23-1-final-eng.pdf
18-04-UA_REPORT_MEDIALITERAСY_INDEX-DM_23-1-final-eng.pdf
 
Software Engineering Methodologies (overview)
Software Engineering Methodologies (overview)Software Engineering Methodologies (overview)
Software Engineering Methodologies (overview)
 
Introduction to ArtificiaI Intelligence in Higher Education
Introduction to ArtificiaI Intelligence in Higher EducationIntroduction to ArtificiaI Intelligence in Higher Education
Introduction to ArtificiaI Intelligence in Higher Education
 
Enzyme, Pharmaceutical Aids, Miscellaneous Last Part of Chapter no 5th.pdf
Enzyme, Pharmaceutical Aids, Miscellaneous Last Part of Chapter no 5th.pdfEnzyme, Pharmaceutical Aids, Miscellaneous Last Part of Chapter no 5th.pdf
Enzyme, Pharmaceutical Aids, Miscellaneous Last Part of Chapter no 5th.pdf
 
Organic Name Reactions for the students and aspirants of Chemistry12th.pptx
Organic Name Reactions  for the students and aspirants of Chemistry12th.pptxOrganic Name Reactions  for the students and aspirants of Chemistry12th.pptx
Organic Name Reactions for the students and aspirants of Chemistry12th.pptx
 
Solving Puzzles Benefits Everyone (English).pptx
Solving Puzzles Benefits Everyone (English).pptxSolving Puzzles Benefits Everyone (English).pptx
Solving Puzzles Benefits Everyone (English).pptx
 
Biting mechanism of poisonous snakes.pdf
Biting mechanism of poisonous snakes.pdfBiting mechanism of poisonous snakes.pdf
Biting mechanism of poisonous snakes.pdf
 
Proudly South Africa powerpoint Thorisha.pptx
Proudly South Africa powerpoint Thorisha.pptxProudly South Africa powerpoint Thorisha.pptx
Proudly South Africa powerpoint Thorisha.pptx
 
“Oh GOSH! Reflecting on Hackteria's Collaborative Practices in a Global Do-It...
“Oh GOSH! Reflecting on Hackteria's Collaborative Practices in a Global Do-It...“Oh GOSH! Reflecting on Hackteria's Collaborative Practices in a Global Do-It...
“Oh GOSH! Reflecting on Hackteria's Collaborative Practices in a Global Do-It...
 
Kisan Call Centre - To harness potential of ICT in Agriculture by answer farm...
Kisan Call Centre - To harness potential of ICT in Agriculture by answer farm...Kisan Call Centre - To harness potential of ICT in Agriculture by answer farm...
Kisan Call Centre - To harness potential of ICT in Agriculture by answer farm...
 
Sanyam Choudhary Chemistry practical.pdf
Sanyam Choudhary Chemistry practical.pdfSanyam Choudhary Chemistry practical.pdf
Sanyam Choudhary Chemistry practical.pdf
 
Computed Fields and api Depends in the Odoo 17
Computed Fields and api Depends in the Odoo 17Computed Fields and api Depends in the Odoo 17
Computed Fields and api Depends in the Odoo 17
 
How to Configure Email Server in Odoo 17
How to Configure Email Server in Odoo 17How to Configure Email Server in Odoo 17
How to Configure Email Server in Odoo 17
 
call girls in Kamla Market (DELHI) 🔝 >༒9953330565🔝 genuine Escort Service 🔝✔️✔️
call girls in Kamla Market (DELHI) 🔝 >༒9953330565🔝 genuine Escort Service 🔝✔️✔️call girls in Kamla Market (DELHI) 🔝 >༒9953330565🔝 genuine Escort Service 🔝✔️✔️
call girls in Kamla Market (DELHI) 🔝 >༒9953330565🔝 genuine Escort Service 🔝✔️✔️
 
Science lesson Moon for 4th quarter lesson
Science lesson Moon for 4th quarter lessonScience lesson Moon for 4th quarter lesson
Science lesson Moon for 4th quarter lesson
 
Blooming Together_ Growing a Community Garden Worksheet.docx
Blooming Together_ Growing a Community Garden Worksheet.docxBlooming Together_ Growing a Community Garden Worksheet.docx
Blooming Together_ Growing a Community Garden Worksheet.docx
 
_Math 4-Q4 Week 5.pptx Steps in Collecting Data
_Math 4-Q4 Week 5.pptx Steps in Collecting Data_Math 4-Q4 Week 5.pptx Steps in Collecting Data
_Math 4-Q4 Week 5.pptx Steps in Collecting Data
 
SOCIAL AND HISTORICAL CONTEXT - LFTVD.pptx
SOCIAL AND HISTORICAL CONTEXT - LFTVD.pptxSOCIAL AND HISTORICAL CONTEXT - LFTVD.pptx
SOCIAL AND HISTORICAL CONTEXT - LFTVD.pptx
 
POINT- BIOCHEMISTRY SEM 2 ENZYMES UNIT 5.pptx
POINT- BIOCHEMISTRY SEM 2 ENZYMES UNIT 5.pptxPOINT- BIOCHEMISTRY SEM 2 ENZYMES UNIT 5.pptx
POINT- BIOCHEMISTRY SEM 2 ENZYMES UNIT 5.pptx
 
Staff of Color (SOC) Retention Efforts DDSD
Staff of Color (SOC) Retention Efforts DDSDStaff of Color (SOC) Retention Efforts DDSD
Staff of Color (SOC) Retention Efforts DDSD
 

Frequency Distribution Table Handout

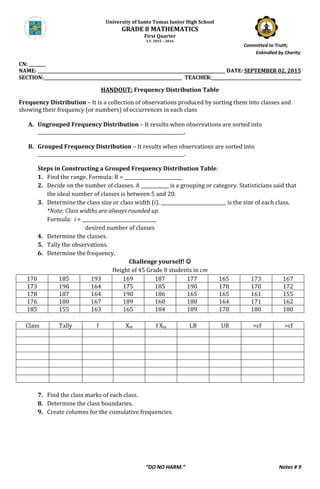
  • 1. University of Santo Tomas Junior High School GRADE 8 MATHEMATICS First Quarter S.Y. 2015 – 2016 “DO NO HARM.” Notes # 9 CN: ________ NAME: ________________________________________________________________________________________ DATE: SEPTEMBER 02, 2015 SECTION:_________________________________________________________________ TEACHER:__________________________________________ HANDOUT: Frequency Distribution Table Frequency Distribution – It is a collection of observations produced by sorting them into classes and showing their frequency (or numbers) of occurrences in each class A. Ungrouped Frequency Distribution – It results when observations are sorted into _______________________________________________________________. B. Grouped Frequency Distribution – It results when observations are sorted into _______________________________________________________________. Steps in Constructing a Grouped Frequency Distribution Table: 1. Find the range. Formula: R = _________________________ 2. Decide on the number of classes. A ____________ is a grouping or category. Statisticians said that the ideal number of classes is between 5 and 20. 3. Determine the class size or class width (i). ____________________________ is the size of each class. *Note: Class widths are always rounded up. Formula: i = ________________________________ desired number of classes 4. Determine the classes. 5. Tally the observations. 6. Determine the frequency. Challenge yourself!  Height of 45 Grade 8 students in cm 170 185 193 169 187 177 165 173 167 173 190 164 175 185 190 178 170 172 178 187 164 190 186 165 165 161 155 176 180 167 189 160 180 164 171 162 185 155 163 165 184 189 170 180 180 Class Tally f Xm f Xm LB UB <cf >cf 7. Find the class marks of each class. 8. Determine the class boundaries. 9. Create columns for the cumulative frequencies. Committed to Truth; ……Enkindled by Charity
  • 2. University of Santo Tomas Junior High School GRADE 8 MATHEMATICS First Quarter S.Y. 2015 – 2016 “DO NO HARM.” Notes # 9 Important Terms: Range – the difference between the highest and lowest score in a set of data. Frequency – the number of observations belonging to a class interval. Class Intervals or Class Limits – refers to a grouping defined by a lower limit and an upper limit. The lower limit of a class is the smallest data value that can be included in the class, and the upper limit is the largest data value that can be included in the class. For example: In the class 19 – 21: lower limit = ________ upper limit = ________ In the class 45 – 47: lower limit = ________ upper limit = ________ Class Boundaries – These are often described as the true limits because these are more precise expressions of class limits. The lower boundary of a class is 0.5 less than its lower limit, and the upper boundary is 0.5 more than its upper limit. For example: In the class 19 – 21: lower boundary = ________ upper boundary = ________ In the class 45 – 47: lower boundary = ________ upper boundary = ________ Class Mark – It is the midpoint or the middle value in a class. It is obtained by finding the average of the lower limit and the upper limit. Class Size or Class Width – refers to the difference between the upper class boundary and the lower class boundary of a class interval. Cumulative Frequency – shows how many scores fall below or above a certain level Assignment for September 03, 2015 Construct a frequency distribution table for the following set of data. 29 27 28 27 34 29 27 27 28 25 23 35 25 29 33 23 27 33 27 22 40 27 21 29 22 25 29 25 21 20 21 23 25 30 20 28 30 29 28 30 27 27 27 19 30