SlideShare a Scribd company logo
1 of 8
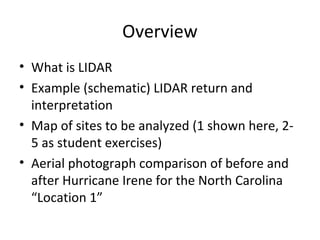
Overview 
• What is LIDAR 
• Example (schematic) LIDAR return and 
interpretation 
• Map of sites to be analyzed (1 shown here, 2- 
5 as student exercises) 
• Aerial photograph comparison of before and 
after Hurricane Irene for the North Carolina 
“Location 1”
What is LIDAR? 
• Airborne Laser Altimeters, or LIDAR 
(for light detection and ranging) use 
light to measure distance from 
plane to surface and back. 
• Detailed (every few meters) 
mapping of topographic surfaces 
before and after an event allows 
scientists to measure the changes. 
• The image shown is from the 
Experimental Advanced Airborn 
Research LIDAR (EAARL) which is 
adapted for coastal systems. More 
information is available at 
http://ngom.usgs.gov/dsp/tech/eaa 
rl/
LIDAR can be used to map the canopy and the ground 
surface, and in shallow water, the depth. 
http://ngom.usgs.gov/dsp/tech/alps/images/fig2_waveform_resolving.JPG from Wright and 
Brock, 2002
Location index for pre-storm and post-storm LIDAR elevations for the Outer Banks, NC. 
Each location includes pre- and post-storm topography as well as topographic change. The 
green line shows Hurricane Irene’s track. http://coastal.er.usgs.gov/hurricanes/irene/lidar/ 
On the elevation images below, red colors indicate topographic highs, while blues indicate 
topographic lows. The differences between the pre- and post-storm elevation data sets show 
where significant changes have occurred. Red colors indicate erosion. For example, oranges and 
reds on the seaward side of the islands indicate wide-spread shoreline retreat. (In each image, 
the Atlantic Ocean is on the bottom right.) Blue colors show areas of accretion, such as 
overwash deposits where waves and surge have moved sand landward.
Location 1, Core 
Banks, NC, Pre- and 
Post Storm Aerial 
Photographs, 
courtesy of the 
USGS 
http://coastal.er.usg 
s.gov/hurricanes/ire 
ne/photo-comparisons/
Location 1, Core Banks, NC Pre-Storm 
(August 11-15 2009) 
RED = HIGH, BLUE = LOW 
http://coastal.er.usgs.gov/hurricanes/irene/photo-comparisons/
Location 1, Core Banks, NC Post-Storm (August 28, 2011) 
RED = HIGH, BLUE = LOW 
http://coastal.er.usgs.gov/hurricanes/irene/photo-comparisons/
Location 1, Core Banks, NC Difference between Pre- and Post-Storm 
RED = EROSION, BLUE = ACCRETION 
http://coastal.er.usgs.gov/hurricanes/irene/photo-comparisons/

More Related Content

What's hot

Applications of remote sensing in geological aspects
Applications of remote sensing in geological aspectsApplications of remote sensing in geological aspects
Applications of remote sensing in geological aspectsPramoda Raj
 
SWOT_Fu_2011_IGARSS.ppt
SWOT_Fu_2011_IGARSS.pptSWOT_Fu_2011_IGARSS.ppt
SWOT_Fu_2011_IGARSS.pptgrssieee
 
A_Ku_Band_Geosyncrhonous_Synthetic_Aperture_Radar_Mission_Analysi.ppt
A_Ku_Band_Geosyncrhonous_Synthetic_Aperture_Radar_Mission_Analysi.pptA_Ku_Band_Geosyncrhonous_Synthetic_Aperture_Radar_Mission_Analysi.ppt
A_Ku_Band_Geosyncrhonous_Synthetic_Aperture_Radar_Mission_Analysi.pptgrssieee
 
Ensuring the Climate Record from the NPOESS and GOES-R Spacecraft
Ensuring the Climate Record from the NPOESS and GOES-R SpacecraftEnsuring the Climate Record from the NPOESS and GOES-R Spacecraft
Ensuring the Climate Record from the NPOESS and GOES-R SpacecraftArt Charo
 
The use of geoinformatics in mineral exploration and exploitation
The use of geoinformatics in mineral exploration and exploitationThe use of geoinformatics in mineral exploration and exploitation
The use of geoinformatics in mineral exploration and exploitationMarguerite Walsh
 
An analysis of a sea breeze boundary in florida
An analysis of a sea breeze boundary in floridaAn analysis of a sea breeze boundary in florida
An analysis of a sea breeze boundary in floridaJames Brownlee
 
Subsurface Mapping
Subsurface MappingSubsurface Mapping
Subsurface MappingMaliha Mehr
 
ppt pres coastalt 2011.ppt
ppt pres coastalt 2011.pptppt pres coastalt 2011.ppt
ppt pres coastalt 2011.pptgrssieee
 
HYPERSPECTRAL RS IN MINERAL MAPPING
HYPERSPECTRAL RS IN MINERAL MAPPINGHYPERSPECTRAL RS IN MINERAL MAPPING
HYPERSPECTRAL RS IN MINERAL MAPPINGAbhiram Kanigolla
 
IGARSS11_Stramondo.ppt
IGARSS11_Stramondo.pptIGARSS11_Stramondo.ppt
IGARSS11_Stramondo.pptgrssieee
 
Estimating the Atlantic overturning at 26N using satellite altimetry [IUGG]
Estimating the Atlantic overturning at 26N using satellite altimetry [IUGG]Estimating the Atlantic overturning at 26N using satellite altimetry [IUGG]
Estimating the Atlantic overturning at 26N using satellite altimetry [IUGG]Eleanor Frajka-Williams
 
Virginia Space Update January 13, 2015 Wallops Island Regional Alliance
Virginia Space Update January 13, 2015 Wallops Island Regional AllianceVirginia Space Update January 13, 2015 Wallops Island Regional Alliance
Virginia Space Update January 13, 2015 Wallops Island Regional AllianceWallopsIslandRegionalAlliance
 
IGARSS2011_SWOT_mesoscale_morrow.ppt
IGARSS2011_SWOT_mesoscale_morrow.pptIGARSS2011_SWOT_mesoscale_morrow.ppt
IGARSS2011_SWOT_mesoscale_morrow.pptgrssieee
 
Site-dependent Spectra: Ground Motion Records in Turkey
Site-dependent Spectra: Ground Motion Records in TurkeySite-dependent Spectra: Ground Motion Records in Turkey
Site-dependent Spectra: Ground Motion Records in TurkeyAli Osman Öncel
 
H0324044052
H0324044052H0324044052
H0324044052theijes
 
MINERAL EXPLORATION USING ASTER IMAGE
MINERAL EXPLORATION USING ASTER IMAGE MINERAL EXPLORATION USING ASTER IMAGE
MINERAL EXPLORATION USING ASTER IMAGE Abhiram Kanigolla
 
Neuralog Well Geodetics
Neuralog Well GeodeticsNeuralog Well Geodetics
Neuralog Well GeodeticsDean Mikkelsen
 
558215 634216980498557500
558215 634216980498557500558215 634216980498557500
558215 634216980498557500Rahul Mundra
 

What's hot (20)

Applications of remote sensing in geological aspects
Applications of remote sensing in geological aspectsApplications of remote sensing in geological aspects
Applications of remote sensing in geological aspects
 
SWOT_Fu_2011_IGARSS.ppt
SWOT_Fu_2011_IGARSS.pptSWOT_Fu_2011_IGARSS.ppt
SWOT_Fu_2011_IGARSS.ppt
 
A_Ku_Band_Geosyncrhonous_Synthetic_Aperture_Radar_Mission_Analysi.ppt
A_Ku_Band_Geosyncrhonous_Synthetic_Aperture_Radar_Mission_Analysi.pptA_Ku_Band_Geosyncrhonous_Synthetic_Aperture_Radar_Mission_Analysi.ppt
A_Ku_Band_Geosyncrhonous_Synthetic_Aperture_Radar_Mission_Analysi.ppt
 
Ensuring the Climate Record from the NPOESS and GOES-R Spacecraft
Ensuring the Climate Record from the NPOESS and GOES-R SpacecraftEnsuring the Climate Record from the NPOESS and GOES-R Spacecraft
Ensuring the Climate Record from the NPOESS and GOES-R Spacecraft
 
The use of geoinformatics in mineral exploration and exploitation
The use of geoinformatics in mineral exploration and exploitationThe use of geoinformatics in mineral exploration and exploitation
The use of geoinformatics in mineral exploration and exploitation
 
An analysis of a sea breeze boundary in florida
An analysis of a sea breeze boundary in floridaAn analysis of a sea breeze boundary in florida
An analysis of a sea breeze boundary in florida
 
Subsurface Mapping
Subsurface MappingSubsurface Mapping
Subsurface Mapping
 
ppt pres coastalt 2011.ppt
ppt pres coastalt 2011.pptppt pres coastalt 2011.ppt
ppt pres coastalt 2011.ppt
 
Hydro2016
Hydro2016Hydro2016
Hydro2016
 
HYPERSPECTRAL RS IN MINERAL MAPPING
HYPERSPECTRAL RS IN MINERAL MAPPINGHYPERSPECTRAL RS IN MINERAL MAPPING
HYPERSPECTRAL RS IN MINERAL MAPPING
 
IGARSS11_Stramondo.ppt
IGARSS11_Stramondo.pptIGARSS11_Stramondo.ppt
IGARSS11_Stramondo.ppt
 
Estimating the Atlantic overturning at 26N using satellite altimetry [IUGG]
Estimating the Atlantic overturning at 26N using satellite altimetry [IUGG]Estimating the Atlantic overturning at 26N using satellite altimetry [IUGG]
Estimating the Atlantic overturning at 26N using satellite altimetry [IUGG]
 
Virginia Space Update January 13, 2015 Wallops Island Regional Alliance
Virginia Space Update January 13, 2015 Wallops Island Regional AllianceVirginia Space Update January 13, 2015 Wallops Island Regional Alliance
Virginia Space Update January 13, 2015 Wallops Island Regional Alliance
 
IGARSS2011_SWOT_mesoscale_morrow.ppt
IGARSS2011_SWOT_mesoscale_morrow.pptIGARSS2011_SWOT_mesoscale_morrow.ppt
IGARSS2011_SWOT_mesoscale_morrow.ppt
 
Gps sy stem
Gps sy stemGps sy stem
Gps sy stem
 
Site-dependent Spectra: Ground Motion Records in Turkey
Site-dependent Spectra: Ground Motion Records in TurkeySite-dependent Spectra: Ground Motion Records in Turkey
Site-dependent Spectra: Ground Motion Records in Turkey
 
H0324044052
H0324044052H0324044052
H0324044052
 
MINERAL EXPLORATION USING ASTER IMAGE
MINERAL EXPLORATION USING ASTER IMAGE MINERAL EXPLORATION USING ASTER IMAGE
MINERAL EXPLORATION USING ASTER IMAGE
 
Neuralog Well Geodetics
Neuralog Well GeodeticsNeuralog Well Geodetics
Neuralog Well Geodetics
 
558215 634216980498557500
558215 634216980498557500558215 634216980498557500
558215 634216980498557500
 

Similar to Introductory slides about coastal change dataset

Dataset for Pea Island National Wildlife Refuge, NC site (location 5)
Dataset for Pea Island National Wildlife Refuge, NC site (location 5)Dataset for Pea Island National Wildlife Refuge, NC site (location 5)
Dataset for Pea Island National Wildlife Refuge, NC site (location 5)SERC at Carleton College
 
Dataset for Hatteras village, NC site (location 3)
Dataset for Hatteras village, NC site (location 3)Dataset for Hatteras village, NC site (location 3)
Dataset for Hatteras village, NC site (location 3)SERC at Carleton College
 
TU2.T10.3.pptx
TU2.T10.3.pptxTU2.T10.3.pptx
TU2.T10.3.pptxgrssieee
 
Circulation of the North Atlantic Ocean During the 1990's as Determine by Lag...
Circulation of the North Atlantic Ocean During the 1990's as Determine by Lag...Circulation of the North Atlantic Ocean During the 1990's as Determine by Lag...
Circulation of the North Atlantic Ocean During the 1990's as Determine by Lag...David Fratantoni
 
NISAR Oil, Gas, and Water Underground Reservoirs
NISAR Oil, Gas, and Water Underground ReservoirsNISAR Oil, Gas, and Water Underground Reservoirs
NISAR Oil, Gas, and Water Underground ReservoirsDr. Pankaj Dhussa
 
IGARSS 2011_Temimi.pptx
IGARSS 2011_Temimi.pptxIGARSS 2011_Temimi.pptx
IGARSS 2011_Temimi.pptxgrssieee
 
TU2.L10 - THE AQUARIUS/SAC-D MISSION OVERVIEW
TU2.L10 - THE AQUARIUS/SAC-D MISSION OVERVIEWTU2.L10 - THE AQUARIUS/SAC-D MISSION OVERVIEW
TU2.L10 - THE AQUARIUS/SAC-D MISSION OVERVIEWgrssieee
 
GEO Grid災害タスクフォース 〜東日本大震災における活動〜 GIS学会2011
GEO Grid災害タスクフォース 〜東日本大震災における活動〜 GIS学会2011GEO Grid災害タスクフォース 〜東日本大震災における活動〜 GIS学会2011
GEO Grid災害タスクフォース 〜東日本大震災における活動〜 GIS学会2011Naotaka YAMAMOTO CHIKASADA
 
Earthquake ground motion and response spectra (Bijan Mohraz, Fahim Sadek)
Earthquake ground motion and response spectra (Bijan Mohraz, Fahim Sadek)Earthquake ground motion and response spectra (Bijan Mohraz, Fahim Sadek)
Earthquake ground motion and response spectra (Bijan Mohraz, Fahim Sadek)TheJamez
 
1.Solar-Radiation.Energy.Temp-09.ppt
1.Solar-Radiation.Energy.Temp-09.ppt1.Solar-Radiation.Energy.Temp-09.ppt
1.Solar-Radiation.Energy.Temp-09.pptRasakumar Raj
 
1.Solar-Radiation.Energy.Temp-09.ppt
1.Solar-Radiation.Energy.Temp-09.ppt1.Solar-Radiation.Energy.Temp-09.ppt
1.Solar-Radiation.Energy.Temp-09.pptlakshmi sirisha
 
WE1.L09 - AN OVERVIEW OF THE DESDYNI MISSION
WE1.L09 - AN OVERVIEW OF THE DESDYNI MISSIONWE1.L09 - AN OVERVIEW OF THE DESDYNI MISSION
WE1.L09 - AN OVERVIEW OF THE DESDYNI MISSIONgrssieee
 
class_EXPLOR_TECH.ppt
class_EXPLOR_TECH.pptclass_EXPLOR_TECH.ppt
class_EXPLOR_TECH.pptDesalegnTamir
 
The integration of space born and ground remotely sensed data
The integration of space born and ground remotely sensed dataThe integration of space born and ground remotely sensed data
The integration of space born and ground remotely sensed dataoilandgas24
 
Surveying ii ajith sir class6
Surveying ii ajith sir class6Surveying ii ajith sir class6
Surveying ii ajith sir class6SHAMJITH KM
 

Similar to Introductory slides about coastal change dataset (20)

Dataset for Ocracoke site (location 2)
Dataset for Ocracoke site (location 2)Dataset for Ocracoke site (location 2)
Dataset for Ocracoke site (location 2)
 
Dataset for Pea Island National Wildlife Refuge, NC site (location 5)
Dataset for Pea Island National Wildlife Refuge, NC site (location 5)Dataset for Pea Island National Wildlife Refuge, NC site (location 5)
Dataset for Pea Island National Wildlife Refuge, NC site (location 5)
 
Dataset for Rodanthe
Dataset for RodantheDataset for Rodanthe
Dataset for Rodanthe
 
Dataset for Hatteras village, NC site (location 3)
Dataset for Hatteras village, NC site (location 3)Dataset for Hatteras village, NC site (location 3)
Dataset for Hatteras village, NC site (location 3)
 
Ll3519561960
Ll3519561960Ll3519561960
Ll3519561960
 
Work_Sample_Paper
Work_Sample_PaperWork_Sample_Paper
Work_Sample_Paper
 
TU2.T10.3.pptx
TU2.T10.3.pptxTU2.T10.3.pptx
TU2.T10.3.pptx
 
Circulation of the North Atlantic Ocean During the 1990's as Determine by Lag...
Circulation of the North Atlantic Ocean During the 1990's as Determine by Lag...Circulation of the North Atlantic Ocean During the 1990's as Determine by Lag...
Circulation of the North Atlantic Ocean During the 1990's as Determine by Lag...
 
NISAR Oil, Gas, and Water Underground Reservoirs
NISAR Oil, Gas, and Water Underground ReservoirsNISAR Oil, Gas, and Water Underground Reservoirs
NISAR Oil, Gas, and Water Underground Reservoirs
 
IGARSS 2011_Temimi.pptx
IGARSS 2011_Temimi.pptxIGARSS 2011_Temimi.pptx
IGARSS 2011_Temimi.pptx
 
TU2.L10 - THE AQUARIUS/SAC-D MISSION OVERVIEW
TU2.L10 - THE AQUARIUS/SAC-D MISSION OVERVIEWTU2.L10 - THE AQUARIUS/SAC-D MISSION OVERVIEW
TU2.L10 - THE AQUARIUS/SAC-D MISSION OVERVIEW
 
GEO Grid災害タスクフォース 〜東日本大震災における活動〜 GIS学会2011
GEO Grid災害タスクフォース 〜東日本大震災における活動〜 GIS学会2011GEO Grid災害タスクフォース 〜東日本大震災における活動〜 GIS学会2011
GEO Grid災害タスクフォース 〜東日本大震災における活動〜 GIS学会2011
 
Earthquake ground motion and response spectra (Bijan Mohraz, Fahim Sadek)
Earthquake ground motion and response spectra (Bijan Mohraz, Fahim Sadek)Earthquake ground motion and response spectra (Bijan Mohraz, Fahim Sadek)
Earthquake ground motion and response spectra (Bijan Mohraz, Fahim Sadek)
 
1.Solar-Radiation.Energy.Temp-09.ppt
1.Solar-Radiation.Energy.Temp-09.ppt1.Solar-Radiation.Energy.Temp-09.ppt
1.Solar-Radiation.Energy.Temp-09.ppt
 
1.Solar-Radiation.Energy.Temp-09.ppt
1.Solar-Radiation.Energy.Temp-09.ppt1.Solar-Radiation.Energy.Temp-09.ppt
1.Solar-Radiation.Energy.Temp-09.ppt
 
WE1.L09 - AN OVERVIEW OF THE DESDYNI MISSION
WE1.L09 - AN OVERVIEW OF THE DESDYNI MISSIONWE1.L09 - AN OVERVIEW OF THE DESDYNI MISSION
WE1.L09 - AN OVERVIEW OF THE DESDYNI MISSION
 
class_EXPLOR_TECH.ppt
class_EXPLOR_TECH.pptclass_EXPLOR_TECH.ppt
class_EXPLOR_TECH.ppt
 
A2100107
A2100107A2100107
A2100107
 
The integration of space born and ground remotely sensed data
The integration of space born and ground remotely sensed dataThe integration of space born and ground remotely sensed data
The integration of space born and ground remotely sensed data
 
Surveying ii ajith sir class6
Surveying ii ajith sir class6Surveying ii ajith sir class6
Surveying ii ajith sir class6
 

More from SERC at Carleton College

StatVignette03_Sig.Figs_v04_07_15_2020.pptx
StatVignette03_Sig.Figs_v04_07_15_2020.pptxStatVignette03_Sig.Figs_v04_07_15_2020.pptx
StatVignette03_Sig.Figs_v04_07_15_2020.pptxSERC at Carleton College
 
Cretaceous Coatlines and Modern Voting Patterns Presentation
Cretaceous Coatlines and Modern Voting Patterns PresentationCretaceous Coatlines and Modern Voting Patterns Presentation
Cretaceous Coatlines and Modern Voting Patterns PresentationSERC at Carleton College
 
Presentation: Unit 1 Introduction to the hydrological cycle
Presentation: Unit 1 Introduction to the hydrological cyclePresentation: Unit 1 Introduction to the hydrological cycle
Presentation: Unit 1 Introduction to the hydrological cycleSERC at Carleton College
 
KSKL_Chapter 4_ Chem Properties of Soils.pptx
KSKL_Chapter 4_ Chem Properties of Soils.pptxKSKL_Chapter 4_ Chem Properties of Soils.pptx
KSKL_Chapter 4_ Chem Properties of Soils.pptxSERC at Carleton College
 
Presentation: Unit 3 background information
Presentation: Unit 3 background informationPresentation: Unit 3 background information
Presentation: Unit 3 background informationSERC at Carleton College
 
Presentation: Unit 2 Measuring Groundwater Background Information
Presentation: Unit 2 Measuring Groundwater Background InformationPresentation: Unit 2 Measuring Groundwater Background Information
Presentation: Unit 2 Measuring Groundwater Background InformationSERC at Carleton College
 

More from SERC at Carleton College (20)

StatVignette03_Sig.Figs_v04_07_15_2020.pptx
StatVignette03_Sig.Figs_v04_07_15_2020.pptxStatVignette03_Sig.Figs_v04_07_15_2020.pptx
StatVignette03_Sig.Figs_v04_07_15_2020.pptx
 
StatVignette06_HypTesting.pptx
StatVignette06_HypTesting.pptxStatVignette06_HypTesting.pptx
StatVignette06_HypTesting.pptx
 
Unit 1 (optional slides)
Unit 1 (optional slides)Unit 1 (optional slides)
Unit 1 (optional slides)
 
Cretaceous Coatlines and Modern Voting Patterns Presentation
Cretaceous Coatlines and Modern Voting Patterns PresentationCretaceous Coatlines and Modern Voting Patterns Presentation
Cretaceous Coatlines and Modern Voting Patterns Presentation
 
Climate and Biomes PPT 2
Climate and Biomes PPT 2Climate and Biomes PPT 2
Climate and Biomes PPT 2
 
weather tracking ppt
weather tracking pptweather tracking ppt
weather tracking ppt
 
Presentation: Unit 1 Introduction to the hydrological cycle
Presentation: Unit 1 Introduction to the hydrological cyclePresentation: Unit 1 Introduction to the hydrological cycle
Presentation: Unit 1 Introduction to the hydrological cycle
 
StatVignette05_M3_v02_10_21_2020.pptx
StatVignette05_M3_v02_10_21_2020.pptxStatVignette05_M3_v02_10_21_2020.pptx
StatVignette05_M3_v02_10_21_2020.pptx
 
KSKL chapter 8 PPT
KSKL chapter 8 PPTKSKL chapter 8 PPT
KSKL chapter 8 PPT
 
KSKL chap 5 PPT
KSKL chap 5 PPTKSKL chap 5 PPT
KSKL chap 5 PPT
 
KSKL_Chapter 4_ Chem Properties of Soils.pptx
KSKL_Chapter 4_ Chem Properties of Soils.pptxKSKL_Chapter 4_ Chem Properties of Soils.pptx
KSKL_Chapter 4_ Chem Properties of Soils.pptx
 
Degraded Soil Images.pptx
Degraded Soil Images.pptxDegraded Soil Images.pptx
Degraded Soil Images.pptx
 
Educators PPT file chapter 7
Educators PPT file chapter 7Educators PPT file chapter 7
Educators PPT file chapter 7
 
Educators PPT file chapter 2
Educators PPT file chapter 2Educators PPT file chapter 2
Educators PPT file chapter 2
 
Educators PPT file chapter 6
Educators PPT file chapter 6Educators PPT file chapter 6
Educators PPT file chapter 6
 
Educators PPT chapter 3
Educators PPT chapter 3Educators PPT chapter 3
Educators PPT chapter 3
 
Unit 4 background presentation
Unit 4 background presentationUnit 4 background presentation
Unit 4 background presentation
 
Presentation: Unit 3 background information
Presentation: Unit 3 background informationPresentation: Unit 3 background information
Presentation: Unit 3 background information
 
Presentation: Unit 2 Measuring Groundwater Background Information
Presentation: Unit 2 Measuring Groundwater Background InformationPresentation: Unit 2 Measuring Groundwater Background Information
Presentation: Unit 2 Measuring Groundwater Background Information
 
Introduction to GPS presentation
Introduction to GPS presentationIntroduction to GPS presentation
Introduction to GPS presentation
 

Introductory slides about coastal change dataset

  • 1. Overview • What is LIDAR • Example (schematic) LIDAR return and interpretation • Map of sites to be analyzed (1 shown here, 2- 5 as student exercises) • Aerial photograph comparison of before and after Hurricane Irene for the North Carolina “Location 1”
  • 2. What is LIDAR? • Airborne Laser Altimeters, or LIDAR (for light detection and ranging) use light to measure distance from plane to surface and back. • Detailed (every few meters) mapping of topographic surfaces before and after an event allows scientists to measure the changes. • The image shown is from the Experimental Advanced Airborn Research LIDAR (EAARL) which is adapted for coastal systems. More information is available at http://ngom.usgs.gov/dsp/tech/eaa rl/
  • 3. LIDAR can be used to map the canopy and the ground surface, and in shallow water, the depth. http://ngom.usgs.gov/dsp/tech/alps/images/fig2_waveform_resolving.JPG from Wright and Brock, 2002
  • 4. Location index for pre-storm and post-storm LIDAR elevations for the Outer Banks, NC. Each location includes pre- and post-storm topography as well as topographic change. The green line shows Hurricane Irene’s track. http://coastal.er.usgs.gov/hurricanes/irene/lidar/ On the elevation images below, red colors indicate topographic highs, while blues indicate topographic lows. The differences between the pre- and post-storm elevation data sets show where significant changes have occurred. Red colors indicate erosion. For example, oranges and reds on the seaward side of the islands indicate wide-spread shoreline retreat. (In each image, the Atlantic Ocean is on the bottom right.) Blue colors show areas of accretion, such as overwash deposits where waves and surge have moved sand landward.
  • 5. Location 1, Core Banks, NC, Pre- and Post Storm Aerial Photographs, courtesy of the USGS http://coastal.er.usg s.gov/hurricanes/ire ne/photo-comparisons/
  • 6. Location 1, Core Banks, NC Pre-Storm (August 11-15 2009) RED = HIGH, BLUE = LOW http://coastal.er.usgs.gov/hurricanes/irene/photo-comparisons/
  • 7. Location 1, Core Banks, NC Post-Storm (August 28, 2011) RED = HIGH, BLUE = LOW http://coastal.er.usgs.gov/hurricanes/irene/photo-comparisons/
  • 8. Location 1, Core Banks, NC Difference between Pre- and Post-Storm RED = EROSION, BLUE = ACCRETION http://coastal.er.usgs.gov/hurricanes/irene/photo-comparisons/

Editor's Notes

  1. Location 1: LIDAR topography from August 11-15, 2009 (pre-storm) and August 28, 2011 (post-storm) and topographic change (difference) for a portion of Core Banks, NC. “A relatively low beach section near the center of the pre-storm image likely indicates where breaches have been cut through the barrier island at previous times. The Irene breach is clearly seen in the post-storm LIDAR data. The difference image shows over 1 m of vertical erosion in the beaches that were breached.” See pre- and post-storm photo comparisons at [http://coastal.er.usgs.gov/hurricanes/irene/photo-comparisons/] for additional discussion. [http://coastal.er.usgs.gov/hurricanes/irene/lidar/]
  2. Location 1: LIDAR topography from August 11-15, 2009 (pre-storm) and August 28, 2011 (post-storm) and topographic change (difference) for a portion of Core Banks, NC. “A relatively low beach section near the center of the pre-storm image likely indicates where breaches have been cut through the barrier island at previous times. The Irene breach is clearly seen in the post-storm LIDAR data. The difference image shows over 1 m of vertical erosion in the beaches that were breached.” See pre- and post-storm photo comparisons at [http://coastal.er.usgs.gov/hurricanes/irene/photo-comparisons/] for additional discussion. [http://coastal.er.usgs.gov/hurricanes/irene/lidar/]
  3. Location 1: LIDAR topography from August 11-15, 2009 (pre-storm) and August 28, 2011 (post-storm) and topographic change (difference) for a portion of Core Banks, NC. “A relatively low beach section near the center of the pre-storm image likely indicates where breaches have been cut through the barrier island at previous times. The Irene breach is clearly seen in the post-storm LIDAR data. The difference image shows over 1 m of vertical erosion in the beaches that were breached.” See pre- and post-storm photo comparisons at [http://coastal.er.usgs.gov/hurricanes/irene/photo-comparisons/] for additional discussion. [http://coastal.er.usgs.gov/hurricanes/irene/lidar/]