SlideShare a Scribd company logo
1 of 6
Location index for pre-storm and post-storm LIDAR elevations for the Outer Banks, NC 
(Location 4 on map). Each location includes pre- and post-storm topography as well as 
topographic change. The green line shows Hurricane Irene's track. 
http://coastal.er.usgs.gov/hurricanes/irene/lidar/ 
On the elevation images below, red colors indicate topographic highs, while blues indicate 
topographic lows. The differences between the pre- and post-storm elevation data sets show 
where significant changes have occurred. Red colors indicate erosion. For example, oranges and 
reds on the seaward side of the islands indicate widespread shoreline retreat. (In each image, 
the Atlantic Ocean is on the bottom right.) Blue colors show areas of accretion, such as 
overwash deposits where waves and surge have moved sand landward.
Before and After Hurricane 
Irene Aerial Photographs 
From 
http://coastal.er.usgs.gov/hurricanes/irene/photo-comparisons/# 
location5
November 27-December 1, 2009 (pre-storm) Outer Banks near Rodanthe, NC 
RED = HIGH, BLUE = LOW 
http://coastal.er.usgs.gov/hurricanes/irene/photo-comparisons/
August 28-29, 2011 (post-storm) for a portion of Outer Banks near Rodanthe, NC 
RED = HIGH, BLUE = LOW 
http://coastal.er.usgs.gov/hurricanes/irene/photo-comparisons/
Topographic change (difference) for a portion of Outer Banks near Rodanthe, NC 
RED = EROSION, BLUE = ACCRETION 
http://coastal.er.usgs.gov/hurricanes/irene/photo-comparisons/
Topographic change (difference) for a portion of Outer Banks near Rodanthe, NC 
RED = EROSION, BLUE = ACCRETION 
http://coastal.er.usgs.gov/hurricanes/irene/photo-comparisons/

More Related Content

Viewers also liked

GETSI Development Approach & Learning Goals
GETSI Development Approach & Learning GoalsGETSI Development Approach & Learning Goals
GETSI Development Approach & Learning Goals
SERC at Carleton College
 
Using InTeGrate in the 2YC classroom slides
Using InTeGrate in the 2YC classroom slidesUsing InTeGrate in the 2YC classroom slides
Using InTeGrate in the 2YC classroom slides
SERC at Carleton College
 

Viewers also liked (19)

Making Change Happen: a Parable
Making Change Happen: a ParableMaking Change Happen: a Parable
Making Change Happen: a Parable
 
Slides for building a sustainable future
Slides for building a sustainable futureSlides for building a sustainable future
Slides for building a sustainable future
 
NGSS Earth and Space Science: Needs and a Call to Action
NGSS Earth and Space Science: Needs and a Call to ActionNGSS Earth and Space Science: Needs and a Call to Action
NGSS Earth and Space Science: Needs and a Call to Action
 
MORE metoring for teachers
MORE metoring for teachersMORE metoring for teachers
MORE metoring for teachers
 
notebook setup instructions
notebook setup instructionsnotebook setup instructions
notebook setup instructions
 
Slides for taking a systems approach
Slides for taking a systems approachSlides for taking a systems approach
Slides for taking a systems approach
 
Slides for linking geoscience and societal issues
Slides for linking geoscience and societal issuesSlides for linking geoscience and societal issues
Slides for linking geoscience and societal issues
 
Webinar: Helping Educators Use Your Resources for Implementation of the Next ...
Webinar: Helping Educators Use Your Resources for Implementation of the Next ...Webinar: Helping Educators Use Your Resources for Implementation of the Next ...
Webinar: Helping Educators Use Your Resources for Implementation of the Next ...
 
GETSI Development Approach & Learning Goals
GETSI Development Approach & Learning GoalsGETSI Development Approach & Learning Goals
GETSI Development Approach & Learning Goals
 
Soils and Society presentation
Soils and Society presentationSoils and Society presentation
Soils and Society presentation
 
Using InTeGrate in the 2YC classroom slides
Using InTeGrate in the 2YC classroom slidesUsing InTeGrate in the 2YC classroom slides
Using InTeGrate in the 2YC classroom slides
 
NGSS survey results
NGSS survey resultsNGSS survey results
NGSS survey results
 
ITG Webinar Slides 031315
ITG Webinar Slides 031315ITG Webinar Slides 031315
ITG Webinar Slides 031315
 
Online Resources
Online ResourcesOnline Resources
Online Resources
 
Unit 3: figures
Unit 3: figuresUnit 3: figures
Unit 3: figures
 
Unit 1: Figures
Unit 1: FiguresUnit 1: Figures
Unit 1: Figures
 
Economic and Workforce Aspects of Energy in Colorado
Economic and Workforce Aspects of Energy in ColoradoEconomic and Workforce Aspects of Energy in Colorado
Economic and Workforce Aspects of Energy in Colorado
 
Water quality and water resource impacts of oil and gas production
Water quality and water resource impacts of oil and gas productionWater quality and water resource impacts of oil and gas production
Water quality and water resource impacts of oil and gas production
 
Introductory slides about coastal change dataset
Introductory slides about coastal change datasetIntroductory slides about coastal change dataset
Introductory slides about coastal change dataset
 

More from SERC at Carleton College

StatVignette03_Sig.Figs_v04_07_15_2020.pptx
StatVignette03_Sig.Figs_v04_07_15_2020.pptxStatVignette03_Sig.Figs_v04_07_15_2020.pptx
StatVignette03_Sig.Figs_v04_07_15_2020.pptx
SERC at Carleton College
 
Cretaceous Coatlines and Modern Voting Patterns Presentation
Cretaceous Coatlines and Modern Voting Patterns PresentationCretaceous Coatlines and Modern Voting Patterns Presentation
Cretaceous Coatlines and Modern Voting Patterns Presentation
SERC at Carleton College
 
Presentation: Unit 1 Introduction to the hydrological cycle
Presentation: Unit 1 Introduction to the hydrological cyclePresentation: Unit 1 Introduction to the hydrological cycle
Presentation: Unit 1 Introduction to the hydrological cycle
SERC at Carleton College
 
KSKL_Chapter 4_ Chem Properties of Soils.pptx
KSKL_Chapter 4_ Chem Properties of Soils.pptxKSKL_Chapter 4_ Chem Properties of Soils.pptx
KSKL_Chapter 4_ Chem Properties of Soils.pptx
SERC at Carleton College
 

More from SERC at Carleton College (20)

StatVignette03_Sig.Figs_v04_07_15_2020.pptx
StatVignette03_Sig.Figs_v04_07_15_2020.pptxStatVignette03_Sig.Figs_v04_07_15_2020.pptx
StatVignette03_Sig.Figs_v04_07_15_2020.pptx
 
StatVignette06_HypTesting.pptx
StatVignette06_HypTesting.pptxStatVignette06_HypTesting.pptx
StatVignette06_HypTesting.pptx
 
Unit 1 (optional slides)
Unit 1 (optional slides)Unit 1 (optional slides)
Unit 1 (optional slides)
 
Cretaceous Coatlines and Modern Voting Patterns Presentation
Cretaceous Coatlines and Modern Voting Patterns PresentationCretaceous Coatlines and Modern Voting Patterns Presentation
Cretaceous Coatlines and Modern Voting Patterns Presentation
 
Climate and Biomes PPT 2
Climate and Biomes PPT 2Climate and Biomes PPT 2
Climate and Biomes PPT 2
 
weather tracking ppt
weather tracking pptweather tracking ppt
weather tracking ppt
 
Presentation: Unit 1 Introduction to the hydrological cycle
Presentation: Unit 1 Introduction to the hydrological cyclePresentation: Unit 1 Introduction to the hydrological cycle
Presentation: Unit 1 Introduction to the hydrological cycle
 
StatVignette05_M3_v02_10_21_2020.pptx
StatVignette05_M3_v02_10_21_2020.pptxStatVignette05_M3_v02_10_21_2020.pptx
StatVignette05_M3_v02_10_21_2020.pptx
 
KSKL chapter 8 PPT
KSKL chapter 8 PPTKSKL chapter 8 PPT
KSKL chapter 8 PPT
 
KSKL chap 5 PPT
KSKL chap 5 PPTKSKL chap 5 PPT
KSKL chap 5 PPT
 
KSKL_Chapter 4_ Chem Properties of Soils.pptx
KSKL_Chapter 4_ Chem Properties of Soils.pptxKSKL_Chapter 4_ Chem Properties of Soils.pptx
KSKL_Chapter 4_ Chem Properties of Soils.pptx
 
Degraded Soil Images.pptx
Degraded Soil Images.pptxDegraded Soil Images.pptx
Degraded Soil Images.pptx
 
Educators PPT file chapter 7
Educators PPT file chapter 7Educators PPT file chapter 7
Educators PPT file chapter 7
 
Educators PPT file chapter 2
Educators PPT file chapter 2Educators PPT file chapter 2
Educators PPT file chapter 2
 
Educators PPT file chapter 6
Educators PPT file chapter 6Educators PPT file chapter 6
Educators PPT file chapter 6
 
Educators PPT chapter 3
Educators PPT chapter 3Educators PPT chapter 3
Educators PPT chapter 3
 
Unit 4 background presentation
Unit 4 background presentationUnit 4 background presentation
Unit 4 background presentation
 
Presentation: Unit 3 background information
Presentation: Unit 3 background informationPresentation: Unit 3 background information
Presentation: Unit 3 background information
 
Presentation: Unit 2 Measuring Groundwater Background Information
Presentation: Unit 2 Measuring Groundwater Background InformationPresentation: Unit 2 Measuring Groundwater Background Information
Presentation: Unit 2 Measuring Groundwater Background Information
 
Introduction to GPS presentation
Introduction to GPS presentationIntroduction to GPS presentation
Introduction to GPS presentation
 

Dataset for Rodanthe

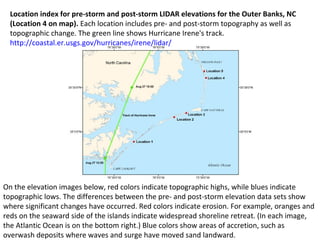
  • 1. Location index for pre-storm and post-storm LIDAR elevations for the Outer Banks, NC (Location 4 on map). Each location includes pre- and post-storm topography as well as topographic change. The green line shows Hurricane Irene's track. http://coastal.er.usgs.gov/hurricanes/irene/lidar/ On the elevation images below, red colors indicate topographic highs, while blues indicate topographic lows. The differences between the pre- and post-storm elevation data sets show where significant changes have occurred. Red colors indicate erosion. For example, oranges and reds on the seaward side of the islands indicate widespread shoreline retreat. (In each image, the Atlantic Ocean is on the bottom right.) Blue colors show areas of accretion, such as overwash deposits where waves and surge have moved sand landward.
  • 2. Before and After Hurricane Irene Aerial Photographs From http://coastal.er.usgs.gov/hurricanes/irene/photo-comparisons/# location5
  • 3. November 27-December 1, 2009 (pre-storm) Outer Banks near Rodanthe, NC RED = HIGH, BLUE = LOW http://coastal.er.usgs.gov/hurricanes/irene/photo-comparisons/
  • 4. August 28-29, 2011 (post-storm) for a portion of Outer Banks near Rodanthe, NC RED = HIGH, BLUE = LOW http://coastal.er.usgs.gov/hurricanes/irene/photo-comparisons/
  • 5. Topographic change (difference) for a portion of Outer Banks near Rodanthe, NC RED = EROSION, BLUE = ACCRETION http://coastal.er.usgs.gov/hurricanes/irene/photo-comparisons/
  • 6. Topographic change (difference) for a portion of Outer Banks near Rodanthe, NC RED = EROSION, BLUE = ACCRETION http://coastal.er.usgs.gov/hurricanes/irene/photo-comparisons/

Editor's Notes

  1. Location 4: LIDAR topography from November 27-December 1, 2009 (pre-storm) and August 28-29, 2011 (post-storm) and topographic change (difference) for a portion of the Outer Banks near Rodanthe, NC. “In the pre-storm image, note where the road bends seaward, approaching the Atlantic Ocean. Here, the road is protected by sand-filled bags that appear dune-like in the LIDAR topography. The post-storm image reveals where the waves and surge from Irene broke through the protection and carved a breach. The difference image shows the extensive erosion associated with breach formation.” See pre- and post-storm photo comparisons at [http://coastal.er.usgs.gov/hurricanes/irene/photo-comparisons/] for additional discussion.
  2. Location 4: LIDAR topography from November 27-December 1, 2009 (pre-storm) and August 28-29, 2011 (post-storm) and topographic change (difference) for a portion of the Outer Banks near Rodanthe, NC. “In the pre-storm image, note where the road bends seaward, approaching the Atlantic Ocean. Here, the road is protected by sand-filled bags that appear dune-like in the LIDAR topography. The post-storm image reveals where the waves and surge from Irene broke through the protection and carved a breach. The difference image shows the extensive erosion associated with breach formation.” See pre- and post-storm photo comparisons at [http://coastal.er.usgs.gov/hurricanes/irene/photo-comparisons/] for additional discussion.
  3. Location 4: LIDAR topography from November 27-December 1, 2009 (pre-storm) and August 28-29, 2011 (post-storm) and topographic change (difference) for a portion of the Outer Banks near Rodanthe, NC. “In the pre-storm image, note where the road bends seaward, approaching the Atlantic Ocean. Here, the road is protected by sand-filled bags that appear dune-like in the LIDAR topography. The post-storm image reveals where the waves and surge from Irene broke through the protection and carved a breach. The difference image shows the extensive erosion associated with breach formation.” See pre- and post-storm photo comparisons at [http://coastal.er.usgs.gov/hurricanes/irene/photo-comparisons/] for additional discussion.