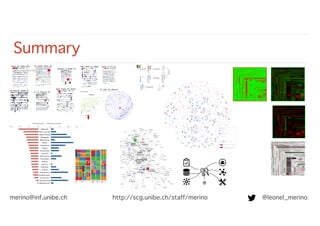
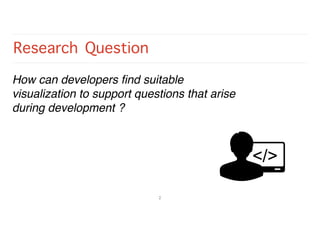
The document discusses an ontology-based meta-visualization aimed at helping developers find suitable software visualization tools to address development questions. It highlights various visualization techniques and tools presented in multiple conferences, including best paper awards. Key examples include 'metavis' for actionable visualization and 'communityexplorer' for visualizing collaboration networks.

![Towards Actionable Visualization in Software
Development. VISSOFT’16
L.Merino,M.Ghafari,O.Nierstrasz, “Towards Actionable Visualization in Software Development,”in
VISSOFT’16: Proceedings of the 4th IEEE Working Conference on Software Visualization. IEEE, 2016, to
Appear. [Online]. Available: http://scg.unibe.ch/archive/papers/Meri16a.pdf (Best paper award)
3](https://image.slidesharecdn.com/phdmerinokonstan2016-171116095944/85/Research-Stay-DBVIS-Konstanz-2016-3-320.jpg)
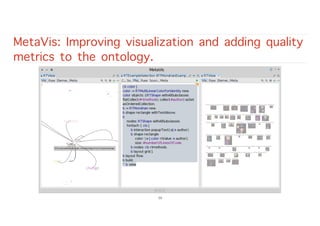
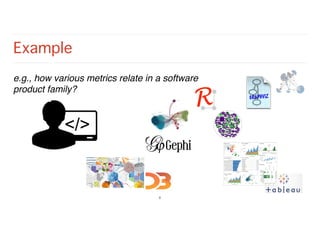
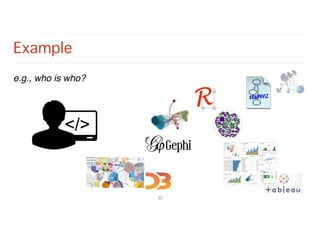
![MetaVis: Exploring Actionable Visualization.
VISSOFT’16
e.g.
!7
L.Merino,M.Ghafari,O.Nierstrasz,A.Bergel,andJ.Kubelka,“Metavis:Exploring Actionable Visualization,”in
VISSOFT’16: Proceedings of the 4th IEEE Working Conference on Software Visualization. IEEE, 2016, to
Appear. [Online]. Available: http://scg.unibe.ch/archive/papers/Meri16c.pdf
7](https://image.slidesharecdn.com/phdmerinokonstan2016-171116095944/85/Research-Stay-DBVIS-Konstanz-2016-7-320.jpg)
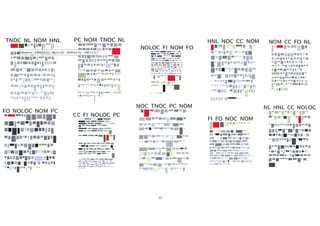
![Explora: A visualization Tool for Metric Analysis on
Software Corpora. VISSOFT’15
L. Merino, M. Lungu, and O. Nierstrasz, “Explora: A visualisation tool for metric analysis of software
corpora,” in VISSOFT’15: Proceedings of the 3rd IEEE Working Conference on Software Visualization.
IEEE, 2015, pp. 195–199. [Online]. Available: http://scg.unibe.ch/archive/papers/Meri15b.pdf
Polygrid
9](https://image.slidesharecdn.com/phdmerinokonstan2016-171116095944/85/Research-Stay-DBVIS-Konstanz-2016-9-320.jpg)
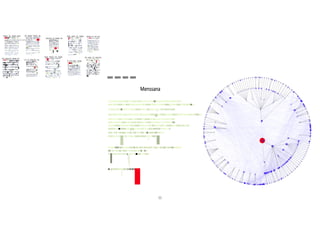
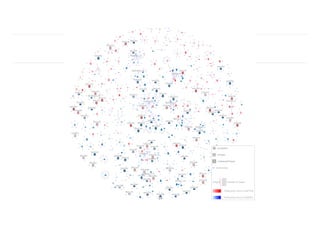
![CommunityExplorer: A Framework for Visualizing
Collaboration Networks. IWST’16
L. Merino, D. Seliner, M. Ghafari, and O. Nierstrasz, “CommunityExplorer: A framework for visualizing
collaboration networks,” in Proceedings of International Workshop on Smalltalk Technologies (IWST 2016),
2016, to Appear. [Online]. Available: http://scg.unibe.ch/archive/papers/Meri16b.pdf
13](https://image.slidesharecdn.com/phdmerinokonstan2016-171116095944/85/Research-Stay-DBVIS-Konstanz-2016-13-320.jpg)
![Systematic Literature Review
L.Merino,M.Ghafari,O.Nierstrasz, “Towards Actionable Visualization in Software Development,”in VISSOFT’16: Proceedings of the 4th IEEE Working
Conference on Software Visualization. IEEE, 2016, to Appear. [Online]. Available: http://scg.unibe.ch/archive/papers/Meri16c.pdf (Best paper award)
15](https://image.slidesharecdn.com/phdmerinokonstan2016-171116095944/85/Research-Stay-DBVIS-Konstanz-2016-15-320.jpg)