Download to read offline

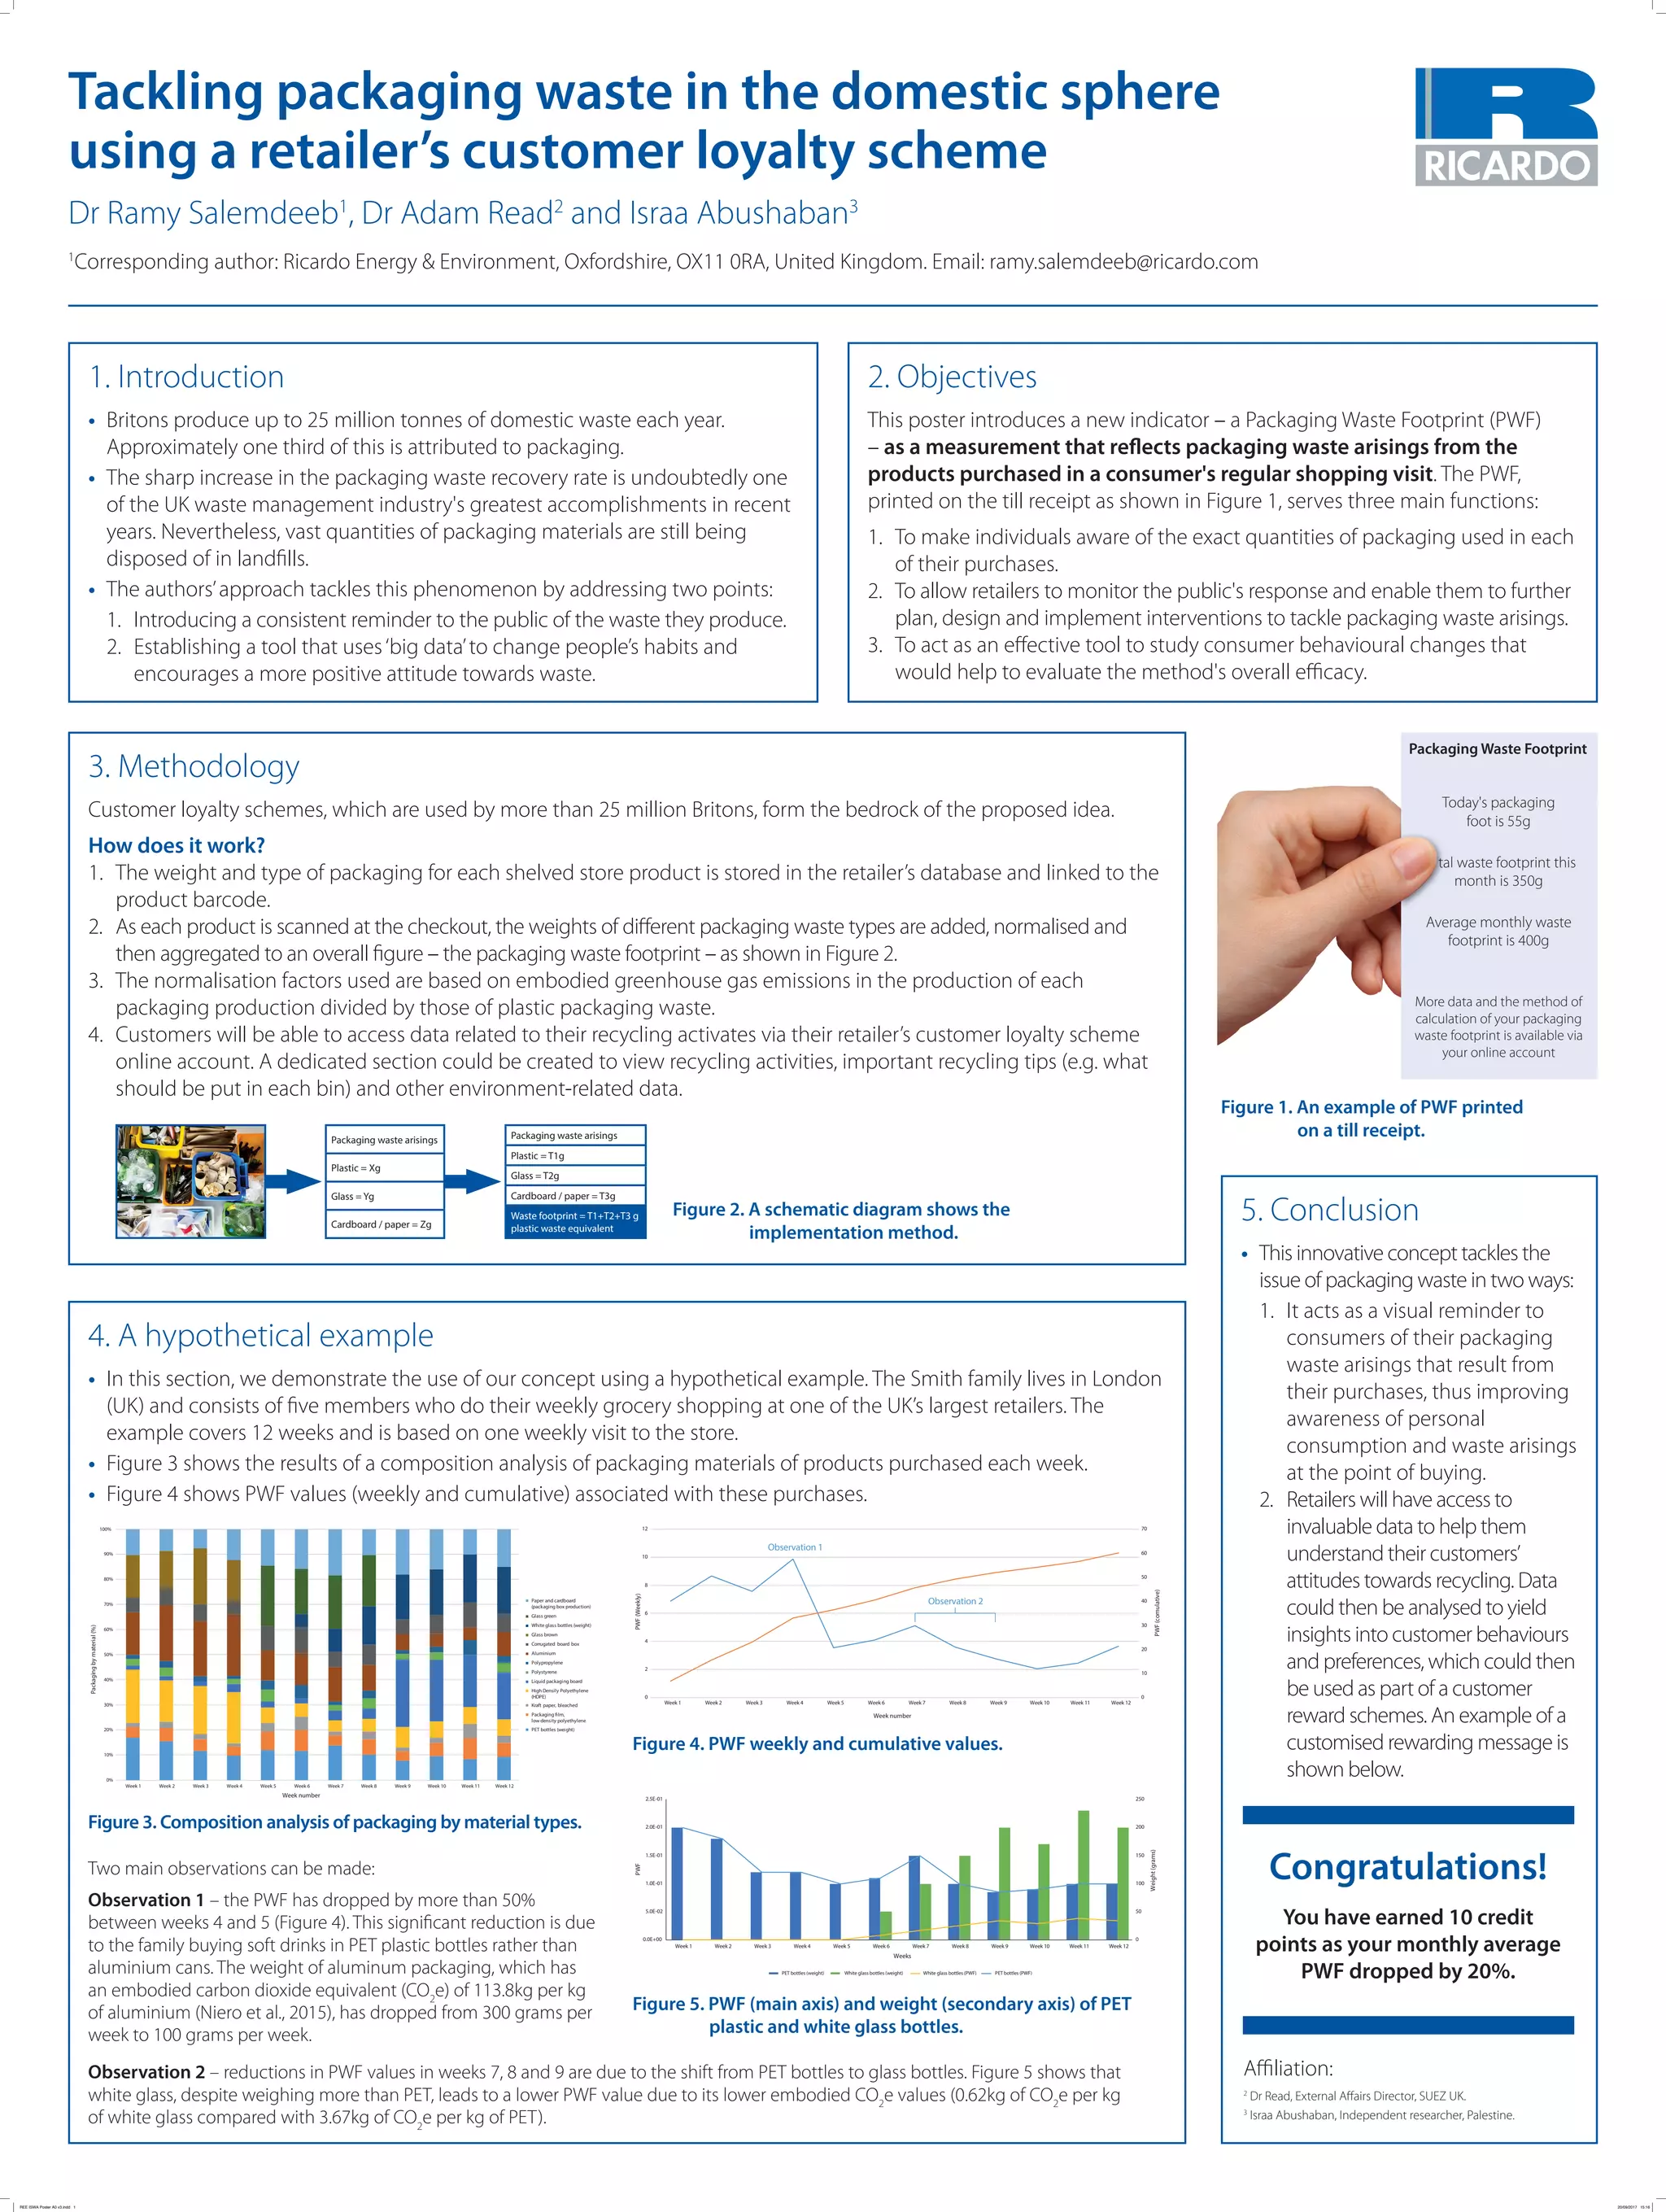

This document proposes using customer loyalty schemes to track packaging waste and encourage recycling. It would work as follows: 1. Retailers would store the weight and type of each product's packaging in their database. 2. At checkout, the weights of packaging waste types from each purchase would be added up to calculate an overall packaging waste footprint for the customer. 3. Customers could access their recycling data and footprint through their online loyalty account, along with tips to improve recycling.