SlideShare a Scribd company logo
1 of 61
Download to read offline
Ch. 11 Use of State Diagrams 1
Chapter 11 USE OF STATE DIAGRAMS
State Diagrams
The question is “What did Delaware. She wore a brand New Jersey, What did Missi sip? She
sipped a Minne sota. Where has Oregon, boy? If you wan Al-ask-a. She went to pay her Texas.”
Wait a minute. We are confusing this poor PLC student. Wrong ‘state’.
This chapter introduces the subject of state diagrams and how they play a part in PLC
programming. Many of the more complicated problems in control involve state diagrams. This
chapter will discuss some examples of state diagrams and their use in control. In Chapters 12
and 13, additional examples of state diagrams will be discussed as well as the programming
choices accompanying those problems.
The process below is used to fill the wagon at lower right. An operator starts the silo emptying
by pushing the start button. The conveyor starts and the slider gate opens. If the operator stops
the system by pushing the stop button, the slider closes followed by a time delay of 30 seconds
or enough time for the belt to empty of material. Then the conveyor stops running. If the E-stop
or emergency stop button is pushed, the slider closes and the conveyor stops running
immediately.
Several conditions that may cause a problem with the filling station including the prox switch
which monitors the conveyor belt. If the prox switch does not change state while the conveyor is
running, this signifies a broken belt or tripped motor starter for M1, the conveyor motor. Failure
will cause the conveyor belt to turn off and the system to stop.
M2
Slider
open
Slider
closed
M1 Prox
Switch
Silo
Conveyor Belt
Operator
Panel
Start Stop
E-
Stop
Fig. 11-1a
Filling Station Process
Ch. 11 Use of State Diagrams 2
Failure of the slider to open or close after directing the slider in the appropriate direction is also
to be detected. If this occurs, the operator is to be notified via an alarm and the conveyor belt is
to continue running if failed open but stop if failed closed.
The system needs an initial state usually referenced as “home”. The home position of this
system is conveyor belt off and slider closed.
Using a State Diagram (or State Graph), the filling station may be defined as below:
3
4
5
6
7
1
2
Home
Position
Start
Belt
Open
Slider
Filling
Close
Slider
Belt
Empty/
Stop
Error
Fig. 11-1b Filling Station State Diagram
The home position requires certain conditions be met before advancing to a next step. This step
implies a switch or switches be added to place the machine in this state. Usually, these
additional switches are added to a screen on an HMI (human-machine-interface).
A number of conditions exist that cause errors. These include slider open and slider closed at the
same time. This condition cannot occur and one of the two sensors is reporting a bad signal. An
error state also occurs if the conveyor is running and the prox signal doesn’t change state over a
period of time. An error would also occur if the slider was directed to open and the open sensor
does not change to on in a reasonable time. A similar error would occur if the slider was directed
to close and the closed sensor was not energized.
In some systems, the error state is divided into multiple error states if the action resulting is
different and the state following the error is different. In this system, an error shuts down the
conveyor and closes the slider. The system is then expected to be homed and started normally.
An I/O table must be generated to complete the definition of the system before programming
commences. The I/O Assignment Table would be similar to the following:
Ch. 11 Use of State Diagrams 3
Input Assignments:
Sensor Function/State Signal I/O
Start Button Starting
Stop Button Stopping
Prox Switch On-off
Slider open ls Slider is open
Slider closed ls Slider is closed
E-stop Button Emergency stopping
Output Assignments:
Actuator Function/State Signal I/O
M1 run Conveyor motor
M2 open Open slider
M2 close Close slider
The conveyor and filling station is not a good example of a program needing a state diagram. It
is not necessary many times to create a state diagram and then implement a control program. In
control programs such as the one to control this process, a state diagram may be used to help
develop a program but may be not be of enough use to help. Not all processes require a state
diagram.
The Pneumatic Cylinder and State Diagrams:
State diagrams are useful in applications using movement especially with pneumatic cylinders
and processes requiring movement. A pneumatic cylinder is shown below.
Fig. 11-2
Pneumatic
Cylinder
Ch. 11 Use of State Diagrams 4
How an air cylinder works is shown in the diagrams below. An air cylinder moves one of two
ways, by single acting or double acting cylinder and air. Looking inside the single acting
cylinder we find a spring pushing the cylinder to the left and air pushing the cylinder to the right.
Single Acting Air Cylinder
Air enters port and Spring begins to compress
Spring compresses and Cylinder moves
Cylinder in Extended Position
Fig. 11-3
Single Acting
A double acting cylinder is pictured on the next page. The left to right movement and right to
left movement is shown with air movement. Air is controlled through valves. There is no
spring.
Ch. 11 Use of State Diagrams 5
Double Acting Cylinder
Air enters left port and Cylinder begins to move right
Cylinder moves right to end stop
Air enters right port and Cylinder begins to move left
Cylinder moves left to end stop
Fig. 11-4
Double Acting
The position of the cylinder is verified in both the closed and open position by reading the metal
cylinder with proximity switches. Movement continues in both cases until there is a physical
stop the cylinder encounters. There are only two valid positions and both are at end of travel.
Ch. 11 Use of State Diagrams 6
Proximity Switch Reads Position at Left
Proximity Switch Reads Position at Right
Fig. 11-5
Sensing End of Travel
Both cylinders have similar state diagrams with states shown below. The state diagram below
represents the cylinder and its movements very well.
Cylinder moving Left
Cylinder Resting at Right
Cylinder Resting at Left
Cylinder moving Right
State Diagram of
Cylinders above
Fig11-6
Cylinder State
Diagram.
Ch. 11 Use of State Diagrams 7
Many systems need a home or initial state from which to start. After switching into a mode on
the HMI to send the system to a homed position, the home position of the machine must be
achieved for proper action. If a slide gate is open, it must be closed. This can also be done via
an auto/manual switch on the HMI. In manual, individual devices can be turned on or off or
gates moved to a desired position without interference from an automated sequence. For
example, in a manual mode, the slide gate referenced above can be opened or closed with an
open and close pushbutton from the HMI. These buttons should be added to the sensor table and
assigned internal bit addresses.
The programming language type must be selected. While some prefer a language similar to the
State Diagram, most prefer the PLC’s LAD (Ladder) or FBD (Function Block Diagram)
language.
In the state diagram below, the error step may be jumped to from various steps and then a move
is allowed to an initial state of 1 or a home state. The rules for error or the logic causing the
jump to step 7 are usually included in the box and may be stated in a number of different
formats. It is best to include a written description of the logic to jump from state to state.
7
1
Home
Position
Error Various
Steps
Rules for
move
Operator
reset
Fig. 11-7 Filling Station Error Recovery
Finding 2’s Complement - A Simple State Diagram
The logic for converting a number to the 2’s complement is shown below. This logic can be
explained by a simple State Diagram. In this example, state 1 = M0.0 off and state 2 = M0.0 on.
The word being examined is M2, M3 and the result resides in M4, M5.
2
1
Initial State:
Transfer Bit
Transfer
Inverse of Bit
Receive a
1 Bit
0 0
0 0
1 1
0
0
1
0 1
1 0
1 0
0 1
1 0
M2.x M4.x M2.x M4.x
M4.0
M4.1
M4.2
M4.3
M4.4
M4.5
M4.6
M4.7
Fig. 11-8a
Two s
Complement
Rules
Change
with new
state
Ch. 11 Use of State Diagrams 8
The algorithm can be viewed above but the program is found here. In it, the ‘twoscomp’ bit is
set to ‘0’ and the program begins. When the first ‘1’ is found in the original number, that bit is
transferred to the twos complement word but the state is changed by setting the ‘twoscomp’ bit.
The state is now set to flip the original bit and place the flipped bit in the twos complement
number. This algorithm depends on this simple flip bit from our state diagram to work.
Fig. 11-8b Code for Two’s Complement
Ch. 11 Use of State Diagrams 9
Conveyor Two State System – A Simple State Diagram
State table analysis of the Conveyor Program below shows two states: #1 (loading) or #2 (off-
loading).
2
1
Count = 4
Count = 0
Loading Conveyor Off-loading Conveyor
always a Loading Conveyor may be either Loading or Off-loading Off-loading Conveyor with respect to
previous conveyor
PE
1
PE
2
Reset Line
Count Button
Fig. 11-9a
Conveyor Delivery
State Diagram
Boxes fill one at a time on the short conveyor at left, accumulate on the middle conveyor until 4
boxes are in place. Then the middle conveyor turns on automatically to off-load the boxes to the
third conveyor.
The middle conveyor is programmed to switch from an accumulating or loading conveyor to an
off-loading conveyor. Logic for this switch is developed in the network below. The memory bit
‘Offload’ energizes when the count is done (‘QU’ turns on). Internal logic acts in a manner similar
to a switch controlled by a human. The state changes to off-loading and the middle conveyor
turns on to transport boxes off the conveyor and then change back to an accumulating conveyor,
switching from state 1 to 2 and back to 1 again.
Fig. 9b
Program for
Load/Offload
Conveyor System
Ch. 11 Use of State Diagrams 10
Another consideration when programming moving lines with boxes is “What happens if a person
accidentally removes a box from the conveyor at the wrong time or moves his hand or foot in
front of the photo-eye incrementing the counter accidentally (or not accidentally)?” What if a
bird or big bee flies in front of the sensor giving a false count of the number of boxes? Counters
must have a mechanism to reset the state affecting the overall operation of the conveyor. Reset
buttons must be strategically placed so as not to be overused but to provide a means of resetting
the line if the line is cleared of boxes.
The reset button should only be used by an operator if normal operation of the line has been
interrupted and the line is not responding properly. Then the operator resets the counters and
seal circuits. In coordination with reset of logic, boxes must also be removed from the
conveyors. This may prove to be a cumbersome task. This is signified in the state diagram by
moving to an initial state or a reset state.
When control of a process requires internal switching logic, the programmer must build switches
through the use of memory logic. The logic is described as sequential logic in that the logic
moves sequentially from one section to another section. If logic is developed remembering the
sequential nature of the process, then a more organized program can be achieved.
State Table Analysis of ‘Simon Says’ Sequential Game
A later chapter will discuss the implementation of a number of sequential games including
“Simon Says” and “WhackaMole”. The Simon game is the same game played years ago by your
parents or possibly your grandparents. A state diagram of the Simon game could be represented
as follows:
2
1
Not Playing
3
Playing/
Showing
Lights
Playing/
Pushing
Buttons
Error
Success
4
Won
Flash
Lights
Fig. 11-10
Simon Says
State Diagram
The Simon game will be further discussed and programmed in a later chapter.
In general, while the number of states doesn’t need to match the number of coils used in a
program, the minimum number of coils used matches the number of flip-flop’s in a state table.
For instance, if there are 2 states, 1 coil is necessary (either on or off). For three or four states, 2
coils are necessary (off-off, off-on, on-off, on-on). For five to eight states, 3 coils are required.
For 9 to 16 states, 4 coils are required, etc. Use of a minimum number of coils for representation
Ch. 11 Use of State Diagrams 11
of states may not prove to be the most effective programming style. A number of different
programming techniques will be discussed in this chapter and next and will give the programmer
various ideas as to how best implement a state diagram from a sequential process.
Sets and Venn Diagrams
Use of sets and Venn diagrams may help the programmer visualize a sequential program. For
example, the sets of “Simon Says” are found below. They are Not Game Being Played and
Game Being Played. Subsets of Game Being Played are Show Lights and Push Buttons. A final
state is shown at right if the player wins – Flash Lights. To begin a program by designing a
Venn diagram is usually not required. However, as the program is written, the programmer may
find the use of Venn diagrams a good tool in describing the logic or in visualizing the various
states present in the process.
Sets of the program Simon Says:
Not Playing Game
Showing Lights
Playing Game
Pushing Buttons
Fig. 11-11 Venn Diagram of Simon-Says Game
Flash
Lights to
show a
win
Sequential Function Charts
An alternative to state diagrams using ladder logic is the programming language referred to as
Sequential Function Charts (SFC). SFC is a graphical approach to state development and
program organization. Steps, actions and transitions are the three primary components of a
typical SFC. Each step is similar to a state or unit of logic organized to accomplish a particular
control task. An action defines an aspect of the task and a transition provides the means to move
from task to task. Logic internal to each step, transition or action is programmed in Ladder logic
or other programming language. SFC's graphical layout offers the program developer an
overview for creating small islands (states) of logic and linking them together with transitions.
Ch. 11 Use of State Diagrams 12
Two primary types of flows are allowed in the SFC diagram, sequential and parallel. With
sequential flow, the program executes step 1 repeatedly until all conditions are satisfied for the
transition to take place to move to step 2. Each step is evaluated until satisfied and then flow
moves on. In a parallel configuration, branches may be configured as simultaneous or selection.
In a selection branch, only one branch is executed at a time. The active branch is determined by
the transition. With a simultaneous branch, all branches may be executed simultaneously.
Transition occurs in a simultaneous branch when one of the active steps satisfies conditions to
continue. The following figure shows a selection branch. Step one is executed until completion.
Then step two executes. Only one step is allowed to execute at a time. Other steps are missed
this time.
Step One
Step Two
Sequential
Function Chart
Selection
Branch
When done at step 2,
moves to next step
Step 1 done moves to one
of the three in Step Two
Fig. 11-12 SFC with
Selection Branch
As mentioned before, with a simultaneous branch, all branches may be executed simultaneously.
Transition occurs in a simultaneous branch when one of the active steps satisfies conditions to
continue. The figure below shows a simultaneous branch with step one occurring and then one
or more of the steps of step two turning on. Any of these steps in step two can cause a transition
to later logic.
Step One
Step Two
Sequential
Function Chart
Simultaneous
Branch
When any done at step
2, moves to next step
Step 1 done moves to all of
the three in Step Two
Fig. 11-13 SFC with
Simultaneous Branch
Ch. 11 Use of State Diagrams 13
Logic that is active is highlighted so a programmer can visually confirm the program step or
steps being executed. Steps may be sub-divided into actions with a number of actions occurring
sequentially during the step.
Step 1
Step 1
Step 1
Action 1
Action 2
Fig. 11-14 Steps Subdivided into Actions
Showing logic that is active in highlighted form is a very powerful method to show the flow of
logic in a sequential process. Sequential Function Charts may be useful in developing sequential
logic especially when advantages such as highlighting are considered. Remember that each box
in the Sequential Function Chart may be reduced to a number of rungs of ladder logic or other
language. SFC overall is a very powerful organizing tool.
State diagrams and Sequential Function Charts are two of many different tools used by
programmers to control a sequential process. A number of other tools have been discussed as
well. Scientists, especially mathematicians, have used a variety of very sophisticated tools to
generalize sequential problems. While it is not the purpose of this text to thoroughly explain
these tools, it is appropriate to mention two different tools used to discuss sequential processes.
First is Finite State Machines or FSM. FSM may be defined as “model of behavior composed of
states, transitions and actions.” Transitions and actions may be defined:
“A transition indicates a state change and is described by a condition that would need to
be fulfilled to enable the transition. An action is a description of an activity that is to be
performed at a given moment.”
FSM may be used in “linguistics, computer science, philosophy, biology, mathematics, and
logic.” Of course, the PLC programmer is interested in using FSM for logic in developing a
program.
Ch. 11 Use of State Diagrams 14
Another tool for solving of sophisticated sequential problems is the Petri net. The Petri net may
be described as:
“A Petri net (also known as a place/transition net or P/T net) is one of several mathematical
representations of discrete distributed systems.” Petri nets were first introduced by Carl Adam
Petry in 1962 from his PhD dissertation. An example of a Petry net diagram follows:
Back to Reality - Combinational Modes
External switches many times determine the mode of the machine and establish the need for
states. These form a class of devices referred to as combinational modes. Combinational modes
include switches such as:
STOP START
RAISE STOP
LOWER
HAND AUTO
SEMI-AUTO
TYPICAL SWITCHES
Fig. 11-16
Various
Selector
Switches
Stop-Start
Forward-Reverse
Open-Close
On-Off
Raise-Lower
Up-Down
Fast-Slow-Stop
Forward-Reverse-Stop
Open-Close-Stop
Raise-Lower-Stop
Up-Down-Stop-Off-On
Hand-Auto
Hand-Step-Auto
Hand-SemiAuto-Auto
Manual-Auto
Manual-SemiAuto-Auto
High-Low
Summer-Winter
Summer-Off-Winter
High-Off-Low
This list could be continued for many pages. This is but a sampling of the types of mode
switches used for control of machines.
Fig. 11-15 Petri Net Example
Ch. 11 Use of State Diagrams 15
One of the most commonly used mode switches is: Auxiliary-Off-Run-Start
If you don’t recognize this switch, think about what happens next time you start your car.
Typical switches that are two-position are wired to only one of the two positions.
PLC Input
Fig. 11-17a Generic Selector Switch
If one mode is chosen, then the normally open contact is used. If the other mode is chosen, then
the normally closed contact is used. For instance, if the switch above was used with the switch
labeled High-Low, then High would refer to the input on and Low would refer to the input off.
PLC Input
Fig. 11-17b Selector Switch with Tag
HIGH LOW
To summarize this section about switches, if a switch is needed but there is no switch planned for
the panel or HMI screen, the program will need a memory circuit and probably a state diagram to
replace the switch.
When switches are available, state definitions are not necessary, or at least not for the decisions
made in coordination with the switches. On the other hand, if a switch is needed and none is
available, one must determine if a state is necessary (and if coil conditions are required) that are
derived from a state diagram.
It is possible to develop a number of state diagram programs without ever realizing that a state
diagram is at the core of the program. The idea that a switch may be used instead of a state
diagram may seem an oversimplification but the idea of using the idea of a potential switch to
define the states of a system and then plan a method to automatically generate those states is a
powerful method to plan a state diagram and write the ensuing program.
Scan-Dependent Code used in State Diagrams
Many times a state diagram can be programmed using a simple programming technique that uses
scan-dependent code. Not all PLC logic can be replicated with relays since the PLC is sequential
in nature and follows a scan from top to bottom of a program.
Rungs are solved sequentially starting at rung 0 and proceeding through the entire program
Ch. 11 Use of State Diagrams 16
finishing with the end statement. As the rungs are solved, outputs are written from the coil or
other output function to the appropriate table. The output is written from the program to the
output as the rung is executed. The output is written to the card usually at the end of the scan.
(Some processors write outputs asynchronously to the scan and therefore are not as predictable
as to exactly when the output will be written to the output device. Both procedures of writing an
output at the end of a scan and writing to the output asynchronously are valid procedures.
Use of scan-dependent code is necessary at times to accomplish a function or step from state in a
program. To save a variable in a particular mode so that the variable may be used when the
mode is turned off is a useful tool and is used in many programs.
Addressing States by Using Scan-Dependent Code - Climbing the Ladder
The following is a program to turn on three conveyors either automatically or manually. This
program is used to demonstrate a common scan-dependent programming technique referenced
here as "climb-the-ladder”.
In this problem, a system of conveyors is to be programmed with each conveyor running
independently. No integration of the conveyors into a state diagram is to be considered. Each
conveyor has various start and stop conditions. The start conditions can be found parallel to the
seal contact and the stop conditions can be found in series with the start logic. Logic for one of
three motors is shown below (typical for all three):
Fig. 11-18 Original Conveyor Circuit before Modifications
As long as all that is necessary to run the process is the independent start and stop contacts, all is
well. However, what if the request is made that the emergency stop (let’s say I:1/15 is the e-
stop) shuts down all three or any that were running. Then in addition, a circuit is to be added to
restart those motors previously running. To do this easily requires programming that is
commonly referred to as climbing the ladder, an application of scan-dependent code and the state
diagram shown below. A new state ‘Off, Ready to Start’ is added to the state diagram and a new
set of seal circuits is added to the logic. This is done during the scan that the emergency stop
shuts down the output rungs with the new logic located just prior the output rungs. They are
shown as follows:
Devices that turn off the conveyor
Devices that turn on the conveyor
Seal contact
Ch. 11 Use of State Diagrams 17
Fig. 11-19 State Diagram for Program Above
Logic setting State
3 for each of the
three conveyors
Now we can turn off the
conveyor with the emergency
stop switch
3
2
Off
1
Off,
Ready to
restart
On
Push
Start
Push
Stop Push
Restart Push
Estop
Notice that the three rungs added are not yet compiled since the stop or contact that turns the
rung off is not yet known. Do not worry about not defining these contacts since there is time to
add them later. The three coils B3:2/0, 2/1, and 2/2 are turned on the scan that the emergency
stop is first turned on. These three coils remember the status of the three motors and save their
status prior to the emergency stop turning the motors off. An annotation would read “Motor 1
Running Prior to E-Stop Shutdown”. Next, at an operator’s request, the system is to start back
up with the motors that were previously running turning back on. Notice how this is done.
Ch. 11 Use of State Diagrams 18
Fig. 11-20 Completed Program
Rungs 000-002 contain logic to turn on the motors previously on before the emergency stop was
pushed. With the reset I:1/14, logic is developed to turn on the motor that was remembered in
B3:2/0 through B3:2/2. The internal coil B3:3/0 turns on if B3:2/0 was energized, turns off the
seal circuit containing B3:2/0 and then restarts the motor seal circuit with B3:2/0 in the start
portion of the circuit.
For instance, if the emergency button is pushed while O:2/0 is on alone, B3:2/0 turns on and
seals just prior to O:2/0 turning off. Since B3:2/0 is now on, when I:1/14 is pushed signaling a
restart of the conveyors that were on when the emergency stop was pushed, B3:3/0 turns on and
turns off the seal circuit B3:2/0. B3:3/0 then turns on the seal circuit for O:2/0. Even though
B3:3/0 is on for only one scan, it can be counted on to turn off B3:2/0 and turn on O:2/0. The
following diagram shows a sequence in which the E-Stop button is energized sending the
conveyor to the “off” state (state 3) instead of the state 1 “off” state. When a reset button is
pushed, the state diagram signals a restart of the conveyor(s) that had previously been turned off
Ch. 11 Use of State Diagrams 19
due to the e-stop but not if stopped from other commands.
3
2
Off
1
Off,
Ready to
restart
Push
Start
Push
Stop Push
Restart
3
2
Off
1
Off,
Ready to
restart
Push
Start
Push
Stop Push
Restart
Fig. 11-21 State
Diagrams for
Completed Program
The example shows a scan-dependent program used to set and reset coils that are set by events to
do specific tasks. This is an example of a simple state diagram being used to define a set of
conditions and a programming technique that has been used with PLC programs extensively to
simplify relay logic and perform state logic.
Revisit Three Conveyors to Bin
The problem of control of a number of conveyors usually involves interlocking of the conveyors
so that a problem of back-up of product does not occur. If speed switches are introduced, they
should be programmed to turn off the conveyor attached to the zero- speed switch if the switch is
not active when the motor is told to turn on. The project below uses level switches to turn on
and off the prior conveyor if high level is achieved with each of three hoppers.
Ch. 11 Use of State Diagrams 20
High Level L1
Low Level L2
Conv C1
Bin 1
Conv C2
Conv C3
High Level L3
High Level L4
2
1
Init -
System
off
3 4
Bin 1 below
low level L2
Run
Cnvr C3
C1, C2 Off Hopper L4
not high
Run
Cnvr C2, C3
C1 off
Hopper L3
not high
Run Cnvr
C1, C2, C3
Bin 1 above
high level L1
Hopper L4 high
or C2 Fails
Hopper L4 high
or C2 Fails
Hopper L3 high
or C1 Fails
C1 Fails
Fig. 11-22
State Diagram
of Multiple
Conveyors
Picture the conveyors conveying coal over a long distance. State diagrams may help here to
describe this process. The design may be accomplished without the designer ever considering
state diagrams but they help the description of what is really going on with the system.
Conv C1
Bin 1
Conv C2
Conv C3
High Level L3
High Level L4
Fig. 11-23 Conveyor
Feed System
Ch. 11 Use of State Diagrams 21
The Electronic Safe – Definitely a State Diagram
Fig. 11-24
Electronic Safe
Operator Panel
6 2
3
Display for Code Num
Operator Panel
1 2 3
4 5 6
7 8 9
0
Keyboard
close
open
next
Door Locking Cylinder
Description of the locking mechanism of the electronic safe:
 There must be typed in 3 code numbers, each consisting of 3 digits;
 A digit typed in at the keyboard arises at the least significant place in the display; the
other digits already present on the display are shifted left
 Numbers to be compared to the three code numbers are stored in storage locations in PLC
 Each code number must be confirmed by pushing the ‘next’ button
 After pushing the ‘open’ button, the three numbers are compared with the code numbers
stored in the storage locations.
 If the code numbers are equal, then the door is opened. Otherwise, the opening algorithm
is blocked for 10 minutes.
 Pushing ‘close’ resets the display to 000, clears all input numbers and restarts the
algorithm and locks the door.
This design is very dependent on a good state diagram to complete. The conveyor system did
not require a state diagram for most experienced programmers to understand or build. The safe,
on the other hand, does. The state diagram on the next page, if followed, will lead the
programmer through the steps necessary to implement a program for unlocking and re-locking
the safe successfully. With no state diagram, the experienced programmer may succeed in
implementing the program but not as easily and the subsequent maintenance of the program will
be more difficult without it. Saving the document of the state diagram is necessary since it is not
carried along with the PLC program as part of the documentation. Its inclusion in a project
Ch. 11 Use of State Diagrams 22
document is strongly recommended.
Fig. 11-25
Electronic Safe
State Diagram
3 4 5
1
2
Home
Position
Cylinder off,
Numbers
reset to 000
7 8 9
6
11 12 13
10
14
Enter
First Digit
Enter
Second
Digit
Enter
Third
Digit
Enter
Next
Push
Open
Test if all 3
code
numbers
agree
15
Open
Cylinder
Push
Close
16
Close
Cylinder
Verify
Closed
Success
Fail
Init
Ch. 11 Use of State Diagrams 23
Component Parts Feed Mechanism – High Need for State Diagram
Fig. 11-26
Component Parts
Feed Mechanism
General Description:
A magazine is housing cylindrical parts (disks). A slide (separator) pushes out one disk to a
“pick up position” where a gripper picks up the disk and places the disk to the “deposit position”.
The component feeder is running as long as disks are available.
Operating modes
Either the Software HMI or discrete switches are used to run the feeder in different operating
modes. Switch S1 is used for changing the operating modes:
1 - Manual
2 - Homing
3 – Automatic
Homing cycle:
Before starting any automatic cycle, the feeder must be set up in its initial or homing position
(Switch S1 to “Home” and press button “Start”). The homing cycle ends if the feeder has
reached its homing position. The homing cycle stops after finishing the ongoing step if:
1 – “Stop” – pressed or if “Start” is pressed again
2 – If “Single Step” is activated by a selector switch. The feeder then steps
forward one step in homing cycle each time the “Start” button is pressed.
The homing cycle resets if switch S1 is turned on. The ongoing operation then stops
immediately.
Below are the three state diagrams for the cylinders in the machine. The state diagrams are not
linked but information from one is used in other diagrams. Notice the linkage.
Ch. 11 Use of State Diagrams 24
Separator moving Left
Separator resting in right
retracted position
Cylinder Resting at Left –
part extracted
Cylinder moving Right to home position
State Diagram of
Separator
X Cylinder moving Left
X Cylinder Resting
at Right
X Cylinder Resting
at Left
X Cylinder moving Right
State Diagram of X
Cylinder
Y Cylinder moving Up
Y Cylinder Down –
Suction on if X at Left
Suction off if X at
Right
Y Resting in Up
Position
Y Cylinder moving Down
State Diagram of Y
Cylinder
Fig. 11-27 Three Cylinder State Diagrams
Ch. 11 Use of State Diagrams 25
Manual Mode
In Manual mode, every actuator should be activated by pressing the appropriate button. The
manual mode position of S1 shall also serve to allow filling up the magazine with cylindrical
parts. Filling up the magazine should not be registered if the button is not switched to manual
mode when the magazine is being filled.
The actuator is locked in case of a wrong operation (e.g. the gripper can’t be moved from left to
right if the gripper is not in its UP position. All manual operations must be reset, if switch S1 is
switched over to any other operating mode.
Automatic Mode
By setting switch S1 to “Automatic” and pressing “Start”, the automatic cycle is started. A start
may only occur if the feeder is in its homed position. The automatic cycle ends in home position
if the magazine is empty.
The automatic cycle stops after the actual step if:
1 – “Stop” button is pressed; automatic cycle resumes if “Start” is pressed again.
2 – If “Single Step” is activated. Feeder steps forward one step in automatic cycle
every time “Start” is pressed again.
The automatic cycle resets immediately if S1 is moved to any other operating mode. The
ongoing operation then stops immediately. Starting automatic cycle again is only possible after
the feeder has been brought into its homing position (either in manual mode or with the help of
homing operation mode).
Interlocking Conditions which must be implemented first for security reasons:
Separator forth: no part must be below gripper and NOT (x-axis in pick up position and
gripper is not up)
Gripper down: separator is back and x-axis in one of its end positions
X-Axis move left: gripper is up and NOT (“x-axis move right” activated)
X-Axis move right: gripper is up and NOT (“x-axis move left” activated)
Suction on: --
A new programming language SFC (Sequential Function Chart) is used to combine the three
state diagrams above in one continuous program. The state diagrams could be combined as well
but for now, we will use the SFC diagram as a substitute.
Ch. 11 Use of State Diagrams 26
Fig. 11-28 SFC for Component Feeder
The Sequential Function Chart above shows the steps and gives the sequence of flow of logic. If
one were to rely on this program, there is a reason to worry about the logic in that the logic
performed in steps not currently active are not accessed or executed except in the step currently
active. If there were a condition about which safety is a concern, then this logic must be
replicated in each step, thus multiplying the complexity of the logic. Also, if this logic is
changed, then it would need to change in all locations, not just one.
Thus, logic that is common to all steps must be located outside the step logic. This adds a level
of complexity in that one must now determine whether to include logic that is only involved in
the step or common to all steps. Most logic will probably end up being placed in the common
logic area, in effect, negating the original concept of Sequential Function Chart or SFC logic.
Shown on the next page are the state graphs or state diagram for the component feeder. The first
is somewhat simpler diagram that does not take into account an event that may drop down parts
while in the homing mode. The second diagram answers this problem and prevents parts from
dropping down while in homing mode.
Ch. 11 Use of State Diagrams 27
Fig. 11-29 State Diagrams for Various Parts of Component Feeder
Ch. 11 Use of State Diagrams 28
State Diagrams Defined
State Diagrams have its origin in computer science. There are many advantages to State
Diagrams although they are not established in a national or international standard. They are
similar to Sequential Function Charts in that it describes a technical process or a functional
element of a machine tool in terms of states and transitions. The following figure shows a
typical state diagram with transition arrows and rules for traversing from state to state:
Fig. 11-30 State Diagram
At any time in a State Diagram, just one state can be active. State Diagrams may have branches
and loops and allow alternate ways of stepping through the graph. To go from one state to
another, there must be a transition between the two states; the original state must be active and
the transition must be fulfilled.
The next figure shows a Functional Element (a rivet device) and gives a functional description of
the control task with the help of a flow chart. There are two ways to construct a State Diagram.
We can just model the functioning according to the task description or we can build a real model
of all functional elements and combine them.
Fig. 11-31 - Riviter
Ch. 11 Use of State Diagrams 29
Fig. 11-32 Model of a Rivet Device (a) according to task description (b) according to the
physical device
The cylinder should press the rivet for 2 sec. in the down position. Which of the two models best
describes the physical process? Since the down position is time-dependent only, it is usually not
considered a state. It is up to the user which state diagram is preferred but usually time-
dependent only states are not necessary and may be combined in other states.
If there were two cylinders used in an operation, we could use either the task description or the
physical device description to describe the state diagram for the process. The task is to look at
the cylinder state graphs separately and then together to determine an optimal description of the
process. If this can be done, a program can be written from the combined state diagram of the
two independent cylinder state diagrams. The two cylinders below are described separately. The
clamping cylinder can be described in the following State Diagram:
Fig. 11-33 First of Two Cylinder State Diagrams
Ch. 11 Use of State Diagrams 30
The feed cylinder can be described in the following State Diagram:
Fig. 11-34 Second of Two Cylinder State Diagrams
Or we can start with a combined State Diagram combining the two:
Fig. 11-35 Combined Two Cylinder State Diagrams
Ch. 11 Use of State Diagrams 31
Run off Graphs consist of separate State Diagrams that are combined to show process actions in
several areas at once:
Fig. 11-36 - State Diagram for Juice Condenser discussed in earlier chapter
Introduction to Sequencers
Sequencers and sequential circuits are the result of the digital circuit state diagram. A machine
or a process may be identified as a sequential circuit that indexes from step to step usually only
in the forward direction. Decrementing back through the order of the steps is not tolerated in
the design of most sequencers. If steps are identifiable and inputs can be defined allowing the
process to advance from step to step and outputs change state from step to step, then a sequencer
is advised.
Sequencers are divided into three general categories in the PLC. They may be relay-based,
counter-based or sequencers using the SQx instruction set. Each will be discussed and examples
given.
Sequencers may also be linked together giving a combined control scheme in which various
sequencers hand off control between sequencers. Each sequencer is responsible for its actions
and interfaces with other sequencers when a product or part is handed between the sequencers.
Multiple sequencers may also save programming code if various sequential programs are similar
but not identical. This involves a type of subroutine control that uses a variety of step numbers
to allow some programs to act during each step.
Ch. 11 Use of State Diagrams 32
Relay-based sequencers are preferred since they are easier to read and understand by the
maintenance electrician. With an increase in complexity, the counter-based sequencer is
preferred. Counter-based sequencers are more easily changed and tolerate a greater number of
steps than relay-based sequencers. If a large number of inputs and outputs are required in the
sequencer, the choice leans more toward the SQx instructions. Timers may be used to add a time
delay between steps. Examples of the use of timers in the sequencer are given.
Example of Sequencer - Simple Robot
A robotic arm that uses pneumatic solenoids is a candidate for sequential programming. The
example below shows the steps in a sequence to successfully move a product from one position
to another using a simple robotic arm.
Down
UP
Side
View
Top
View
Limit Sw Not Activated
Limit Sw Activated
Robot down,
clockwise
Robot in home position:
Down
UP
Robot
Raised
Down
UP
Robot rotated
counter-
clockwise
Fig. 11-37a Simple Robotic Sequencer
Ch. 11 Use of State Diagrams 33
Down
UP
Robot grabs
part
Down
UP
Robot rotated
clockwise
with part
Down
UP
Robot lowered
with part
Down
UP
Robot releases
part
Fig. 11-37b Simple Robotic Sequencer (cont)
The operation of the robot can be summarized in the following table:
Step Position Required to Proceed Solenoid to Proceed
1 Down, rotated cw Start cycle pb Raise
2 Up, rotated cw Up l/s Rotate cw
3 Up, rotated ccw Ccw l/s Grabber in
4 Up, rotated ccw Part present Rotate cw
5 Up, rotated cw Cw l/s Lower
6 Down, rotated cw Cw l/s Grabber out
7 Down, rotated cw Done
Ch. 11 Use of State Diagrams 34
Next, an assignment of inputs and outputs for the functions is generated:
Address Function
I:0/0 Start cycle push button
I:0/1 Robot down l/s
I:0/2 Robot up limit switch
I:0/3 Robot CW limit switch
I:0/4 Robot CCW limit switch
I:0/5 Part present limit switch
O:0/0 Raise robot solenoid
O:0/1 Rotate ccw solenoid
O:0/2 Rotate cw solenoid
O:0/3 Release part
O:0/4 Grab part
Home position is used for initialization of the program. It is:
Address Function State
I:0/1 Robot down limit switch On
I:0/2 Robot up limit switch Off
I:0/3 Robot CW limit switch On
I:0/4 Robot CCW limit switch Off
I:0/5 Part present limit switch Off
Homing is a separate program from the sequence program that attempts to move the machine to
the state of “home”. This is the position that the sequential program is looking for to move from
state 0 to state 1. The homing program and sequence program share the same output rungs
turning on and off outputs to control movement to accomplish their various tasks. The task of
the homing program is to satisfy the states of all permissive contacts in rung 0 of the program.
The state diagram is on the next page. It follows the one-way flow of the sequential program
allowing only flow in one direction. The progression follows step-by-step with an easy decision
at the end of each step allowing the program to move to a set next step.
In most instances, only one input must be satisfied to move to a next step with a short time delay
at the end of the step to allow the robot a short amount of time to settle before moving on.
Ch. 11 Use of State Diagrams 35
3
2
Grip
Part
1
4
5
6
7
Init
Robot at Home
Position
Not Moving
Moving Up
Button Pushed
Initial Conditions
Satisfied
Rotating
Counterclockwise
Up LS Satisfied
CCW Limit
Satisfied
Rotating Clockwise
Part
Secured
Moving Down
CW Limit
Satisfied
Down LS
Satisfied
Release
Part
Gripper Empty
Fig. 11-37c State Diagram for Simple Robot
The state diagram above could have two steps where one is shown here. In the riveter example,
if a machine is not resting in a position, the position is not classified as a step although there is
no reason it could not be added. The program shown below uses only one rung of logic for each
step and it seems clearer for each step to correlate to a rung of logic if possible.
Homing may be necessary as a separate state diagram. The homing portion may include a
number of state diagrams depending on what state the machine is in at the time a homing request
is made.
Ladder Program for Robot Sequencer
To program the sequencer using relay ladder logic, start with an initialization rung and then
program rungs that depend on the prior rung plus an output to set the next rung.
Ch. 11 Use of State Diagrams 36
Step 1
Step 2
Step 3
Step 4
Step 5
Step 6
Step 7
Fig. 11-38 Simple Robotic Sequencer in Ladder with Coil Logic
Ch. 11 Use of State Diagrams 37
In the program, the initialization rung is rung 0. This rung checks all limit switches to verify the
robot is in its home position. Each appropriate limit switch is checked. For instance, both the
limit switch for end of travel in one direction and the limit switch for end of travel in the
opposite direction are checked for each set of limit switches. The initialization button then turns
on the first internal B relay coil – B3:0/0. In the PLC, it is easy and requires no additional wiring
to include both end-of-travel limits. With cost no problem, the addition of both sets of contacts
provide additional safety if a contact were to fail.
Rung 0 turns on starting the shift register. Then the shift register waits to proceed. Succeeding
steps are entered below:
Move from step 1 to step 2: I:0/2 on, I:0/1 off Go to step 2 (rung 1)
Move from step 2 to step 3: I:0/4 on, I:0/3 off Go to step 3 (rung 2)
Move from step 3 to step 4: I:0/5 on Go to step 4 (rung 3)
Move from step 4 to step 5: I:0/3 on, I:0/4 off Go to step 5 (rung 4)
Move from step 5 to step 6: I:0/1 on, I:0/2 off Go to step 6 (rung 5)
Stop I:0/5 off Done, End
Output List:
Step 1- Outputs change to go from step 1 to step 2
O:0/0 on Raise robot
Step 2- Outputs change to go from step 2 to step 3
O:0/1 on Arm moves CCW
Step 3- Outputs change to go from step 3 to step 4
O:0/4 on Grab part
Step 4- Outputs change to go from step 4 to step 5
O:0/2 on Arm moves CW
Step 5- Outputs change to go from step 5 to step 6
O:0/0 off Robot lowers
Step 6- Outputs change to go from step 6 to step 7
O:0/3 on Release part
The output list is not developed in the same section of rungs as the logic of the sequencer since
outputs may be on or off across multiple steps. Output logic is developed after the sequencer is
in place and combines the states of the sequencer for which the output is on or off.
As the sequencer moves from step to step, the sequencer using coils successively turns on the
next coil set in the sequence. When the last step is being executed, all the coils in the string are
Ch. 11 Use of State Diagrams 38
observed on. When the last step completes, the coils are turned off. This characteristic of the
sequencer allows the maintenance person to quickly observe the last coil on in the string and
surmise that the sequence is hung at the next step. This gives the maintenance person a handy
method of troubleshooting the sequencer using relays. Care must be taken to not allow the next
sequence to start while the sequencer is finishing the present sequence. Logic should account for
not allowing a new starting pulse while the last sequence is still being executed.
While this type of sequencer seems to be cumbersome, it is used a great deal as long as the
sequencer length is not long and the steps are well defined. If the steps are not well defined, a
second method using a counter should be employed. Using a counter allows additional steps to
be inserted more easily than with relays. Both methods of using coils or a counter provide a
memory of where the sequence has been and where it next is expected to move. In general, coils
and counters are equal. Counters can be a bit more flexible, however, when adding a number of
steps quickly.
Using Counters to Control Sequencers
As sequencers become more complicated, the need for a more robust sequencer programming
technique becomes necessary. As a second approach, it is suggested that a number in an N7
location be used to identify the present state of the sequencer. Usually a step number is
employed. If the number is 0, the sequencer is not active. If it is positive, then the sequencer is
active and the sequencer is in the state of the number. As the number is incremented, the
sequencer moves to the next step.
Very large sequencers may be built in this way. If the sequencer is in a particular state, the EQU
block allows logic to be performed exclusively in that state. The rung below shows an
initialization step using a number for the step counter.
Fig. 11-39a Simple Robotic Sequencer in Ladder using Numbers for Steps
Using the logic from the original sequencer, initialization moves a 1 into the sequence counter
located in N7:1. While it is not required that one-shot logic be used, it is usually recommended.
Example using Counters to Increment Sequencer:
Ch. 11 Use of State Diagrams 39
Fig. 11-39b Simple Robotic Sequencer in Ladder using Numbers for Steps
As each state is satisfied, the sequencer moves to the next state based on logic similar to the
relay-based sequencer. An advantage of using a number to drive the sequencer is that several
steps may be jumped over and then filled in at a later date. For instance, if it is known that a
sequencer is going to be complicated and that several steps are not fully known, plan the
program to skip some steps and then go back and fill them in as necessary. Skipping steps or
changing steps is much easier with a number than with the sequencer using only coils and seal
circuits.
Any of a number of other methods using bits or numbers can be used for sequencer control. For
instance, a sequencer may be programmed using a word with a bit initially placed in the least
significant bit and rotated one bit to the left for each step. This approach is as valid as either of
the approaches listed above.
Adding Time between Steps
Each of the sequencer types potentially needs a time delay between the end of the prior step and
the beginning of the next step. With the original relay circuit sequencer, the fix is easy. It
requires only that a timer be placed between each step. This may be accomplished by
programming the following:
Ch. 11 Use of State Diagrams 40
Fig. 11-40a Adding Timer Delay Between Steps using Coils
To program a time delay between steps of a sequencer using counters, sense the change of step,
delay a time period and step to the next step using a one-shot. See below for an example of the
time delayed counter sequencer.
Fig. 11-40b Adding Timer Delay Between Steps using Numbers
Using the SQx Instructions
A third approach uses the sequencer instruction to direct step number and output state. The
instructions SQO, SQL, and SQC of RSLogix 500 or SQI, SQO and SQL of RSLogix 5000 are
three instructions used to define and operate a sequencer. Several Sequencers may be combined
to coordinate large sequencer blocks.
Why is it not advisable to use these instructions as compared to the methods used above? The
sequencer instruction set is quite complicated but once set up tends to work very well. The
reason that sequencers are built without incorporating the SQx instruction set is that sequencers
programmed with the SQx instructions tend to be very difficult to troubleshoot by others. This
may lead to difficulty in keeping a process running. The original programmer may understand
the concept from layout to implementation but as documentation is lost or not available and an
electrician or other technical person is brought in to troubleshoot the sequencer, the difficulty of
finding broken equipment interacting with the sequencer is great. The SQC instruction moves a
Ch. 11 Use of State Diagrams 41
step each time it receives a off-to-on transition. It moves sequentially through the programmed
sequencer file. It compares data through a mask to a source word or file to check for equality.
The Mask is a hexadecimal code or the address of a mask word or file. If the mask is designated
as a file, its length is equal to the sequencer file’s length.
The Source is the address of the input word or file for which a SQC instruction obtains data for
comparison to the sequencer’s file.
Sequencers are built by setting up tables in files which then are executed with the SQx
instructions. A table is built for each portion of the SQO and SQC instruction. The Output
Table for a 10-step sequence controlling up to 16 outputs is shown below.
Output Table:
Step 1
Step 2
Step 3
Step 4
Step 5
Step 6
Step 7
Step 8
Step 9
Step 10
Mask allows bit in output word to be set either 1 or 0 when mask bit set.
Mask
yields:
Output
Ch. 11 Use of State Diagrams 42
Using Sequential Logic in State Diagrams with Runoff
Combinations of sequential logic may be combined using Runoff State Diagrams. An example
from industry will be used. The exact application will be somewhat obscured to protect the
company’s proprietary information. The application moves steel billets through a reheat process.
The billets are staged on a conveyor and then positioned to transfer to a second table prior to
entry to a re-heat furnace.
First, a billet is laid on a table with rolling collars capable of moving the billet in the direction
noted. The billets proceed to the transfer table (second table) as shown. When two billets are on
the transfer table, then they are ready to transfer as more billets are laid on the first table.
Billet laid
on table
Billet
moving
Second
Billet laid
on table
Billet
moving
First Billet
in position
to transfer
BothBillets
in position
to transfer
Another
Billet laid
on table
Billet
moving
Fig. 11-41a Physical Layout of Billets Moving on Table in Steel Plant
Ch. 11 Use of State Diagrams 43
Once the billets are in position to transfer, the second table sends a “ready” signal to the Charge
Table and waits for a “clear” signal to begin transfer of billets onto the Charge Table.
BothBillets
in position
to transfer
Billet
stopped
Charge Table must
be free of billets
Both Billets begin
to transfer
Billet
stopped
Charge Table must
be free of billets
Billet
moving
Charge Table Accepts Billets, ready
to charge to furnace
Billet laid
on table
Re-heat
Furnace
Fig. 11-41b Physical Layout of Billets Moving between Tables in Steel Plant
Now, billets are in place on the Charge Table ready to charge into the furnace while other billets
are being positioned and ready to come onto the Charge Table when it is clear again.
Ch. 11 Use of State Diagrams 44
A state diagram of the operation is shown below. Notice that the tables are linked in the state
diagram. Notice that the third sequencer is used to take billets out of the back end of the furnace.
This action must be coordinated with the charging of the furnace in order to keep the charge and
removing of the billets in sync.
Start Billet
Transfer State
Step 1
Receive Billet
Step 2
Move to Charge
Step 3
Move 2 to Chrge
Step 4
Wait for Synq
Step 5
Mv 2 Billets Off
Step 6
Billets Clear
Start Charge
Table Xfer State
Step 1
Xfer Table Clear
Step 2
Accept Billets
Step 3
Billets in Position
Step 4
Wait for Synq
Step 5
Charge Furnace
Step 6
Charge Done
Start Furn
Discharge State
Step 1
Ready to Accept
Step 2
Accept Billets
Step 3
Discharge Ready
Step 4
Discharge #1
no
Step 5
Discharge #2
Step 6
Discharge #3
Step 7
Discharge #4
yes
Fig. 11-41c Billet State Diagram
Ch. 11 Use of State Diagrams 45
Here the furnace is shown with billets filling the furnace from charge end to discharge end. The
billets must be able to move into the furnace but only when there is room after a discharge takes
place. The charge end state table must not act until room is available after discharge happens.
This corresponds to step 3 of the second state table attached to state 3 of the third state table.
The charge occurs at this time. Discharge occurs at another step in the process.
Charge Table Accepts Billets, ready
to charge to furnace
Re-heat
Furnace
Billet
moving
Fig. 11-41d Billet State Diagram
Ch. 11 Use of State Diagrams 46
Multiple Sequencers Using Same Program
If an operation is similar to another operation except for the movement of a part or some other
common occurrence, a state diagram may be used with the same program and multiple steps
input to common logic. For example, the following state diagram may use a common program
for step 1, step 11 and step 21 if the same action is done in each. A program such as this would
be equivalent to a looping program in which the same operations are done in common for a
number of different steps.
Billet moving
Logic from Step 1
Billet moving
Logic from Step 11
Billet moving
Logic from Step 1
Billet moving
Logic from Step 11
Billet moving
Logic from Step 21
Fig. 11-41e Billets
Moving From Furnace
Start Seq
Step 21
Step 22
Step 23
Step 24
Step 25
End Seq
Step 15
Step 14
Step 1
Step 2
Step 3
Step 4
Step 5
Step 11
Step 12
Step 13
Ch. 11 Use of State Diagrams 47
The following logic could be used to control multiple steps using common logic:
State diagrams using numbers can use the logic above to combine the logic of multiple steps
simply by using the program structure above.
Systems of State Tables
State tables can be ganged together similar to the furnace state table described above in large
systems. For example, the emptying of a parking lot of cars may resemble the following
sequence:
E D C B
F E D C
A
G F E D
B
Fig. 11-42
Step
= 1
Step
= 11
Step
= 21
Logic common to
steps 1, 11, 21
Fig. 11-41f
Ch. 11 Use of State Diagrams 48
Each car moves from station to station and then waits for the next station to empty before
moving forward. Each station may be a state diagram in a manufacturing setting. At each
station, an action is done to the part. One station for instance can add a component and the next
station can weld the component to the main body of the part. Each action depends on the prior
action successfully completing and then proceeding. Without the first car moving forward, the
succeeding cars are stuck but with its movement, then the next car moves forward followed by
the next, etc. Each operation at each station is important to the overall fabrication of the part and
each station’s activity is a state diagram (possibly a sequential state diagram). The outcome is a
complicated process that can be broken down into several small operations with the interlinking
of states one to another.
Each process in the figure below starts with a step 1 followed by 2, 3, 4, 5, etc. At each juncture,
there is a hand-off to a subsequent process. The hand-off occurs at a prescribed step in the
sequence of steps. Each hand-off must be coordinated between two separate state tables.
Step 1
Step 2
Step 3
Step 4
Step 5
Step 1
Step 2
Step 3
Step 4
Step 5
Step 1
Step 2
Step 3
Step 4
Step 5
Step 1
Step 2
Step 3
Step 4
Step 5
Step 1
Step 2
Step 3
Step 4
Step 5
Step 1
Step 2
Step 3
Step 4
Step 5
A
B
C
D
E
F
B
C
D
E
F
G
B
C
D
E
F
C
D
E
F
E
F D C B
B
E
F
F
D C B
E D C B
F E D C B
Ch. 11 Use of State Diagrams 49
When a sequence such as this is being planned, the last part (at the furthest downstream station)
is moved off the table and then the next part is moved into the last station and each part upstream
can move downstream one station. Their motion is similar to the cars moving up a station in the
figure of the previous page.
While we use cars to show the sequence, the item may be a single piece of glass or anything
requiring a position where only one can fit in the next station. If there is no limit to the number
of parts that can fit in a waiting line for the next station, there does not need to be the linking
between sequencers as shown above. An example of this would be pallets in a machining
operation in which a pallet is free to move to the next station no matter what the state of the
downstream operation is. In this circumstance, there would be no need to tie state diagrams
together. Each operation would have a state diagram independent (for the most part) from the
preceding operation’s state diagram.
Pallet
Pallet
Pallet
Pallet Pallet
Pallet Pallet
Vertical Mill
Welding Machine
Machine Flow
More intricate state diagrams are defined in future chapters such as Ch. 13 which is interested
with batching operations. The state diagram defines entire portions of the programming process
and serves as a discussion point to define the program prior to actually committing to a design.
The state diagram is useful in the very simple diagrams at the beginning of the chapter or with
those at the end of this chapter or in future chapters in this text. The state diagrams of the
exercises at the end of this chapter in many cases are as difficult to design as the actual program
that follows the state diagram and actually controls the process.
Timing of Steps
In many processes, there are bottle-necks which the PLC programmer may be requested to
remove. Timing of movement between stations is an area of concern in many applications. If
the pallet or part is not present at the station before the step is to be accomplished, then the time
to travel may be the bottle-neck. If possible, the programmer should look for ways to avoid this.
One method is to move a piece half-way between two stations which effectively cuts down travel
time by half. If the program will not allow this type of control, other ways such as tracking of
parts and knowing exact position may be used. In any event, while the PLC programmer may
not be thought of as a time-study expert, he/she should consider the time taken to travel between
stations as dead time and minimize it.
Troubleshooting Hint
A troubleshooting hint for one-shots is to program a counter or adder (pseudo-counter) to record
the one-shot event. Either counter or adder works well to trap the event that usually is not seen
Ch. 11 Use of State Diagrams 50
on the computer screen. I0.0 is seen but |P| of I0.0 is not. If a program contains several contacts
such as |P| of I0.0, then use the circuit shown below to trap or show instances of the one-shot
occurring in logic:
Fig. 11-43
Revisit “Last Coil Wins”
In previous chapters, it was stressed that since the last coil wins, coils should never be double
programmed. However, if a coil is being used with logic from several different sources, it is
possible to use a coil more than once with prior occurrences carrying forward to later
occurrences. This type of programming can become a logistical nightmare and should be
avoided. It does show the scan-dependent nature of programming and the ability to program
ladder logic that would not work the same if re-arranged.
A x
B C
x x
D E
x x
F G
is equal to:
A x
B G
C D E F
Fig. 11-44 Accepted Multiple Use of Output Coil
Ch. 11 Use of State Diagrams 51
Care must be taken to keep rungs of logic programmed in this way close together. If the output x
is programmed as the rungs above and the rungs are not close together, other rungs using x may
be on when the actual state of x is off. The opposite may also be true. This is something that
might be a useful tool in a program. In that case, ignore the previous warning of “last coil wins”
and use the programming technique.
We may have drifted a bit from the original subject of the chapter with a discussion of state
diagrams. The topics discussed are of importance in developing good programs and should be
considered in the scope of the state diagram. The importance of understanding when the
programmer has need of state diagrams is extremely important and should be discussed in
tandem with the subject of how to program a state diagram program.
Planning For Problems at End of Chapter
The problems at the end of the chapter are good practice problems for you to try your skill at
developing a state diagram. Some are quite difficult. Others will be able to be done in a few
minutes. The longer, harder problems can be split into a number of smaller state diagrams that
are joined together.
For instance, the problems involving stacking or moving of material each have three modes:
• Manual
• Homing
• Automatic
The elevator problem has two modes:
• Regular operating
• Irregular operating
A good first step would be to look for the modes if defined and build a state diagram for the
mode. The mode might involve a number of simple state diagrams within the over-all diagram.
For instance, most manual modes allow the operator to move independently an axis or part of the
machine from a jog control as long as the movement does not bind or hurt another part of the
machine. Some programs don’t care and allow the user to do what they want in this mode with
the realization that if a crash or crunch occurs, the user will be the one to suffer. Sometimes this
is best since the machine may need to be moved or jostled a little to free it from a bind or
abnormal position. The programmer is usually the one to decide the safety limits and the
programmer may decide to include the safety logic or not, especially in the manual mode.
Homing includes a number of moves the machine must make to restore it to a proper start
position. Home is the position the machine expects to start its automatic operation from.
Automatic is the mode most used. It should include time delays between steps sufficiently long
to allow for proper movement but short enough to allow the proper amount of parts to be
manufactured to satisfy the operation.
Ch. 11 Use of State Diagrams 52
If a problem does not define the mode, the programmer has the discretion to include certain
attributes of the program in the mode or not. Usually the operator will help with defining the
mode so that this person can most easily understand the operation of the machine and diagnose
simple problems without the aid of the electrician or engineering programmer. Your best
defense is to please the operator. Then please everyone else to the best of your ability. The
machine tender or operator and the electrician are your best friend. Cultivate a positive
atmosphere with each of them and your job will be easier by far.
The following common device has similar characteristics to the sequencers built above. The
device is used to turn on and off household lights with the programming of the timer by pushing
in the indented buttons around the 24-hour clock.
Fig. 11-45 Sequencer Simplified
Ch. 11 Use of State Diagrams 53
Summary
This chapter is about state diagrams and their little cousin, the sequencer. Both of these tools are
useful in programming difficult machine operations and allow the programmer to walk away
after an installation with the satisfaction that the operation of the machine has been developed
logically and the maintenance of the machine will be easier than if developed otherwise.
A common statement from many end users who depend on others to program their processes is
that they don’t want “spaghetti code”. This is a metaphor for difficult-to-diagnose code. We
have all seen others’ code that we would term spaghetti code and wonder who would have ever
created such a mess. We should remember that we need to look at the end product from the
customer’s point of view and give the best effort to create a program that both works and is
maintainable.
A systems engineer once looked at my efforts and asked if I knew the KISS method. I did and I
got it. The last letter of the KISS method is one that you or I do not ever want as part of our
label.
Whether you are strongly convinced that state diagrams are a good way to see how to start a
program or not, consider that one of the first programs you will probably be asked to produce is
one similar to the one with the small robot moving the egg seen in this chapter. The ‘boss’ will
try you out on something considered quite simple and in most cases developed in a few hours as
opposed to days or weeks or months. It is a test. So, if you are to pass this initial test, you
should be able to see the problem as a simple sequence and develop the program appropriately.
This is a strong motivator for you to understand the concepts, at least to a point, for how to
develop a sequential program (or state diagram program). Hopefully you will be able to move
quickly through this initial test and onto more meaningful programs down the road.
Ch. 11 Use of State Diagrams 54
Exercises
1. Elevator Problem – Provide a set of State Diagrams for the Elevator
2. Provide State Diagram(s) for the following:
Low Level L0
Bucket El BE1
Screw Conv SC1
Pump P1
Pump P2
Agitator A1
High Level L4
Bin 1
Screw Conv SC2
Level L1
Level L2
Level L3
Ch. 11 Use of State Diagrams 55
The main tank will fill with conveyor SC1 and bucket elevator BE1 as well as liquid from pumps
P1 and P2. To make a batch, fill to a level L1 with the ingredient from the bucket elevator.
Then fill to a second level L2 with the ingredient from Pump P1. Then turn on the agitator and
fill to a final level P3 with the ingredient from Pump P2. When done, agitate for a time and
dump using SC2.
3. Provide State Diagrams for the following machine:
Ch. 11 Use of State Diagrams 56
4. Provide State Diagrams for the following machine:
5. The following Simon Says State Diagram has various labels associated with the circles
(bubbles). Label each bubble according to the attached list:
a. Not Playing
b. Flash Lights
c. Playing/Pushing Buttons
d. Playing/Showing Lights
2
1 3
Error
Success
4
Won
Ch. 11 Use of State Diagrams 57
6. From the following two figures below, first fill in the table of inputs and outputs:
Ch. 11 Use of State Diagrams 58
Fill in Definition of Inputs:
Sensor Function/State Signal Assignment
Fill in Definition of Outputs:
Then write logic to perform the automatic operation of the feeder.
7. The problem below moves a part left to right and into a sanding station. The sander only
turns on after PE 2 sees the part. When the part reaches PE 3, the sander turns off and the
part returns to the left to PE 1.
Draw a state diagram and then write a program in Ladder to control the action described
when the start button is pushed and the system automatically repeats the travel right, then left
five times. Include a short time delay at each end of travel.
Actuator Function/State Signal Assignment
Ch. 11 Use of State Diagrams 59
Start Button PB1
Part Travels Down
Machine
Part is sanded
Part Travels Back
Part Stops, is Removed
after 5 passes
PE3
PE2
PE3
PE3
PE3
PE1
Ch. 11 Use of State Diagrams 60
Lab 11.1 Three Pumps
Three pumps are arranged as follows to provide cooling water for a manufacturing plant. For
cooling to occur, at least one of the pumps must be on at all times but if no cooling is required,
all pumps are to be turned off. For more cooling, a second pump is requested to turn on,
followed by a third pump if sufficient cooling is still not received. To protect each from wearing
out prematurely, a plan has been devised to allow each pump to turn on and off by using logic to
turn on the next pump in sequence and turn off the pump that has been on the longest. Timers
should not be used to determine the pump on longest but rather logic should be used to determine
which pump should have been on the longest. For example, if pump 2 and 3 are on but 1 is off,
pump 2 is the one that should be turned off since it probably came on before 3 did. If a call for
less cooling is received and all three pumps are on, the pump that was logically on for the longest
time should be turned off. The system starts out with no pumps on and when a call for more
occurs, pump 1 will turn on. Then the system is cyclical rotating through pumps 2, 3, 1, 2, etc.
Pump 1
Pump 2
Pump 3
More
Less
Options:
Lab 11.1 Add auto/manual switches for 1, 2, or 3 pumps. Auto will allow cycling of a
pump normally while manual will allow a pump to be started and stopped with a
push-button.
.1- P1(A/M), P2(A/M), P3(A/M)
.2- P1(A/M), P2(A/M), P3(A)
.3- P1(A/M), P2(A), P3(A/M)
.4- P1(A), P2(A/M), P3(A/M)
.5- P1(A/M), P2(A), P3(A)
.6- P1(A), P2(A/M), P3(A)
.7- P1(A), P2(A), P3(A/M)
.8 - add a fourth pump and have all P1-P4 either (A/M)
Note: The base program of Lab 11.1 is called a floating master for the pumps. The master is
initialized as pump 1 until pump 2 turns on when it becomes the master. Pumps turn of based on
the principle of leaving the master pump on as long as possible. Therefore, pump 1 would turn
Ch. 11 Use of State Diagrams 61
off before pump 2 if both pump 1 and pump 2 are on.
The Pump Demand Program Hints
Notice the position of the logic is extremely important in that the scan is used to do operations in
a sequential order within the scan. This programming technique can aid in solving very difficult
sequential logic such as this problem with minimal difficulty. Use of the scan is a great aid in
programming and sequential programming in particular.
2
Off
Rules to
turn on
Pump 1
1 On
Rules to
turn off
Pump 1
Pump 1
Define One Shots for
Increase, Decrease
Establish rules for On,
Off of various pumps
2
Off 1 On
2
Off 1 On
Pump 2
Pump 3
2
Must also establish
logic for:
1 3
States 1-3 mutually
exclusive (only one
on at a time)
Pump 1
on last
Pump 2
on last
Pump 3
on last
Rules to
turn on
Pump 2
Rules to
turn on
Pump 3
Rules to
turn off
Pump 2
Rules to
turn off
Pump 3
Lab 11.2 Four Fans – Repeat of 11.1 except for four fans instead of three pumps

More Related Content

Similar to PLC: Capitulo 11 uso de diagramas de estado

Ch. 5 Control Task Basics 1 Chapter 5 Control Task Basi.docx
 Ch. 5  Control Task Basics 1 Chapter 5  Control Task Basi.docx Ch. 5  Control Task Basics 1 Chapter 5  Control Task Basi.docx
Ch. 5 Control Task Basics 1 Chapter 5 Control Task Basi.docxaryan532920
 
Experiment No 2.control.pdf
Experiment No 2.control.pdfExperiment No 2.control.pdf
Experiment No 2.control.pdfMahamad Jawhar
 
Boiler Feed Water Control
Boiler Feed Water ControlBoiler Feed Water Control
Boiler Feed Water Controlno suhaila
 
Odd numbered home work problem solutions
Odd numbered home work problem solutionsOdd numbered home work problem solutions
Odd numbered home work problem solutionsSANTIAGO PABLO ALBERTO
 
Ch 2 Ladder Basics 1 Chapter 2 Ladder Basics .docx
     Ch 2 Ladder Basics 1 Chapter 2  Ladder Basics  .docx     Ch 2 Ladder Basics 1 Chapter 2  Ladder Basics  .docx
Ch 2 Ladder Basics 1 Chapter 2 Ladder Basics .docxhallettfaustina
 
Vacuum loader user manual
Vacuum loader user manualVacuum loader user manual
Vacuum loader user manualssuser660147
 
Design and Simulation of Aircraft Autopilot to Control the Pitch Angle
Design and Simulation of Aircraft Autopilot to Control the Pitch AngleDesign and Simulation of Aircraft Autopilot to Control the Pitch Angle
Design and Simulation of Aircraft Autopilot to Control the Pitch AngleEhab Al hamayel
 
Applying a Model Based Testing for a Controller Design in Fault Detection, I...
Applying a Model Based Testing for a Controller Design in Fault  Detection, I...Applying a Model Based Testing for a Controller Design in Fault  Detection, I...
Applying a Model Based Testing for a Controller Design in Fault Detection, I...IOSR Journals
 
Meeting w12 chapter 4 part 2
Meeting w12   chapter 4 part 2Meeting w12   chapter 4 part 2
Meeting w12 chapter 4 part 2Hattori Sidek
 
Up/Down Converter Linear Model with Feed Forward and Feedback Stability Analysis
Up/Down Converter Linear Model with Feed Forward and Feedback Stability AnalysisUp/Down Converter Linear Model with Feed Forward and Feedback Stability Analysis
Up/Down Converter Linear Model with Feed Forward and Feedback Stability AnalysisCSCJournals
 
BOTTLE LINE SIMULLATION IN LOGIXPRO
BOTTLE LINE SIMULLATION IN LOGIXPROBOTTLE LINE SIMULLATION IN LOGIXPRO
BOTTLE LINE SIMULLATION IN LOGIXPROMohan Tangudu
 
Introductiontoflowchart 110630082600-phpapp01
Introductiontoflowchart 110630082600-phpapp01Introductiontoflowchart 110630082600-phpapp01
Introductiontoflowchart 110630082600-phpapp01VincentAcapen1
 
control-system-ppt.pptx
control-system-ppt.pptxcontrol-system-ppt.pptx
control-system-ppt.pptxlorevit
 

Similar to PLC: Capitulo 11 uso de diagramas de estado (20)

PLC4.docx
PLC4.docxPLC4.docx
PLC4.docx
 
PLC4.docx
PLC4.docxPLC4.docx
PLC4.docx
 
Elevator1
Elevator1Elevator1
Elevator1
 
Level tuning. by zakpdf
Level tuning. by zakpdfLevel tuning. by zakpdf
Level tuning. by zakpdf
 
Ch. 5 Control Task Basics 1 Chapter 5 Control Task Basi.docx
 Ch. 5  Control Task Basics 1 Chapter 5  Control Task Basi.docx Ch. 5  Control Task Basics 1 Chapter 5  Control Task Basi.docx
Ch. 5 Control Task Basics 1 Chapter 5 Control Task Basi.docx
 
Experiment No 2.control.pdf
Experiment No 2.control.pdfExperiment No 2.control.pdf
Experiment No 2.control.pdf
 
Boiler Feed Water Control
Boiler Feed Water ControlBoiler Feed Water Control
Boiler Feed Water Control
 
Odd numbered home work problem solutions
Odd numbered home work problem solutionsOdd numbered home work problem solutions
Odd numbered home work problem solutions
 
Fundamentals of Programming Chapter 7
Fundamentals of Programming Chapter 7Fundamentals of Programming Chapter 7
Fundamentals of Programming Chapter 7
 
Ch 2 Ladder Basics 1 Chapter 2 Ladder Basics .docx
     Ch 2 Ladder Basics 1 Chapter 2  Ladder Basics  .docx     Ch 2 Ladder Basics 1 Chapter 2  Ladder Basics  .docx
Ch 2 Ladder Basics 1 Chapter 2 Ladder Basics .docx
 
Vacuum loader user manual
Vacuum loader user manualVacuum loader user manual
Vacuum loader user manual
 
Design and Simulation of Aircraft Autopilot to Control the Pitch Angle
Design and Simulation of Aircraft Autopilot to Control the Pitch AngleDesign and Simulation of Aircraft Autopilot to Control the Pitch Angle
Design and Simulation of Aircraft Autopilot to Control the Pitch Angle
 
Applying a Model Based Testing for a Controller Design in Fault Detection, I...
Applying a Model Based Testing for a Controller Design in Fault  Detection, I...Applying a Model Based Testing for a Controller Design in Fault  Detection, I...
Applying a Model Based Testing for a Controller Design in Fault Detection, I...
 
Meeting w12 chapter 4 part 2
Meeting w12   chapter 4 part 2Meeting w12   chapter 4 part 2
Meeting w12 chapter 4 part 2
 
Up/Down Converter Linear Model with Feed Forward and Feedback Stability Analysis
Up/Down Converter Linear Model with Feed Forward and Feedback Stability AnalysisUp/Down Converter Linear Model with Feed Forward and Feedback Stability Analysis
Up/Down Converter Linear Model with Feed Forward and Feedback Stability Analysis
 
PLC4.pdf
PLC4.pdfPLC4.pdf
PLC4.pdf
 
Project on PLC (SILO)
Project on PLC (SILO)Project on PLC (SILO)
Project on PLC (SILO)
 
BOTTLE LINE SIMULLATION IN LOGIXPRO
BOTTLE LINE SIMULLATION IN LOGIXPROBOTTLE LINE SIMULLATION IN LOGIXPRO
BOTTLE LINE SIMULLATION IN LOGIXPRO
 
Introductiontoflowchart 110630082600-phpapp01
Introductiontoflowchart 110630082600-phpapp01Introductiontoflowchart 110630082600-phpapp01
Introductiontoflowchart 110630082600-phpapp01
 
control-system-ppt.pptx
control-system-ppt.pptxcontrol-system-ppt.pptx
control-system-ppt.pptx
 

More from SANTIAGO PABLO ALBERTO

Manual de teoría y practica electroneumática avanzada
Manual de teoría y practica electroneumática avanzadaManual de teoría y practica electroneumática avanzada
Manual de teoría y practica electroneumática avanzadaSANTIAGO PABLO ALBERTO
 
Programacion de PLC basado en Rslogix 500 por Roni Domínguez
Programacion de PLC basado en Rslogix 500 por Roni Domínguez Programacion de PLC basado en Rslogix 500 por Roni Domínguez
Programacion de PLC basado en Rslogix 500 por Roni Domínguez SANTIAGO PABLO ALBERTO
 
Programación de microcontroladores PIC en C con Fabio Pereira
Programación de microcontroladores PIC en  C con Fabio PereiraProgramación de microcontroladores PIC en  C con Fabio Pereira
Programación de microcontroladores PIC en C con Fabio PereiraSANTIAGO PABLO ALBERTO
 
Análisis y Diseño de Sistemas de Control Digital por Ricardo Fernandez del Bu...
Análisis y Diseño de Sistemas de Control Digital por Ricardo Fernandez del Bu...Análisis y Diseño de Sistemas de Control Digital por Ricardo Fernandez del Bu...
Análisis y Diseño de Sistemas de Control Digital por Ricardo Fernandez del Bu...SANTIAGO PABLO ALBERTO
 
Programación de autómatas PLC OMRON CJ/CP1
Programación de  autómatas PLC OMRON CJ/CP1Programación de  autómatas PLC OMRON CJ/CP1
Programación de autómatas PLC OMRON CJ/CP1SANTIAGO PABLO ALBERTO
 
Manual del sistema del controlador programable S7-200 SMART
Manual del sistema del controlador programable S7-200 SMARTManual del sistema del controlador programable S7-200 SMART
Manual del sistema del controlador programable S7-200 SMARTSANTIAGO PABLO ALBERTO
 
PLC: Buses industriales y de campo practicas de laboratorio por Jose Miguel R...
PLC: Buses industriales y de campo practicas de laboratorio por Jose Miguel R...PLC: Buses industriales y de campo practicas de laboratorio por Jose Miguel R...
PLC: Buses industriales y de campo practicas de laboratorio por Jose Miguel R...SANTIAGO PABLO ALBERTO
 
PLC y Electroneumática: Electricidad y Automatismo eléctrico por Luis Miguel...
PLC y Electroneumática: Electricidad y Automatismo eléctrico por  Luis Miguel...PLC y Electroneumática: Electricidad y Automatismo eléctrico por  Luis Miguel...
PLC y Electroneumática: Electricidad y Automatismo eléctrico por Luis Miguel...SANTIAGO PABLO ALBERTO
 
Electrónica: Diseño y desarrollo de circuitos impresos con Kicad por Miguel P...
Electrónica: Diseño y desarrollo de circuitos impresos con Kicad por Miguel P...Electrónica: Diseño y desarrollo de circuitos impresos con Kicad por Miguel P...
Electrónica: Diseño y desarrollo de circuitos impresos con Kicad por Miguel P...SANTIAGO PABLO ALBERTO
 
PLC: Diseño, construcción y control de un motor doble Dahlander(cuatro veloci...
PLC: Diseño, construcción y control de un motor doble Dahlander(cuatro veloci...PLC: Diseño, construcción y control de un motor doble Dahlander(cuatro veloci...
PLC: Diseño, construcción y control de un motor doble Dahlander(cuatro veloci...SANTIAGO PABLO ALBERTO
 
Electrónica digital: Introducción a la Lógica Digital - Teoría, Problemas y ...
Electrónica digital:  Introducción a la Lógica Digital - Teoría, Problemas y ...Electrónica digital:  Introducción a la Lógica Digital - Teoría, Problemas y ...
Electrónica digital: Introducción a la Lógica Digital - Teoría, Problemas y ...SANTIAGO PABLO ALBERTO
 

More from SANTIAGO PABLO ALBERTO (20)

secuencia electroneumática parte 1
secuencia electroneumática parte 1secuencia electroneumática parte 1
secuencia electroneumática parte 1
 
secuencia electroneumática parte 2
secuencia electroneumática parte 2secuencia electroneumática parte 2
secuencia electroneumática parte 2
 
Manual de teoría y practica electroneumática avanzada
Manual de teoría y practica electroneumática avanzadaManual de teoría y practica electroneumática avanzada
Manual de teoría y practica electroneumática avanzada
 
Programacion de PLC basado en Rslogix 500 por Roni Domínguez
Programacion de PLC basado en Rslogix 500 por Roni Domínguez Programacion de PLC basado en Rslogix 500 por Roni Domínguez
Programacion de PLC basado en Rslogix 500 por Roni Domínguez
 
Programación de microcontroladores PIC en C con Fabio Pereira
Programación de microcontroladores PIC en  C con Fabio PereiraProgramación de microcontroladores PIC en  C con Fabio Pereira
Programación de microcontroladores PIC en C con Fabio Pereira
 
Análisis y Diseño de Sistemas de Control Digital por Ricardo Fernandez del Bu...
Análisis y Diseño de Sistemas de Control Digital por Ricardo Fernandez del Bu...Análisis y Diseño de Sistemas de Control Digital por Ricardo Fernandez del Bu...
Análisis y Diseño de Sistemas de Control Digital por Ricardo Fernandez del Bu...
 
Arduino: Arduino de cero a experto
Arduino: Arduino de cero a expertoArduino: Arduino de cero a experto
Arduino: Arduino de cero a experto
 
Fisica I
Fisica IFisica I
Fisica I
 
Quimica.pdf
Quimica.pdfQuimica.pdf
Quimica.pdf
 
Manual básico PLC OMRON
Manual básico PLC OMRON Manual básico PLC OMRON
Manual básico PLC OMRON
 
Programación de autómatas PLC OMRON CJ/CP1
Programación de  autómatas PLC OMRON CJ/CP1Programación de  autómatas PLC OMRON CJ/CP1
Programación de autómatas PLC OMRON CJ/CP1
 
Manual del sistema del controlador programable S7-200 SMART
Manual del sistema del controlador programable S7-200 SMARTManual del sistema del controlador programable S7-200 SMART
Manual del sistema del controlador programable S7-200 SMART
 
Catálogo de PLC S7-200 SMART
Catálogo de PLC S7-200 SMART Catálogo de PLC S7-200 SMART
Catálogo de PLC S7-200 SMART
 
PLC: Automatismos industriales
PLC: Automatismos industrialesPLC: Automatismos industriales
PLC: Automatismos industriales
 
PLC: Buses industriales y de campo practicas de laboratorio por Jose Miguel R...
PLC: Buses industriales y de campo practicas de laboratorio por Jose Miguel R...PLC: Buses industriales y de campo practicas de laboratorio por Jose Miguel R...
PLC: Buses industriales y de campo practicas de laboratorio por Jose Miguel R...
 
PLC y Electroneumática: Electricidad y Automatismo eléctrico por Luis Miguel...
PLC y Electroneumática: Electricidad y Automatismo eléctrico por  Luis Miguel...PLC y Electroneumática: Electricidad y Automatismo eléctrico por  Luis Miguel...
PLC y Electroneumática: Electricidad y Automatismo eléctrico por Luis Miguel...
 
Electrónica: Diseño y desarrollo de circuitos impresos con Kicad por Miguel P...
Electrónica: Diseño y desarrollo de circuitos impresos con Kicad por Miguel P...Electrónica: Diseño y desarrollo de circuitos impresos con Kicad por Miguel P...
Electrónica: Diseño y desarrollo de circuitos impresos con Kicad por Miguel P...
 
PLC: Diseño, construcción y control de un motor doble Dahlander(cuatro veloci...
PLC: Diseño, construcción y control de un motor doble Dahlander(cuatro veloci...PLC: Diseño, construcción y control de un motor doble Dahlander(cuatro veloci...
PLC: Diseño, construcción y control de un motor doble Dahlander(cuatro veloci...
 
PLC: Motor Dahlander
PLC: Motor DahlanderPLC: Motor Dahlander
PLC: Motor Dahlander
 
Electrónica digital: Introducción a la Lógica Digital - Teoría, Problemas y ...
Electrónica digital:  Introducción a la Lógica Digital - Teoría, Problemas y ...Electrónica digital:  Introducción a la Lógica Digital - Teoría, Problemas y ...
Electrónica digital: Introducción a la Lógica Digital - Teoría, Problemas y ...
 

Recently uploaded

NO1 Top No1 Amil Baba In Azad Kashmir, Kashmir Black Magic Specialist Expert ...
NO1 Top No1 Amil Baba In Azad Kashmir, Kashmir Black Magic Specialist Expert ...NO1 Top No1 Amil Baba In Azad Kashmir, Kashmir Black Magic Specialist Expert ...
NO1 Top No1 Amil Baba In Azad Kashmir, Kashmir Black Magic Specialist Expert ...Amil baba
 
Thermal Engineering Unit - I & II . ppt
Thermal Engineering  Unit - I & II . pptThermal Engineering  Unit - I & II . ppt
Thermal Engineering Unit - I & II . pptDineshKumar4165
 
DeepFakes presentation : brief idea of DeepFakes
DeepFakes presentation : brief idea of DeepFakesDeepFakes presentation : brief idea of DeepFakes
DeepFakes presentation : brief idea of DeepFakesMayuraD1
 
scipt v1.pptxcxxxxxxxxxxxxxxxxxxxxxxxxxxxxxxxxxxxxxxxxxxxxxxxxxxxxxxxxxxxxxxx...
scipt v1.pptxcxxxxxxxxxxxxxxxxxxxxxxxxxxxxxxxxxxxxxxxxxxxxxxxxxxxxxxxxxxxxxxx...scipt v1.pptxcxxxxxxxxxxxxxxxxxxxxxxxxxxxxxxxxxxxxxxxxxxxxxxxxxxxxxxxxxxxxxxx...
scipt v1.pptxcxxxxxxxxxxxxxxxxxxxxxxxxxxxxxxxxxxxxxxxxxxxxxxxxxxxxxxxxxxxxxxx...HenryBriggs2
 
Theory of Time 2024 (Universal Theory for Everything)
Theory of Time 2024 (Universal Theory for Everything)Theory of Time 2024 (Universal Theory for Everything)
Theory of Time 2024 (Universal Theory for Everything)Ramkumar k
 
Computer Networks Basics of Network Devices
Computer Networks  Basics of Network DevicesComputer Networks  Basics of Network Devices
Computer Networks Basics of Network DevicesChandrakantDivate1
 
Thermal Engineering-R & A / C - unit - V
Thermal Engineering-R & A / C - unit - VThermal Engineering-R & A / C - unit - V
Thermal Engineering-R & A / C - unit - VDineshKumar4165
 
Introduction to Serverless with AWS Lambda
Introduction to Serverless with AWS LambdaIntroduction to Serverless with AWS Lambda
Introduction to Serverless with AWS LambdaOmar Fathy
 
Learn the concepts of Thermodynamics on Magic Marks
Learn the concepts of Thermodynamics on Magic MarksLearn the concepts of Thermodynamics on Magic Marks
Learn the concepts of Thermodynamics on Magic MarksMagic Marks
 
Hospital management system project report.pdf
Hospital management system project report.pdfHospital management system project report.pdf
Hospital management system project report.pdfKamal Acharya
 
Orlando’s Arnold Palmer Hospital Layout Strategy-1.pptx
Orlando’s Arnold Palmer Hospital Layout Strategy-1.pptxOrlando’s Arnold Palmer Hospital Layout Strategy-1.pptx
Orlando’s Arnold Palmer Hospital Layout Strategy-1.pptxMuhammadAsimMuhammad6
 
Introduction to Data Visualization,Matplotlib.pdf
Introduction to Data Visualization,Matplotlib.pdfIntroduction to Data Visualization,Matplotlib.pdf
Introduction to Data Visualization,Matplotlib.pdfsumitt6_25730773
 
Generative AI or GenAI technology based PPT
Generative AI or GenAI technology based PPTGenerative AI or GenAI technology based PPT
Generative AI or GenAI technology based PPTbhaskargani46
 
💚Trustworthy Call Girls Pune Call Girls Service Just Call 🍑👄6378878445 🍑👄 Top...
💚Trustworthy Call Girls Pune Call Girls Service Just Call 🍑👄6378878445 🍑👄 Top...💚Trustworthy Call Girls Pune Call Girls Service Just Call 🍑👄6378878445 🍑👄 Top...
💚Trustworthy Call Girls Pune Call Girls Service Just Call 🍑👄6378878445 🍑👄 Top...vershagrag
 
Unleashing the Power of the SORA AI lastest leap
Unleashing the Power of the SORA AI lastest leapUnleashing the Power of the SORA AI lastest leap
Unleashing the Power of the SORA AI lastest leapRishantSharmaFr
 
Moment Distribution Method For Btech Civil
Moment Distribution Method For Btech CivilMoment Distribution Method For Btech Civil
Moment Distribution Method For Btech CivilVinayVitekari
 
PE 459 LECTURE 2- natural gas basic concepts and properties
PE 459 LECTURE 2- natural gas basic concepts and propertiesPE 459 LECTURE 2- natural gas basic concepts and properties
PE 459 LECTURE 2- natural gas basic concepts and propertiessarkmank1
 
COST-EFFETIVE and Energy Efficient BUILDINGS ptx
COST-EFFETIVE  and Energy Efficient BUILDINGS ptxCOST-EFFETIVE  and Energy Efficient BUILDINGS ptx
COST-EFFETIVE and Energy Efficient BUILDINGS ptxJIT KUMAR GUPTA
 
AIRCANVAS[1].pdf mini project for btech students
AIRCANVAS[1].pdf mini project for btech studentsAIRCANVAS[1].pdf mini project for btech students
AIRCANVAS[1].pdf mini project for btech studentsvanyagupta248
 

Recently uploaded (20)

NO1 Top No1 Amil Baba In Azad Kashmir, Kashmir Black Magic Specialist Expert ...
NO1 Top No1 Amil Baba In Azad Kashmir, Kashmir Black Magic Specialist Expert ...NO1 Top No1 Amil Baba In Azad Kashmir, Kashmir Black Magic Specialist Expert ...
NO1 Top No1 Amil Baba In Azad Kashmir, Kashmir Black Magic Specialist Expert ...
 
Thermal Engineering Unit - I & II . ppt
Thermal Engineering  Unit - I & II . pptThermal Engineering  Unit - I & II . ppt
Thermal Engineering Unit - I & II . ppt
 
DeepFakes presentation : brief idea of DeepFakes
DeepFakes presentation : brief idea of DeepFakesDeepFakes presentation : brief idea of DeepFakes
DeepFakes presentation : brief idea of DeepFakes
 
scipt v1.pptxcxxxxxxxxxxxxxxxxxxxxxxxxxxxxxxxxxxxxxxxxxxxxxxxxxxxxxxxxxxxxxxx...
scipt v1.pptxcxxxxxxxxxxxxxxxxxxxxxxxxxxxxxxxxxxxxxxxxxxxxxxxxxxxxxxxxxxxxxxx...scipt v1.pptxcxxxxxxxxxxxxxxxxxxxxxxxxxxxxxxxxxxxxxxxxxxxxxxxxxxxxxxxxxxxxxxx...
scipt v1.pptxcxxxxxxxxxxxxxxxxxxxxxxxxxxxxxxxxxxxxxxxxxxxxxxxxxxxxxxxxxxxxxxx...
 
Theory of Time 2024 (Universal Theory for Everything)
Theory of Time 2024 (Universal Theory for Everything)Theory of Time 2024 (Universal Theory for Everything)
Theory of Time 2024 (Universal Theory for Everything)
 
Computer Networks Basics of Network Devices
Computer Networks  Basics of Network DevicesComputer Networks  Basics of Network Devices
Computer Networks Basics of Network Devices
 
Thermal Engineering-R & A / C - unit - V
Thermal Engineering-R & A / C - unit - VThermal Engineering-R & A / C - unit - V
Thermal Engineering-R & A / C - unit - V
 
Introduction to Serverless with AWS Lambda
Introduction to Serverless with AWS LambdaIntroduction to Serverless with AWS Lambda
Introduction to Serverless with AWS Lambda
 
Learn the concepts of Thermodynamics on Magic Marks
Learn the concepts of Thermodynamics on Magic MarksLearn the concepts of Thermodynamics on Magic Marks
Learn the concepts of Thermodynamics on Magic Marks
 
Hospital management system project report.pdf
Hospital management system project report.pdfHospital management system project report.pdf
Hospital management system project report.pdf
 
Orlando’s Arnold Palmer Hospital Layout Strategy-1.pptx
Orlando’s Arnold Palmer Hospital Layout Strategy-1.pptxOrlando’s Arnold Palmer Hospital Layout Strategy-1.pptx
Orlando’s Arnold Palmer Hospital Layout Strategy-1.pptx
 
Introduction to Data Visualization,Matplotlib.pdf
Introduction to Data Visualization,Matplotlib.pdfIntroduction to Data Visualization,Matplotlib.pdf
Introduction to Data Visualization,Matplotlib.pdf
 
Generative AI or GenAI technology based PPT
Generative AI or GenAI technology based PPTGenerative AI or GenAI technology based PPT
Generative AI or GenAI technology based PPT
 
💚Trustworthy Call Girls Pune Call Girls Service Just Call 🍑👄6378878445 🍑👄 Top...
💚Trustworthy Call Girls Pune Call Girls Service Just Call 🍑👄6378878445 🍑👄 Top...💚Trustworthy Call Girls Pune Call Girls Service Just Call 🍑👄6378878445 🍑👄 Top...
💚Trustworthy Call Girls Pune Call Girls Service Just Call 🍑👄6378878445 🍑👄 Top...
 
Unleashing the Power of the SORA AI lastest leap
Unleashing the Power of the SORA AI lastest leapUnleashing the Power of the SORA AI lastest leap
Unleashing the Power of the SORA AI lastest leap
 
Call Girls in South Ex (delhi) call me [🔝9953056974🔝] escort service 24X7
Call Girls in South Ex (delhi) call me [🔝9953056974🔝] escort service 24X7Call Girls in South Ex (delhi) call me [🔝9953056974🔝] escort service 24X7
Call Girls in South Ex (delhi) call me [🔝9953056974🔝] escort service 24X7
 
Moment Distribution Method For Btech Civil
Moment Distribution Method For Btech CivilMoment Distribution Method For Btech Civil
Moment Distribution Method For Btech Civil
 
PE 459 LECTURE 2- natural gas basic concepts and properties
PE 459 LECTURE 2- natural gas basic concepts and propertiesPE 459 LECTURE 2- natural gas basic concepts and properties
PE 459 LECTURE 2- natural gas basic concepts and properties
 
COST-EFFETIVE and Energy Efficient BUILDINGS ptx
COST-EFFETIVE  and Energy Efficient BUILDINGS ptxCOST-EFFETIVE  and Energy Efficient BUILDINGS ptx
COST-EFFETIVE and Energy Efficient BUILDINGS ptx
 
AIRCANVAS[1].pdf mini project for btech students
AIRCANVAS[1].pdf mini project for btech studentsAIRCANVAS[1].pdf mini project for btech students
AIRCANVAS[1].pdf mini project for btech students
 

PLC: Capitulo 11 uso de diagramas de estado

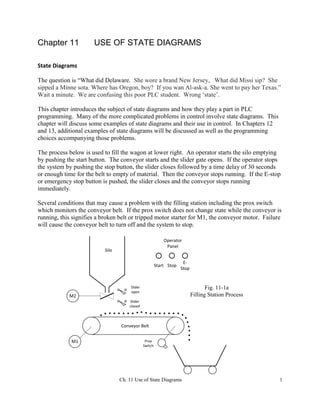
  • 1. Ch. 11 Use of State Diagrams 1 Chapter 11 USE OF STATE DIAGRAMS State Diagrams The question is “What did Delaware. She wore a brand New Jersey, What did Missi sip? She sipped a Minne sota. Where has Oregon, boy? If you wan Al-ask-a. She went to pay her Texas.” Wait a minute. We are confusing this poor PLC student. Wrong ‘state’. This chapter introduces the subject of state diagrams and how they play a part in PLC programming. Many of the more complicated problems in control involve state diagrams. This chapter will discuss some examples of state diagrams and their use in control. In Chapters 12 and 13, additional examples of state diagrams will be discussed as well as the programming choices accompanying those problems. The process below is used to fill the wagon at lower right. An operator starts the silo emptying by pushing the start button. The conveyor starts and the slider gate opens. If the operator stops the system by pushing the stop button, the slider closes followed by a time delay of 30 seconds or enough time for the belt to empty of material. Then the conveyor stops running. If the E-stop or emergency stop button is pushed, the slider closes and the conveyor stops running immediately. Several conditions that may cause a problem with the filling station including the prox switch which monitors the conveyor belt. If the prox switch does not change state while the conveyor is running, this signifies a broken belt or tripped motor starter for M1, the conveyor motor. Failure will cause the conveyor belt to turn off and the system to stop. M2 Slider open Slider closed M1 Prox Switch Silo Conveyor Belt Operator Panel Start Stop E- Stop Fig. 11-1a Filling Station Process
  • 2. Ch. 11 Use of State Diagrams 2 Failure of the slider to open or close after directing the slider in the appropriate direction is also to be detected. If this occurs, the operator is to be notified via an alarm and the conveyor belt is to continue running if failed open but stop if failed closed. The system needs an initial state usually referenced as “home”. The home position of this system is conveyor belt off and slider closed. Using a State Diagram (or State Graph), the filling station may be defined as below: 3 4 5 6 7 1 2 Home Position Start Belt Open Slider Filling Close Slider Belt Empty/ Stop Error Fig. 11-1b Filling Station State Diagram The home position requires certain conditions be met before advancing to a next step. This step implies a switch or switches be added to place the machine in this state. Usually, these additional switches are added to a screen on an HMI (human-machine-interface). A number of conditions exist that cause errors. These include slider open and slider closed at the same time. This condition cannot occur and one of the two sensors is reporting a bad signal. An error state also occurs if the conveyor is running and the prox signal doesn’t change state over a period of time. An error would also occur if the slider was directed to open and the open sensor does not change to on in a reasonable time. A similar error would occur if the slider was directed to close and the closed sensor was not energized. In some systems, the error state is divided into multiple error states if the action resulting is different and the state following the error is different. In this system, an error shuts down the conveyor and closes the slider. The system is then expected to be homed and started normally. An I/O table must be generated to complete the definition of the system before programming commences. The I/O Assignment Table would be similar to the following:
  • 3. Ch. 11 Use of State Diagrams 3 Input Assignments: Sensor Function/State Signal I/O Start Button Starting Stop Button Stopping Prox Switch On-off Slider open ls Slider is open Slider closed ls Slider is closed E-stop Button Emergency stopping Output Assignments: Actuator Function/State Signal I/O M1 run Conveyor motor M2 open Open slider M2 close Close slider The conveyor and filling station is not a good example of a program needing a state diagram. It is not necessary many times to create a state diagram and then implement a control program. In control programs such as the one to control this process, a state diagram may be used to help develop a program but may be not be of enough use to help. Not all processes require a state diagram. The Pneumatic Cylinder and State Diagrams: State diagrams are useful in applications using movement especially with pneumatic cylinders and processes requiring movement. A pneumatic cylinder is shown below. Fig. 11-2 Pneumatic Cylinder
  • 4. Ch. 11 Use of State Diagrams 4 How an air cylinder works is shown in the diagrams below. An air cylinder moves one of two ways, by single acting or double acting cylinder and air. Looking inside the single acting cylinder we find a spring pushing the cylinder to the left and air pushing the cylinder to the right. Single Acting Air Cylinder Air enters port and Spring begins to compress Spring compresses and Cylinder moves Cylinder in Extended Position Fig. 11-3 Single Acting A double acting cylinder is pictured on the next page. The left to right movement and right to left movement is shown with air movement. Air is controlled through valves. There is no spring.
  • 5. Ch. 11 Use of State Diagrams 5 Double Acting Cylinder Air enters left port and Cylinder begins to move right Cylinder moves right to end stop Air enters right port and Cylinder begins to move left Cylinder moves left to end stop Fig. 11-4 Double Acting The position of the cylinder is verified in both the closed and open position by reading the metal cylinder with proximity switches. Movement continues in both cases until there is a physical stop the cylinder encounters. There are only two valid positions and both are at end of travel.
  • 6. Ch. 11 Use of State Diagrams 6 Proximity Switch Reads Position at Left Proximity Switch Reads Position at Right Fig. 11-5 Sensing End of Travel Both cylinders have similar state diagrams with states shown below. The state diagram below represents the cylinder and its movements very well. Cylinder moving Left Cylinder Resting at Right Cylinder Resting at Left Cylinder moving Right State Diagram of Cylinders above Fig11-6 Cylinder State Diagram.
  • 7. Ch. 11 Use of State Diagrams 7 Many systems need a home or initial state from which to start. After switching into a mode on the HMI to send the system to a homed position, the home position of the machine must be achieved for proper action. If a slide gate is open, it must be closed. This can also be done via an auto/manual switch on the HMI. In manual, individual devices can be turned on or off or gates moved to a desired position without interference from an automated sequence. For example, in a manual mode, the slide gate referenced above can be opened or closed with an open and close pushbutton from the HMI. These buttons should be added to the sensor table and assigned internal bit addresses. The programming language type must be selected. While some prefer a language similar to the State Diagram, most prefer the PLC’s LAD (Ladder) or FBD (Function Block Diagram) language. In the state diagram below, the error step may be jumped to from various steps and then a move is allowed to an initial state of 1 or a home state. The rules for error or the logic causing the jump to step 7 are usually included in the box and may be stated in a number of different formats. It is best to include a written description of the logic to jump from state to state. 7 1 Home Position Error Various Steps Rules for move Operator reset Fig. 11-7 Filling Station Error Recovery Finding 2’s Complement - A Simple State Diagram The logic for converting a number to the 2’s complement is shown below. This logic can be explained by a simple State Diagram. In this example, state 1 = M0.0 off and state 2 = M0.0 on. The word being examined is M2, M3 and the result resides in M4, M5. 2 1 Initial State: Transfer Bit Transfer Inverse of Bit Receive a 1 Bit 0 0 0 0 1 1 0 0 1 0 1 1 0 1 0 0 1 1 0 M2.x M4.x M2.x M4.x M4.0 M4.1 M4.2 M4.3 M4.4 M4.5 M4.6 M4.7 Fig. 11-8a Two s Complement Rules Change with new state
  • 8. Ch. 11 Use of State Diagrams 8 The algorithm can be viewed above but the program is found here. In it, the ‘twoscomp’ bit is set to ‘0’ and the program begins. When the first ‘1’ is found in the original number, that bit is transferred to the twos complement word but the state is changed by setting the ‘twoscomp’ bit. The state is now set to flip the original bit and place the flipped bit in the twos complement number. This algorithm depends on this simple flip bit from our state diagram to work. Fig. 11-8b Code for Two’s Complement
  • 9. Ch. 11 Use of State Diagrams 9 Conveyor Two State System – A Simple State Diagram State table analysis of the Conveyor Program below shows two states: #1 (loading) or #2 (off- loading). 2 1 Count = 4 Count = 0 Loading Conveyor Off-loading Conveyor always a Loading Conveyor may be either Loading or Off-loading Off-loading Conveyor with respect to previous conveyor PE 1 PE 2 Reset Line Count Button Fig. 11-9a Conveyor Delivery State Diagram Boxes fill one at a time on the short conveyor at left, accumulate on the middle conveyor until 4 boxes are in place. Then the middle conveyor turns on automatically to off-load the boxes to the third conveyor. The middle conveyor is programmed to switch from an accumulating or loading conveyor to an off-loading conveyor. Logic for this switch is developed in the network below. The memory bit ‘Offload’ energizes when the count is done (‘QU’ turns on). Internal logic acts in a manner similar to a switch controlled by a human. The state changes to off-loading and the middle conveyor turns on to transport boxes off the conveyor and then change back to an accumulating conveyor, switching from state 1 to 2 and back to 1 again. Fig. 9b Program for Load/Offload Conveyor System
  • 10. Ch. 11 Use of State Diagrams 10 Another consideration when programming moving lines with boxes is “What happens if a person accidentally removes a box from the conveyor at the wrong time or moves his hand or foot in front of the photo-eye incrementing the counter accidentally (or not accidentally)?” What if a bird or big bee flies in front of the sensor giving a false count of the number of boxes? Counters must have a mechanism to reset the state affecting the overall operation of the conveyor. Reset buttons must be strategically placed so as not to be overused but to provide a means of resetting the line if the line is cleared of boxes. The reset button should only be used by an operator if normal operation of the line has been interrupted and the line is not responding properly. Then the operator resets the counters and seal circuits. In coordination with reset of logic, boxes must also be removed from the conveyors. This may prove to be a cumbersome task. This is signified in the state diagram by moving to an initial state or a reset state. When control of a process requires internal switching logic, the programmer must build switches through the use of memory logic. The logic is described as sequential logic in that the logic moves sequentially from one section to another section. If logic is developed remembering the sequential nature of the process, then a more organized program can be achieved. State Table Analysis of ‘Simon Says’ Sequential Game A later chapter will discuss the implementation of a number of sequential games including “Simon Says” and “WhackaMole”. The Simon game is the same game played years ago by your parents or possibly your grandparents. A state diagram of the Simon game could be represented as follows: 2 1 Not Playing 3 Playing/ Showing Lights Playing/ Pushing Buttons Error Success 4 Won Flash Lights Fig. 11-10 Simon Says State Diagram The Simon game will be further discussed and programmed in a later chapter. In general, while the number of states doesn’t need to match the number of coils used in a program, the minimum number of coils used matches the number of flip-flop’s in a state table. For instance, if there are 2 states, 1 coil is necessary (either on or off). For three or four states, 2 coils are necessary (off-off, off-on, on-off, on-on). For five to eight states, 3 coils are required. For 9 to 16 states, 4 coils are required, etc. Use of a minimum number of coils for representation
  • 11. Ch. 11 Use of State Diagrams 11 of states may not prove to be the most effective programming style. A number of different programming techniques will be discussed in this chapter and next and will give the programmer various ideas as to how best implement a state diagram from a sequential process. Sets and Venn Diagrams Use of sets and Venn diagrams may help the programmer visualize a sequential program. For example, the sets of “Simon Says” are found below. They are Not Game Being Played and Game Being Played. Subsets of Game Being Played are Show Lights and Push Buttons. A final state is shown at right if the player wins – Flash Lights. To begin a program by designing a Venn diagram is usually not required. However, as the program is written, the programmer may find the use of Venn diagrams a good tool in describing the logic or in visualizing the various states present in the process. Sets of the program Simon Says: Not Playing Game Showing Lights Playing Game Pushing Buttons Fig. 11-11 Venn Diagram of Simon-Says Game Flash Lights to show a win Sequential Function Charts An alternative to state diagrams using ladder logic is the programming language referred to as Sequential Function Charts (SFC). SFC is a graphical approach to state development and program organization. Steps, actions and transitions are the three primary components of a typical SFC. Each step is similar to a state or unit of logic organized to accomplish a particular control task. An action defines an aspect of the task and a transition provides the means to move from task to task. Logic internal to each step, transition or action is programmed in Ladder logic or other programming language. SFC's graphical layout offers the program developer an overview for creating small islands (states) of logic and linking them together with transitions.
  • 12. Ch. 11 Use of State Diagrams 12 Two primary types of flows are allowed in the SFC diagram, sequential and parallel. With sequential flow, the program executes step 1 repeatedly until all conditions are satisfied for the transition to take place to move to step 2. Each step is evaluated until satisfied and then flow moves on. In a parallel configuration, branches may be configured as simultaneous or selection. In a selection branch, only one branch is executed at a time. The active branch is determined by the transition. With a simultaneous branch, all branches may be executed simultaneously. Transition occurs in a simultaneous branch when one of the active steps satisfies conditions to continue. The following figure shows a selection branch. Step one is executed until completion. Then step two executes. Only one step is allowed to execute at a time. Other steps are missed this time. Step One Step Two Sequential Function Chart Selection Branch When done at step 2, moves to next step Step 1 done moves to one of the three in Step Two Fig. 11-12 SFC with Selection Branch As mentioned before, with a simultaneous branch, all branches may be executed simultaneously. Transition occurs in a simultaneous branch when one of the active steps satisfies conditions to continue. The figure below shows a simultaneous branch with step one occurring and then one or more of the steps of step two turning on. Any of these steps in step two can cause a transition to later logic. Step One Step Two Sequential Function Chart Simultaneous Branch When any done at step 2, moves to next step Step 1 done moves to all of the three in Step Two Fig. 11-13 SFC with Simultaneous Branch
  • 13. Ch. 11 Use of State Diagrams 13 Logic that is active is highlighted so a programmer can visually confirm the program step or steps being executed. Steps may be sub-divided into actions with a number of actions occurring sequentially during the step. Step 1 Step 1 Step 1 Action 1 Action 2 Fig. 11-14 Steps Subdivided into Actions Showing logic that is active in highlighted form is a very powerful method to show the flow of logic in a sequential process. Sequential Function Charts may be useful in developing sequential logic especially when advantages such as highlighting are considered. Remember that each box in the Sequential Function Chart may be reduced to a number of rungs of ladder logic or other language. SFC overall is a very powerful organizing tool. State diagrams and Sequential Function Charts are two of many different tools used by programmers to control a sequential process. A number of other tools have been discussed as well. Scientists, especially mathematicians, have used a variety of very sophisticated tools to generalize sequential problems. While it is not the purpose of this text to thoroughly explain these tools, it is appropriate to mention two different tools used to discuss sequential processes. First is Finite State Machines or FSM. FSM may be defined as “model of behavior composed of states, transitions and actions.” Transitions and actions may be defined: “A transition indicates a state change and is described by a condition that would need to be fulfilled to enable the transition. An action is a description of an activity that is to be performed at a given moment.” FSM may be used in “linguistics, computer science, philosophy, biology, mathematics, and logic.” Of course, the PLC programmer is interested in using FSM for logic in developing a program.
  • 14. Ch. 11 Use of State Diagrams 14 Another tool for solving of sophisticated sequential problems is the Petri net. The Petri net may be described as: “A Petri net (also known as a place/transition net or P/T net) is one of several mathematical representations of discrete distributed systems.” Petri nets were first introduced by Carl Adam Petry in 1962 from his PhD dissertation. An example of a Petry net diagram follows: Back to Reality - Combinational Modes External switches many times determine the mode of the machine and establish the need for states. These form a class of devices referred to as combinational modes. Combinational modes include switches such as: STOP START RAISE STOP LOWER HAND AUTO SEMI-AUTO TYPICAL SWITCHES Fig. 11-16 Various Selector Switches Stop-Start Forward-Reverse Open-Close On-Off Raise-Lower Up-Down Fast-Slow-Stop Forward-Reverse-Stop Open-Close-Stop Raise-Lower-Stop Up-Down-Stop-Off-On Hand-Auto Hand-Step-Auto Hand-SemiAuto-Auto Manual-Auto Manual-SemiAuto-Auto High-Low Summer-Winter Summer-Off-Winter High-Off-Low This list could be continued for many pages. This is but a sampling of the types of mode switches used for control of machines. Fig. 11-15 Petri Net Example
  • 15. Ch. 11 Use of State Diagrams 15 One of the most commonly used mode switches is: Auxiliary-Off-Run-Start If you don’t recognize this switch, think about what happens next time you start your car. Typical switches that are two-position are wired to only one of the two positions. PLC Input Fig. 11-17a Generic Selector Switch If one mode is chosen, then the normally open contact is used. If the other mode is chosen, then the normally closed contact is used. For instance, if the switch above was used with the switch labeled High-Low, then High would refer to the input on and Low would refer to the input off. PLC Input Fig. 11-17b Selector Switch with Tag HIGH LOW To summarize this section about switches, if a switch is needed but there is no switch planned for the panel or HMI screen, the program will need a memory circuit and probably a state diagram to replace the switch. When switches are available, state definitions are not necessary, or at least not for the decisions made in coordination with the switches. On the other hand, if a switch is needed and none is available, one must determine if a state is necessary (and if coil conditions are required) that are derived from a state diagram. It is possible to develop a number of state diagram programs without ever realizing that a state diagram is at the core of the program. The idea that a switch may be used instead of a state diagram may seem an oversimplification but the idea of using the idea of a potential switch to define the states of a system and then plan a method to automatically generate those states is a powerful method to plan a state diagram and write the ensuing program. Scan-Dependent Code used in State Diagrams Many times a state diagram can be programmed using a simple programming technique that uses scan-dependent code. Not all PLC logic can be replicated with relays since the PLC is sequential in nature and follows a scan from top to bottom of a program. Rungs are solved sequentially starting at rung 0 and proceeding through the entire program
  • 16. Ch. 11 Use of State Diagrams 16 finishing with the end statement. As the rungs are solved, outputs are written from the coil or other output function to the appropriate table. The output is written from the program to the output as the rung is executed. The output is written to the card usually at the end of the scan. (Some processors write outputs asynchronously to the scan and therefore are not as predictable as to exactly when the output will be written to the output device. Both procedures of writing an output at the end of a scan and writing to the output asynchronously are valid procedures. Use of scan-dependent code is necessary at times to accomplish a function or step from state in a program. To save a variable in a particular mode so that the variable may be used when the mode is turned off is a useful tool and is used in many programs. Addressing States by Using Scan-Dependent Code - Climbing the Ladder The following is a program to turn on three conveyors either automatically or manually. This program is used to demonstrate a common scan-dependent programming technique referenced here as "climb-the-ladder”. In this problem, a system of conveyors is to be programmed with each conveyor running independently. No integration of the conveyors into a state diagram is to be considered. Each conveyor has various start and stop conditions. The start conditions can be found parallel to the seal contact and the stop conditions can be found in series with the start logic. Logic for one of three motors is shown below (typical for all three): Fig. 11-18 Original Conveyor Circuit before Modifications As long as all that is necessary to run the process is the independent start and stop contacts, all is well. However, what if the request is made that the emergency stop (let’s say I:1/15 is the e- stop) shuts down all three or any that were running. Then in addition, a circuit is to be added to restart those motors previously running. To do this easily requires programming that is commonly referred to as climbing the ladder, an application of scan-dependent code and the state diagram shown below. A new state ‘Off, Ready to Start’ is added to the state diagram and a new set of seal circuits is added to the logic. This is done during the scan that the emergency stop shuts down the output rungs with the new logic located just prior the output rungs. They are shown as follows: Devices that turn off the conveyor Devices that turn on the conveyor Seal contact
  • 17. Ch. 11 Use of State Diagrams 17 Fig. 11-19 State Diagram for Program Above Logic setting State 3 for each of the three conveyors Now we can turn off the conveyor with the emergency stop switch 3 2 Off 1 Off, Ready to restart On Push Start Push Stop Push Restart Push Estop Notice that the three rungs added are not yet compiled since the stop or contact that turns the rung off is not yet known. Do not worry about not defining these contacts since there is time to add them later. The three coils B3:2/0, 2/1, and 2/2 are turned on the scan that the emergency stop is first turned on. These three coils remember the status of the three motors and save their status prior to the emergency stop turning the motors off. An annotation would read “Motor 1 Running Prior to E-Stop Shutdown”. Next, at an operator’s request, the system is to start back up with the motors that were previously running turning back on. Notice how this is done.
  • 18. Ch. 11 Use of State Diagrams 18 Fig. 11-20 Completed Program Rungs 000-002 contain logic to turn on the motors previously on before the emergency stop was pushed. With the reset I:1/14, logic is developed to turn on the motor that was remembered in B3:2/0 through B3:2/2. The internal coil B3:3/0 turns on if B3:2/0 was energized, turns off the seal circuit containing B3:2/0 and then restarts the motor seal circuit with B3:2/0 in the start portion of the circuit. For instance, if the emergency button is pushed while O:2/0 is on alone, B3:2/0 turns on and seals just prior to O:2/0 turning off. Since B3:2/0 is now on, when I:1/14 is pushed signaling a restart of the conveyors that were on when the emergency stop was pushed, B3:3/0 turns on and turns off the seal circuit B3:2/0. B3:3/0 then turns on the seal circuit for O:2/0. Even though B3:3/0 is on for only one scan, it can be counted on to turn off B3:2/0 and turn on O:2/0. The following diagram shows a sequence in which the E-Stop button is energized sending the conveyor to the “off” state (state 3) instead of the state 1 “off” state. When a reset button is pushed, the state diagram signals a restart of the conveyor(s) that had previously been turned off
  • 19. Ch. 11 Use of State Diagrams 19 due to the e-stop but not if stopped from other commands. 3 2 Off 1 Off, Ready to restart Push Start Push Stop Push Restart 3 2 Off 1 Off, Ready to restart Push Start Push Stop Push Restart Fig. 11-21 State Diagrams for Completed Program The example shows a scan-dependent program used to set and reset coils that are set by events to do specific tasks. This is an example of a simple state diagram being used to define a set of conditions and a programming technique that has been used with PLC programs extensively to simplify relay logic and perform state logic. Revisit Three Conveyors to Bin The problem of control of a number of conveyors usually involves interlocking of the conveyors so that a problem of back-up of product does not occur. If speed switches are introduced, they should be programmed to turn off the conveyor attached to the zero- speed switch if the switch is not active when the motor is told to turn on. The project below uses level switches to turn on and off the prior conveyor if high level is achieved with each of three hoppers.
  • 20. Ch. 11 Use of State Diagrams 20 High Level L1 Low Level L2 Conv C1 Bin 1 Conv C2 Conv C3 High Level L3 High Level L4 2 1 Init - System off 3 4 Bin 1 below low level L2 Run Cnvr C3 C1, C2 Off Hopper L4 not high Run Cnvr C2, C3 C1 off Hopper L3 not high Run Cnvr C1, C2, C3 Bin 1 above high level L1 Hopper L4 high or C2 Fails Hopper L4 high or C2 Fails Hopper L3 high or C1 Fails C1 Fails Fig. 11-22 State Diagram of Multiple Conveyors Picture the conveyors conveying coal over a long distance. State diagrams may help here to describe this process. The design may be accomplished without the designer ever considering state diagrams but they help the description of what is really going on with the system. Conv C1 Bin 1 Conv C2 Conv C3 High Level L3 High Level L4 Fig. 11-23 Conveyor Feed System
  • 21. Ch. 11 Use of State Diagrams 21 The Electronic Safe – Definitely a State Diagram Fig. 11-24 Electronic Safe Operator Panel 6 2 3 Display for Code Num Operator Panel 1 2 3 4 5 6 7 8 9 0 Keyboard close open next Door Locking Cylinder Description of the locking mechanism of the electronic safe:  There must be typed in 3 code numbers, each consisting of 3 digits;  A digit typed in at the keyboard arises at the least significant place in the display; the other digits already present on the display are shifted left  Numbers to be compared to the three code numbers are stored in storage locations in PLC  Each code number must be confirmed by pushing the ‘next’ button  After pushing the ‘open’ button, the three numbers are compared with the code numbers stored in the storage locations.  If the code numbers are equal, then the door is opened. Otherwise, the opening algorithm is blocked for 10 minutes.  Pushing ‘close’ resets the display to 000, clears all input numbers and restarts the algorithm and locks the door. This design is very dependent on a good state diagram to complete. The conveyor system did not require a state diagram for most experienced programmers to understand or build. The safe, on the other hand, does. The state diagram on the next page, if followed, will lead the programmer through the steps necessary to implement a program for unlocking and re-locking the safe successfully. With no state diagram, the experienced programmer may succeed in implementing the program but not as easily and the subsequent maintenance of the program will be more difficult without it. Saving the document of the state diagram is necessary since it is not carried along with the PLC program as part of the documentation. Its inclusion in a project
  • 22. Ch. 11 Use of State Diagrams 22 document is strongly recommended. Fig. 11-25 Electronic Safe State Diagram 3 4 5 1 2 Home Position Cylinder off, Numbers reset to 000 7 8 9 6 11 12 13 10 14 Enter First Digit Enter Second Digit Enter Third Digit Enter Next Push Open Test if all 3 code numbers agree 15 Open Cylinder Push Close 16 Close Cylinder Verify Closed Success Fail Init
  • 23. Ch. 11 Use of State Diagrams 23 Component Parts Feed Mechanism – High Need for State Diagram Fig. 11-26 Component Parts Feed Mechanism General Description: A magazine is housing cylindrical parts (disks). A slide (separator) pushes out one disk to a “pick up position” where a gripper picks up the disk and places the disk to the “deposit position”. The component feeder is running as long as disks are available. Operating modes Either the Software HMI or discrete switches are used to run the feeder in different operating modes. Switch S1 is used for changing the operating modes: 1 - Manual 2 - Homing 3 – Automatic Homing cycle: Before starting any automatic cycle, the feeder must be set up in its initial or homing position (Switch S1 to “Home” and press button “Start”). The homing cycle ends if the feeder has reached its homing position. The homing cycle stops after finishing the ongoing step if: 1 – “Stop” – pressed or if “Start” is pressed again 2 – If “Single Step” is activated by a selector switch. The feeder then steps forward one step in homing cycle each time the “Start” button is pressed. The homing cycle resets if switch S1 is turned on. The ongoing operation then stops immediately. Below are the three state diagrams for the cylinders in the machine. The state diagrams are not linked but information from one is used in other diagrams. Notice the linkage.
  • 24. Ch. 11 Use of State Diagrams 24 Separator moving Left Separator resting in right retracted position Cylinder Resting at Left – part extracted Cylinder moving Right to home position State Diagram of Separator X Cylinder moving Left X Cylinder Resting at Right X Cylinder Resting at Left X Cylinder moving Right State Diagram of X Cylinder Y Cylinder moving Up Y Cylinder Down – Suction on if X at Left Suction off if X at Right Y Resting in Up Position Y Cylinder moving Down State Diagram of Y Cylinder Fig. 11-27 Three Cylinder State Diagrams
  • 25. Ch. 11 Use of State Diagrams 25 Manual Mode In Manual mode, every actuator should be activated by pressing the appropriate button. The manual mode position of S1 shall also serve to allow filling up the magazine with cylindrical parts. Filling up the magazine should not be registered if the button is not switched to manual mode when the magazine is being filled. The actuator is locked in case of a wrong operation (e.g. the gripper can’t be moved from left to right if the gripper is not in its UP position. All manual operations must be reset, if switch S1 is switched over to any other operating mode. Automatic Mode By setting switch S1 to “Automatic” and pressing “Start”, the automatic cycle is started. A start may only occur if the feeder is in its homed position. The automatic cycle ends in home position if the magazine is empty. The automatic cycle stops after the actual step if: 1 – “Stop” button is pressed; automatic cycle resumes if “Start” is pressed again. 2 – If “Single Step” is activated. Feeder steps forward one step in automatic cycle every time “Start” is pressed again. The automatic cycle resets immediately if S1 is moved to any other operating mode. The ongoing operation then stops immediately. Starting automatic cycle again is only possible after the feeder has been brought into its homing position (either in manual mode or with the help of homing operation mode). Interlocking Conditions which must be implemented first for security reasons: Separator forth: no part must be below gripper and NOT (x-axis in pick up position and gripper is not up) Gripper down: separator is back and x-axis in one of its end positions X-Axis move left: gripper is up and NOT (“x-axis move right” activated) X-Axis move right: gripper is up and NOT (“x-axis move left” activated) Suction on: -- A new programming language SFC (Sequential Function Chart) is used to combine the three state diagrams above in one continuous program. The state diagrams could be combined as well but for now, we will use the SFC diagram as a substitute.
  • 26. Ch. 11 Use of State Diagrams 26 Fig. 11-28 SFC for Component Feeder The Sequential Function Chart above shows the steps and gives the sequence of flow of logic. If one were to rely on this program, there is a reason to worry about the logic in that the logic performed in steps not currently active are not accessed or executed except in the step currently active. If there were a condition about which safety is a concern, then this logic must be replicated in each step, thus multiplying the complexity of the logic. Also, if this logic is changed, then it would need to change in all locations, not just one. Thus, logic that is common to all steps must be located outside the step logic. This adds a level of complexity in that one must now determine whether to include logic that is only involved in the step or common to all steps. Most logic will probably end up being placed in the common logic area, in effect, negating the original concept of Sequential Function Chart or SFC logic. Shown on the next page are the state graphs or state diagram for the component feeder. The first is somewhat simpler diagram that does not take into account an event that may drop down parts while in the homing mode. The second diagram answers this problem and prevents parts from dropping down while in homing mode.
  • 27. Ch. 11 Use of State Diagrams 27 Fig. 11-29 State Diagrams for Various Parts of Component Feeder
  • 28. Ch. 11 Use of State Diagrams 28 State Diagrams Defined State Diagrams have its origin in computer science. There are many advantages to State Diagrams although they are not established in a national or international standard. They are similar to Sequential Function Charts in that it describes a technical process or a functional element of a machine tool in terms of states and transitions. The following figure shows a typical state diagram with transition arrows and rules for traversing from state to state: Fig. 11-30 State Diagram At any time in a State Diagram, just one state can be active. State Diagrams may have branches and loops and allow alternate ways of stepping through the graph. To go from one state to another, there must be a transition between the two states; the original state must be active and the transition must be fulfilled. The next figure shows a Functional Element (a rivet device) and gives a functional description of the control task with the help of a flow chart. There are two ways to construct a State Diagram. We can just model the functioning according to the task description or we can build a real model of all functional elements and combine them. Fig. 11-31 - Riviter
  • 29. Ch. 11 Use of State Diagrams 29 Fig. 11-32 Model of a Rivet Device (a) according to task description (b) according to the physical device The cylinder should press the rivet for 2 sec. in the down position. Which of the two models best describes the physical process? Since the down position is time-dependent only, it is usually not considered a state. It is up to the user which state diagram is preferred but usually time- dependent only states are not necessary and may be combined in other states. If there were two cylinders used in an operation, we could use either the task description or the physical device description to describe the state diagram for the process. The task is to look at the cylinder state graphs separately and then together to determine an optimal description of the process. If this can be done, a program can be written from the combined state diagram of the two independent cylinder state diagrams. The two cylinders below are described separately. The clamping cylinder can be described in the following State Diagram: Fig. 11-33 First of Two Cylinder State Diagrams
  • 30. Ch. 11 Use of State Diagrams 30 The feed cylinder can be described in the following State Diagram: Fig. 11-34 Second of Two Cylinder State Diagrams Or we can start with a combined State Diagram combining the two: Fig. 11-35 Combined Two Cylinder State Diagrams
  • 31. Ch. 11 Use of State Diagrams 31 Run off Graphs consist of separate State Diagrams that are combined to show process actions in several areas at once: Fig. 11-36 - State Diagram for Juice Condenser discussed in earlier chapter Introduction to Sequencers Sequencers and sequential circuits are the result of the digital circuit state diagram. A machine or a process may be identified as a sequential circuit that indexes from step to step usually only in the forward direction. Decrementing back through the order of the steps is not tolerated in the design of most sequencers. If steps are identifiable and inputs can be defined allowing the process to advance from step to step and outputs change state from step to step, then a sequencer is advised. Sequencers are divided into three general categories in the PLC. They may be relay-based, counter-based or sequencers using the SQx instruction set. Each will be discussed and examples given. Sequencers may also be linked together giving a combined control scheme in which various sequencers hand off control between sequencers. Each sequencer is responsible for its actions and interfaces with other sequencers when a product or part is handed between the sequencers. Multiple sequencers may also save programming code if various sequential programs are similar but not identical. This involves a type of subroutine control that uses a variety of step numbers to allow some programs to act during each step.
  • 32. Ch. 11 Use of State Diagrams 32 Relay-based sequencers are preferred since they are easier to read and understand by the maintenance electrician. With an increase in complexity, the counter-based sequencer is preferred. Counter-based sequencers are more easily changed and tolerate a greater number of steps than relay-based sequencers. If a large number of inputs and outputs are required in the sequencer, the choice leans more toward the SQx instructions. Timers may be used to add a time delay between steps. Examples of the use of timers in the sequencer are given. Example of Sequencer - Simple Robot A robotic arm that uses pneumatic solenoids is a candidate for sequential programming. The example below shows the steps in a sequence to successfully move a product from one position to another using a simple robotic arm. Down UP Side View Top View Limit Sw Not Activated Limit Sw Activated Robot down, clockwise Robot in home position: Down UP Robot Raised Down UP Robot rotated counter- clockwise Fig. 11-37a Simple Robotic Sequencer
  • 33. Ch. 11 Use of State Diagrams 33 Down UP Robot grabs part Down UP Robot rotated clockwise with part Down UP Robot lowered with part Down UP Robot releases part Fig. 11-37b Simple Robotic Sequencer (cont) The operation of the robot can be summarized in the following table: Step Position Required to Proceed Solenoid to Proceed 1 Down, rotated cw Start cycle pb Raise 2 Up, rotated cw Up l/s Rotate cw 3 Up, rotated ccw Ccw l/s Grabber in 4 Up, rotated ccw Part present Rotate cw 5 Up, rotated cw Cw l/s Lower 6 Down, rotated cw Cw l/s Grabber out 7 Down, rotated cw Done
  • 34. Ch. 11 Use of State Diagrams 34 Next, an assignment of inputs and outputs for the functions is generated: Address Function I:0/0 Start cycle push button I:0/1 Robot down l/s I:0/2 Robot up limit switch I:0/3 Robot CW limit switch I:0/4 Robot CCW limit switch I:0/5 Part present limit switch O:0/0 Raise robot solenoid O:0/1 Rotate ccw solenoid O:0/2 Rotate cw solenoid O:0/3 Release part O:0/4 Grab part Home position is used for initialization of the program. It is: Address Function State I:0/1 Robot down limit switch On I:0/2 Robot up limit switch Off I:0/3 Robot CW limit switch On I:0/4 Robot CCW limit switch Off I:0/5 Part present limit switch Off Homing is a separate program from the sequence program that attempts to move the machine to the state of “home”. This is the position that the sequential program is looking for to move from state 0 to state 1. The homing program and sequence program share the same output rungs turning on and off outputs to control movement to accomplish their various tasks. The task of the homing program is to satisfy the states of all permissive contacts in rung 0 of the program. The state diagram is on the next page. It follows the one-way flow of the sequential program allowing only flow in one direction. The progression follows step-by-step with an easy decision at the end of each step allowing the program to move to a set next step. In most instances, only one input must be satisfied to move to a next step with a short time delay at the end of the step to allow the robot a short amount of time to settle before moving on.
  • 35. Ch. 11 Use of State Diagrams 35 3 2 Grip Part 1 4 5 6 7 Init Robot at Home Position Not Moving Moving Up Button Pushed Initial Conditions Satisfied Rotating Counterclockwise Up LS Satisfied CCW Limit Satisfied Rotating Clockwise Part Secured Moving Down CW Limit Satisfied Down LS Satisfied Release Part Gripper Empty Fig. 11-37c State Diagram for Simple Robot The state diagram above could have two steps where one is shown here. In the riveter example, if a machine is not resting in a position, the position is not classified as a step although there is no reason it could not be added. The program shown below uses only one rung of logic for each step and it seems clearer for each step to correlate to a rung of logic if possible. Homing may be necessary as a separate state diagram. The homing portion may include a number of state diagrams depending on what state the machine is in at the time a homing request is made. Ladder Program for Robot Sequencer To program the sequencer using relay ladder logic, start with an initialization rung and then program rungs that depend on the prior rung plus an output to set the next rung.
  • 36. Ch. 11 Use of State Diagrams 36 Step 1 Step 2 Step 3 Step 4 Step 5 Step 6 Step 7 Fig. 11-38 Simple Robotic Sequencer in Ladder with Coil Logic
  • 37. Ch. 11 Use of State Diagrams 37 In the program, the initialization rung is rung 0. This rung checks all limit switches to verify the robot is in its home position. Each appropriate limit switch is checked. For instance, both the limit switch for end of travel in one direction and the limit switch for end of travel in the opposite direction are checked for each set of limit switches. The initialization button then turns on the first internal B relay coil – B3:0/0. In the PLC, it is easy and requires no additional wiring to include both end-of-travel limits. With cost no problem, the addition of both sets of contacts provide additional safety if a contact were to fail. Rung 0 turns on starting the shift register. Then the shift register waits to proceed. Succeeding steps are entered below: Move from step 1 to step 2: I:0/2 on, I:0/1 off Go to step 2 (rung 1) Move from step 2 to step 3: I:0/4 on, I:0/3 off Go to step 3 (rung 2) Move from step 3 to step 4: I:0/5 on Go to step 4 (rung 3) Move from step 4 to step 5: I:0/3 on, I:0/4 off Go to step 5 (rung 4) Move from step 5 to step 6: I:0/1 on, I:0/2 off Go to step 6 (rung 5) Stop I:0/5 off Done, End Output List: Step 1- Outputs change to go from step 1 to step 2 O:0/0 on Raise robot Step 2- Outputs change to go from step 2 to step 3 O:0/1 on Arm moves CCW Step 3- Outputs change to go from step 3 to step 4 O:0/4 on Grab part Step 4- Outputs change to go from step 4 to step 5 O:0/2 on Arm moves CW Step 5- Outputs change to go from step 5 to step 6 O:0/0 off Robot lowers Step 6- Outputs change to go from step 6 to step 7 O:0/3 on Release part The output list is not developed in the same section of rungs as the logic of the sequencer since outputs may be on or off across multiple steps. Output logic is developed after the sequencer is in place and combines the states of the sequencer for which the output is on or off. As the sequencer moves from step to step, the sequencer using coils successively turns on the next coil set in the sequence. When the last step is being executed, all the coils in the string are
  • 38. Ch. 11 Use of State Diagrams 38 observed on. When the last step completes, the coils are turned off. This characteristic of the sequencer allows the maintenance person to quickly observe the last coil on in the string and surmise that the sequence is hung at the next step. This gives the maintenance person a handy method of troubleshooting the sequencer using relays. Care must be taken to not allow the next sequence to start while the sequencer is finishing the present sequence. Logic should account for not allowing a new starting pulse while the last sequence is still being executed. While this type of sequencer seems to be cumbersome, it is used a great deal as long as the sequencer length is not long and the steps are well defined. If the steps are not well defined, a second method using a counter should be employed. Using a counter allows additional steps to be inserted more easily than with relays. Both methods of using coils or a counter provide a memory of where the sequence has been and where it next is expected to move. In general, coils and counters are equal. Counters can be a bit more flexible, however, when adding a number of steps quickly. Using Counters to Control Sequencers As sequencers become more complicated, the need for a more robust sequencer programming technique becomes necessary. As a second approach, it is suggested that a number in an N7 location be used to identify the present state of the sequencer. Usually a step number is employed. If the number is 0, the sequencer is not active. If it is positive, then the sequencer is active and the sequencer is in the state of the number. As the number is incremented, the sequencer moves to the next step. Very large sequencers may be built in this way. If the sequencer is in a particular state, the EQU block allows logic to be performed exclusively in that state. The rung below shows an initialization step using a number for the step counter. Fig. 11-39a Simple Robotic Sequencer in Ladder using Numbers for Steps Using the logic from the original sequencer, initialization moves a 1 into the sequence counter located in N7:1. While it is not required that one-shot logic be used, it is usually recommended. Example using Counters to Increment Sequencer:
  • 39. Ch. 11 Use of State Diagrams 39 Fig. 11-39b Simple Robotic Sequencer in Ladder using Numbers for Steps As each state is satisfied, the sequencer moves to the next state based on logic similar to the relay-based sequencer. An advantage of using a number to drive the sequencer is that several steps may be jumped over and then filled in at a later date. For instance, if it is known that a sequencer is going to be complicated and that several steps are not fully known, plan the program to skip some steps and then go back and fill them in as necessary. Skipping steps or changing steps is much easier with a number than with the sequencer using only coils and seal circuits. Any of a number of other methods using bits or numbers can be used for sequencer control. For instance, a sequencer may be programmed using a word with a bit initially placed in the least significant bit and rotated one bit to the left for each step. This approach is as valid as either of the approaches listed above. Adding Time between Steps Each of the sequencer types potentially needs a time delay between the end of the prior step and the beginning of the next step. With the original relay circuit sequencer, the fix is easy. It requires only that a timer be placed between each step. This may be accomplished by programming the following:
  • 40. Ch. 11 Use of State Diagrams 40 Fig. 11-40a Adding Timer Delay Between Steps using Coils To program a time delay between steps of a sequencer using counters, sense the change of step, delay a time period and step to the next step using a one-shot. See below for an example of the time delayed counter sequencer. Fig. 11-40b Adding Timer Delay Between Steps using Numbers Using the SQx Instructions A third approach uses the sequencer instruction to direct step number and output state. The instructions SQO, SQL, and SQC of RSLogix 500 or SQI, SQO and SQL of RSLogix 5000 are three instructions used to define and operate a sequencer. Several Sequencers may be combined to coordinate large sequencer blocks. Why is it not advisable to use these instructions as compared to the methods used above? The sequencer instruction set is quite complicated but once set up tends to work very well. The reason that sequencers are built without incorporating the SQx instruction set is that sequencers programmed with the SQx instructions tend to be very difficult to troubleshoot by others. This may lead to difficulty in keeping a process running. The original programmer may understand the concept from layout to implementation but as documentation is lost or not available and an electrician or other technical person is brought in to troubleshoot the sequencer, the difficulty of finding broken equipment interacting with the sequencer is great. The SQC instruction moves a
  • 41. Ch. 11 Use of State Diagrams 41 step each time it receives a off-to-on transition. It moves sequentially through the programmed sequencer file. It compares data through a mask to a source word or file to check for equality. The Mask is a hexadecimal code or the address of a mask word or file. If the mask is designated as a file, its length is equal to the sequencer file’s length. The Source is the address of the input word or file for which a SQC instruction obtains data for comparison to the sequencer’s file. Sequencers are built by setting up tables in files which then are executed with the SQx instructions. A table is built for each portion of the SQO and SQC instruction. The Output Table for a 10-step sequence controlling up to 16 outputs is shown below. Output Table: Step 1 Step 2 Step 3 Step 4 Step 5 Step 6 Step 7 Step 8 Step 9 Step 10 Mask allows bit in output word to be set either 1 or 0 when mask bit set. Mask yields: Output
  • 42. Ch. 11 Use of State Diagrams 42 Using Sequential Logic in State Diagrams with Runoff Combinations of sequential logic may be combined using Runoff State Diagrams. An example from industry will be used. The exact application will be somewhat obscured to protect the company’s proprietary information. The application moves steel billets through a reheat process. The billets are staged on a conveyor and then positioned to transfer to a second table prior to entry to a re-heat furnace. First, a billet is laid on a table with rolling collars capable of moving the billet in the direction noted. The billets proceed to the transfer table (second table) as shown. When two billets are on the transfer table, then they are ready to transfer as more billets are laid on the first table. Billet laid on table Billet moving Second Billet laid on table Billet moving First Billet in position to transfer BothBillets in position to transfer Another Billet laid on table Billet moving Fig. 11-41a Physical Layout of Billets Moving on Table in Steel Plant
  • 43. Ch. 11 Use of State Diagrams 43 Once the billets are in position to transfer, the second table sends a “ready” signal to the Charge Table and waits for a “clear” signal to begin transfer of billets onto the Charge Table. BothBillets in position to transfer Billet stopped Charge Table must be free of billets Both Billets begin to transfer Billet stopped Charge Table must be free of billets Billet moving Charge Table Accepts Billets, ready to charge to furnace Billet laid on table Re-heat Furnace Fig. 11-41b Physical Layout of Billets Moving between Tables in Steel Plant Now, billets are in place on the Charge Table ready to charge into the furnace while other billets are being positioned and ready to come onto the Charge Table when it is clear again.
  • 44. Ch. 11 Use of State Diagrams 44 A state diagram of the operation is shown below. Notice that the tables are linked in the state diagram. Notice that the third sequencer is used to take billets out of the back end of the furnace. This action must be coordinated with the charging of the furnace in order to keep the charge and removing of the billets in sync. Start Billet Transfer State Step 1 Receive Billet Step 2 Move to Charge Step 3 Move 2 to Chrge Step 4 Wait for Synq Step 5 Mv 2 Billets Off Step 6 Billets Clear Start Charge Table Xfer State Step 1 Xfer Table Clear Step 2 Accept Billets Step 3 Billets in Position Step 4 Wait for Synq Step 5 Charge Furnace Step 6 Charge Done Start Furn Discharge State Step 1 Ready to Accept Step 2 Accept Billets Step 3 Discharge Ready Step 4 Discharge #1 no Step 5 Discharge #2 Step 6 Discharge #3 Step 7 Discharge #4 yes Fig. 11-41c Billet State Diagram
  • 45. Ch. 11 Use of State Diagrams 45 Here the furnace is shown with billets filling the furnace from charge end to discharge end. The billets must be able to move into the furnace but only when there is room after a discharge takes place. The charge end state table must not act until room is available after discharge happens. This corresponds to step 3 of the second state table attached to state 3 of the third state table. The charge occurs at this time. Discharge occurs at another step in the process. Charge Table Accepts Billets, ready to charge to furnace Re-heat Furnace Billet moving Fig. 11-41d Billet State Diagram
  • 46. Ch. 11 Use of State Diagrams 46 Multiple Sequencers Using Same Program If an operation is similar to another operation except for the movement of a part or some other common occurrence, a state diagram may be used with the same program and multiple steps input to common logic. For example, the following state diagram may use a common program for step 1, step 11 and step 21 if the same action is done in each. A program such as this would be equivalent to a looping program in which the same operations are done in common for a number of different steps. Billet moving Logic from Step 1 Billet moving Logic from Step 11 Billet moving Logic from Step 1 Billet moving Logic from Step 11 Billet moving Logic from Step 21 Fig. 11-41e Billets Moving From Furnace Start Seq Step 21 Step 22 Step 23 Step 24 Step 25 End Seq Step 15 Step 14 Step 1 Step 2 Step 3 Step 4 Step 5 Step 11 Step 12 Step 13
  • 47. Ch. 11 Use of State Diagrams 47 The following logic could be used to control multiple steps using common logic: State diagrams using numbers can use the logic above to combine the logic of multiple steps simply by using the program structure above. Systems of State Tables State tables can be ganged together similar to the furnace state table described above in large systems. For example, the emptying of a parking lot of cars may resemble the following sequence: E D C B F E D C A G F E D B Fig. 11-42 Step = 1 Step = 11 Step = 21 Logic common to steps 1, 11, 21 Fig. 11-41f
  • 48. Ch. 11 Use of State Diagrams 48 Each car moves from station to station and then waits for the next station to empty before moving forward. Each station may be a state diagram in a manufacturing setting. At each station, an action is done to the part. One station for instance can add a component and the next station can weld the component to the main body of the part. Each action depends on the prior action successfully completing and then proceeding. Without the first car moving forward, the succeeding cars are stuck but with its movement, then the next car moves forward followed by the next, etc. Each operation at each station is important to the overall fabrication of the part and each station’s activity is a state diagram (possibly a sequential state diagram). The outcome is a complicated process that can be broken down into several small operations with the interlinking of states one to another. Each process in the figure below starts with a step 1 followed by 2, 3, 4, 5, etc. At each juncture, there is a hand-off to a subsequent process. The hand-off occurs at a prescribed step in the sequence of steps. Each hand-off must be coordinated between two separate state tables. Step 1 Step 2 Step 3 Step 4 Step 5 Step 1 Step 2 Step 3 Step 4 Step 5 Step 1 Step 2 Step 3 Step 4 Step 5 Step 1 Step 2 Step 3 Step 4 Step 5 Step 1 Step 2 Step 3 Step 4 Step 5 Step 1 Step 2 Step 3 Step 4 Step 5 A B C D E F B C D E F G B C D E F C D E F E F D C B B E F F D C B E D C B F E D C B
  • 49. Ch. 11 Use of State Diagrams 49 When a sequence such as this is being planned, the last part (at the furthest downstream station) is moved off the table and then the next part is moved into the last station and each part upstream can move downstream one station. Their motion is similar to the cars moving up a station in the figure of the previous page. While we use cars to show the sequence, the item may be a single piece of glass or anything requiring a position where only one can fit in the next station. If there is no limit to the number of parts that can fit in a waiting line for the next station, there does not need to be the linking between sequencers as shown above. An example of this would be pallets in a machining operation in which a pallet is free to move to the next station no matter what the state of the downstream operation is. In this circumstance, there would be no need to tie state diagrams together. Each operation would have a state diagram independent (for the most part) from the preceding operation’s state diagram. Pallet Pallet Pallet Pallet Pallet Pallet Pallet Vertical Mill Welding Machine Machine Flow More intricate state diagrams are defined in future chapters such as Ch. 13 which is interested with batching operations. The state diagram defines entire portions of the programming process and serves as a discussion point to define the program prior to actually committing to a design. The state diagram is useful in the very simple diagrams at the beginning of the chapter or with those at the end of this chapter or in future chapters in this text. The state diagrams of the exercises at the end of this chapter in many cases are as difficult to design as the actual program that follows the state diagram and actually controls the process. Timing of Steps In many processes, there are bottle-necks which the PLC programmer may be requested to remove. Timing of movement between stations is an area of concern in many applications. If the pallet or part is not present at the station before the step is to be accomplished, then the time to travel may be the bottle-neck. If possible, the programmer should look for ways to avoid this. One method is to move a piece half-way between two stations which effectively cuts down travel time by half. If the program will not allow this type of control, other ways such as tracking of parts and knowing exact position may be used. In any event, while the PLC programmer may not be thought of as a time-study expert, he/she should consider the time taken to travel between stations as dead time and minimize it. Troubleshooting Hint A troubleshooting hint for one-shots is to program a counter or adder (pseudo-counter) to record the one-shot event. Either counter or adder works well to trap the event that usually is not seen
  • 50. Ch. 11 Use of State Diagrams 50 on the computer screen. I0.0 is seen but |P| of I0.0 is not. If a program contains several contacts such as |P| of I0.0, then use the circuit shown below to trap or show instances of the one-shot occurring in logic: Fig. 11-43 Revisit “Last Coil Wins” In previous chapters, it was stressed that since the last coil wins, coils should never be double programmed. However, if a coil is being used with logic from several different sources, it is possible to use a coil more than once with prior occurrences carrying forward to later occurrences. This type of programming can become a logistical nightmare and should be avoided. It does show the scan-dependent nature of programming and the ability to program ladder logic that would not work the same if re-arranged. A x B C x x D E x x F G is equal to: A x B G C D E F Fig. 11-44 Accepted Multiple Use of Output Coil
  • 51. Ch. 11 Use of State Diagrams 51 Care must be taken to keep rungs of logic programmed in this way close together. If the output x is programmed as the rungs above and the rungs are not close together, other rungs using x may be on when the actual state of x is off. The opposite may also be true. This is something that might be a useful tool in a program. In that case, ignore the previous warning of “last coil wins” and use the programming technique. We may have drifted a bit from the original subject of the chapter with a discussion of state diagrams. The topics discussed are of importance in developing good programs and should be considered in the scope of the state diagram. The importance of understanding when the programmer has need of state diagrams is extremely important and should be discussed in tandem with the subject of how to program a state diagram program. Planning For Problems at End of Chapter The problems at the end of the chapter are good practice problems for you to try your skill at developing a state diagram. Some are quite difficult. Others will be able to be done in a few minutes. The longer, harder problems can be split into a number of smaller state diagrams that are joined together. For instance, the problems involving stacking or moving of material each have three modes: • Manual • Homing • Automatic The elevator problem has two modes: • Regular operating • Irregular operating A good first step would be to look for the modes if defined and build a state diagram for the mode. The mode might involve a number of simple state diagrams within the over-all diagram. For instance, most manual modes allow the operator to move independently an axis or part of the machine from a jog control as long as the movement does not bind or hurt another part of the machine. Some programs don’t care and allow the user to do what they want in this mode with the realization that if a crash or crunch occurs, the user will be the one to suffer. Sometimes this is best since the machine may need to be moved or jostled a little to free it from a bind or abnormal position. The programmer is usually the one to decide the safety limits and the programmer may decide to include the safety logic or not, especially in the manual mode. Homing includes a number of moves the machine must make to restore it to a proper start position. Home is the position the machine expects to start its automatic operation from. Automatic is the mode most used. It should include time delays between steps sufficiently long to allow for proper movement but short enough to allow the proper amount of parts to be manufactured to satisfy the operation.
  • 52. Ch. 11 Use of State Diagrams 52 If a problem does not define the mode, the programmer has the discretion to include certain attributes of the program in the mode or not. Usually the operator will help with defining the mode so that this person can most easily understand the operation of the machine and diagnose simple problems without the aid of the electrician or engineering programmer. Your best defense is to please the operator. Then please everyone else to the best of your ability. The machine tender or operator and the electrician are your best friend. Cultivate a positive atmosphere with each of them and your job will be easier by far. The following common device has similar characteristics to the sequencers built above. The device is used to turn on and off household lights with the programming of the timer by pushing in the indented buttons around the 24-hour clock. Fig. 11-45 Sequencer Simplified
  • 53. Ch. 11 Use of State Diagrams 53 Summary This chapter is about state diagrams and their little cousin, the sequencer. Both of these tools are useful in programming difficult machine operations and allow the programmer to walk away after an installation with the satisfaction that the operation of the machine has been developed logically and the maintenance of the machine will be easier than if developed otherwise. A common statement from many end users who depend on others to program their processes is that they don’t want “spaghetti code”. This is a metaphor for difficult-to-diagnose code. We have all seen others’ code that we would term spaghetti code and wonder who would have ever created such a mess. We should remember that we need to look at the end product from the customer’s point of view and give the best effort to create a program that both works and is maintainable. A systems engineer once looked at my efforts and asked if I knew the KISS method. I did and I got it. The last letter of the KISS method is one that you or I do not ever want as part of our label. Whether you are strongly convinced that state diagrams are a good way to see how to start a program or not, consider that one of the first programs you will probably be asked to produce is one similar to the one with the small robot moving the egg seen in this chapter. The ‘boss’ will try you out on something considered quite simple and in most cases developed in a few hours as opposed to days or weeks or months. It is a test. So, if you are to pass this initial test, you should be able to see the problem as a simple sequence and develop the program appropriately. This is a strong motivator for you to understand the concepts, at least to a point, for how to develop a sequential program (or state diagram program). Hopefully you will be able to move quickly through this initial test and onto more meaningful programs down the road.
  • 54. Ch. 11 Use of State Diagrams 54 Exercises 1. Elevator Problem – Provide a set of State Diagrams for the Elevator 2. Provide State Diagram(s) for the following: Low Level L0 Bucket El BE1 Screw Conv SC1 Pump P1 Pump P2 Agitator A1 High Level L4 Bin 1 Screw Conv SC2 Level L1 Level L2 Level L3
  • 55. Ch. 11 Use of State Diagrams 55 The main tank will fill with conveyor SC1 and bucket elevator BE1 as well as liquid from pumps P1 and P2. To make a batch, fill to a level L1 with the ingredient from the bucket elevator. Then fill to a second level L2 with the ingredient from Pump P1. Then turn on the agitator and fill to a final level P3 with the ingredient from Pump P2. When done, agitate for a time and dump using SC2. 3. Provide State Diagrams for the following machine:
  • 56. Ch. 11 Use of State Diagrams 56 4. Provide State Diagrams for the following machine: 5. The following Simon Says State Diagram has various labels associated with the circles (bubbles). Label each bubble according to the attached list: a. Not Playing b. Flash Lights c. Playing/Pushing Buttons d. Playing/Showing Lights 2 1 3 Error Success 4 Won
  • 57. Ch. 11 Use of State Diagrams 57 6. From the following two figures below, first fill in the table of inputs and outputs:
  • 58. Ch. 11 Use of State Diagrams 58 Fill in Definition of Inputs: Sensor Function/State Signal Assignment Fill in Definition of Outputs: Then write logic to perform the automatic operation of the feeder. 7. The problem below moves a part left to right and into a sanding station. The sander only turns on after PE 2 sees the part. When the part reaches PE 3, the sander turns off and the part returns to the left to PE 1. Draw a state diagram and then write a program in Ladder to control the action described when the start button is pushed and the system automatically repeats the travel right, then left five times. Include a short time delay at each end of travel. Actuator Function/State Signal Assignment
  • 59. Ch. 11 Use of State Diagrams 59 Start Button PB1 Part Travels Down Machine Part is sanded Part Travels Back Part Stops, is Removed after 5 passes PE3 PE2 PE3 PE3 PE3 PE1
  • 60. Ch. 11 Use of State Diagrams 60 Lab 11.1 Three Pumps Three pumps are arranged as follows to provide cooling water for a manufacturing plant. For cooling to occur, at least one of the pumps must be on at all times but if no cooling is required, all pumps are to be turned off. For more cooling, a second pump is requested to turn on, followed by a third pump if sufficient cooling is still not received. To protect each from wearing out prematurely, a plan has been devised to allow each pump to turn on and off by using logic to turn on the next pump in sequence and turn off the pump that has been on the longest. Timers should not be used to determine the pump on longest but rather logic should be used to determine which pump should have been on the longest. For example, if pump 2 and 3 are on but 1 is off, pump 2 is the one that should be turned off since it probably came on before 3 did. If a call for less cooling is received and all three pumps are on, the pump that was logically on for the longest time should be turned off. The system starts out with no pumps on and when a call for more occurs, pump 1 will turn on. Then the system is cyclical rotating through pumps 2, 3, 1, 2, etc. Pump 1 Pump 2 Pump 3 More Less Options: Lab 11.1 Add auto/manual switches for 1, 2, or 3 pumps. Auto will allow cycling of a pump normally while manual will allow a pump to be started and stopped with a push-button. .1- P1(A/M), P2(A/M), P3(A/M) .2- P1(A/M), P2(A/M), P3(A) .3- P1(A/M), P2(A), P3(A/M) .4- P1(A), P2(A/M), P3(A/M) .5- P1(A/M), P2(A), P3(A) .6- P1(A), P2(A/M), P3(A) .7- P1(A), P2(A), P3(A/M) .8 - add a fourth pump and have all P1-P4 either (A/M) Note: The base program of Lab 11.1 is called a floating master for the pumps. The master is initialized as pump 1 until pump 2 turns on when it becomes the master. Pumps turn of based on the principle of leaving the master pump on as long as possible. Therefore, pump 1 would turn
  • 61. Ch. 11 Use of State Diagrams 61 off before pump 2 if both pump 1 and pump 2 are on. The Pump Demand Program Hints Notice the position of the logic is extremely important in that the scan is used to do operations in a sequential order within the scan. This programming technique can aid in solving very difficult sequential logic such as this problem with minimal difficulty. Use of the scan is a great aid in programming and sequential programming in particular. 2 Off Rules to turn on Pump 1 1 On Rules to turn off Pump 1 Pump 1 Define One Shots for Increase, Decrease Establish rules for On, Off of various pumps 2 Off 1 On 2 Off 1 On Pump 2 Pump 3 2 Must also establish logic for: 1 3 States 1-3 mutually exclusive (only one on at a time) Pump 1 on last Pump 2 on last Pump 3 on last Rules to turn on Pump 2 Rules to turn on Pump 3 Rules to turn off Pump 2 Rules to turn off Pump 3 Lab 11.2 Four Fans – Repeat of 11.1 except for four fans instead of three pumps