![using
Graphics;
namespace
Study
{
public
class
Drawing
{
public
static
void
Main(string[]
args)
{
Circle
c
=
new
Circle();
Triangle
t1
=
new
Triangle();
Square
s
=
new
Square();
Triangle
t2
=
new
Triangle();
Graphics.draw(t2);
Graphics.draw(t1);
Graphics.draw(c);
Graphics.draw(s);
}
}
}
using
Graphics;
namespace
Study
{
public
class
Drawing
{
public
static
void
Main(string[]
args)
{
Object
objectA
=
new
Circle();
Object
objectK
=
new
Circle();
Object
objectX
=
new
Square();
Object
objectB
=
new
Triangle();
Graphics.draw(objectX);
Graphics.draw(objectA);
Graphics.draw(objectB);
Graphics.draw(objectK);
}
}
}
2](data:image/gif;base64,R0lGODlhAQABAIAAAAAAAP///yH5BAEAAAAALAAAAAABAAEAAAIBRAA7)
Recommended
More Related Content
Similar to Using psycho physiological sensors to assess task difficulty in software development
Similar to Using psycho physiological sensors to assess task difficulty in software development (20)
Recently uploaded
Recently uploaded (20)
Using psycho physiological sensors to assess task difficulty in software development
- 1. Thomas Fritz*, Andrew Begel°, Sebastian C. Müller*, Serap Yigit-Elliott†, and Manuela Züger*" * University of Zurich, Switzerland" ° Microsoft Research, USA" † Exponent, USA"
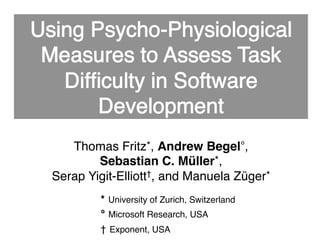
- 2. using Graphics; namespace Study { public class Drawing { public static void Main(string[] args) { Circle c = new Circle(); Triangle t1 = new Triangle(); Square s = new Square(); Triangle t2 = new Triangle(); Graphics.draw(t2); Graphics.draw(t1); Graphics.draw(c); Graphics.draw(s); } } } using Graphics; namespace Study { public class Drawing { public static void Main(string[] args) { Object objectA = new Circle(); Object objectK = new Circle(); Object objectX = new Square(); Object objectB = new Triangle(); Graphics.draw(objectX); Graphics.draw(objectA); Graphics.draw(objectB); Graphics.draw(objectK); } } } 2
- 3. • Several research areas tackle this question:" • CS Education" • Psychology of Programming" • Program Comprehension" • And its implications:" • Testing and Automatic Verification" • Code Reviews" • Mining Software Repositories" " " 3
- 4. • Inspired by Lee et al. Micro interaction metrics for defect prediction. FSE 2011." • Programmers’ cognitive and emotional states are affected by their code and work environment, which ultimately affects their software." § Some typical emotions: frustrated, surprised, proud." • Some signals of your body’s internal states:" " 4 Nervous System! Brainwaves, sweat" Eyes! Pupil size, blink rate" Muscles! Heart rate variability, typing pressure, grip on mouse" Affect! Facial recognition"
- 5. 1. Can we correlate developers’ cognitive and emotional states with their perception of task difficulty?" 2. How well do these states predict long-term effects on software (e.g. bugs, productivity)?" When we detect that a developer is in the zone, we could signal his teammates to delay non-critical interruptions." We could refactor the cognitively difficult parts of the codebase where developers lose the most productivity." Armed with a task difficulty classifier, we could help stop developers from making mistakes!" " 5
- 6. 1. Can readings from psycho-physiological sensors (eye tracking, EDA, EEG) accurately predict whether a task is perceived to be difficult or easy?" 2. Which combination of sensors and features best predict perceived difficulty?" 3. Can we use these measures to predict perceived difficulty even as the developer works on the task?" 6
- 7. 7 15 professional software developers" 8 tasks with various levels of difficulty" 3 psycho-physiological sensors" 8 task ratings and 1 ranking of all tasks"
- 8. • Recruited from a pool of professional developers in the greater Seattle area" • 2+ years of professional SE experience" • Recently programmed in C#" • 14 male, 1 female" • 27 to 60 years old" 8
- 9. 8 Tasks:! (2 types)" Variations:" Cognitive Abilities:" 2 overlap tasks" 2 1 4 3 6 drawing order tasks" Variable names (mnemonic vs. obfuscated)" Loops with various complexity" Nested ?: operator" Randomly-ordered field assignments" Working memory" Spatial relations" Math and Logic" 9
- 10. 10 using Graphics; namespace Study { class Drawing { public static void Main(string[] args) { Rectangle t = new Rectangle(); t.leftBottom = new Point(2,2); t.leftTop = new Point(2,6); t.rightTop = new Point(6,6); t.rightBottom = new Point(6,2); Graphics.draw(t); Rectangle s = new Rectangle(); s.leftTop = new Point(11,5); s.leftBottom = new Point(5,5); s.rightBottom = new Point(5,9); s.rightTop = new Point(11,9); Graphics.draw(s); } }} Do these rectangles overlap?"
- 11. 11 using Graphics; namespace Study { class Drawing { public static void Main(string[] args) { Rectangle t = new Rectangle(); t.leftBottom = new Point(2,2); t.leftTop = new Point(2,6); t.rightTop = new Point(6,6); t.rightBottom = new Point(6,2); Graphics.draw(t); Rectangle s = new Rectangle(); s.leftTop = new Point(11,5); s.leftBottom = new Point(5,5); s.rightBottom = new Point(5,9); s.rightTop = new Point(11,9); Graphics.draw(s); } }} using Graphics; namespace Study { class Drawing { public static void Main(string[] args) { Rectangle v = new Rectangle(); v.leftTop = new Point(1,8); Rectangle x = new Rectangle(); x.rightBottom = new Point(13,3); x.rightTop = new Point(13,10); x.leftBottom = new Point(7,3); v.rightTop = new Point(3,8); x.leftTop = new Point(7,10); v.rightBottom = new Point(3,5); Graphics.draw(x); v.leftBottom = new Point(1,5); Graphics.draw(v); } }} Do these rectangles overlap?"
- 12. 12
- 13. Neurosky Mindband" Q Affectiva 2.0" Tobii TX300 Eye Tracker" EEG (Electroencephalogram)" EDA (Electro-dermal activity)" Eye tracking" • code location" • reading vs. scanning" • cognitive load" • general state of arousal" • surprise" • visual attention, mental workload, etc." • attention™, meditation™" 13 • α, β, γ, δ, θ waves" • eye blinks" • attention, meditation" • tonic signal (low freq)" • phasic signal (high freq)" • gaze location" • fixations and saccades" • pupil size"
- 14. 1. Recorded participants’ task completion times." 2. After each task, participant filled out NASA Task Load Index (TLX) survey." 3. At end of study, participant ranked tasks by relative difficulty (1 – 8)." 14
- 15. 15
- 16. Data recording" Feature extraction" Data cleaning" Naïve Bayes classifier" Developers’ perceived difficulty" 16 Sliding time windows (optional)"
- 17. • Task difficulty metrics were highly correlated. " • NASA TLX vs. task difficulty ranking Spearman: r[116] = 0.587, p < 0.01" • Task difficulty ranking vs. task completion time Spearman: r[116] = 0.724, p < 0.01" • We created simplified metrics by nominalizing NASA TLX and task difficulty ranking into Boolean easy/difficult." • Correlation: Boolean NASA TLX score vs. Boolean task difficulty Chi2(1, 116) = 57.954, p < 0.01 (accuracy 85%)" • Triangulation between metrics helps validates our results." 17
- 18. 18
- 19. 45% 55% 65% 75% 85% 95% Eye EDA EEG Eye + EDA Eye + EEG EDA + EEG Eye + EDA + EEG 19 45% 55% 65% 75% 85% 95% 5 10 15 20 25 30 35 40 45 50 55 60 Sliding Windows Size (sec)
- 20. 20
- 21. 21 45% 55% 65% 75% 85% 95% Eye EDA EEG Eye + EDA Eye + EEG EDA + EEG Eye + EDA + EEG 45% 55% 65% 75% 85% 95% 5 10 15 20 25 30 35 40 45 50 55 60 Sliding Windows Size (sec)
- 22. 22
- 23. 23 45% 55% 65% 75% 85% 95% Eye EDA EEG Eye + EDA Eye + EEG EDA + EEG Eye + EDA + EEG Sliding Window Size (sec) 45% 55% 65% 75% 85% 95% 5 10 15 20 25 30 35 40 45 50 55 60
- 24. 1. Can readings from psycho-physiological sensors (eye tracking, EDA, EEG) accurately predict whether a task is perceived to be difficult or easy?" 2. Which combination of sensors and features best predict perceived difficulty?" 3. Can we use these measures to predict perceived difficulty even as the developer works on the task?" 24