Excel macro for solving a polynomial equation
•
1 like•1,043 views

MS Excel macro for solving a polynomial equation of degree 10. It may be useful for those learning macros.

Recommended
Recommended
More Related Content
Similar to Excel macro for solving a polynomial equation
Similar to Excel macro for solving a polynomial equation (20)
More from Upendra Lele
Recently uploaded
Recently uploaded (20)
Excel macro for solving a polynomial equation
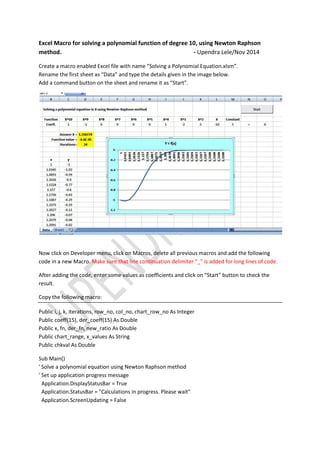
- 1. Excel Macro for solving a polynomial function of degree 10, using Newton Raphson method. - Upendra Lele/Nov 2014 Create a macro enabled Excel file with name “Solving a Polynomial Equation.xlsm”. Rename the first sheet as “Data” and type the details given in the image below. Add a command button on the sheet and rename it as “Start”. Now click on Developer menu, click on Macros, delete all previous macros and add the following code in a new Macro. Make sure that line continuation delimiter “_” is added for long lines of code. After adding the code, enter some values as coefficients and click on “Start” button to check the result. Copy the following macro: Public i, j, k, iterations, row_no, col_no, chart_row_no As Integer Public coeff(15), der_coeff(15) As Double Public x, fn, der_fn, new_ratio As Double Public chart_range, x_values As String Public chkval As Double Sub Main() ' Solve a polynomial equation using Newton Raphson method ' Set up application progress message Application.DisplayStatusBar = True Application.StatusBar = "Calculations in progress. Please wait" Application.ScreenUpdating = False
- 2. Application.DisplayAlerts = False cgpi = 0 Call init_params Call solve_eqn If j >= iterations Then If Abs(fn) >= 0.0001 Then Cells(6, 5) = "Solution does not exist" Else Call create_chart End If End If End Sub Sub init_params() ' Open files Workbooks("Solving a Polynomial Equation.xlsm").Activate Worksheets("Data").Activate Call clear_chart Cells(6, 4) = "" Cells(6, 5) = "" Cells(7, 4) = "" Cells(8, 4) = "" row_no = 3 col_no = 3 coeff(0) = 0 der_coeff(0) = 0 k = 5 For i = 1 To 11 coeff(i) = Cells(row_no, col_no) der_coeff(i) = k * Cells(row_no, col_no) col_no = col_no + 1 k = k – 1 Next iterations = 1000 x = 1 chart_row_no = 11 Call compute_fn Cells(chart_row_no, 2) = Round(x, 4) Cells(chart_row_no, 3) = Round(fn, 2) chart_row_no = chart_row_no + 1 End Sub
- 3. Sub solve_eqn() ' Generate successive approximations of X For j = 1 To iterations If Abs(fn) > 0.0001 Then x = (x - new_ratio) Call compute_fn Cells(chart_row_no, 2) = Round(x, 4) Cells(chart_row_no, 3) = Round(fn, 2) chart_row_no = chart_row_no + 1 Else Cells(5, 4).Value = x Cells(6, 4).Value = fn Cells(7, 4) = j j = iterations End If Next End Sub Sub compute_fn() ' Compute the value of the function fn = ((coeff(1) * x ^ 10) + (coeff(2) * x ^ 9) + (coeff(3) * x ^ 8) + (coeff(4) * x ^ 7) + (coeff(5) * x ^ 6)) + _ ((coeff(6) * x ^ 5) + (coeff(7) * x ^ 4) + (coeff(8) * x ^ 3) + (coeff(9) * x ^ 2) + (coeff(10) * x) + coeff(11)) der_fn = ((der_coeff(1) * x ^ 9) + (der_coeff(2) * x ^ 8) + (der_coeff(3) * x ^ 7) + (der_coeff(4) * x ^ 6) + _ (der_coeff(5) * x ^ 5) + (der_coeff(6) * x ^ 4) + (der_coeff(7) * x ^ 3) + (der_coeff(8) * x ^ 2) + (der_coeff(9) * x) + der_coeff(10)) new_ratio = (fn / der_fn) End Sub Sub create_chart() Sheets("Data").Select Range("F20").Select x_values = "B11:B" + Trim(Str(chart_row_no)) chart_range = "C11:C" + Trim(Str(chart_row_no)) ActiveSheet.Shapes.AddChart.Select With ActiveChart .ChartType = xlLine .SetSourceData Source:=Workbooks(1).Sheets("Data").Range("B10:C1011")
- 4. .SeriesCollection(1).XValues = Range(x_values) .SeriesCollection(1).Values = Range(chart_range) .Axes(xlCategory).TickLabels.Font.FontStyle = "Bold" ' .Axes(xlCategory).TickLabels.NumberFormat = "3" .Axes(xlValue).TickLabels.Font.FontStyle = "Bold" .HasTitle = True .HasLegend = False .ChartTitle.Text = "Y = f(x)" .Parent.RoundedCorners = True .ChartArea.Height = 200 .ChartArea.Width = 300 .ChartArea.Format.Fill.ForeColor.RGB = RGB(204, 255, 255) .SetElement (msoElementChartTitleAboveChart) .ChartTitle.Characters.Font.Size = 12 .SeriesCollection(1).Select End With ActiveChart.SeriesCollection(2).Select Selection.Delete ' Resize and Position the chart on worksheet With ActiveChart.Parent .Left = 230 .Width = 375 .Top = 110 .Height = 225 End With Workbooks("Solving a Polynomial Equation.xlsm").Activate Worksheets("Data").Activate End Sub Sub clear_chart() On Error Resume Next ActiveSheet.ChartObjects(1).Select Selection.Delete chart_row_no = 11 For i = 1 To 1000 Cells(chart_row_no, 2) = "" Cells(chart_row_no, 3) = "" chart_row_no = chart_row_no + 1 Next End Sub