
Recommended
Recommended
More Related Content
More from rock73
More from rock73 (20)
Recently uploaded
Recently uploaded (20)
BA 301.01Chapter 3 HomeworkIdentifyQ1) Examine the data se.docx
- 1. BA 301.01 Chapter 3 Homework Identify Q1) Examine the data set on the worksheet Q1. This should be familiar; you saw this data set in last week’s homework. Recall that this is a survey of 500 households. The definitions of the variables can be found by reading the comments (the little red triangles). a) Suppose we wanted to examine the distribution of the variable Utilities. It would be appropriate to create a histogram, but we would like to identify measures like the mean, median, and quartiles. What other type of graph could you create? b) In order to examine the relationship between the variables First_Income and Second_Income, what type of graph should be created? What summary measures, if any, should be calculated? c) In order to examine the relationship between the variables Location and Monthly_Payment, what type of graph should be created? What summary measures, if any, should be calculated? Execute Q2) Examine the data set in the worksheet Q2. This data set lists the 15 players on the 2015-2016 roster of the Los Angeles Lakers. The variables include the name, position, and salary for each player. Create a side-by-side boxplot for Salary, broken out by Position. In other words, there should be 5 boxplots, one showing the distribution of salaries for those who play center, one showing the distribution of salaries for those who play point guard, and so on. Specifically, this should all be in a single graph. Q3) Examine again the data in sheet Q1 (there is no sheet Q3.)
- 2. We would like to know if the size on one’s family has an effect on their income. Keeping in mind which is the explanatory variable and which is the response variable, create a scatterplot of the variables First_Income and Family Size. Be sure to include the correlation coefficient. Q4) Who has been most likely to access the internet over the past decade? Consider the survey data collected from 1,000 randomly selected internet users, given in Q4. Create pivot tables to answer each of the following questions, and be sure to highlight your answer: a) i. What proportion (percentage) of these internet users is currently employed? ii. What is the average salary of the employed internet users in this sample? b) What proportion (percentage) of these internet users is single with no formal education beyond the high school? c) What proportion (percentage) of these internet users are men under the age of 30? Interpret Q5) Interpret the following. What do you learn? What conclusions can you draw? In May of 2008, a study was published examining CEO compensation (salary and bonus.) In last week’s homework, you viewed a boxplot of the distribution of compensation, as well as summary measures. Here is the same data, now broken out by company type (there were 10 different company types surveyed: from Basic Materials to Utilities). Side-by-side boxplots are on the next page. Again, what can you conclude?
- 3. Comp 08 (Basic Materials) Comp 08 (Consumer Goods) Comp 08 (Consumer Services) Comp 08 (Financials) Comp 08 (Health Care) One Variable Summary Data Set #1 Data Set #1 Data Set #1 Data Set #1 Data Set #1 Mean $2,483,329 $2,787,126 $2,987,036 $2,342,734 $3,292,771 Std. Dev. $886,448 $1,815,164 $3,312,399 $2,784,996 $1,732,319 Median $2,583,000 $2,168,200 $1,500,000 $1,121,400 $3,029,400 Minimum $792,400 $950,000 $0 $0 $365,300 Maximum
- 4. $4,612,800 $11,017,300 $15,945,500 $17,649,500 $6,825,000 Range $3,820,400 $10,067,300 $15,945,500 $17,649,500 $6,459,700 Count 21 46 75 50 28 1st Quartile $1,733,500 $1,291,700 $1,022,600 $900,000 $1,868,100 3rd Quartile $3,002,000 $3,737,800 $3,228,300 $3,600,000 $4,281,500 Interquartile Range $1,268,500 $2,446,100 $2,205,700 $2,700,000 $2,413,400 1.00%
- 6. Comp 08 (Industrials) Comp 08 (Oil & Gas) Comp 08 (Technology) Comp 08 (Telecommunications) Comp 08 (Utilities) One Variable Summary Data Set #1 Data Set #1 Data Set #1 Data Set #1 Data Set #1 Mean $2,648,446 $3,010,437 $2,283,269 $3,319,620 $2,261,056 Std. Dev. $1,415,705 $1,618,410 $2,515,800 $1,725,552 $991,095 Median $2,149,200 $2,688,700 $1,579,400 $3,450,000 $2,044,400 Minimum $768,400 $307,200 $0 $1,420,800 $0 Maximum
- 7. $6,024,000 $6,191,700 $11,693,700 $5,840,600 $4,468,300 Range $5,255,600 $5,884,500 $11,693,700 $4,419,800 $4,468,300 Count 69 27 26 5 34 1st Quartile $1,452,500 $1,716,700 $856,700 $2,035,300 $1,678,000 3rd Quartile $3,760,300 $4,420,000 $2,469,600 $3,851,400 $2,913,700 Interquartile Range $2,307,800 $2,703,300 $1,612,900 $1,816,100 $1,235,700 1.00%
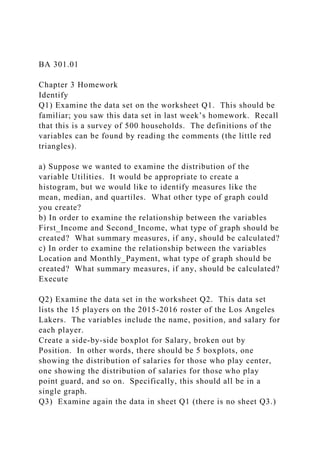
- 9. Q6) Interpret the graph shown below. What can you conclude about the relationship between these two variables? This is from the data set shown in sheet Q2. Scatterplot of Debt vs Monthly_Payment of Data Set #1 0 1000 2000 3000 4000 5000 6000 7000 8000 9000 10000 05001000150020002500 Monthly_Payment / Data Set #1 Debt / Data Set #1 StatTools Student Version For Academic Use Only StatTools Student Version For Academic Use Only StatTools Student Version For Academic Use Only StatTools Student Version For Academic Use Only StatTools Student Version
- 10. For Academic Use Only StatTools Student Version For Academic Use Only StatTools Student Version For Academic Use Only StatTools Student Version For Academic Use Only StatTools Student Version For Academic Use Only StatTools Student Version For Academic Use Only Correlation: 0.605 _1469430579.xls Chart125830002168200150000011214003029400214920026887 00157940034500002044400173350012917001022600900000186 81001452500171670085670020353001678000173350012917001 02260090000018681001452500171670085670020353001678000 79240095000000365300768400307200014208000173350012917 00102260090000018681001452500171670085670020353001678 00017335001291700102260090000018681001452500171670085 67002035300167800030020003737800322830036000004281500 37603004420000246960038514002913700300200037378003228 30036000004281500376030044200002469600385140029137004 61280056000006464000600000068250006024000619170048733 00584060044683003002000373780032283003600000428150037 60300442000024696003851400291370030020003737800322830 03600000428150037603004420000246960038514002913700258 30002168200150000011214003029400214920026887001579400 34500002044400258300021682001500000112140030294002149 20026887001579400345000020444002483328.57142857278712 6.08695652298703623427343292771.428571432648446.376811 593010437.037037042283269.2307692333196202261055.88235 29471727374757677787977172737475767778797717273747576 77787977172737475767778797717273747576777879771727374
- 13. 77879771727374757677787977172737475767778797717273747 57677787977172737475767778797717273747576777879771727 37475767778797717273747576777879771727374757677787977 17273747576777879771727374757677787977172737475767778 79771727374757677787977172737475767778797717273747576 77787977172737475767778797717273747576777879771727374 75767778797717273747576777879771727374757677787977172 73747576777879771727374757677787977172737475767778797 71727374757677787977172737475767778797717273747576777 87977172737475767778797717273747576777879771727374757 67778797717273747576777879771727374757677787977172737 47576777879771727374757677787977172737475767778797717 27374757677787977172737475767778797717273747576777879 77172737475767778797717273747576777879771727374757677 78797717273747576777879771727374757677787977172737475 76777879771727374757677787977172737475767778797717273 74757677787977172737475767778797717273747576777879771 72737475767778797717273747576777879771727374757677787 97717273747576777879771727374757677787977172737475767 778797 Box-Whisker Plot of Comparison of Comp 08 / Data Set #1 Company Type = Basic Materials Company Type = Consumer Goods Company Type = Consumer Services Company Type = Financials Company Type = Health Care Company Type = Industrials Company Type = Oil & Gas Company Type = Technology Company Type = Telecommunications Company Type = Utilities 4 14 24 34 44
- 18. 77 27 27 Source Wall Street Journal The Wall Street Journal CEO Compensation Study analyzed CEO pay from the first 200 U. S. companies with fiscal year 2008 revenue of at least $5 billion that filed their proxy statements between October 2008 and March 2009. DataCompany NameCompany TypeExecutive_NameSalary 2008Bonus 2008Comp 083MIndustrialsBuckley, George W.$1,720,000$2,644,100$4,364,100Abbott LabsHealth CareWhite, Miles D.$1,795,500$4,200,000$5,995,500Advance Auto PartsConsumer ServicesJackson, Darren R.$800,000$1,959,900$2,759,900Advanced Micro DevicesTechnologyMeyer, Derrick R.$856,700$0$856,700Aecom TechnologyIndustrialsDionisio, John M.$956,500$2,000,000$2,956,500AESUtilitiesHanrahan, Paul$999,000$1,756,200$2,755,200Affiliated ComputerIndustrialsBlodgett, Lynn$750,000$725,600$1,475,600AflacFinancialsAmos, Daniel P.$1,338,200$0$1,338,200AGCOIndustrialsRichenhagen, Martin H.$1,024,800$1,124,400$2,149,200Agilent TechnologiesIndustrialsSullivan, William P.$986,700$1,305,600$2,292,300AIGFinancialsLiddy, Edward M.$0$0$0Air ProductsBasic MaterialsJones, John P.$1,000,000$2,002,000$3,002,000AlcoaBasic MaterialsKleinfeld, Klaus$1,400,000$1,884,000$3,284,000Allegheny TechnologiesBasic MaterialsHassey, L. Patrick$907,900$2,149,900$3,057,800AllstateFinancialsWilson II, Thomas J.$1,040,800$151,700$1,192,500Alon USA EnergyOil & GasMorris, Jeff D.$307,200$0$307,200Altria GroupConsumer GoodsSzymanczyk, Michael E.$1,200,000$2,800,000$4,000,000Amazon.comConsumer
- 19. ServicesBezos, Jeffrey P.$81,800$0$81,800AmerenUtilitiesRainwater, Gary L.$935,000$771,700$1,706,700American Electric PowerUtilitiesMorris, Michael G.$1,259,600$1,654,100$2,913,700American ExpressFinancialsChenault, Kenneth I.$1,250,000$0$1,250,000Ameriprise FinancialFinancialsCracchiolo, James M.$850,000$0$850,000AmerisourceBergenConsumer ServicesYost, R. David$1,182,100$1,369,500$2,551,600AmgenHealth CareSharer, Kevin W.$1,561,900$3,875,000$5,436,900AMRConsumer ServicesArpey, Gerard J.$666,300$200$666,500Anadarko PetroleumOil & GasHackett, James T.$1,510,400$3,416,500$4,926,900Anixter InternationalIndustrialsEck, Robert J.$549,600$218,800$768,400AonFinancialsCase, Gregory C.$1,500,000$1,772,000$3,272,000ApacheOil & GasFarris, G. Steven$1,493,800$500,000$1,993,800Apple ComputerTechnologyJobs, Steven P.$0$0$0Applied MaterialsTechnologySplinter, Michael R.$929,400$650,000$1,579,400Arrow ElectronicsIndustrialsMitchell, William E.$1,100,000$975,000$2,075,000ArvinMeritorConsumer GoodsMcClure Jr., Charles G.$1,120,800$1,598,500$2,719,300AshlandBasic MaterialsO'Brien, James J.$1,110,900$445,400$1,556,300AssurantFinancialsPollock, Robert B.$950,000$1,638,800$2,588,800AT & TTelecommunicationsStephenson, Randall L.$1,420,800$0$1,420,800Atmos EnergyUtilitiesBest, Robert W.$820,400$835,200$1,655,600AutoNationConsumer ServicesJackson, Mike$1,150,000$0$1,150,000AutoZoneConsumer ServicesRhodes III, William
- 20. C.$706,000$779,400$1,485,400Avery DennisonBasic MaterialsScarborough, Dean A.$945,000$220,000$1,165,000Avis Budget GroupConsumer ServicesNelson, Ronald L.$1,000,000$0$1,000,000AvonConsumer GoodsJung, Andrea$1,375,000$1,689,400$3,064,400Baker HughesOil & GasDeaton, Chad C.$1,155,000$1,296,200$2,451,200BallIndustrialsHoover, R. David$1,100,000$922,800$2,022,800Bank of AmericaFinancialsLewis, Kenneth D.$1,500,000$0$1,500,000Bank of New York MellonFinancialsKelly, Robert P.$993,800$0$993,800Barnes & NobleConsumer ServicesRiggio, Stephen$800,000$1,961,500$2,761,500BaxterHealth CareParkinson Jr., Robert L.$1,339,300$2,708,900$4,048,200BB & TFinancialsAllison IV, John A.$993,700$0$993,700Becton DickinsonHealth CareLudwig, Edward J.$1,059,800$1,526,200$2,586,000Bed Bath & BeyondConsumer ServicesTemares, Steven H.$1,468,300$0$1,468,300Berkshire HathawayFinancialsBuffett, Warren E.$100,000$0$100,000Best BuyConsumer ServicesAnderson, Bradbury H.$1,247,300$0$1,247,300BJ ServicesOil & GasStewart, J.W.$1,141,700$575,000$1,716,700BJ's Wholesale ClubConsumer ServicesZarkin, Herbert J.$975,000$0$975,000Black & DeckerConsumer GoodsArchibald, Nolan D.$1,500,000$1,875,000$3,375,000BlackrockFinancialsFink, Laurence D.$500,000$17,149,500$17,649,500BlockbusterConsumer ServicesKeyes, James W.$750,000$402,500$1,152,500BoeingIndustrialsMcNerney Jr., W. James$1,915,300$1,476,500$3,391,800BorgWarnerConsumer GoodsManganello, Timothy M.$1,100,000$0$1,100,000Boston ScientificHealth CareTobin, James
- 21. R.$989,600$885,700$1,875,300Bristol-Myers SquibbHealth CareCornelius, James M.$1,488,100$4,475,000$5,963,100Burlington NorthernIndustrialsRose, Matthew K.$1,183,600$1,679,500$2,863,100C H RobinsonIndustrialsWiehoff, John P.$400,000$1,314,200$1,714,200CalpineUtilitiesFusco, Jack A.$396,200$896,200$1,292,400Cameron InternationalOil & GasMoore, Jack B.$745,400$903,000$1,648,400Campbell SoupConsumer GoodsConant, Douglas R.$1,177,500$1,866,400$3,043,900Capital One FinancialFinancialsFairbank, Richard D.$0$0$0CarmaxConsumer ServicesFolliard, Thomas J.$846,200$0$846,200CaterpillarIndustrialsOwens, James W.$1,550,000$1,853,200$3,403,200CB Richard Ellis GroupFinancialsWhite, Brett$850,000$0$850,000CBSConsumer ServicesMoonves, Leslie$3,513,500$11,000,000$14,513,500CC Media HoldingsFinancialsMays, Mark P.$895,000$4,500,000$5,395,000CelaneseBasic MaterialsWeidman, David N.$900,000$755,700$1,655,700CenterPoint EnergyUtilitiesMcClanahan, David M.$1,052,500$1,578,800$2,631,300ChevronOil & GasO'Reilly, David J.$1,650,000$4,161,000$5,811,000ChubbFinancialsFinnegan, John D.$1,275,000$3,357,800$4,632,800CignaHealth CareHanway, H. Edward$1,142,900$0$1,142,900CIT GroupFinancialsPeek, Jeffrey M.$800,000$0$800,000CitigroupFinancialsPandit, Vikram S.$958,300$0$958,300CloroxConsumer GoodsKnauss, Donald R.$987,500$1,380,000$2,367,500CMS EnergyUtilitiesJoos, David W.$1,045,000$971,900$2,016,900CNA FinancialFinancialsLillienthal, Stephen W.$950,000$2,900,000$3,850,000Coca-Cola Co.Consumer GoodsKent, Muhtar$1,100,000$4,500,000$5,600,000Coca-Cola EnterprisesConsumer GoodsBrock, John
- 22. F.$1,144,000$147,300$1,291,300Colgate-PalmoliveConsumer GoodsCook, Ian M.$1,075,000$3,162,500$4,237,500ComcastConsumer ServicesRoberts, Brian L.$2,769,400$7,394,200$10,163,600Commercial MetalsBasic MaterialsMcClean, Murray R.$600,000$1,911,200$2,511,200Community Health SystemsHealth CareSmith, Wayne T.$1,080,000$2,071,400$3,151,400Computer SciencesTechnologyLaphen, Michael W.$1,057,700$2,142,400$3,200,100Con EdisonUtilitiesBurke, Kevin$1,102,500$1,066,100$2,168,600Conagra FoodsConsumer GoodsRodkin, Gary$1,019,200$1,100,000$2,119,200ConocoPhillipsOil & GasMulva, James J.$1,500,000$1,417,500$2,917,500Constellation EnergyUtilitiesShattuck III, Mayo A.$1,290,400$0$1,290,400Continental AirlinesConsumer ServicesKellner, Lawrence W.$296,900$0$296,900Con-Way IncIndustrialsStotlar, Douglas W.$700,400$245,500$945,900CorningTechnologyWeeks, Wendell P.$1,030,000$301,600$1,331,600CostcoConsumer ServicesSinegal, James D.$350,000$80,000$430,000Coventry Health CareHealth CareWolf, Dale B.$965,000$0$965,000Crown HoldingsIndustrialsConway, John W.$1,075,000$3,560,400$4,635,400CSXIndustrialsWard, Michael J.$1,058,300$2,032,000$3,090,300CumminsIndustrialsSolso, Theodore M.$1,210,000$1,064,800$2,274,800CVR EnergyOil & GasLipinski, John J.$700,000$1,700,000$2,400,000CVS CaremarkConsumer ServicesRyan, Thomas M.$1,400,000$2,350,000$3,750,000Dana HoldingConsumer GoodsConvis, Gary L.$850,000$1,515,400$2,365,400DanaherIndustrialsCulp Jr., H. Lawrence$1,100,000$3,267,300$4,367,300DavitaHealth CareThiry, Kent J.$1,023,100$2,000,000$3,023,100Dean
- 23. FoodsConsumer GoodsEngles, Gregg L.$1,300,000$2,350,900$3,650,900DeereIndustrialsLane, Robert W.$1,435,500$3,588,900$5,024,400DellTechnologyDell, Michael S.$931,700$0$931,700Devon EnergyOil & GasNichols, J. Larry$1,400,000$3,000,600$4,400,600DillardsConsumer ServicesDillard, II, William$810,000$196,300$1,006,300DirecTV GroupConsumer ServicesCarey, Chase$2,291,600$3,500,000$5,791,600Discover FinancialFinancialsNelms, David W.$1,000,000$4,750,000$5,750,000Dish NetworkConsumer ServicesErgen, Charles W.$600,000$0$600,000Disney (Walt)Consumer ServicesIger, Robert A.$2,000,000$13,945,500$15,945,500Dominion ResourcesUtilitiesFarrell ll, Thomas F.$1,191,700$2,355,000$3,546,700Donnelley (R R) & SonsIndustrialsQuinlan, Thomas J.$985,600$0$985,600DoverIndustrialsLivingston, Robert A.$767,500$1,000,000$1,767,500Dow ChemicalBasic MaterialsLiveris, Andrew$1,641,700$0$1,641,700Dr Pepper Snapple GroupConsumer GoodsYoung, Larry D.$867,300$1,643,200$2,510,500DTE EnergyUtilitiesEarley Jr., Anthony F.$1,186,500$1,500,000$2,686,500Du PontBasic MaterialsHolliday Jr., Charles O.$1,369,500$1,732,000$3,101,500Duke EnergyUtilitiesRogers, James E.$0$0$0Eastman ChemicalBasic MaterialsFerguson, J. Brian$1,131,200$925,000$2,056,200Eastman KodakConsumer GoodsPerez, Antonio M.$1,096,200$0$1,096,200EatonIndustrialsCutler, Alexander M.$1,132,500$320,000$1,452,500EbayConsumer ServicesDonahoe, John J.5$879,800$500,000$1,379,800EcolabBasic MaterialsBaker Jr., Douglas M.$1,000,000$1,397,000$2,397,000Edison InternationalUtilitiesCraver Jr., Theodore F.$892,500$1,050,000$1,942,500El PasoOil & GasFoshee, Douglas L.$1,037,500$1,186,400$2,223,900EMCTechnologyTucci,
- 24. Joseph M.$1,000,000$1,388,600$2,388,600Emcor GroupIndustrialsMacInnis, Frank T.$950,000$2,585,000$3,535,000Emerson ElectricIndustrialsFarr, David N.$1,200,000$3,000,000$4,200,000EntergyUtilitiesLeonard, J. Wanye$1,273,500$2,169,700$3,443,200EOG ResourcesOil & GasPapa, Mark G.$940,000$2,000,000$2,940,000Estee LauderConsumer GoodsLauder, William P.$1,500,000$3,074,500$4,574,500ExelonUtilitiesRowe, John W.$1,474,400$1,835,200$3,309,600Expeditors InternationalIndustrialsRose, Peter J.$110,000$5,815,800$5,925,800Express ScriptsHealth CarePaz, George$941,800$2,450,500$3,392,300Exxon MobilOil & GasTillerson, Rex W.$1,870,000$4,000,000$5,870,000Family DollarConsumer ServicesLevine, Howard R.$878,500$533,200$1,411,700Federal-MogulConsumer GoodsMaria Alapont, Jose$1,500,000$3,075,000$4,575,000Fifth Third BancorpFinancialsKabat, Kevin T.$900,000$0$900,000FirstenergyUtilitiesAlexander, Anthony J.$1,329,400$2,305,400$3,634,800FluorIndustrialsBoeckmann, Alan L.$1,232,300$3,073,200$4,305,500Foot LockerConsumer ServicesSerra, Matthew D.$1,500,000$1,728,300$3,228,300Ford MotorConsumer GoodsMulally, Alan$2,000,000$0$2,000,000Fortune BrandsIndustrialsCarbonari, Bruce A.$1,100,000$0$1,100,000FPL GroupUtilitiesHay, III, Lewis$1,255,800$2,400,000$3,655,800Franklin ResourcesFinancialsJohnson, Gregory E.$780,100$4,500,000$5,280,100Frontier OilOil & GasGibbs, James R.$975,000$780,000$1,755,000GamestopConsumer ServicesDeMatteo, Daniel A.$1,035,400$2,400,000$3,435,400GannettConsumer ServicesDubow, Craig A.$1,166,700$875,000$2,041,700GapConsumer ServicesMurphy, Glenn K.$1,500,000$3,016,400$4,516,400General
- 25. CableIndustrialsKenny, Gregory B.$823,300$844,000$1,667,300General DynamicsIndustrialsChabraja, Nicholas D.$1,375,000$4,500,000$5,875,000General ElectricIndustrialsImmelt, Jeffery R.$3,300,000$0$3,300,000General MillsConsumer GoodsPowell, Kendall J.$959,600$2,638,800$3,598,400Genuine PartsConsumer GoodsGallagher, Thomas C.$875,000$866,700$1,741,700Genworth FinancialFinancialsFraizer, Michael D.$1,121,400$0$1,121,400Gilead SciencesHealth CareMartin, John C.$1,146,300$1,651,700$2,798,000Goldman Sachs GroupFinancialsBlankfein, Lloyd C.$600,000$0$600,000GoodrichIndustrialsLarsen, Marshall$1,100,000$2,173,600$3,273,600GoodyearConsumer GoodsKeegan, Robert J.$1,216,700$0$1,216,700GoogleTechnologySchmidt, Eric$0$0$0Grainger (W.W.)IndustrialsRyan, James T.$787,500$631,100$1,418,600Great Atlantic & Pacific TeaConsumer ServicesClaus, Eric$800,000$432,000$1,232,000Group 1 AutomotiveConsumer ServicesHesterberg, Earl J.$1,000,000$200,000$1,200,000HalliburtonOil & GasLesar, David J.$1,300,000$3,120,000$4,420,000Harley- DavidsonConsumer GoodsZiemer, James L.$980,700$450,300$1,431,000Hartford Financial ServicesFinancialsAyer, Ramani$1,150,000$0$1,150,000Health NetHealth CareGellert, Jay M.$1,204,600$0$1,204,600Heinz (H J)Consumer GoodsJohnson, William R.$1,245,200$3,650,000$4,895,200HersheyConsumer GoodsWest, David J.$1,000,000$1,128,400$2,128,400Hertz Global HoldingsConsumer ServicesFrissora, Mark P.$1,094,700$600,900$1,695,600HessOil & GasHess, John B.$1,500,000$3,500,000$5,000,000Hewlett- PackardTechnologyHurd, Mark V.$1,450,000$10,243,700$11,693,700Holly CorpOil &
- 26. GasClifton, Matthew P.$849,800$608,000$1,457,800Home DepotConsumer ServicesBlake, Francis S.$1,013,500$0$1,013,500Honeywell InternationalIndustrialsCote, David M.$1,826,000$3,500,000$5,326,000Hormel FoodsConsumer GoodsEttinger, Jeffrey M.$912,100$1,343,700$2,255,800Horton (D.R.)Consumer GoodsTomnitz, Donald J.$300,000$1,848,500$2,148,500Host Hotels & ResortsFinancialsWalter, W. Edward$750,000$467,600$1,217,600HumanaHealth CareMcCallister, Michael B.$1,017,300$0$1,017,300IBMTechnologyPalmisano, Samuel J.$1,800,000$5,500,000$7,300,000Illinois Tool WorksIndustrialsSpeer, David B.$1,099,600$1,586,200$2,685,800Ingram MicroTechnologySpierkel, Gregory M.E.$850,000$0$850,000Integrys Energy GroupUtilitiesWeyers, Larry L.$1,050,000$684,100$1,734,100IntelTechnologyOtellini, Paul S.$1,000,000$3,873,300$4,873,300International Assets HoldingFinancialsO'Connor, Sean M.$175,000$750,000$925,000International PaperBasic MaterialsV Faraci, John$1,261,400$1,575,000$2,836,400Interpublic Group of CompaniesConsumer ServicesRoth, Michael I.$1,332,500$2,500,000$3,832,500ITTIndustrialsLoranger, Steven R.$1,119,600$2,534,000$3,653,600Jabil CircuitIndustrialsMain, Timothy L.$1,000,000$155,900$1,155,900Jacobs EngineeringIndustrialsMartin, Craig L.$1,084,600$1,301,700$2,386,300JCPenneyConsumer ServicesUllman III, Myron E.$1,500,000$1,406,300$2,906,300Johnson & JohnsonHealth CareWeldon, William C.$1,792,000$3,700,000$5,492,000Johnson ControlsConsumer GoodsRoell, Stephen
- 27. A.$1,325,000$3,492,600$4,817,600JPMorgan ChaseFinancialsDimon, James$1,000,000$0$1,000,000KBRIndustrialsUtt, William P.$900,000$1,100,000$2,000,000KelloggConsumer GoodsMackay, David$1,136,500$2,601,300$3,737,800Kelly ServicesIndustrialsCamden, Carl T.$917,500$0$917,500KeyCorpFinancialsMeyer III, Henry L.$1,019,500$0$1,019,500Kimberly-ClarkConsumer GoodsFalk, Thomas J.$1,225,000$943,200$2,168,200Kohl'sConsumer ServicesMansell, Kevin$1,067,500$0$1,067,500Kraft FoodsConsumer GoodsRosenfeld, Irene$1,452,200$4,070,000$5,522,200KrogerConsumer ServicesDillon, David B.$1,204,800$1,574,200$2,779,000L-3 CommunicationsIndustrialsStrianese, Michael T.$1,145,400$2,750,000$3,895,400LearConsumer GoodsRossiter, Robert E.$1,237,000$0$1,237,000Liberty GlobalConsumer ServicesFries, Michael T.$957,000$1,600,000$2,557,000Liberty MediaConsumer ServicesMaffei, Gregory B.$1,000,000$5,464,000$6,464,000Lilly (Eli)Health CareLechleiter, John C.$1,339,100$2,709,100$4,048,200Lincoln NationalFinancialsGlass, Dennis R.$1,000,000$800,000$1,800,000Lockheed MartinIndustrialsStevens, Robert J.$1,774,000$4,250,000$6,024,000LoewsFinancialsTisch, James S.$1,100,000$2,500,000$3,600,000Lowe'sConsumer ServicesNiblock, Robert A.$1,100,000$1,500,800$2,600,800LubrizolBasic MaterialsHambrick, James L.$933,500$800,000$1,733,500Macy'sConsumer ServicesLundgren, Terry J.$1,500,000$900,000$2,400,000ManpowerIndustrialsJoerres, Jeffrey A.$1,000,000$300,000$1,300,000Marathon OilOil & GasCazalot Jr., Clarence P.$1,381,300$1,700,000$3,081,300Marriott
- 28. InternationalConsumer ServicesMarriott, Jr., J. Willard$1,253,700$904,700$2,158,400Marsh & McLennanFinancialsDuperreault, Brian$927,100$3,000,000$3,927,100MascoIndustrialsWadhams, Timothy$934,600$0$934,600MattelConsumer GoodsEckert, Robert A.$1,250,000$0$1,250,000McDonald'sConsumer ServicesSkinner, James A.$1,337,500$4,600,000$5,937,500McGraw-HillConsumer ServicesMcGraw III, Harold$1,350,000$0$1,350,000MDU ResourcesIndustrialsHildestad, Terry D.$700,000$310,800$1,010,800MeadWestvacoIndustrialsLuke Jr., John A.$1,055,900$0$1,055,900Medco Health Solution sHealth CareSnow Jr., David B.$1,281,500$3,000,000$4,281,500MerckHealth CareClark, Richard T.$1,783,300$2,244,500$4,027,800MetLifeFinancialsHenrikson , C. Robert$1,000,000$3,250,000$4,250,000MGM MirageConsumer ServicesMurren, James J.$1,500,000$0$1,500,000Micron TechnologyTechnologyAppleton, Steven R.$950,000$0$950,000Mohawk IndustriesConsumer GoodsLorberbaum, Jeffrey S.$980,000$300,000$1,280,000MonsantoBasic MaterialsGrant, Hugh$1,286,000$3,326,800$4,612,800Morgan StanleyFinancialsMack, John
- 29. J.$800,000$0$800,000MotorolaTechnologyBrown, Gregory Q.$1,200,000$0$1,200,000MotorolaTechnologyJha, Dr. Sanjay K.$484,600$0$484,600Murphy OilOil & GasDeming, Claiborne P.$1,241,700$2,000,000$3,241,700National Oilwell VarcoOil & GasMiller Jr., Merrill A.$950,000$1,826,000$2,776,000Navistar InternationalIndustrialsUstian, Daniel C.$1,170,800$2,589,500$3,760,300NCRTechnologyNuti, William$1,000,000$1,375,000$2,375,000Newell RubbermaidConsumer GoodsKetchum, Mark D.$1,291,700$0$1,291,700Newmont MiningBasic MaterialsO'Brien, Richard T.$1,000,000$1,894,400$2,894,400News Corp.Consumer ServicesMurdoch, K. Rupert$8,100,000$5,435,000$13,535,000NisourceUtilitiesSkagg s, Jr., Robert C.$791,700$0$791,700NordstromConsumer ServicesNordstrom, Blake W.$696,100$0$696,100Norfolk SouthernIndustrialsMoorman IV, Charles W.$950,000$1,759,400$2,709,400Northeast UtilitiesUtilitiesShivery, Charles W.$1,067,400$1,519,100$2,586,500Northern TrustFinancialsWaddell, Frederick H.$856,300$0$856,300Northrop GrummanIndustrialsSugar, Ronald D.$1,525,000$2,775,500$4,300,500NucorBasic MaterialsDiMicco, Daniel R.$800,000$2,160,000$2,960,000OccidentalOil & GasIrani, Ray
- 30. R.$1,300,000$3,630,000$4,930,000Office DepotConsumer ServicesOdland, Steve$1,000,000$0$1,000,000OfficeMaxConsumer ServicesDuncan, Sam K.$1,022,600$0$1,022,600OmnicareConsumer ServicesGemunder, Joel F.$1,816,700$5,125,000$6,941,700OmnicomConsumer ServicesWren, John D.$1,000,000$1,750,000$2,750,000OneokUtilitiesGibson, John W.$825,000$853,000$1,678,000OshKoshIndustrialsBohn, Robert G.$1,150,000$178,000$1,328,000Owens & MinorHealth CareSmith, Craig R.$788,100$1,080,000$1,868,100Owens- IllinoisIndustrialsStroucken, Albert P.L.$1,011,500$559,900$1,571,400PaccarIndustrialsPigott, Mark C.$1,348,800$0$1,348,800PantryConsumer ServicesSodini, Peter J.$800,000$352,600$1,152,600Penske AutomotiveConsumer ServicesPenske, Roger S.$1,000,000$0$1,000,000Pepco HoldingsUtilitiesWraase, Dennis R.$1,076,000$968,400$2,044,400Pepsi Bottling GroupConsumer GoodsFoss, Eric J.$984,600$840,000$1,824,600PepsiCoConsumer GoodsNooyi, Indra K.$1,300,000$2,600,000$3,900,000PfizerHealth CareKindler, Jeffrey B.$1,575,000$5,250,000$6,825,000PGUtilitiesDarbee, Peter A.$1,090,800$1,285,000$2,375,800Philip MorrisConsumer
- 31. GoodsCamilleri, Louis C.$1,567,300$9,450,000$11,017,300Pitney BowesTechnologyMartin, Murray D.$941,700$1,378,000$2,319,700PNC FinancialFinancialsRohr, James E.$1,000,000$3,000,000$4,000,000PPG IndustriesBasic MaterialsBunch, Charles E.$1,041,700$1,750,000$2,791,700PPLUtilitiesMiller, James H.$1,141,100$0$1,141,100PraxairBasic MaterialsAngel, Stephen F.$1,026,300$2,500,000$3,526,300Precision CastpartsIndustrialsDonegan, Mark$1,275,000$1,689,400$2,964,400Principal FinancialFinancialsZimpleman, Larry D.$737,500$0$737,500Progress EnergyUtilitiesJohnson, William D.$950,000$929,000$1,879,000ProgressiveFinancialsRenwick, Glenn M.$778,800$0$778,800PrologisFinancialsRakowich, Walter C.$630,000$420,000$1,050,000Prudential FinancialFinancialsStrangfeld, John R.$970,800$3,300,000$4,270,800PSEGUtilitiesIzzo, Ralph$944,300$1,000,000$1,944,300Publix Super MarketsConsumer ServicesCrenshaw, William E.$754,000$21,200$775,200Pulte HomesConsumer GoodsDugas, Jr., Richard J.$1,000,000$902,100$1,902,100QualcommTechnologyJacobs, Paul E.$1,112,200$2,909,000$4,021,200Quest
- 32. DiagnosticsHealth CareMohapatra, Surya N.$1,143,900$1,915,700$3,059,600QwestTelecommunicationsM ueller, Edward A.$1,200,000$2,250,000$3,450,000RaytheonIndustrialsSwanson , William H.$1,328,600$3,050,000$4,378,600Regions FinancialFinancialsRitter, C. Dowd$995,000$0$995,000Reliance Steel & AluminumBasic MaterialsHannah, David H.$700,000$1,883,000$2,583,000Reynolds AmericanConsumer GoodsIvey, Susan M.$1,252,800$1,730,000$2,982,800Rite AidConsumer ServicesSammons, Mary F.$1,000,000$0$1,000,000Rockwell AutomationIndustrialsNosbusch, Keith D.$1,030,800$561,600$1,592,400Ross StoresConsumer ServicesBalmuth, Michael$998,500$1,721,400$2,719,900RRI EnergyUtilitiesJacobs, Mark M.$895,000$600$895,600Ryder SystemIndustrialsSwienton, Gregory T.$895,000$567,600$1,462,600SafewayConsumer ServicesBurd, Steven A.$1,467,400$399,900$1,867,300SAICTechnologyDahlberg, Kenneth C.$1,000,000$1,469,600$2,469,600Sanmina- SCIIndustrialsSola, Jure$800,000$440,000$1,240,000ScanaUtilitiesTimmerman, William B.$1,095,000$653,900$1,748,900Schering- PloughHealth CareHassan,
- 33. Fred$1,720,300$3,387,200$5,107,500Schwab (Charles)FinancialsBettinger II, Walter W.$793,800$1,938,000$2,731,800SearsConsumer ServicesJohnson, W. Bruce$896,500$0$896,500Sempra EnergyUtilitiesFelsinger, Donald E.$1,144,000$2,530,000$3,674,000Shaw GroupIndustrialsBernhard Jr., James M.$1,735,400$264,000$1,999,400Sherwin- WilliamsIndustrialsConnor, Christopher M.$1,214,600$0$1,214,600SLM CorpFinancialsLord, Albert L.$1,478,800$0$1,478,800Smith InternationalOil & GasRock, Doug$1,347,100$1,341,600$2,688,700Smithfield FoodsConsumer GoodsPope, C. Larry$1,100,000$0$1,100,000Sonic AutomotiveConsumer ServicesSmith, O. Bruton$1,100,000$330,000$1,430,000SouthernUtilitiesRatcliffe , David M.$1,118,100$1,682,900$2,801,000Southwest AirlinesConsumer ServicesKelly, Gary C.$441,100$462,000$903,100Spectra EnergyUtilitiesFowler, Fred J.$1,010,000$1,184,100$2,194,100Sprint NextelTelecommunicationsHesse, Daniel R.$1,200,000$2,651,400$3,851,400SPXIndustrialsKearney, Christopher J.$1,050,000$2,730,000$3,780,000StaplesConsumer ServicesSargent, Ronald l.$1,112,000$0$1,112,000StarbucksConsumer ServicesSchultz,
- 34. Howard$1,190,000$0$1,190,000Starwood Hotels & ResortsConsumer ServicesVan Paasschen, Frits$1,000,000$1,820,000$2,820,000State StreetFinancialsLogue, Ronald E.$1,000,000$0$1,000,000StrykerHealth CareMacMillan, Stephen P.$1,200,000$617,300$1,817,300SunocoOil & GasElsenhans, Lynn L.$515,100$794,000$1,309,100SuntrustFinancialsWells III, James M.$1,077,300$0$1,077,300SupervaluConsumer ServicesNoodle, Jeffrey$1,163,800$0$1,163,800SymantecTechnologyThompson, John W.$800,000$1,530,000$2,330,000SynnexTechnologyMurai, Kevin 5$261,500$900,000$1,161,500SyscoConsumer ServicesSchnieders, Richard J.$1,146,500$4,764,900$5,911,400TECH DATATechnologyDutkowsky, Robert$948,500$727,300$1,675,800Tenet HealthcareHealth CareFetter, Trevor$1,081,000$1,351,300$2,432,300TennecoConsumer GoodsSherrill, Gregg M.$950,000$0$950,000TerexIndustrialsDeFeo, Ronald M.$1,150,000$0$1,150,000TesoroOil & GasSmith, Bruce A.$1,298,600$0$1,298,600Texas InstrumentsTechnologyTempleton, Richard
- 35. K.$960,800$1,564,900$2,525,700TextronIndustrialsCampbell, Lewis B.$1,100,000$618,000$1,718,000Thermo Fisher ScientificHealth CareDekkers, Marijn E.$1,163,800$1,865,600$3,029,400Time WarnerConsumer ServicesBewkes, Jeffrey L.$1,750,000$7,600,000$9,350,000Time Warner CableConsumer ServicesBritt, Glenn A.$1,000,000$4,975,000$5,975,000TimkenIndustrialsGriffith, James W.$1,018,800$1,049,100$2,067,900Tjx CompaniesConsumer ServicesMeyrowitz, Carol$1,503,400$1,095,800$2,599,200TravelCenters of AmericaConsumer ServicesO'Brien, Thomas M.$300,000$1,000,000$1,300,000TravelersFinancialsFishman, Jay S.$1,000,000$5,000,000$6,000,000TRW Automotive HoldingsConsumer GoodsPlant, John C.$1,673,300$2,520,000$4,193,300Tyson FoodsConsumer GoodsBond, Richard L.$1,251,200$0$1,251,200U.S. BancorpFinancialsDavis, Richard K.$900,000$0$900,000U.S. SteelUtilitiesSurma, John P.$1,218,300$3,250,000$4,468,300UALConsumer ServicesTilton, Glenn$850,000$695,600$1,545,600UGIBasic MaterialsGreenberg, Lon R.$1,026,300$964,700$1,991,000Union PacificIndustrialsYoung, James R.$1,141,700$3,000,000$4,141,700UNISYSTechnologyColeman
- 36. , J. Edward$233,000$303,800$536,800United TechnologiesIndustrialsChenevert, Louis$1,319,000$3,000,000$4,319,000UnitedHealthHealth CareHemsley, Stephen J.$1,300,000$1,218,800$2,518,800Universal HealthHealth CareMiller, Alan B.$1,350,100$3,375,100$4,725,200Unum GroupFinancialsWatjen, Thomas R.$1,094,900$2,268,800$3,363,700UPSIndustrialsDavis, D. Scott$960,000$312,800$1,272,800URSIndustrialsKoffel, Martin M.$1,019,200$2,500,000$3,519,200US AirwaysConsumer ServicesParker, W. Douglas$550,000$550,000$1,100,000Valero EnergyOil & GasKlesse, William R.$1,500,000$705,500$2,205,500VerizonTelecommunicationsSe idenberg, Ivan G.$2,100,000$3,740,600$5,840,600VFConsumer GoodsWiseman, Eric C.$950,000$760,000$1,710,000ViacomConsumer ServicesDauman, Philippe P.$2,500,000$7,885,000$10,385,000Virgin MediaTelecommunicationsBerkett, Neil A.$957,400$1,077,900$2,035,300VisaFinancialsSaunders, Joseph W.$950,000$4,512,500$5,462,500VisteonConsumer GoodsStebbins, Donald J.$1,076,200$207,000$1,283,200WalgreenConsumer ServicesRein, Jeffrey A.$1,200,000$603,900$1,803,900Wal- MartConsumer ServicesScott, Jr., H.
- 37. Lee$1,456,000$5,824,000$7,280,000Waste ManagementIndustrialsSteiner, David P.$1,066,000$1,050,900$2,116,900Wellcare Health PlansHealth CareSchiesser, Heath G.$365,300$0$365,300Wells FargoFinancialsStumpf, John G.$878,900$0$878,900WESCOIndustrialsHaley, Roy W.$854,200$775,000$1,629,200Western RefiningOil & GasFoster, Paul L.$726,800$592,400$1,319,200Western UnionIndustrialsGold, Christina A.$966,700$1,105,700$2,072,400WeyerhaeuserBasic MaterialsFulton, Daniel S.$792,400$0$792,400WhirlpoolConsumer GoodsFettig, Jeff M.$1,262,500$420,000$1,682,500Whole Foods MarketConsumer ServicesMackey, John P.$0$0$0WilliamsUtilitiesMalcolm, Steven J.$1,094,200$2,000,000$3,094,200World Fuel ServicesIndustrialsStebbins, Paul H.$575,000$3,543,800$4,118,800Xcel EnergyUtilitiesKelly, Richard C.$1,175,000$0$1,175,000XEROXTechnologyMulcahy, Anne$1,320,000$990,000$2,310,000XTO EnergyOil & GasHutton, Keith A.$941,700$5,250,000$6,191,700YAHOOTechnologyYang, Jerry$0$0$0Yum BrandsConsumer ServicesNovak, David C.$1,393,800$4,057,200$5,451,000 Name of CEO as it appears in the company proxy statement.
- 38. Base salary earned in fiscal 2008. Annual bonus earned in fiscal 2008. _STDS_DG2829CE0BNameData Set #1StatTools Version that generated sheet, Major6StatTools Version that generated sheet, Minor0StatTools Version that generated sheet, Revision1Min. StatTools Version to Read Sheet, Major (note ST versions before 1.1.1 don't perform forward compatibility check)1Min. StatTools Version to Read Sheet, Minor0Min. StatTools Version to Read Sheet, Revision0Min. StatTools version to not put up warning about extra info, Major1Min. StatTools version to not put up warning about extra info, Minor0Min. StatTools version to not put up warning about extra info, Revision0GUIDDG2829CE0BFormat Range0Variable LayoutColumnsVariable Names In CellsVariable Names In 2nd CellsData Set RangesUtilitiesData Sheet Format1Formula Eval Cell1Num Stored Vars61 : InfoVG2B2FCDD02781A762var1ST_CompanyName041 : RangesAir Products1 : MultiRefs2 : InfoVG1E3AAAE737AF7903var2ST_CompanyType042 : RangesFinancials2 : MultiRefs3 : InfoVG3939548E17C706B0var3ST_ExecutiveName043 : RangesBezos, Jeffrey P.3 : MultiRefs4 : InfoVGD2B64E3107B83E3var4ST_Salary2008044 : Ranges12500004 : MultiRefs5 : InfoVG2BA5B5FA37BB88D0var5ST_Bonus2008045 :
- 39. Ranges38750005 : MultiRefs6 : InfoVG122267D9C05837Cvar6ST_TotalCompensation2008046 : Ranges7684006 : MultiRefs One Var SummaryStatTools ReportAnalysis:One Variable SummaryPerformed By:MishkindDate:Monday, August 11, 2014Updating:LiveTotal Compensation 2008One Variable SummaryData Set #1Mean$2704943.04Std. Dev.$2226295.52Median$2149200.00Minimum$0.00Maximum$ 17649500.00Range$17649500.00Count3811st Quartile$1217600.003rd Quartile$3526300.00Interquartile Range$2308700.001.00%$0.002.50%$296900.005.00%$737500. 0095.00%$5963100.0097.50%$7300000.0099.00%$13535000.0 0 Box-Whisker PlotStatTools ReportAnalysis:Box-Whisker PlotPerformed By:MishkindDate:Monday, August 11, 2014Updating:LiveGraph Data2149200412176004121760070712176007121760010352630 01035263007694170073526300735263004214920042149200102 704943.0446194270707070707070707070707070707070707070 70707070707070707070707070707070707070707070707070707 07070707070707070707070707070707070707110173007116937 00713535000714513500715945500717649500707070707070707 07070707070707070707070707070707070707070707070707070 70707070707070707070707070707070707070707070707070707 07070707070707070707070707070707070707070707070707070
- 40. 70707070707070707070707070707070707070707070707070707 07070707070707070772800007730000079350000710163600710 38500070707070707070707070707070707070707070707070707 07070707070707070707070707070707070707070707070707070 7070707070707070707 Box-Whisker Plot Box-Whisker Plot of Total Compensation 2008 / Data Set #1 One Var Summary (2)StatTools ReportAnalysis:One Variable SummaryPerformed By:MishkindDate:Wednesday, August 13, 2014Updating:LiveTotal Compensation 2008 (Basic Materials)Total Compensation 2008 (Consumer Goods)Total Compensation 2008 (Consumer Services)Total Compensation 2008 (Financials)Total Compensation 2008 (Health Care)Total Compensation 2008 (Industrials)Total Compensation 2008 (Oil & Gas)Total Compensation 2008 (Technology)Total Compensation 2008 (Telecommunications)Total Compensation 2008 (Utilities)One Variable SummaryData Set #1Data Set #1Data Set #1Data Set #1Data Set #1Data Set #1Data Set #1Data Set #1Data Set #1Data Set #1Mean$2483328.57$2787126.09$2987036.00$2342734.00$329 2771.43$2648446.38$3010437.04$2283269.23$3319620.00$226 1055.88Std. Dev.$886447.58$1815163.90$3312398.75$2784995.57$1732318 .58$1415704.62$1618409.77$2515800.10$1725552.40$991095. 08Median$2583000.00$2168200.00$1500000.00$1121400.00$3
- 42. 700.00$5840600.00$4468300.0099.00%$4612800.00$11017300. 00$15945500.00$17649500.00$6825000.00$6024000.00$61917 00.00$11693700.00$5840600.00$4468300.00 One Var Summary (3)StatTools ReportAnalysis:One Variable SummaryPerformed By:MishkindDate:Wednesday, August 13, 2014Updating:LiveComp 2008 (Basic Materials)Comp 2008 (Consumer Goods)Comp 2008 (Consumer Services)Comp 2008 (Financials)Comp 2008 (Health Care)Comp 2008 (Industrials)Comp 2008 (Oil & Gas)Comp 2008 (Technology)Comp 2008 (Telecommunications)Comp 2008 (Utilities)One Variable SummaryData Set #1Data Set #1Data Set #1Data Set #1Data Set #1Data Set #1Data Set #1Data Set #1Data Set #1Data Set #1Mean2,483,3292,787,1262,987,0362,342,7343,292,7712,648, 4463,010,4372,283,2693,319,6202,261,056Std. Dev.886,4481,815,1643,312,3992,784,9961,732,3191,415,7051, 618,4102,515,8001,725,552991,095Median2,583,0002,168,2001 ,500,0001,121,4003,029,4002,149,2002,688,7001,579,4003,450, 0002,044,400Minimum792,400950,000- 0- 0365,300768,400307,200- 01,420,800- 0Maximum4,612,80011,017,30015,945,50017,649,5006,825,000 6,024,0006,191,70011,693,7005,840,6004,468,300Range3,820,4 0010,067,30015,945,50017,649,5006,459,7005,255,6005,884,50 011,693,7004,419,8004,468,300Count21467550286927265341st Quartile1,733,5001,291,7001,022,600900,0001,868,1001,452,50
- 43. 01,716,700856,7002,035,3001,678,0003rd Quartile3,002,0003,737,8003,228,3003,600,0004,281,5003,760, 3004,420,0002,469,6003,851,4002,913,700Interquartile Range1,268,5002,446,1002,205,7002,700,0002,413,4002,307,80 02,703,3001,612,9001,816,1001,235,7001.00%792,400950,000- 0- 0365,300768,400307,200- 01,420,800- 02.50%792,4001,096,20081,800- 0365,300917,500307,200- 01,420,800- 05.00%1,165,0001,100,000430,000100,000965,000945,9001,29 8,600- 01,420,800791,70095.00%3,526,3005,522,20010,385,0005,750, 0005,995,5005,326,0005,870,0007,300,0005,840,6003,674,0009 7.50%4,612,8005,600,00014,513,5006,000,0006,825,0005,925,8 006,191,70011,693,7005,840,6004,468,30099.00%4,612,80011, 017,30015,945,50017,649,5006,825,0006,024,0006,191,70011,6 93,7005,840,6004,468,300 One Var Summary (4)StatTools ReportAnalysis:One Variable SummaryPerformed By:MishkindDate:Wednesday, August 13, 2014Updating:LiveComp 08 (Basic Materials)Comp 08 (Consumer Goods)Comp 08 (Consumer Services)Comp 08 (Financials)Comp 08 (Health Care)Comp 08 (Industrials)Comp 08 (Oil & Gas)Comp 08 (Technology)Comp 08 (Telecommunications)Comp 08 (Utilities)One Variable SummaryData Set #1Data Set #1Data Set #1Data Set #1Data Set #1Data Set #1Data Set #1Data Set #1Data Set #1Data Set
- 45. 00,000$14,513,500$6,000,000$6,825,000$5,925,800$6,191,700 $11,693,700$5,840,600$4,468,30099.00%$4,612,800$11,017,30 0$15,945,500$17,649,500$6,825,000$6,024,000$6,191,700$11, 693,700$5,840,600$4,468,300 Box-Whisker Plot (2)StatTools ReportAnalysis:Box-Whisker PlotPerformed By:MishkindDate:Wednesday, August 13, 2014Updating:LiveGraph Data2583000421682001415000002411214003430294004421492 00542688700641579400743450000842044400941733500412917 00141022600249000003418681004414525005417167006485670 07420353008416780009417335007129170017102260027900000 37186810047145250057171670067856700772035300871678000 97792400795000017027037365300477684005730720067077142 08008709717335007129170017102260027900000371868100471 45250057171670067856700772035300871678000971733500101 29170020102260030900000401868100501452500601716700708 56700802035300901678000100300200010373780020322830030 36000004042815005037603006044200007024696008038514009 02913700100300200073737800173228300273600000374281500 47376030057442000067246960077385140087291370097461280 07560000017646400027600000037682500047602400057619170 06748733007758406008744683009730020007373780017322830 02736000003742815004737603005744200006724696007738514 00872913700973002000437378001432283002436000003442815 00443760300544420000642469600743851400842913700942583
- 52. Company Type = Basic Materials Company Type = Consumer Goods Company Type = Consumer Services Company Type = Financials Company Type = Health Care Company Type = Industrials Company Type = Oil & Gas Company Type = Technology Company Type = Telecommunications Company Type = Utilities