SlideShare a Scribd company logo
1 of 16
Download to read offline
July 2020 Monthly Snapshot
One-Year Change in One-Year Change in
Median Sales Price
Single Family
Median Sales Price
Condo/TIC/Coop
2
3
4
5
6
7
8
9
10
11
12
13
14
15
16
Current as of August 11, 2020. All data from the San Francisco MLS. Report © 2020 ShowingTime.
Condo/TIC/Coop Activity Overview
Inventory of Active Listings
% of Properties Sold Over List Price
% of List Price Received
Housing Affordability Ratio
All Properties Activity Overview
New Listings
Pending Sales
Sold Listings
Median Sales Price
Average Sales Price
Days on Market Until Sale
Activity by District
Monthly Indicators
+ 6.0% + 3.7% + 4.7%
One-Year Change in
Healthy buyer demand and constrained supply continue to be the story for
much of the country. Nationally, showing activity in July remained substantially
higher than a year before and multiple offer situations are a frequent experience
in many markets. With the inventory of homes for sale still constrained, a
competitive market for buyers shows little sign of waning.
New Listings were up 20.8 percent for single family homes and 46.6 percent for
Condo/TIC/Coop properties. Pending Sales increased 38.5 percent for single
family homes and 14.0 percent for Condo/TIC/Coop properties.
The Median Sales Price was up 6.0 percent to $1,670,000 for single family
homes and 3.7 percent to $1,268,200 for Condo/TIC/Coop properties. Months
Supply of Inventory increased 40.0 percent for single family units and 109.7
percent for Condo/TIC/Coop units.
While the number of unemployment insurance weekly initial claims have been
far lower in recent weeks than their peak in March and April, more than 1 million
new claims are still being filed each week and more 31 million were claiming
benefits in all programs as of early July, compared to fewer than 2 million in July
2019. Despite this significant economic impact, home buyers remain extremely
resilient. With mortgage rates remaining near record-low levels and home
purchase mortgage applications up from a year ago, high buyer activity is
expected to continue into the late summer and early fall market.
Median Sales Price
All Property Types
Residential real estate activity in San Francisco County (Districts 1-10)
composed of single-family properties, townhomes and condominiums.
Percent changes are calculated using rounded figures.
Single Family Activity Overview
Months Supply of Inventory
Single Family Activity Overview
Key metrics by report month and for year-to-date (YTD) starting from the first of the year.
Key Metrics Historical Sparkbars 7-2019 7-2020 Percent Change YTD 2019 YTD 2020 Percent Change
- 5.3%1,529
958 - 23.5%
$1,660,000 + 3.4%
+ 3.1%
Pending Sales 182 252 + 38.5% - 18.0%1,289 1,057
New Listings 197 238 + 20.8% 1,615
Sold Listings 213 211 - 0.9% 1,253
Median Sales Price $1,576,000 $1,670,000 + 6.0% $1,605,000
25 0.0%
$2,123,870
-- --
Days on Market 23 26 + 13.0% 25
Avg. Sales Price $1,959,574 $2,089,958 + 6.7% $2,060,010
Active Listings 466 564 + 21.0% --
% of Properties Sold Over List Price 82.6% 64.0% - 22.5% 76.8%
32
65.8% - 14.3%
- 3.8%
34 + 6.3%
108.5%% of List Price Received 115.4% 106.3% - 7.9% 112.8%
Current as of August 11, 2020. All data from the San Francisco MLS. Report © 2020 ShowingTime. | 2
Months Supply 2.5 3.5 + 40.0% -- -- --
Affordability Ratio 33 34 + 3.0%
7-2017 7-2018 7-2019 7-2020
7-2017 7-2018 7-2019 7-2020
7-2017 7-2018 7-2019 7-2020
7-2017 7-2018 7-2019 7-2020
7-2017 7-2018 7-2019 7-2020
7-2017 7-2018 7-2019 7-2020
7-2017 7-2018 7-2019 7-2020
7-2017 7-2018 7-2019 7-2020
7-2017 7-2018 7-2019 7-2020
7-2017 7-2018 7-2019 7-2020
7-2017 7-2018 7-2019 7-2020
Condo/TIC/Coop Activity Overview
Key metrics by report month and for year-to-date (YTD) starting from the first of the year.
Key Metrics Historical Sparkbars 7-2019 7-2020 Percent Change YTD 2019 YTD 2020 Percent Change
+ 11.7%
Pending Sales 207 236 + 14.0% 1,746 1,270 - 27.3%
New Listings 320 469 + 46.6% 2,370 2,648
Sold Listings 244 256 + 4.9% 1,708 1,214 - 28.9%
Median Sales Price $1,222,444 $1,268,200 + 3.7% $1,211,000 $1,250,000 + 3.2%
+ 2.7%
36 + 2.9%
$1,381,064
-- --
Days on Market 33 38 + 15.2% 35
Avg. Sales Price $1,310,687 $1,414,347 + 7.9% $1,344,244
Active Listings 734 1,300 + 77.1% --
% of Properties Sold Over List Price 70.5% 46.1% - 34.6% 59.7%
49
48.7% - 18.4%
- 3.1%
54 + 10.2%
102.5%% of List Price Received 107.6% 101.2% - 5.9% 105.8%
Current as of August 11, 2020. All data from the San Francisco MLS. Report © 2020 ShowingTime. | 3
Months Supply 3.1 6.5 + 109.7% -- -- --
Affordability Ratio 49 53 + 8.2%
7-2017 7-2018 7-2019 7-2020
7-2017 7-2018 7-2019 7-2020
7-2017 7-2018 7-2019 7-2020
7-2017 7-2018 7-2019 7-2020
7-2017 7-2018 7-2019 7-2020
7-2017 7-2018 7-2019 7-2020
7-2017 7-2018 7-2019 7-2020
7-2017 7-2018 7-2019 7-2020
7-2017 7-2018 7-2019 7-2020
7-2017 7-2018 7-2019 7-2020
7-2017 7-2018 7-2019 7-2020
New Listings
New Listings
Single
Family
Year-Over-Year
Change
Condo/TIC/
Coop
Year-Over-Year
Change
Aug-2019 246 -1.6% 329 +5.8%
Sep-2019 309 -8.6% 508 +11.9%
Oct-2019 245 -5.0% 344 +0.9%
Nov-2019 136 -14.5% 160 -18.4%
Dec-2019 85 +3.7% 132 +8.2%
Jan-2020 222 -1.3% 374 +4.5%
Feb-2020 242 +28.0% 382 +24.8%
Mar-2020 152 -37.4% 242 -31.1%
Apr-2020 148 -41.3% 211 -44.0%
May-2020 244 -11.3% 474 +28.1%
Jun-2020 283 +20.9% 496 +72.2%
Jul-2020 238 +20.8% 469 +46.6%
12-Month Avg 213 -5.6% 343 +8.6%
Historical New Listings by Month
Current as of August 11, 2020. All data from the San Francisco MLS. Report © 2020 ShowingTime. | 4
A count of the properties that have been newly listed on the market in a given month.
239
262
197
320
238
469
Single Family Condo/TIC/Coop
July
0
100
200
300
400
500
600
700
1-2005 1-2006 1-2007 1-2008 1-2009 1-2010 1-2011 1-2012 1-2013 1-2014 1-2015 1-2016 1-2017 1-2018 1-2019 1-2020
Single Family Condo/TIC/Coop
1,721
2,473
1,615
2,370
1,529
2,648
Single Family Condo/TIC/Coop
Year to Date
2018 2019 2020
+ 46.6%+ 22.1%+ 20.8%- 17.6% - 4.2%- 5.3%- 6.2% + 11.7%
2018 2019 2020 2018 2019 2020 2018 2019 2020
+ 13.3% + 6.0% + 10.3%- 4.4%
Pending Sales
Pending Sales
Single
Family
Year-Over-Year
Change
Condo/TIC/
Coop
Year-Over-Year
Change
Aug-2019 149 -12.4% 212 -8.6%
Sep-2019 195 +1.0% 228 +4.1%
Oct-2019 247 -1.6% 303 +4.5%
Nov-2019 190 +1.6% 233 +5.0%
Dec-2019 113 -6.6% 155 +5.4%
Jan-2020 101 +13.5% 157 +29.8%
Feb-2020 134 -6.9% 235 +3.1%
Mar-2020 153 -27.1% 182 -39.1%
Apr-2020 72 -67.6% 89 -71.4%
May-2020 149 -39.9% 141 -58.0%
Jun-2020 196 +1.0% 230 -5.7%
Jul-2020 252 +38.5% 236 +14.0%
12-Month Avg 163 -11.8% 200 -15.9%
Historical Pending Sales by Month
Current as of August 11, 2020. All data from the San Francisco MLS. Report © 2020 ShowingTime. | 5
A count of the properties on which offers have been accepted in a given month.
165
247
182
207
252
236
Single Family Condo/TIC/Coop
July
0
100
200
300
400
1-2005 1-2006 1-2007 1-2008 1-2009 1-2010 1-2011 1-2012 1-2013 1-2014 1-2015 1-2016 1-2017 1-2018 1-2019 1-2020
Single Family Condo/TIC/Coop
1,311
1,873
1,289
1,746
1,057
1,270
Single Family Condo/TIC/Coop
Year to Date
2018 2019 2020
+ 14.0%- 16.2%+ 38.5%+ 10.3% - 6.8%- 18.0%- 1.7% - 27.3%
2018 2019 2020 2018 2019 2020 2018 2019 2020
- 4.6% + 0.8% + 11.0%+ 18.2%
Sold Listings
Sold Listings
Single
Family
Year-Over-Year
Change
Condo/TIC/
Coop
Year-Over-Year
Change
Aug-2019 168 -12.0% 207 -20.4%
Sep-2019 127 -13.6% 192 +4.9%
Oct-2019 255 +2.8% 259 -11.6%
Nov-2019 200 -9.1% 272 +3.0%
Dec-2019 175 +9.4% 216 +11.3%
Jan-2020 96 -4.0% 150 +31.6%
Feb-2020 115 +1.8% 179 +9.1%
Mar-2020 162 -5.8% 229 -13.6%
Apr-2020 104 -54.0% 114 -64.3%
May-2020 105 -56.1% 109 -67.7%
Jun-2020 165 -13.2% 177 -33.2%
Jul-2020 211 -0.9% 256 +4.9%
12-Month Avg 157 -15.1% 197 -18.7%
Historical Sold Listings by Month
Current as of August 11, 2020. All data from the San Francisco MLS. Report © 2020 ShowingTime. | 6
A count of the actual sales that closed in a given month.
192
274
213
244
211
256
Single Family Condo/TIC/Coop
July
0
100
200
300
400
1-2005 1-2006 1-2007 1-2008 1-2009 1-2010 1-2011 1-2012 1-2013 1-2014 1-2015 1-2016 1-2017 1-2018 1-2019 1-2020
Single Family Condo/TIC/Coop
1,264
1,825
1,253
1,708
958
1,214
Single Family Condo/TIC/Coop
Year to Date
2018 2019 2020
+ 4.9%- 10.9%- 0.9%+ 10.9% - 6.4%- 23.5%- 0.9% - 28.9%
2018 2019 2020 2018 2019 2020 2018 2019 2020
- 8.6% + 1.0% + 9.9%+ 14.6%
Median Sales Price
Median Sales Price
Single
Family
Year-Over-Year
Change
Condo/TIC/
Coop
Year-Over-Year
Change
Aug-2019 $1,602,500 +4.2% $1,281,250 +3.8%
Sep-2019 $1,530,000 +2.0% $1,325,000 +15.2%
Oct-2019 $1,650,000 +3.1% $1,325,000 +9.1%
Nov-2019 $1,604,000 +12.4% $1,180,000 -1.1%
Dec-2019 $1,450,000 -2.8% $1,198,283 +2.4%
Jan-2020 $1,462,500 +5.3% $1,172,000 +12.7%
Feb-2020 $1,610,000 +7.3% $1,300,000 +15.0%
Mar-2020 $1,650,000 0.0% $1,262,000 +1.4%
Apr-2020 $1,687,000 +4.6% $1,294,000 +5.6%
May-2020 $1,630,000 -3.3% $1,100,222 -11.6%
Jun-2020 $1,805,000 +3.1% $1,200,000 -7.6%
Jul-2020 $1,670,000 +6.0% $1,268,200 +3.7%
12-Month Avg* $1,625,000 +3.2% $1,255,000 +4.5%
Historical Median Sales Price by Month
* Median Sales Price for all properties from August 2019 through July 2020. This is not the
average of the individual figures above.
Current as of August 11, 2020. All data from the San Francisco MLS. Report © 2020 ShowingTime. | 7
Point at which half of the sales sold for more and half sold for less, not accounting for seller concessions, in a given month.
$1,626,250
$1,150,000
$1,576,000
$1,222,444
$1,670,000
$1,268,200
Single Family Condo/TIC/Coop
July
$500,000
$750,000
$1,000,000
$1,250,000
$1,500,000
$1,750,000
$2,000,000
1-2005 1-2006 1-2007 1-2008 1-2009 1-2010 1-2011 1-2012 1-2013 1-2014 1-2015 1-2016 1-2017 1-2018 1-2019 1-2020
Single Family Condo/TIC/Coop
$1,620,000
$1,200,000
$1,605,000
$1,211,000
$1,660,000
$1,250,000
Single Family Condo/TIC/Coop
Year to Date
2018 2019 2020
+ 3.7%+ 6.3%+ 6.0%- 3.1% + 0.9%+ 3.4%- 0.9% + 3.2%
2018 2019 2020 2018 2019 2020 2018 2019 2020
+ 16.2% + 15.7% + 6.3%0.0%
Average Sales Price
Avg. Sales Price
Single
Family
Year-Over-Year
Change
Condo/TIC/
Coop
Year-Over-Year
Change
Aug-2019 $1,872,478 +3.3% $1,386,808 +2.9%
Sep-2019 $2,065,723 +13.6% $1,449,604 +15.4%
Oct-2019 $1,912,555 -11.1% $1,447,421 +7.8%
Nov-2019 $1,986,456 +6.6% $1,322,998 +4.7%
Dec-2019 $1,948,749 +9.1% $1,261,689 -5.1%
Jan-2020 $2,212,609 +26.3% $1,319,209 +12.1%
Feb-2020 $1,953,875 +4.4% $1,404,496 +3.0%
Mar-2020 $2,084,487 +1.9% $1,380,103 +3.3%
Apr-2020 $2,324,543 +4.0% $1,381,974 +1.4%
May-2020 $1,900,955 -11.2% $1,289,927 -3.4%
Jun-2020 $2,288,124 +6.5% $1,418,428 -0.9%
Jul-2020 $2,089,958 +6.7% $1,414,347 +7.9%
12-Month Avg* $2,038,032 +2.2% $1,376,808 +3.5%
Historical Average Sales Price by Month
* Avg. Sales Price for all properties from August 2019 through July 2020. This is not the average
of the individual figures above.
Current as of August 11, 2020. All data from the San Francisco MLS. Report © 2020 ShowingTime. | 8
Average sales price for all closed sales, not accounting for seller concessions, in a given month.
$1,969,483
$1,239,099
$1,959,574
$1,310,687
$2,089,958
$1,414,347
Single Family Condo/TIC/Coop
July
$500,000
$1,000,000
$1,500,000
$2,000,000
$2,500,000
1-2005 1-2006 1-2007 1-2008 1-2009 1-2010 1-2011 1-2012 1-2013 1-2014 1-2015 1-2016 1-2017 1-2018 1-2019 1-2020
Single Family Condo/TIC/Coop
$2,002,019
$1,328,891
$2,060,010
$1,344,244
$2,123,870
$1,381,064
Single Family Condo/TIC/Coop
Year to Date
2018 2019 2020
+ 7.9%+ 5.8%+ 6.7%- 0.5% + 1.2%+ 3.1%+ 2.9% + 2.7%
2018 2019 2020 2018 2019 2020 2018 2019 2020
+ 13.3% + 12.2% + 2.3%- 0.3%
Days on Market Until Sale
Days on Market
Single
Family
Year-Over-Year
Change
Condo/TIC/
Coop
Year-Over-Year
Change
Aug-2019 25 +13.6% 33 -8.3%
Sep-2019 28 +16.7% 34 +13.3%
Oct-2019 22 -8.3% 28 +3.7%
Nov-2019 24 -7.7% 34 -10.5%
Dec-2019 31 -6.1% 49 +11.4%
Jan-2020 38 -2.6% 62 +12.7%
Feb-2020 25 -13.8% 29 -27.5%
Mar-2020 20 -23.1% 28 -20.0%
Apr-2020 21 -19.2% 32 -15.8%
May-2020 24 +9.1% 39 +34.5%
Jun-2020 25 +13.6% 34 +9.7%
Jul-2020 26 +13.0% 38 +15.2%
12-Month Avg* 25 -0.6% 36 +2.5%
Historical Days on Market Until Sale by Month
* Days on Market for all properties from August 2019 through July 2020. This is not the average
of the individual figures above.
Current as of August 11, 2020. All data from the San Francisco MLS. Report © 2020 ShowingTime. | 9
Average number of days between when a property is listed and when an offer is accepted in a given month.
21
31
23
33
26
38
Single Family Condo/TIC/Coop
July
0
20
40
60
80
100
120
1-2005 1-2006 1-2007 1-2008 1-2009 1-2010 1-2011 1-2012 1-2013 1-2014 1-2015 1-2016 1-2017 1-2018 1-2019 1-2020
Single Family Condo/TIC/Coop
21
31
25
35
25
36
Single Family Condo/TIC/Coop
Year to Date
2018 2019 2020
+ 15.2%+ 6.5%+ 13.0%+ 9.5% + 12.9%0.0%+ 19.0% + 2.9%
2018 2019 2020 2018 2019 2020 2018 2019 2020
- 12.5% - 25.0% - 13.9%- 6.1%
Inventory of Active Listings
Active Listings
Single
Family
Year-Over-Year
Change
Condo/TIC/
Coop
Year-Over-Year
Change
Aug-2019 519 +5.5% 759 +13.1%
Sep-2019 595 +0.3% 963 +13.2%
Oct-2019 548 +1.1% 919 +9.9%
Nov-2019 447 -3.7% 756 +5.7%
Dec-2019 335 +1.8% 556 +9.4%
Jan-2020 438 -2.2% 738 +7.1%
Feb-2020 530 +15.0% 828 +15.2%
Mar-2020 478 +1.5% 742 +3.8%
Apr-2020 526 +8.7% 808 +9.9%
May-2020 598 +25.9% 1,067 +45.8%
Jun-2020 636 +28.7% 1,193 +66.4%
Jul-2020 564 +21.0% 1,300 +77.1%
12-Month Avg* 518 +8.7% 886 +23.3%
Historical Inventory of Active Listings by Month
* Active Listings for all properties from August 2019 through July 2020. This is not the average of
the individual figures above.
Current as of August 11, 2020. All data from the San Francisco MLS. Report © 2020 ShowingTime. | 10
The number of properties available for sale in active status at the end of a given month.
462
658
466
734
564
1,300
Single Family Condo/TIC/Coop
July
0
250
500
750
1,000
1,250
1,500
1-2005 1-2006 1-2007 1-2008 1-2009 1-2010 1-2011 1-2012 1-2013 1-2014 1-2015 1-2016 1-2017 1-2018 1-2019 1-2020
Single Family Condo/TIC/Coop
2018 2019 2020
+ 77.1%+ 11.6%+ 21.0%+ 0.9%
2018 2019 2020
+ 17.9% + 9.1%
% of Properties Sold Over List Price
% of Properties
Sold Over List Price
Single
Family
Year-Over-Year
Change
Condo/TIC/
Coop
Year-Over-Year
Change
Aug-2019 82.1% +1.9% 58.9% +2.1%
Sep-2019 74.0% -8.6% 59.4% -6.3%
Oct-2019 80.8% -2.3% 65.3% -4.4%
Nov-2019 77.5% +5.3% 64.3% +18.0%
Dec-2019 66.3% -2.6% 47.7% +3.9%
Jan-2020 60.4% +0.7% 33.3% -19.2%
Feb-2020 72.2% -7.3% 62.6% +18.1%
Mar-2020 78.4% +7.0% 60.3% +8.1%
Apr-2020 69.2% -6.4% 59.6% +8.0%
May-2020 62.9% -21.3% 42.2% -35.1%
Jun-2020 53.9% -33.5% 33.3% -48.4%
Jul-2020 64.0% -22.5% 46.1% -34.6%
12-Month Avg 71.1% -7.8% 54.0% -8.9%
Historical % of Properties Sold Over List Price by Month
* % of Properties Sold Over List Price for all properties from August 2019 through July 2020. This
is not the average of the individual figures above.
Current as of August 11, 2020. All data from the San Francisco MLS. Report © 2020 ShowingTime. | 11
Percentage found when dividing the number of properties sold by properties sold over its original list price, not accounting for seller
concessions.
85.4%
63.1%
82.6%
70.5%
64.0%
46.1%
Single Family Condo/TIC/Coop
July
0.0%
20.0%
40.0%
60.0%
80.0%
100.0%
1-2005 1-2006 1-2007 1-2008 1-2009 1-2010 1-2011 1-2012 1-2013 1-2014 1-2015 1-2016 1-2017 1-2018 1-2019 1-2020
Single Family Condo/TIC/Coop
81.8%
61.8%
76.8%
59.7%
65.8%
48.7%
Single Family Condo/TIC/Coop
Year to Date
2018 2019 2020
- 34.6%+ 11.7%- 22.5%- 3.3% - 3.4%- 14.3%- 6.1% - 18.4%
2018 2019 2020 2018 2019 2020 2018 2019 2020
+ 4.9% + 6.0% + 5.1%+ 0.5%
% of List Price Received
% of List Price
Received
Single
Family
Year-Over-Year
Change
Condo/TIC/
Coop
Year-Over-Year
Change
Aug-2019 115.3% +0.4% 105.8% +0.2%
Sep-2019 112.4% -2.5% 105.2% -1.2%
Oct-2019 114.0% 0.0% 105.9% -1.7%
Nov-2019 111.9% +0.6% 105.1% +1.0%
Dec-2019 109.7% -0.7% 103.1% +1.0%
Jan-2020 107.1% +1.0% 100.4% -0.6%
Feb-2020 111.9% -0.6% 105.2% +1.0%
Mar-2020 114.5% +3.6% 104.3% -0.4%
Apr-2020 109.0% -3.0% 105.5% +0.6%
May-2020 106.1% -6.3% 100.6% -6.3%
Jun-2020 105.3% -8.7% 100.2% -6.5%
Jul-2020 106.3% -7.9% 101.2% -5.9%
12-Month Avg* 110.6% -2.0% 103.7% -1.8%
Historical % of List Price Received by Month
* % of List Price Received for all properties from August 2019 through July 2020. This is not the
average of the individual figures above.
Current as of August 11, 2020. All data from the San Francisco MLS. Report © 2020 ShowingTime. | 12
Percentage found when dividing a property’s sales price by its most recent list price, then taking the average for all properties sold in a given
month, not accounting for seller concessions.
117.2%
107.1%
115.4%
107.6%106.3%
101.2%
Single Family Condo/TIC/Coop
July
118.1%
107.0%
112.8%
105.8%108.5%
102.5%
Single Family Condo/TIC/Coop
Year to Date
90.0%
100.0%
110.0%
120.0%
130.0%
1-2005 1-2006 1-2007 1-2008 1-2009 1-2010 1-2011 1-2012 1-2013 1-2014 1-2015 1-2016 1-2017 1-2018 1-2019 1-2020
Single Family Condo/TIC/Coop
2018 2019 2020
- 5.9%+ 0.5%- 7.9%- 1.5%
2018 2019 2020
+ 0.1% + 1.0%
2018 2019 2020
- 3.1%- 1.1%- 3.8%- 4.5%
2018 2019 2020
+ 3.0% + 2.0%
Housing Affordability Ratio
Affordability Ratio
Single
Family
Year-Over-Year
Change
Condo/TIC/
Coop
Year-Over-Year
Change
Aug-2019 34 +9.7% 49 +8.9%
Sep-2019 35 +12.9% 47 0.0%
Oct-2019 33 +17.9% 48 +17.1%
Nov-2019 33 +3.1% 52 +20.9%
Dec-2019 36 +9.1% 51 +6.3%
Jan-2020 37 +5.7% 54 0.0%
Feb-2020 34 +3.0% 49 -3.9%
Mar-2020 32 +6.7% 49 +4.3%
Apr-2020 33 +6.5% 50 +4.2%
May-2020 34 +13.3% 58 +23.4%
Jun-2020 31 +6.9% 55 +22.2%
Jul-2020 34 +3.0% 53 +8.2%
12-Month Avg* 34 +8.6% 31 +12.5%
Historical Housing Affordability Ratio by Month
* Affordability Ratio for all properties from August 2019 through July 2020. This is not the average
of the individual figures above.
Current as of August 11, 2020. All data from the San Francisco MLS. Report © 2020 ShowingTime. | 13
This index measures housing affordability for the region. For example, an index of 120 means the median household income is 120% of what is
necessary to qualify for the median-priced home under prevailing interest rates. A higher number means greater affordability.
30
49
33
49
34
53
Single Family Condo/TIC/Coop
July
20
40
60
80
100
1-2005 1-2006 1-2007 1-2008 1-2009 1-2010 1-2011 1-2012 1-2013 1-2014 1-2015 1-2016 1-2017 1-2018 1-2019 1-2020
Single Family Condo/TIC/Coop
2018 2019 2020
+ 8.2%0.0%+ 3.0%+ 10.0%
2018 2019 2020
- 18.9% - 5.8%
30
47
32
49
34
54
Single Family Condo/TIC/Coop
Year to Date
2018 2019 2020
+ 10.2%+ 4.3%+ 6.3%+ 6.7%
2018 2019 2020
- 18.9% - 11.3%
Months Supply of Inventory
Months Supply
Single
Family
Year-Over-Year
Change
Condo/TIC/
Coop
Year-Over-Year
Change
Aug-2019 2.8 +7.7% 3.2 +23.1%
Sep-2019 3.3 +3.1% 4.1 +24.2%
Oct-2019 3.0 +3.4% 3.9 +18.2%
Nov-2019 2.4 -4.0% 3.2 +14.3%
Dec-2019 1.8 0.0% 2.3 +15.0%
Jan-2020 2.4 0.0% 3.0 +7.1%
Feb-2020 2.9 +16.0% 3.4 +17.2%
Mar-2020 2.7 +3.8% 3.2 +6.7%
Apr-2020 3.2 +23.1% 3.8 +26.7%
May-2020 3.8 +46.2% 5.4 +80.0%
Jun-2020 4.1 +51.9% 6.0 +100.0%
Jul-2020 3.5 +40.0% 6.5 +109.7%
12-Month Avg* 3.0 +16.3% 4.0 +37.3%
Historical Months Supply of Inventory by Month
* Months Supply for all properties from August 2019 through July 2020. This is not the average of
the individual figures above.
Current as of August 11, 2020. All data from the San Francisco MLS. Report © 2020 ShowingTime. | 14
The inventory of homes for sale at the end of a given month, divided by the average monthly pending sales from the last 12 months.
2.4 2.62.5
3.1
3.5
6.5
Single Family Condo/TIC/Coop
July
0.0
2.0
4.0
6.0
8.0
10.0
1-2005 1-2006 1-2007 1-2008 1-2009 1-2010 1-2011 1-2012 1-2013 1-2014 1-2015 1-2016 1-2017 1-2018 1-2019 1-2020
Single Family Condo/TIC/Coop
2018 2019 2020
+ 109.7%+ 19.2%+ 40.0%+ 4.2%
2018 2019 2020
+ 14.3% 0.0%
All Properties Activity Overview
Key metrics by report month and for year-to-date (YTD) starting from the first of the year.
Key Metrics Historical Sparkbars 7-2019 7-2020 Percent Change YTD 2019 YTD 2020 Percent Change
+ 4.8%
Pending Sales 389 488 + 25.4% 3,035 2,327 - 23.3%
New Listings 517 707 + 36.8% 3,985 4,177
Sold Listings 457 467 + 2.2% 2,961 2,172 - 26.6%
Median Sales Price $1,385,000 $1,450,000 + 4.7% $1,375,000 $1,440,000 + 4.7%
+ 3.7%
31 0.0%
$1,708,692
-- --
Days on Market 28 32 + 14.3% 31
Avg. Sales Price $1,613,122 $1,719,602 + 6.6% $1,647,133
Active Listings 1,200 1,864 + 55.3% --
% of Properties Sold Over List Price 76.1% 54.2% - 28.8% 66.9%
37
56.2% - 16.0%
- 3.3%
40 + 8.1%
105.1%% of List Price Received 111.2% 103.5% - 6.9% 108.7%
Current as of August 11, 2020. All data from the San Francisco MLS. Report © 2020 ShowingTime. | 15
Months Supply 2.8 5.1 + 82.1% -- -- --
Affordability Ratio 37 39 + 5.4%
7-2017 7-2018 7-2019 7-2020
7-2017 7-2018 7-2019 7-2020
7-2017 7-2018 7-2019 7-2020
7-2017 7-2018 7-2019 7-2020
7-2017 7-2018 7-2019 7-2020
7-2017 7-2018 7-2019 7-2020
7-2017 7-2018 7-2019 7-2020
7-2017 7-2018 7-2019 7-2020
7-2017 7-2018 7-2019 7-2020
7-2017 7-2018 7-2019 7-2020
7-2017 7-2018 7-2019 7-2020
Activity by District
SF District 1: Northwest (Sea Cliff, Lake, Jordan Park / Laurel Heights, Outer Richmond, Central Richmond, Inner Richmond, Lone Mountain)
SF District 2: Central West (Outer Sunset, Central Sunset, Inner Sunset, Outer Parkside, Parkside, Inner Parkside, Golden Gate Heights)
SF District 3: Southwest (Pine Lake Park, Lake Shore, Merced Manor, Stonestown, Lakeside, Merced Heights, Ingleside, Ingleside Heights, Oceanview)
SF District 4: Twin Peaks W (Forest Hill (& Ext), W Portal, St Francis Wd, Balboa Terr, Mt Dav Manor, Ingleside Terr, Monterey Hts, Wstwd Pk & H'lnds, Shrwd Fst, Miraloma Pk, Dmnd Hts, Mdtwn Terr)
SF District 5: Central (Haight Ashbury, Cole Vly / Prnssus Hts, Clarndn Hts, Corona Hts, Twin Pks, Glen Pk, Noe Vly, Eureka Vly / Dolores Hts, Mission Dolores, Duboce Trngl, Buena Vista / Ashbury Hts)
SF District 6: Central North (Lower Pacific Heights, Anza Vista, Western Addition, North Panhandle, Alamo Square, Hayes Valley)
SF District 7: North (Marina, Cow Hollow, Presidio Heights, Pacific Heights)
SF District 8: Northeast (North Waterfront, North Beach, Russian Hill, Telegraph Hill, Nob Hill, Financial District / Barbary Coast, Downtown, Van Ness / Civic Center, Tenderloin)
SF District 9: Central East (Yerba Buena, South Beach, South of Market, Mission Bay, Inner Mission, Potrero Hill, Central Waterfront / Dogpatch, Bernal Heights)
SF District 10: Southeast (Outer Mission, Mission Terr, Excelsior, Portola, Bayview, Silver Terr, Hunters Pt, Candlestick Pt, Bayview Hts, Little Hollywood, Visitation Vly, Crocker Amazon)
7-2019 7-2020 + / – 7-2019 7-2020 + / – 7-2019 7-2020 + / – 7-2019 7-2020 + / – 7-2019 7-2020 + / –
Single Family
1 SF District 1 34 50 +47.1% 17 21 +23.5% $1,958,000 $2,300,000 +17.5% 43 35 -18.6% 2.2 3.2 +45.5%
2 SF District 2 56 54 -3.6% 39 28 -28.2% $1,407,000 $1,475,000 +4.8% 19 14 -26.3% 1.8 1.9 +5.6%
3 SF District 3 26 37 +42.3% 17 12 -29.4% $1,305,000 $1,155,250 -11.5% 20 27 +35.0% 2.2 3.6 +63.6%
4 SF District 4 38 54 +42.1% 29 31 +6.9% $1,750,000 $1,560,000 -10.9% 21 21 0.0% 1.4 2.5 +78.6%
5 SF District 5 68 100 +47.1% 43 45 +4.7% $2,315,000 $2,395,000 +3.5% 21 23 +9.5% 2.4 3.9 +62.5%
6 SF District 6 19 19 0.0% 3 5 +66.7% $2,275,000 $2,600,000 +14.3% 31 29 -6.5% 4.9 5.8 +18.4%
7 SF District 7 47 51 +8.5% 2 11 +450.0% $7,535,000 $4,267,500 -43.4% 33 66 +100.0% 5.9 6.8 +15.3%
8 SF District 8 22 25 +13.6% 1 2 +100.0% $3,600,000 $4,212,500 +17.0% 21 30 +42.9% 10.1 12.5 +23.8%
9 SF District 9 59 74 +25.4% 24 25 +4.2% $1,700,000 $1,725,000 +1.5% 19 15 -21.1% 3.1 4.2 +35.5%
10 SF District 10 97 100 +3.1% 38 31 -18.4% $1,022,500 $1,200,000 +17.4% 23 34 +47.8% 2.6 3.3 +26.9%
Condo/TIC/Coop
1 SF District 1 30 35 +16.7% 15 19 +26.7% $1,410,000 $1,275,000 -9.6% 21 38 +81.0% 2.2 3.1 +40.9%
2 SF District 2 15 20 +33.3% 3 6 +100.0% $1,250,000 $1,357,500 +8.6% 28 30 +7.1% 4.1 4.5 +9.8%
3 SF District 3 7 15 +114.3% 2 2 0.0% $822,500 $972,500 +18.2% 104 19 -81.7% 2.3 5.2 +126.1%
4 SF District 4 10 18 +80.0% 4 5 +25.0% $657,000 $675,000 +2.7% 76 13 -82.9% 1.9 3.4 +78.9%
5 SF District 5 85 155 +82.4% 38 47 +23.7% $1,502,500 $1,475,000 -1.8% 18 31 +72.2% 2.5 4.7 +88.0%
6 SF District 6 53 92 +73.6% 24 22 -8.3% $1,287,500 $1,185,000 -8.0% 47 33 -29.8% 2.5 5.0 +100.0%
7 SF District 7 62 127 +104.8% 22 31 +40.9% $1,455,000 $1,700,000 +16.8% 24 30 +25.0% 2.5 5.5 +120.0%
8 SF District 8 155 246 +58.7% 48 38 -20.8% $942,500 $1,217,500 +29.2% 46 52 +13.0% 3.8 8.0 +110.5%
9 SF District 9 288 544 +88.9% 76 81 +6.6% $1,252,500 $1,120,000 -10.6% 29 41 +41.4% 3.4 8.0 +135.3%
10 SF District 10 29 48 +65.5% 12 5 -58.3% $842,500 $973,000 +15.5% 31 47 +51.6% 4.6 11.8 +156.5%
Key metrics by report month for the districts of San Fransisco.
Current as of August 11, 2020. All data from the San Francisco MLS. Report © 2020 ShowingTime. | 16
Active Listings Sold Listings Median Sales Price Days on Market Months Supply

More Related Content

What's hot

San Francisco Market Focus Report December 2018
San Francisco Market Focus Report December 2018San Francisco Market Focus Report December 2018
San Francisco Market Focus Report December 2018Ronny Budiutama
 
San Francisco Market Focus Report March 2019
San Francisco Market Focus Report March 2019San Francisco Market Focus Report March 2019
San Francisco Market Focus Report March 2019Ronny Budiutama
 
San Francisco Market Focus Report Jan 2019
San Francisco Market Focus Report Jan 2019San Francisco Market Focus Report Jan 2019
San Francisco Market Focus Report Jan 2019Ronny Budiutama
 
San Francisco Market Focus Report Feb 2019
San Francisco Market Focus Report Feb 2019San Francisco Market Focus Report Feb 2019
San Francisco Market Focus Report Feb 2019Ronny Budiutama
 
San Francisco Market Data October 2020
San Francisco Market Data October 2020San Francisco Market Data October 2020
San Francisco Market Data October 2020Ronny Budiutama
 
San Fancisco Market Focus Report June 2019
San Fancisco Market Focus Report June 2019San Fancisco Market Focus Report June 2019
San Fancisco Market Focus Report June 2019Ronny Budiutama
 
San Francisco Market Focus Report July 2019
San Francisco Market Focus Report July 2019San Francisco Market Focus Report July 2019
San Francisco Market Focus Report July 2019Ronny Budiutama
 
San Francisco Market Focus Report Jan 2020
San Francisco Market Focus Report Jan 2020San Francisco Market Focus Report Jan 2020
San Francisco Market Focus Report Jan 2020Ronny Budiutama
 
San Francisco market report August 2020
San Francisco market report August 2020San Francisco market report August 2020
San Francisco market report August 2020Ronny Budiutama
 
San Francisco Market Report March 2021
San Francisco Market Report March 2021San Francisco Market Report March 2021
San Francisco Market Report March 2021Ronny Budiutama
 
San Francisco Market Focus Report Nov 2020
San Francisco Market Focus Report Nov 2020San Francisco Market Focus Report Nov 2020
San Francisco Market Focus Report Nov 2020Ronny Budiutama
 
San Francisco Market Report August 2021
San Francisco Market Report August 2021San Francisco Market Report August 2021
San Francisco Market Report August 2021Ronny Budiutama
 
San Francisco Market Report January 2021
San Francisco Market Report January 2021San Francisco Market Report January 2021
San Francisco Market Report January 2021Ronny Budiutama
 
Gbar monthly-market-insight-report-jan20
Gbar monthly-market-insight-report-jan20Gbar monthly-market-insight-report-jan20
Gbar monthly-market-insight-report-jan20Joe Schutt
 
San Francisco Market Report For July 2021
San Francisco Market Report For July 2021San Francisco Market Report For July 2021
San Francisco Market Report For July 2021Ronny Budiutama
 
San Francisco Market Report December 2020
San Francisco Market Report December 2020San Francisco Market Report December 2020
San Francisco Market Report December 2020Ronny Budiutama
 
San Francisco Market Focus Report August 2019
San Francisco Market Focus Report August 2019San Francisco Market Focus Report August 2019
San Francisco Market Focus Report August 2019Ronny Budiutama
 
Monthly market-insight-report-oct20
Monthly market-insight-report-oct20Monthly market-insight-report-oct20
Monthly market-insight-report-oct20Joe Schutt
 
San Francisco Market Report September 2021
San Francisco Market Report September 2021San Francisco Market Report September 2021
San Francisco Market Report September 2021Ronny Budiutama
 
San Francisco market report May 2020
San Francisco market report May 2020San Francisco market report May 2020
San Francisco market report May 2020Ronny Budiutama
 

What's hot (20)

San Francisco Market Focus Report December 2018
San Francisco Market Focus Report December 2018San Francisco Market Focus Report December 2018
San Francisco Market Focus Report December 2018
 
San Francisco Market Focus Report March 2019
San Francisco Market Focus Report March 2019San Francisco Market Focus Report March 2019
San Francisco Market Focus Report March 2019
 
San Francisco Market Focus Report Jan 2019
San Francisco Market Focus Report Jan 2019San Francisco Market Focus Report Jan 2019
San Francisco Market Focus Report Jan 2019
 
San Francisco Market Focus Report Feb 2019
San Francisco Market Focus Report Feb 2019San Francisco Market Focus Report Feb 2019
San Francisco Market Focus Report Feb 2019
 
San Francisco Market Data October 2020
San Francisco Market Data October 2020San Francisco Market Data October 2020
San Francisco Market Data October 2020
 
San Fancisco Market Focus Report June 2019
San Fancisco Market Focus Report June 2019San Fancisco Market Focus Report June 2019
San Fancisco Market Focus Report June 2019
 
San Francisco Market Focus Report July 2019
San Francisco Market Focus Report July 2019San Francisco Market Focus Report July 2019
San Francisco Market Focus Report July 2019
 
San Francisco Market Focus Report Jan 2020
San Francisco Market Focus Report Jan 2020San Francisco Market Focus Report Jan 2020
San Francisco Market Focus Report Jan 2020
 
San Francisco market report August 2020
San Francisco market report August 2020San Francisco market report August 2020
San Francisco market report August 2020
 
San Francisco Market Report March 2021
San Francisco Market Report March 2021San Francisco Market Report March 2021
San Francisco Market Report March 2021
 
San Francisco Market Focus Report Nov 2020
San Francisco Market Focus Report Nov 2020San Francisco Market Focus Report Nov 2020
San Francisco Market Focus Report Nov 2020
 
San Francisco Market Report August 2021
San Francisco Market Report August 2021San Francisco Market Report August 2021
San Francisco Market Report August 2021
 
San Francisco Market Report January 2021
San Francisco Market Report January 2021San Francisco Market Report January 2021
San Francisco Market Report January 2021
 
Gbar monthly-market-insight-report-jan20
Gbar monthly-market-insight-report-jan20Gbar monthly-market-insight-report-jan20
Gbar monthly-market-insight-report-jan20
 
San Francisco Market Report For July 2021
San Francisco Market Report For July 2021San Francisco Market Report For July 2021
San Francisco Market Report For July 2021
 
San Francisco Market Report December 2020
San Francisco Market Report December 2020San Francisco Market Report December 2020
San Francisco Market Report December 2020
 
San Francisco Market Focus Report August 2019
San Francisco Market Focus Report August 2019San Francisco Market Focus Report August 2019
San Francisco Market Focus Report August 2019
 
Monthly market-insight-report-oct20
Monthly market-insight-report-oct20Monthly market-insight-report-oct20
Monthly market-insight-report-oct20
 
San Francisco Market Report September 2021
San Francisco Market Report September 2021San Francisco Market Report September 2021
San Francisco Market Report September 2021
 
San Francisco market report May 2020
San Francisco market report May 2020San Francisco market report May 2020
San Francisco market report May 2020
 

Similar to San Francisco market report July 2020

San Francisco Market Report July 2022.pdf
San Francisco Market Report July 2022.pdfSan Francisco Market Report July 2022.pdf
San Francisco Market Report July 2022.pdfRonny Budiutama
 
San Francisco Market Focus Report July
San Francisco Market Focus Report JulySan Francisco Market Focus Report July
San Francisco Market Focus Report JulyRonny Budiutama
 
San Francisco Market Report March 2022
San Francisco Market Report March 2022San Francisco Market Report March 2022
San Francisco Market Report March 2022Ronny Budiutama
 
San Francisco Market Focus Report May
San Francisco Market Focus Report MaySan Francisco Market Focus Report May
San Francisco Market Focus Report MayRonny Budiutama
 
San Francisco Market Report June 2021
San Francisco Market Report June 2021San Francisco Market Report June 2021
San Francisco Market Report June 2021Ronny Budiutama
 
San Francisco market focus report June 2018
San Francisco market focus report June 2018San Francisco market focus report June 2018
San Francisco market focus report June 2018Ronny Budiutama
 
San Francisco Market Report September 2022.pdf
San Francisco Market Report September 2022.pdfSan Francisco Market Report September 2022.pdf
San Francisco Market Report September 2022.pdfRonny Budiutama
 
San Francisco Market Report May 2021
San Francisco Market Report May 2021San Francisco Market Report May 2021
San Francisco Market Report May 2021Ronny Budiutama
 
San Francisco Market Report June 2022.pdf
San Francisco Market Report June 2022.pdfSan Francisco Market Report June 2022.pdf
San Francisco Market Report June 2022.pdfRonny Budiutama
 
San Francisco Market Report October 2022.pdf
San Francisco Market Report October 2022.pdfSan Francisco Market Report October 2022.pdf
San Francisco Market Report October 2022.pdfRonny Budiutama
 
San Francisco Market Focus April 2018
San Francisco Market Focus April 2018San Francisco Market Focus April 2018
San Francisco Market Focus April 2018Ronny Budiutama
 
San Francisco Market Report February 2022
San Francisco Market Report February 2022San Francisco Market Report February 2022
San Francisco Market Report February 2022Ronny Budiutama
 
San Francisco Market Report April 2022.pdf
San Francisco Market Report April 2022.pdfSan Francisco Market Report April 2022.pdf
San Francisco Market Report April 2022.pdfRonny Budiutama
 

Similar to San Francisco market report July 2020 (13)

San Francisco Market Report July 2022.pdf
San Francisco Market Report July 2022.pdfSan Francisco Market Report July 2022.pdf
San Francisco Market Report July 2022.pdf
 
San Francisco Market Focus Report July
San Francisco Market Focus Report JulySan Francisco Market Focus Report July
San Francisco Market Focus Report July
 
San Francisco Market Report March 2022
San Francisco Market Report March 2022San Francisco Market Report March 2022
San Francisco Market Report March 2022
 
San Francisco Market Focus Report May
San Francisco Market Focus Report MaySan Francisco Market Focus Report May
San Francisco Market Focus Report May
 
San Francisco Market Report June 2021
San Francisco Market Report June 2021San Francisco Market Report June 2021
San Francisco Market Report June 2021
 
San Francisco market focus report June 2018
San Francisco market focus report June 2018San Francisco market focus report June 2018
San Francisco market focus report June 2018
 
San Francisco Market Report September 2022.pdf
San Francisco Market Report September 2022.pdfSan Francisco Market Report September 2022.pdf
San Francisco Market Report September 2022.pdf
 
San Francisco Market Report May 2021
San Francisco Market Report May 2021San Francisco Market Report May 2021
San Francisco Market Report May 2021
 
San Francisco Market Report June 2022.pdf
San Francisco Market Report June 2022.pdfSan Francisco Market Report June 2022.pdf
San Francisco Market Report June 2022.pdf
 
San Francisco Market Report October 2022.pdf
San Francisco Market Report October 2022.pdfSan Francisco Market Report October 2022.pdf
San Francisco Market Report October 2022.pdf
 
San Francisco Market Focus April 2018
San Francisco Market Focus April 2018San Francisco Market Focus April 2018
San Francisco Market Focus April 2018
 
San Francisco Market Report February 2022
San Francisco Market Report February 2022San Francisco Market Report February 2022
San Francisco Market Report February 2022
 
San Francisco Market Report April 2022.pdf
San Francisco Market Report April 2022.pdfSan Francisco Market Report April 2022.pdf
San Francisco Market Report April 2022.pdf
 

More from Ronny Budiutama

San Francisco January 2024 Market Report
San Francisco January 2024 Market ReportSan Francisco January 2024 Market Report
San Francisco January 2024 Market ReportRonny Budiutama
 
San Francisco December 2023 Market Report
San Francisco December 2023 Market ReportSan Francisco December 2023 Market Report
San Francisco December 2023 Market ReportRonny Budiutama
 
San Francisco November 2023 Market Report
San Francisco November 2023 Market ReportSan Francisco November 2023 Market Report
San Francisco November 2023 Market ReportRonny Budiutama
 
2023 Annual San Francisco Housing Market
2023 Annual San Francisco Housing Market2023 Annual San Francisco Housing Market
2023 Annual San Francisco Housing MarketRonny Budiutama
 
October 2023 Report: San Francisco Real Estate Market Insights
October 2023 Report: San Francisco Real Estate Market InsightsOctober 2023 Report: San Francisco Real Estate Market Insights
October 2023 Report: San Francisco Real Estate Market InsightsRonny Budiutama
 
CA Weekly MLS Market Data Report - August 2023
CA Weekly MLS Market Data Report - August 2023CA Weekly MLS Market Data Report - August 2023
CA Weekly MLS Market Data Report - August 2023Ronny Budiutama
 
San Francisco Market Report July 2023.pdf
San Francisco Market Report July 2023.pdfSan Francisco Market Report July 2023.pdf
San Francisco Market Report July 2023.pdfRonny Budiutama
 
San Francisco May 2023 Market Report.pdf
San Francisco May 2023 Market Report.pdfSan Francisco May 2023 Market Report.pdf
San Francisco May 2023 Market Report.pdfRonny Budiutama
 
San Francisco June 2023 Market Report.pdf
San Francisco June 2023 Market Report.pdfSan Francisco June 2023 Market Report.pdf
San Francisco June 2023 Market Report.pdfRonny Budiutama
 
San Francisco Market Report March 2023.pdf
San Francisco Market Report March 2023.pdfSan Francisco Market Report March 2023.pdf
San Francisco Market Report March 2023.pdfRonny Budiutama
 
San Francisco Market Report February 2023
San Francisco Market Report February 2023San Francisco Market Report February 2023
San Francisco Market Report February 2023Ronny Budiutama
 
San Francisco Market Report January 2023.pdf
San Francisco Market Report January 2023.pdfSan Francisco Market Report January 2023.pdf
San Francisco Market Report January 2023.pdfRonny Budiutama
 
Annual Report on the San Francisco County Housing Market.pdf
Annual Report on the San Francisco County Housing Market.pdfAnnual Report on the San Francisco County Housing Market.pdf
Annual Report on the San Francisco County Housing Market.pdfRonny Budiutama
 
San Francisco Market Report December 2022.pdf
San Francisco Market Report December 2022.pdfSan Francisco Market Report December 2022.pdf
San Francisco Market Report December 2022.pdfRonny Budiutama
 
San Francisco Market Report November 2022.pdf
San Francisco Market Report November 2022.pdfSan Francisco Market Report November 2022.pdf
San Francisco Market Report November 2022.pdfRonny Budiutama
 
San Francisco Market Report August 2022.pdf
San Francisco Market Report August 2022.pdfSan Francisco Market Report August 2022.pdf
San Francisco Market Report August 2022.pdfRonny Budiutama
 
San Francisco Market Report May 2022.
San Francisco Market Report May 2022.San Francisco Market Report May 2022.
San Francisco Market Report May 2022.Ronny Budiutama
 
San Francisco Market Report January 2022
San Francisco Market Report January 2022San Francisco Market Report January 2022
San Francisco Market Report January 2022Ronny Budiutama
 
San Francisco Market Report December 2021
San Francisco Market Report December 2021San Francisco Market Report December 2021
San Francisco Market Report December 2021Ronny Budiutama
 
San Francisco Market Report November 2021
San Francisco Market Report November 2021San Francisco Market Report November 2021
San Francisco Market Report November 2021Ronny Budiutama
 

More from Ronny Budiutama (20)

San Francisco January 2024 Market Report
San Francisco January 2024 Market ReportSan Francisco January 2024 Market Report
San Francisco January 2024 Market Report
 
San Francisco December 2023 Market Report
San Francisco December 2023 Market ReportSan Francisco December 2023 Market Report
San Francisco December 2023 Market Report
 
San Francisco November 2023 Market Report
San Francisco November 2023 Market ReportSan Francisco November 2023 Market Report
San Francisco November 2023 Market Report
 
2023 Annual San Francisco Housing Market
2023 Annual San Francisco Housing Market2023 Annual San Francisco Housing Market
2023 Annual San Francisco Housing Market
 
October 2023 Report: San Francisco Real Estate Market Insights
October 2023 Report: San Francisco Real Estate Market InsightsOctober 2023 Report: San Francisco Real Estate Market Insights
October 2023 Report: San Francisco Real Estate Market Insights
 
CA Weekly MLS Market Data Report - August 2023
CA Weekly MLS Market Data Report - August 2023CA Weekly MLS Market Data Report - August 2023
CA Weekly MLS Market Data Report - August 2023
 
San Francisco Market Report July 2023.pdf
San Francisco Market Report July 2023.pdfSan Francisco Market Report July 2023.pdf
San Francisco Market Report July 2023.pdf
 
San Francisco May 2023 Market Report.pdf
San Francisco May 2023 Market Report.pdfSan Francisco May 2023 Market Report.pdf
San Francisco May 2023 Market Report.pdf
 
San Francisco June 2023 Market Report.pdf
San Francisco June 2023 Market Report.pdfSan Francisco June 2023 Market Report.pdf
San Francisco June 2023 Market Report.pdf
 
San Francisco Market Report March 2023.pdf
San Francisco Market Report March 2023.pdfSan Francisco Market Report March 2023.pdf
San Francisco Market Report March 2023.pdf
 
San Francisco Market Report February 2023
San Francisco Market Report February 2023San Francisco Market Report February 2023
San Francisco Market Report February 2023
 
San Francisco Market Report January 2023.pdf
San Francisco Market Report January 2023.pdfSan Francisco Market Report January 2023.pdf
San Francisco Market Report January 2023.pdf
 
Annual Report on the San Francisco County Housing Market.pdf
Annual Report on the San Francisco County Housing Market.pdfAnnual Report on the San Francisco County Housing Market.pdf
Annual Report on the San Francisco County Housing Market.pdf
 
San Francisco Market Report December 2022.pdf
San Francisco Market Report December 2022.pdfSan Francisco Market Report December 2022.pdf
San Francisco Market Report December 2022.pdf
 
San Francisco Market Report November 2022.pdf
San Francisco Market Report November 2022.pdfSan Francisco Market Report November 2022.pdf
San Francisco Market Report November 2022.pdf
 
San Francisco Market Report August 2022.pdf
San Francisco Market Report August 2022.pdfSan Francisco Market Report August 2022.pdf
San Francisco Market Report August 2022.pdf
 
San Francisco Market Report May 2022.
San Francisco Market Report May 2022.San Francisco Market Report May 2022.
San Francisco Market Report May 2022.
 
San Francisco Market Report January 2022
San Francisco Market Report January 2022San Francisco Market Report January 2022
San Francisco Market Report January 2022
 
San Francisco Market Report December 2021
San Francisco Market Report December 2021San Francisco Market Report December 2021
San Francisco Market Report December 2021
 
San Francisco Market Report November 2021
San Francisco Market Report November 2021San Francisco Market Report November 2021
San Francisco Market Report November 2021
 

Recently uploaded

9990771857 Call Girls in Noida Sector 1 Noida (Call Girls) Delhi
9990771857 Call Girls in Noida Sector 1 Noida (Call Girls) Delhi9990771857 Call Girls in Noida Sector 1 Noida (Call Girls) Delhi
9990771857 Call Girls in Noida Sector 1 Noida (Call Girls) Delhidelhimodel235
 
Rustomjee The Panorama At Pali Hill, Bandra West, Mumbai - Brochure.pdf
Rustomjee The Panorama At Pali Hill, Bandra West, Mumbai - Brochure.pdfRustomjee The Panorama At Pali Hill, Bandra West, Mumbai - Brochure.pdf
Rustomjee The Panorama At Pali Hill, Bandra West, Mumbai - Brochure.pdfmonikasharma630
 
Low Rate Call Girls In Madipur Slum Quarter +91)8447779280Low Rate 2 short 2...
Low Rate Call Girls In Madipur Slum Quarter  +91)8447779280Low Rate 2 short 2...Low Rate Call Girls In Madipur Slum Quarter  +91)8447779280Low Rate 2 short 2...
Low Rate Call Girls In Madipur Slum Quarter +91)8447779280Low Rate 2 short 2...asmaqueen5
 
Call Girls In Madipur Metro Delhi꧁ +91)8447779280꧂Low Rate 2 short 2000 full ...
Call Girls In Madipur Metro Delhi꧁ +91)8447779280꧂Low Rate 2 short 2000 full ...Call Girls In Madipur Metro Delhi꧁ +91)8447779280꧂Low Rate 2 short 2000 full ...
Call Girls In Madipur Metro Delhi꧁ +91)8447779280꧂Low Rate 2 short 2000 full ...asmaqueen5
 
Model Call Girl in Shastri Nagar Delhi reach out to us at 🔝8264348440🔝
Model Call Girl in Shastri Nagar Delhi reach out to us at 🔝8264348440🔝Model Call Girl in Shastri Nagar Delhi reach out to us at 🔝8264348440🔝
Model Call Girl in Shastri Nagar Delhi reach out to us at 🔝8264348440🔝soniya singh
 
How to Build Multifamily and Laneway Suites in Toronto!! (feat. Expert Archi...
How to Build Multifamily and Laneway Suites  in Toronto!! (feat. Expert Archi...How to Build Multifamily and Laneway Suites  in Toronto!! (feat. Expert Archi...
How to Build Multifamily and Laneway Suites in Toronto!! (feat. Expert Archi...Volition Properties
 
Nanke Area Estate commercial ( Dir. Kat Kuo)
Nanke Area Estate commercial ( Dir. Kat Kuo)Nanke Area Estate commercial ( Dir. Kat Kuo)
Nanke Area Estate commercial ( Dir. Kat Kuo)jessica288382
 
Call Girls in shastri nagar Delhi 8264348440 ✅ call girls ❤️
Call Girls in shastri nagar Delhi 8264348440 ✅ call girls ❤️Call Girls in shastri nagar Delhi 8264348440 ✅ call girls ❤️
Call Girls in shastri nagar Delhi 8264348440 ✅ call girls ❤️soniya singh
 
9990771857 Call Girls in Noida Sector 34 Noida (Call Girls) Delhi
9990771857 Call Girls in Noida Sector 34 Noida (Call Girls) Delhi9990771857 Call Girls in Noida Sector 34 Noida (Call Girls) Delhi
9990771857 Call Girls in Noida Sector 34 Noida (Call Girls) Delhidelhimodel235
 
call girls in Shahdara (DELHI) 🔝 >༒9953330565🔝 genuine Escort Service 🔝✔️✔️
call girls in Shahdara (DELHI) 🔝 >༒9953330565🔝 genuine Escort Service 🔝✔️✔️call girls in Shahdara (DELHI) 🔝 >༒9953330565🔝 genuine Escort Service 🔝✔️✔️
call girls in Shahdara (DELHI) 🔝 >༒9953330565🔝 genuine Escort Service 🔝✔️✔️9953056974 Low Rate Call Girls In Saket, Delhi NCR
 
Call Girls in Pitampura Delhi 💯Call Us 🔝8264348440🔝
Call Girls in Pitampura Delhi 💯Call Us 🔝8264348440🔝Call Girls in Pitampura Delhi 💯Call Us 🔝8264348440🔝
Call Girls in Pitampura Delhi 💯Call Us 🔝8264348440🔝soniya singh
 
Call Girls in Noida Sector 11 Noida 💯Call Us 🔝 9582086666 🔝 South Delhi Escor...
Call Girls in Noida Sector 11 Noida 💯Call Us 🔝 9582086666 🔝 South Delhi Escor...Call Girls in Noida Sector 11 Noida 💯Call Us 🔝 9582086666 🔝 South Delhi Escor...
Call Girls in Noida Sector 11 Noida 💯Call Us 🔝 9582086666 🔝 South Delhi Escor...delhimodel235
 
SVN Live 4.22.24 Weekly Property Broadcast
SVN Live 4.22.24 Weekly Property BroadcastSVN Live 4.22.24 Weekly Property Broadcast
SVN Live 4.22.24 Weekly Property BroadcastSVN International Corp.
 
Call Girls in Janakpuri ↫8447779280↫Short 1500 Night 6000-Escorts Service In ...
Call Girls in Janakpuri ↫8447779280↫Short 1500 Night 6000-Escorts Service In ...Call Girls in Janakpuri ↫8447779280↫Short 1500 Night 6000-Escorts Service In ...
Call Girls in Janakpuri ↫8447779280↫Short 1500 Night 6000-Escorts Service In ...asmaqueen5
 
9990771857 Call Girls in Noida Sector 06 Noida (Call Girls) Delhi
9990771857 Call Girls in Noida Sector 06 Noida (Call Girls) Delhi9990771857 Call Girls in Noida Sector 06 Noida (Call Girls) Delhi
9990771857 Call Girls in Noida Sector 06 Noida (Call Girls) Delhidelhimodel235
 
9990771857 Call Girls in Noida Sector 10 Noida (Call Girls) Delhi
9990771857 Call Girls in Noida Sector 10 Noida (Call Girls) Delhi9990771857 Call Girls in Noida Sector 10 Noida (Call Girls) Delhi
9990771857 Call Girls in Noida Sector 10 Noida (Call Girls) Delhidelhimodel235
 
Call Girls in Khan Market 9654467111 ESCORTS SERVICE
Call Girls in Khan Market 9654467111 ESCORTS SERVICECall Girls in Khan Market 9654467111 ESCORTS SERVICE
Call Girls in Khan Market 9654467111 ESCORTS SERVICESapana Sha
 
Call Girls In Mayur Vihar-1 Delhi ❤️8860477959 Good Looking Escorts In 24/7 D...
Call Girls In Mayur Vihar-1 Delhi ❤️8860477959 Good Looking Escorts In 24/7 D...Call Girls In Mayur Vihar-1 Delhi ❤️8860477959 Good Looking Escorts In 24/7 D...
Call Girls In Mayur Vihar-1 Delhi ❤️8860477959 Good Looking Escorts In 24/7 D...lizamodels9
 

Recently uploaded (20)

9990771857 Call Girls in Noida Sector 1 Noida (Call Girls) Delhi
9990771857 Call Girls in Noida Sector 1 Noida (Call Girls) Delhi9990771857 Call Girls in Noida Sector 1 Noida (Call Girls) Delhi
9990771857 Call Girls in Noida Sector 1 Noida (Call Girls) Delhi
 
Rustomjee The Panorama At Pali Hill, Bandra West, Mumbai - Brochure.pdf
Rustomjee The Panorama At Pali Hill, Bandra West, Mumbai - Brochure.pdfRustomjee The Panorama At Pali Hill, Bandra West, Mumbai - Brochure.pdf
Rustomjee The Panorama At Pali Hill, Bandra West, Mumbai - Brochure.pdf
 
Low Rate Call Girls In Madipur Slum Quarter +91)8447779280Low Rate 2 short 2...
Low Rate Call Girls In Madipur Slum Quarter  +91)8447779280Low Rate 2 short 2...Low Rate Call Girls In Madipur Slum Quarter  +91)8447779280Low Rate 2 short 2...
Low Rate Call Girls In Madipur Slum Quarter +91)8447779280Low Rate 2 short 2...
 
Call Girls In Madipur Metro Delhi꧁ +91)8447779280꧂Low Rate 2 short 2000 full ...
Call Girls In Madipur Metro Delhi꧁ +91)8447779280꧂Low Rate 2 short 2000 full ...Call Girls In Madipur Metro Delhi꧁ +91)8447779280꧂Low Rate 2 short 2000 full ...
Call Girls In Madipur Metro Delhi꧁ +91)8447779280꧂Low Rate 2 short 2000 full ...
 
Model Call Girl in Shastri Nagar Delhi reach out to us at 🔝8264348440🔝
Model Call Girl in Shastri Nagar Delhi reach out to us at 🔝8264348440🔝Model Call Girl in Shastri Nagar Delhi reach out to us at 🔝8264348440🔝
Model Call Girl in Shastri Nagar Delhi reach out to us at 🔝8264348440🔝
 
How to Build Multifamily and Laneway Suites in Toronto!! (feat. Expert Archi...
How to Build Multifamily and Laneway Suites  in Toronto!! (feat. Expert Archi...How to Build Multifamily and Laneway Suites  in Toronto!! (feat. Expert Archi...
How to Build Multifamily and Laneway Suites in Toronto!! (feat. Expert Archi...
 
Nanke Area Estate commercial ( Dir. Kat Kuo)
Nanke Area Estate commercial ( Dir. Kat Kuo)Nanke Area Estate commercial ( Dir. Kat Kuo)
Nanke Area Estate commercial ( Dir. Kat Kuo)
 
Low Rate Call Girls in Triveni Complex Delhi Call 9873940964
Low Rate Call Girls in Triveni Complex Delhi Call 9873940964Low Rate Call Girls in Triveni Complex Delhi Call 9873940964
Low Rate Call Girls in Triveni Complex Delhi Call 9873940964
 
Call Girls in shastri nagar Delhi 8264348440 ✅ call girls ❤️
Call Girls in shastri nagar Delhi 8264348440 ✅ call girls ❤️Call Girls in shastri nagar Delhi 8264348440 ✅ call girls ❤️
Call Girls in shastri nagar Delhi 8264348440 ✅ call girls ❤️
 
9990771857 Call Girls in Noida Sector 34 Noida (Call Girls) Delhi
9990771857 Call Girls in Noida Sector 34 Noida (Call Girls) Delhi9990771857 Call Girls in Noida Sector 34 Noida (Call Girls) Delhi
9990771857 Call Girls in Noida Sector 34 Noida (Call Girls) Delhi
 
call girls in Shahdara (DELHI) 🔝 >༒9953330565🔝 genuine Escort Service 🔝✔️✔️
call girls in Shahdara (DELHI) 🔝 >༒9953330565🔝 genuine Escort Service 🔝✔️✔️call girls in Shahdara (DELHI) 🔝 >༒9953330565🔝 genuine Escort Service 🔝✔️✔️
call girls in Shahdara (DELHI) 🔝 >༒9953330565🔝 genuine Escort Service 🔝✔️✔️
 
Call Girls in Pitampura Delhi 💯Call Us 🔝8264348440🔝
Call Girls in Pitampura Delhi 💯Call Us 🔝8264348440🔝Call Girls in Pitampura Delhi 💯Call Us 🔝8264348440🔝
Call Girls in Pitampura Delhi 💯Call Us 🔝8264348440🔝
 
Call Girls in Noida Sector 11 Noida 💯Call Us 🔝 9582086666 🔝 South Delhi Escor...
Call Girls in Noida Sector 11 Noida 💯Call Us 🔝 9582086666 🔝 South Delhi Escor...Call Girls in Noida Sector 11 Noida 💯Call Us 🔝 9582086666 🔝 South Delhi Escor...
Call Girls in Noida Sector 11 Noida 💯Call Us 🔝 9582086666 🔝 South Delhi Escor...
 
Call Girls in Mahavir Nagar whatsaap call US +919953056974
Call Girls in Mahavir Nagar  whatsaap call US  +919953056974Call Girls in Mahavir Nagar  whatsaap call US  +919953056974
Call Girls in Mahavir Nagar whatsaap call US +919953056974
 
SVN Live 4.22.24 Weekly Property Broadcast
SVN Live 4.22.24 Weekly Property BroadcastSVN Live 4.22.24 Weekly Property Broadcast
SVN Live 4.22.24 Weekly Property Broadcast
 
Call Girls in Janakpuri ↫8447779280↫Short 1500 Night 6000-Escorts Service In ...
Call Girls in Janakpuri ↫8447779280↫Short 1500 Night 6000-Escorts Service In ...Call Girls in Janakpuri ↫8447779280↫Short 1500 Night 6000-Escorts Service In ...
Call Girls in Janakpuri ↫8447779280↫Short 1500 Night 6000-Escorts Service In ...
 
9990771857 Call Girls in Noida Sector 06 Noida (Call Girls) Delhi
9990771857 Call Girls in Noida Sector 06 Noida (Call Girls) Delhi9990771857 Call Girls in Noida Sector 06 Noida (Call Girls) Delhi
9990771857 Call Girls in Noida Sector 06 Noida (Call Girls) Delhi
 
9990771857 Call Girls in Noida Sector 10 Noida (Call Girls) Delhi
9990771857 Call Girls in Noida Sector 10 Noida (Call Girls) Delhi9990771857 Call Girls in Noida Sector 10 Noida (Call Girls) Delhi
9990771857 Call Girls in Noida Sector 10 Noida (Call Girls) Delhi
 
Call Girls in Khan Market 9654467111 ESCORTS SERVICE
Call Girls in Khan Market 9654467111 ESCORTS SERVICECall Girls in Khan Market 9654467111 ESCORTS SERVICE
Call Girls in Khan Market 9654467111 ESCORTS SERVICE
 
Call Girls In Mayur Vihar-1 Delhi ❤️8860477959 Good Looking Escorts In 24/7 D...
Call Girls In Mayur Vihar-1 Delhi ❤️8860477959 Good Looking Escorts In 24/7 D...Call Girls In Mayur Vihar-1 Delhi ❤️8860477959 Good Looking Escorts In 24/7 D...
Call Girls In Mayur Vihar-1 Delhi ❤️8860477959 Good Looking Escorts In 24/7 D...
 

San Francisco market report July 2020

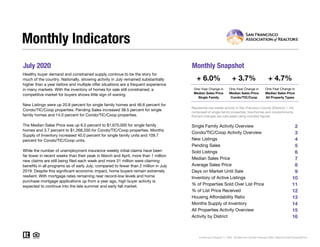
  • 1. July 2020 Monthly Snapshot One-Year Change in One-Year Change in Median Sales Price Single Family Median Sales Price Condo/TIC/Coop 2 3 4 5 6 7 8 9 10 11 12 13 14 15 16 Current as of August 11, 2020. All data from the San Francisco MLS. Report © 2020 ShowingTime. Condo/TIC/Coop Activity Overview Inventory of Active Listings % of Properties Sold Over List Price % of List Price Received Housing Affordability Ratio All Properties Activity Overview New Listings Pending Sales Sold Listings Median Sales Price Average Sales Price Days on Market Until Sale Activity by District Monthly Indicators + 6.0% + 3.7% + 4.7% One-Year Change in Healthy buyer demand and constrained supply continue to be the story for much of the country. Nationally, showing activity in July remained substantially higher than a year before and multiple offer situations are a frequent experience in many markets. With the inventory of homes for sale still constrained, a competitive market for buyers shows little sign of waning. New Listings were up 20.8 percent for single family homes and 46.6 percent for Condo/TIC/Coop properties. Pending Sales increased 38.5 percent for single family homes and 14.0 percent for Condo/TIC/Coop properties. The Median Sales Price was up 6.0 percent to $1,670,000 for single family homes and 3.7 percent to $1,268,200 for Condo/TIC/Coop properties. Months Supply of Inventory increased 40.0 percent for single family units and 109.7 percent for Condo/TIC/Coop units. While the number of unemployment insurance weekly initial claims have been far lower in recent weeks than their peak in March and April, more than 1 million new claims are still being filed each week and more 31 million were claiming benefits in all programs as of early July, compared to fewer than 2 million in July 2019. Despite this significant economic impact, home buyers remain extremely resilient. With mortgage rates remaining near record-low levels and home purchase mortgage applications up from a year ago, high buyer activity is expected to continue into the late summer and early fall market. Median Sales Price All Property Types Residential real estate activity in San Francisco County (Districts 1-10) composed of single-family properties, townhomes and condominiums. Percent changes are calculated using rounded figures. Single Family Activity Overview Months Supply of Inventory
  • 2. Single Family Activity Overview Key metrics by report month and for year-to-date (YTD) starting from the first of the year. Key Metrics Historical Sparkbars 7-2019 7-2020 Percent Change YTD 2019 YTD 2020 Percent Change - 5.3%1,529 958 - 23.5% $1,660,000 + 3.4% + 3.1% Pending Sales 182 252 + 38.5% - 18.0%1,289 1,057 New Listings 197 238 + 20.8% 1,615 Sold Listings 213 211 - 0.9% 1,253 Median Sales Price $1,576,000 $1,670,000 + 6.0% $1,605,000 25 0.0% $2,123,870 -- -- Days on Market 23 26 + 13.0% 25 Avg. Sales Price $1,959,574 $2,089,958 + 6.7% $2,060,010 Active Listings 466 564 + 21.0% -- % of Properties Sold Over List Price 82.6% 64.0% - 22.5% 76.8% 32 65.8% - 14.3% - 3.8% 34 + 6.3% 108.5%% of List Price Received 115.4% 106.3% - 7.9% 112.8% Current as of August 11, 2020. All data from the San Francisco MLS. Report © 2020 ShowingTime. | 2 Months Supply 2.5 3.5 + 40.0% -- -- -- Affordability Ratio 33 34 + 3.0% 7-2017 7-2018 7-2019 7-2020 7-2017 7-2018 7-2019 7-2020 7-2017 7-2018 7-2019 7-2020 7-2017 7-2018 7-2019 7-2020 7-2017 7-2018 7-2019 7-2020 7-2017 7-2018 7-2019 7-2020 7-2017 7-2018 7-2019 7-2020 7-2017 7-2018 7-2019 7-2020 7-2017 7-2018 7-2019 7-2020 7-2017 7-2018 7-2019 7-2020 7-2017 7-2018 7-2019 7-2020
  • 3. Condo/TIC/Coop Activity Overview Key metrics by report month and for year-to-date (YTD) starting from the first of the year. Key Metrics Historical Sparkbars 7-2019 7-2020 Percent Change YTD 2019 YTD 2020 Percent Change + 11.7% Pending Sales 207 236 + 14.0% 1,746 1,270 - 27.3% New Listings 320 469 + 46.6% 2,370 2,648 Sold Listings 244 256 + 4.9% 1,708 1,214 - 28.9% Median Sales Price $1,222,444 $1,268,200 + 3.7% $1,211,000 $1,250,000 + 3.2% + 2.7% 36 + 2.9% $1,381,064 -- -- Days on Market 33 38 + 15.2% 35 Avg. Sales Price $1,310,687 $1,414,347 + 7.9% $1,344,244 Active Listings 734 1,300 + 77.1% -- % of Properties Sold Over List Price 70.5% 46.1% - 34.6% 59.7% 49 48.7% - 18.4% - 3.1% 54 + 10.2% 102.5%% of List Price Received 107.6% 101.2% - 5.9% 105.8% Current as of August 11, 2020. All data from the San Francisco MLS. Report © 2020 ShowingTime. | 3 Months Supply 3.1 6.5 + 109.7% -- -- -- Affordability Ratio 49 53 + 8.2% 7-2017 7-2018 7-2019 7-2020 7-2017 7-2018 7-2019 7-2020 7-2017 7-2018 7-2019 7-2020 7-2017 7-2018 7-2019 7-2020 7-2017 7-2018 7-2019 7-2020 7-2017 7-2018 7-2019 7-2020 7-2017 7-2018 7-2019 7-2020 7-2017 7-2018 7-2019 7-2020 7-2017 7-2018 7-2019 7-2020 7-2017 7-2018 7-2019 7-2020 7-2017 7-2018 7-2019 7-2020
  • 4. New Listings New Listings Single Family Year-Over-Year Change Condo/TIC/ Coop Year-Over-Year Change Aug-2019 246 -1.6% 329 +5.8% Sep-2019 309 -8.6% 508 +11.9% Oct-2019 245 -5.0% 344 +0.9% Nov-2019 136 -14.5% 160 -18.4% Dec-2019 85 +3.7% 132 +8.2% Jan-2020 222 -1.3% 374 +4.5% Feb-2020 242 +28.0% 382 +24.8% Mar-2020 152 -37.4% 242 -31.1% Apr-2020 148 -41.3% 211 -44.0% May-2020 244 -11.3% 474 +28.1% Jun-2020 283 +20.9% 496 +72.2% Jul-2020 238 +20.8% 469 +46.6% 12-Month Avg 213 -5.6% 343 +8.6% Historical New Listings by Month Current as of August 11, 2020. All data from the San Francisco MLS. Report © 2020 ShowingTime. | 4 A count of the properties that have been newly listed on the market in a given month. 239 262 197 320 238 469 Single Family Condo/TIC/Coop July 0 100 200 300 400 500 600 700 1-2005 1-2006 1-2007 1-2008 1-2009 1-2010 1-2011 1-2012 1-2013 1-2014 1-2015 1-2016 1-2017 1-2018 1-2019 1-2020 Single Family Condo/TIC/Coop 1,721 2,473 1,615 2,370 1,529 2,648 Single Family Condo/TIC/Coop Year to Date 2018 2019 2020 + 46.6%+ 22.1%+ 20.8%- 17.6% - 4.2%- 5.3%- 6.2% + 11.7% 2018 2019 2020 2018 2019 2020 2018 2019 2020 + 13.3% + 6.0% + 10.3%- 4.4%
  • 5. Pending Sales Pending Sales Single Family Year-Over-Year Change Condo/TIC/ Coop Year-Over-Year Change Aug-2019 149 -12.4% 212 -8.6% Sep-2019 195 +1.0% 228 +4.1% Oct-2019 247 -1.6% 303 +4.5% Nov-2019 190 +1.6% 233 +5.0% Dec-2019 113 -6.6% 155 +5.4% Jan-2020 101 +13.5% 157 +29.8% Feb-2020 134 -6.9% 235 +3.1% Mar-2020 153 -27.1% 182 -39.1% Apr-2020 72 -67.6% 89 -71.4% May-2020 149 -39.9% 141 -58.0% Jun-2020 196 +1.0% 230 -5.7% Jul-2020 252 +38.5% 236 +14.0% 12-Month Avg 163 -11.8% 200 -15.9% Historical Pending Sales by Month Current as of August 11, 2020. All data from the San Francisco MLS. Report © 2020 ShowingTime. | 5 A count of the properties on which offers have been accepted in a given month. 165 247 182 207 252 236 Single Family Condo/TIC/Coop July 0 100 200 300 400 1-2005 1-2006 1-2007 1-2008 1-2009 1-2010 1-2011 1-2012 1-2013 1-2014 1-2015 1-2016 1-2017 1-2018 1-2019 1-2020 Single Family Condo/TIC/Coop 1,311 1,873 1,289 1,746 1,057 1,270 Single Family Condo/TIC/Coop Year to Date 2018 2019 2020 + 14.0%- 16.2%+ 38.5%+ 10.3% - 6.8%- 18.0%- 1.7% - 27.3% 2018 2019 2020 2018 2019 2020 2018 2019 2020 - 4.6% + 0.8% + 11.0%+ 18.2%
  • 6. Sold Listings Sold Listings Single Family Year-Over-Year Change Condo/TIC/ Coop Year-Over-Year Change Aug-2019 168 -12.0% 207 -20.4% Sep-2019 127 -13.6% 192 +4.9% Oct-2019 255 +2.8% 259 -11.6% Nov-2019 200 -9.1% 272 +3.0% Dec-2019 175 +9.4% 216 +11.3% Jan-2020 96 -4.0% 150 +31.6% Feb-2020 115 +1.8% 179 +9.1% Mar-2020 162 -5.8% 229 -13.6% Apr-2020 104 -54.0% 114 -64.3% May-2020 105 -56.1% 109 -67.7% Jun-2020 165 -13.2% 177 -33.2% Jul-2020 211 -0.9% 256 +4.9% 12-Month Avg 157 -15.1% 197 -18.7% Historical Sold Listings by Month Current as of August 11, 2020. All data from the San Francisco MLS. Report © 2020 ShowingTime. | 6 A count of the actual sales that closed in a given month. 192 274 213 244 211 256 Single Family Condo/TIC/Coop July 0 100 200 300 400 1-2005 1-2006 1-2007 1-2008 1-2009 1-2010 1-2011 1-2012 1-2013 1-2014 1-2015 1-2016 1-2017 1-2018 1-2019 1-2020 Single Family Condo/TIC/Coop 1,264 1,825 1,253 1,708 958 1,214 Single Family Condo/TIC/Coop Year to Date 2018 2019 2020 + 4.9%- 10.9%- 0.9%+ 10.9% - 6.4%- 23.5%- 0.9% - 28.9% 2018 2019 2020 2018 2019 2020 2018 2019 2020 - 8.6% + 1.0% + 9.9%+ 14.6%
  • 7. Median Sales Price Median Sales Price Single Family Year-Over-Year Change Condo/TIC/ Coop Year-Over-Year Change Aug-2019 $1,602,500 +4.2% $1,281,250 +3.8% Sep-2019 $1,530,000 +2.0% $1,325,000 +15.2% Oct-2019 $1,650,000 +3.1% $1,325,000 +9.1% Nov-2019 $1,604,000 +12.4% $1,180,000 -1.1% Dec-2019 $1,450,000 -2.8% $1,198,283 +2.4% Jan-2020 $1,462,500 +5.3% $1,172,000 +12.7% Feb-2020 $1,610,000 +7.3% $1,300,000 +15.0% Mar-2020 $1,650,000 0.0% $1,262,000 +1.4% Apr-2020 $1,687,000 +4.6% $1,294,000 +5.6% May-2020 $1,630,000 -3.3% $1,100,222 -11.6% Jun-2020 $1,805,000 +3.1% $1,200,000 -7.6% Jul-2020 $1,670,000 +6.0% $1,268,200 +3.7% 12-Month Avg* $1,625,000 +3.2% $1,255,000 +4.5% Historical Median Sales Price by Month * Median Sales Price for all properties from August 2019 through July 2020. This is not the average of the individual figures above. Current as of August 11, 2020. All data from the San Francisco MLS. Report © 2020 ShowingTime. | 7 Point at which half of the sales sold for more and half sold for less, not accounting for seller concessions, in a given month. $1,626,250 $1,150,000 $1,576,000 $1,222,444 $1,670,000 $1,268,200 Single Family Condo/TIC/Coop July $500,000 $750,000 $1,000,000 $1,250,000 $1,500,000 $1,750,000 $2,000,000 1-2005 1-2006 1-2007 1-2008 1-2009 1-2010 1-2011 1-2012 1-2013 1-2014 1-2015 1-2016 1-2017 1-2018 1-2019 1-2020 Single Family Condo/TIC/Coop $1,620,000 $1,200,000 $1,605,000 $1,211,000 $1,660,000 $1,250,000 Single Family Condo/TIC/Coop Year to Date 2018 2019 2020 + 3.7%+ 6.3%+ 6.0%- 3.1% + 0.9%+ 3.4%- 0.9% + 3.2% 2018 2019 2020 2018 2019 2020 2018 2019 2020 + 16.2% + 15.7% + 6.3%0.0%
  • 8. Average Sales Price Avg. Sales Price Single Family Year-Over-Year Change Condo/TIC/ Coop Year-Over-Year Change Aug-2019 $1,872,478 +3.3% $1,386,808 +2.9% Sep-2019 $2,065,723 +13.6% $1,449,604 +15.4% Oct-2019 $1,912,555 -11.1% $1,447,421 +7.8% Nov-2019 $1,986,456 +6.6% $1,322,998 +4.7% Dec-2019 $1,948,749 +9.1% $1,261,689 -5.1% Jan-2020 $2,212,609 +26.3% $1,319,209 +12.1% Feb-2020 $1,953,875 +4.4% $1,404,496 +3.0% Mar-2020 $2,084,487 +1.9% $1,380,103 +3.3% Apr-2020 $2,324,543 +4.0% $1,381,974 +1.4% May-2020 $1,900,955 -11.2% $1,289,927 -3.4% Jun-2020 $2,288,124 +6.5% $1,418,428 -0.9% Jul-2020 $2,089,958 +6.7% $1,414,347 +7.9% 12-Month Avg* $2,038,032 +2.2% $1,376,808 +3.5% Historical Average Sales Price by Month * Avg. Sales Price for all properties from August 2019 through July 2020. This is not the average of the individual figures above. Current as of August 11, 2020. All data from the San Francisco MLS. Report © 2020 ShowingTime. | 8 Average sales price for all closed sales, not accounting for seller concessions, in a given month. $1,969,483 $1,239,099 $1,959,574 $1,310,687 $2,089,958 $1,414,347 Single Family Condo/TIC/Coop July $500,000 $1,000,000 $1,500,000 $2,000,000 $2,500,000 1-2005 1-2006 1-2007 1-2008 1-2009 1-2010 1-2011 1-2012 1-2013 1-2014 1-2015 1-2016 1-2017 1-2018 1-2019 1-2020 Single Family Condo/TIC/Coop $2,002,019 $1,328,891 $2,060,010 $1,344,244 $2,123,870 $1,381,064 Single Family Condo/TIC/Coop Year to Date 2018 2019 2020 + 7.9%+ 5.8%+ 6.7%- 0.5% + 1.2%+ 3.1%+ 2.9% + 2.7% 2018 2019 2020 2018 2019 2020 2018 2019 2020 + 13.3% + 12.2% + 2.3%- 0.3%
  • 9. Days on Market Until Sale Days on Market Single Family Year-Over-Year Change Condo/TIC/ Coop Year-Over-Year Change Aug-2019 25 +13.6% 33 -8.3% Sep-2019 28 +16.7% 34 +13.3% Oct-2019 22 -8.3% 28 +3.7% Nov-2019 24 -7.7% 34 -10.5% Dec-2019 31 -6.1% 49 +11.4% Jan-2020 38 -2.6% 62 +12.7% Feb-2020 25 -13.8% 29 -27.5% Mar-2020 20 -23.1% 28 -20.0% Apr-2020 21 -19.2% 32 -15.8% May-2020 24 +9.1% 39 +34.5% Jun-2020 25 +13.6% 34 +9.7% Jul-2020 26 +13.0% 38 +15.2% 12-Month Avg* 25 -0.6% 36 +2.5% Historical Days on Market Until Sale by Month * Days on Market for all properties from August 2019 through July 2020. This is not the average of the individual figures above. Current as of August 11, 2020. All data from the San Francisco MLS. Report © 2020 ShowingTime. | 9 Average number of days between when a property is listed and when an offer is accepted in a given month. 21 31 23 33 26 38 Single Family Condo/TIC/Coop July 0 20 40 60 80 100 120 1-2005 1-2006 1-2007 1-2008 1-2009 1-2010 1-2011 1-2012 1-2013 1-2014 1-2015 1-2016 1-2017 1-2018 1-2019 1-2020 Single Family Condo/TIC/Coop 21 31 25 35 25 36 Single Family Condo/TIC/Coop Year to Date 2018 2019 2020 + 15.2%+ 6.5%+ 13.0%+ 9.5% + 12.9%0.0%+ 19.0% + 2.9% 2018 2019 2020 2018 2019 2020 2018 2019 2020 - 12.5% - 25.0% - 13.9%- 6.1%
  • 10. Inventory of Active Listings Active Listings Single Family Year-Over-Year Change Condo/TIC/ Coop Year-Over-Year Change Aug-2019 519 +5.5% 759 +13.1% Sep-2019 595 +0.3% 963 +13.2% Oct-2019 548 +1.1% 919 +9.9% Nov-2019 447 -3.7% 756 +5.7% Dec-2019 335 +1.8% 556 +9.4% Jan-2020 438 -2.2% 738 +7.1% Feb-2020 530 +15.0% 828 +15.2% Mar-2020 478 +1.5% 742 +3.8% Apr-2020 526 +8.7% 808 +9.9% May-2020 598 +25.9% 1,067 +45.8% Jun-2020 636 +28.7% 1,193 +66.4% Jul-2020 564 +21.0% 1,300 +77.1% 12-Month Avg* 518 +8.7% 886 +23.3% Historical Inventory of Active Listings by Month * Active Listings for all properties from August 2019 through July 2020. This is not the average of the individual figures above. Current as of August 11, 2020. All data from the San Francisco MLS. Report © 2020 ShowingTime. | 10 The number of properties available for sale in active status at the end of a given month. 462 658 466 734 564 1,300 Single Family Condo/TIC/Coop July 0 250 500 750 1,000 1,250 1,500 1-2005 1-2006 1-2007 1-2008 1-2009 1-2010 1-2011 1-2012 1-2013 1-2014 1-2015 1-2016 1-2017 1-2018 1-2019 1-2020 Single Family Condo/TIC/Coop 2018 2019 2020 + 77.1%+ 11.6%+ 21.0%+ 0.9% 2018 2019 2020 + 17.9% + 9.1%
  • 11. % of Properties Sold Over List Price % of Properties Sold Over List Price Single Family Year-Over-Year Change Condo/TIC/ Coop Year-Over-Year Change Aug-2019 82.1% +1.9% 58.9% +2.1% Sep-2019 74.0% -8.6% 59.4% -6.3% Oct-2019 80.8% -2.3% 65.3% -4.4% Nov-2019 77.5% +5.3% 64.3% +18.0% Dec-2019 66.3% -2.6% 47.7% +3.9% Jan-2020 60.4% +0.7% 33.3% -19.2% Feb-2020 72.2% -7.3% 62.6% +18.1% Mar-2020 78.4% +7.0% 60.3% +8.1% Apr-2020 69.2% -6.4% 59.6% +8.0% May-2020 62.9% -21.3% 42.2% -35.1% Jun-2020 53.9% -33.5% 33.3% -48.4% Jul-2020 64.0% -22.5% 46.1% -34.6% 12-Month Avg 71.1% -7.8% 54.0% -8.9% Historical % of Properties Sold Over List Price by Month * % of Properties Sold Over List Price for all properties from August 2019 through July 2020. This is not the average of the individual figures above. Current as of August 11, 2020. All data from the San Francisco MLS. Report © 2020 ShowingTime. | 11 Percentage found when dividing the number of properties sold by properties sold over its original list price, not accounting for seller concessions. 85.4% 63.1% 82.6% 70.5% 64.0% 46.1% Single Family Condo/TIC/Coop July 0.0% 20.0% 40.0% 60.0% 80.0% 100.0% 1-2005 1-2006 1-2007 1-2008 1-2009 1-2010 1-2011 1-2012 1-2013 1-2014 1-2015 1-2016 1-2017 1-2018 1-2019 1-2020 Single Family Condo/TIC/Coop 81.8% 61.8% 76.8% 59.7% 65.8% 48.7% Single Family Condo/TIC/Coop Year to Date 2018 2019 2020 - 34.6%+ 11.7%- 22.5%- 3.3% - 3.4%- 14.3%- 6.1% - 18.4% 2018 2019 2020 2018 2019 2020 2018 2019 2020 + 4.9% + 6.0% + 5.1%+ 0.5%
  • 12. % of List Price Received % of List Price Received Single Family Year-Over-Year Change Condo/TIC/ Coop Year-Over-Year Change Aug-2019 115.3% +0.4% 105.8% +0.2% Sep-2019 112.4% -2.5% 105.2% -1.2% Oct-2019 114.0% 0.0% 105.9% -1.7% Nov-2019 111.9% +0.6% 105.1% +1.0% Dec-2019 109.7% -0.7% 103.1% +1.0% Jan-2020 107.1% +1.0% 100.4% -0.6% Feb-2020 111.9% -0.6% 105.2% +1.0% Mar-2020 114.5% +3.6% 104.3% -0.4% Apr-2020 109.0% -3.0% 105.5% +0.6% May-2020 106.1% -6.3% 100.6% -6.3% Jun-2020 105.3% -8.7% 100.2% -6.5% Jul-2020 106.3% -7.9% 101.2% -5.9% 12-Month Avg* 110.6% -2.0% 103.7% -1.8% Historical % of List Price Received by Month * % of List Price Received for all properties from August 2019 through July 2020. This is not the average of the individual figures above. Current as of August 11, 2020. All data from the San Francisco MLS. Report © 2020 ShowingTime. | 12 Percentage found when dividing a property’s sales price by its most recent list price, then taking the average for all properties sold in a given month, not accounting for seller concessions. 117.2% 107.1% 115.4% 107.6%106.3% 101.2% Single Family Condo/TIC/Coop July 118.1% 107.0% 112.8% 105.8%108.5% 102.5% Single Family Condo/TIC/Coop Year to Date 90.0% 100.0% 110.0% 120.0% 130.0% 1-2005 1-2006 1-2007 1-2008 1-2009 1-2010 1-2011 1-2012 1-2013 1-2014 1-2015 1-2016 1-2017 1-2018 1-2019 1-2020 Single Family Condo/TIC/Coop 2018 2019 2020 - 5.9%+ 0.5%- 7.9%- 1.5% 2018 2019 2020 + 0.1% + 1.0% 2018 2019 2020 - 3.1%- 1.1%- 3.8%- 4.5% 2018 2019 2020 + 3.0% + 2.0%
  • 13. Housing Affordability Ratio Affordability Ratio Single Family Year-Over-Year Change Condo/TIC/ Coop Year-Over-Year Change Aug-2019 34 +9.7% 49 +8.9% Sep-2019 35 +12.9% 47 0.0% Oct-2019 33 +17.9% 48 +17.1% Nov-2019 33 +3.1% 52 +20.9% Dec-2019 36 +9.1% 51 +6.3% Jan-2020 37 +5.7% 54 0.0% Feb-2020 34 +3.0% 49 -3.9% Mar-2020 32 +6.7% 49 +4.3% Apr-2020 33 +6.5% 50 +4.2% May-2020 34 +13.3% 58 +23.4% Jun-2020 31 +6.9% 55 +22.2% Jul-2020 34 +3.0% 53 +8.2% 12-Month Avg* 34 +8.6% 31 +12.5% Historical Housing Affordability Ratio by Month * Affordability Ratio for all properties from August 2019 through July 2020. This is not the average of the individual figures above. Current as of August 11, 2020. All data from the San Francisco MLS. Report © 2020 ShowingTime. | 13 This index measures housing affordability for the region. For example, an index of 120 means the median household income is 120% of what is necessary to qualify for the median-priced home under prevailing interest rates. A higher number means greater affordability. 30 49 33 49 34 53 Single Family Condo/TIC/Coop July 20 40 60 80 100 1-2005 1-2006 1-2007 1-2008 1-2009 1-2010 1-2011 1-2012 1-2013 1-2014 1-2015 1-2016 1-2017 1-2018 1-2019 1-2020 Single Family Condo/TIC/Coop 2018 2019 2020 + 8.2%0.0%+ 3.0%+ 10.0% 2018 2019 2020 - 18.9% - 5.8% 30 47 32 49 34 54 Single Family Condo/TIC/Coop Year to Date 2018 2019 2020 + 10.2%+ 4.3%+ 6.3%+ 6.7% 2018 2019 2020 - 18.9% - 11.3%
  • 14. Months Supply of Inventory Months Supply Single Family Year-Over-Year Change Condo/TIC/ Coop Year-Over-Year Change Aug-2019 2.8 +7.7% 3.2 +23.1% Sep-2019 3.3 +3.1% 4.1 +24.2% Oct-2019 3.0 +3.4% 3.9 +18.2% Nov-2019 2.4 -4.0% 3.2 +14.3% Dec-2019 1.8 0.0% 2.3 +15.0% Jan-2020 2.4 0.0% 3.0 +7.1% Feb-2020 2.9 +16.0% 3.4 +17.2% Mar-2020 2.7 +3.8% 3.2 +6.7% Apr-2020 3.2 +23.1% 3.8 +26.7% May-2020 3.8 +46.2% 5.4 +80.0% Jun-2020 4.1 +51.9% 6.0 +100.0% Jul-2020 3.5 +40.0% 6.5 +109.7% 12-Month Avg* 3.0 +16.3% 4.0 +37.3% Historical Months Supply of Inventory by Month * Months Supply for all properties from August 2019 through July 2020. This is not the average of the individual figures above. Current as of August 11, 2020. All data from the San Francisco MLS. Report © 2020 ShowingTime. | 14 The inventory of homes for sale at the end of a given month, divided by the average monthly pending sales from the last 12 months. 2.4 2.62.5 3.1 3.5 6.5 Single Family Condo/TIC/Coop July 0.0 2.0 4.0 6.0 8.0 10.0 1-2005 1-2006 1-2007 1-2008 1-2009 1-2010 1-2011 1-2012 1-2013 1-2014 1-2015 1-2016 1-2017 1-2018 1-2019 1-2020 Single Family Condo/TIC/Coop 2018 2019 2020 + 109.7%+ 19.2%+ 40.0%+ 4.2% 2018 2019 2020 + 14.3% 0.0%
  • 15. All Properties Activity Overview Key metrics by report month and for year-to-date (YTD) starting from the first of the year. Key Metrics Historical Sparkbars 7-2019 7-2020 Percent Change YTD 2019 YTD 2020 Percent Change + 4.8% Pending Sales 389 488 + 25.4% 3,035 2,327 - 23.3% New Listings 517 707 + 36.8% 3,985 4,177 Sold Listings 457 467 + 2.2% 2,961 2,172 - 26.6% Median Sales Price $1,385,000 $1,450,000 + 4.7% $1,375,000 $1,440,000 + 4.7% + 3.7% 31 0.0% $1,708,692 -- -- Days on Market 28 32 + 14.3% 31 Avg. Sales Price $1,613,122 $1,719,602 + 6.6% $1,647,133 Active Listings 1,200 1,864 + 55.3% -- % of Properties Sold Over List Price 76.1% 54.2% - 28.8% 66.9% 37 56.2% - 16.0% - 3.3% 40 + 8.1% 105.1%% of List Price Received 111.2% 103.5% - 6.9% 108.7% Current as of August 11, 2020. All data from the San Francisco MLS. Report © 2020 ShowingTime. | 15 Months Supply 2.8 5.1 + 82.1% -- -- -- Affordability Ratio 37 39 + 5.4% 7-2017 7-2018 7-2019 7-2020 7-2017 7-2018 7-2019 7-2020 7-2017 7-2018 7-2019 7-2020 7-2017 7-2018 7-2019 7-2020 7-2017 7-2018 7-2019 7-2020 7-2017 7-2018 7-2019 7-2020 7-2017 7-2018 7-2019 7-2020 7-2017 7-2018 7-2019 7-2020 7-2017 7-2018 7-2019 7-2020 7-2017 7-2018 7-2019 7-2020 7-2017 7-2018 7-2019 7-2020
  • 16. Activity by District SF District 1: Northwest (Sea Cliff, Lake, Jordan Park / Laurel Heights, Outer Richmond, Central Richmond, Inner Richmond, Lone Mountain) SF District 2: Central West (Outer Sunset, Central Sunset, Inner Sunset, Outer Parkside, Parkside, Inner Parkside, Golden Gate Heights) SF District 3: Southwest (Pine Lake Park, Lake Shore, Merced Manor, Stonestown, Lakeside, Merced Heights, Ingleside, Ingleside Heights, Oceanview) SF District 4: Twin Peaks W (Forest Hill (& Ext), W Portal, St Francis Wd, Balboa Terr, Mt Dav Manor, Ingleside Terr, Monterey Hts, Wstwd Pk & H'lnds, Shrwd Fst, Miraloma Pk, Dmnd Hts, Mdtwn Terr) SF District 5: Central (Haight Ashbury, Cole Vly / Prnssus Hts, Clarndn Hts, Corona Hts, Twin Pks, Glen Pk, Noe Vly, Eureka Vly / Dolores Hts, Mission Dolores, Duboce Trngl, Buena Vista / Ashbury Hts) SF District 6: Central North (Lower Pacific Heights, Anza Vista, Western Addition, North Panhandle, Alamo Square, Hayes Valley) SF District 7: North (Marina, Cow Hollow, Presidio Heights, Pacific Heights) SF District 8: Northeast (North Waterfront, North Beach, Russian Hill, Telegraph Hill, Nob Hill, Financial District / Barbary Coast, Downtown, Van Ness / Civic Center, Tenderloin) SF District 9: Central East (Yerba Buena, South Beach, South of Market, Mission Bay, Inner Mission, Potrero Hill, Central Waterfront / Dogpatch, Bernal Heights) SF District 10: Southeast (Outer Mission, Mission Terr, Excelsior, Portola, Bayview, Silver Terr, Hunters Pt, Candlestick Pt, Bayview Hts, Little Hollywood, Visitation Vly, Crocker Amazon) 7-2019 7-2020 + / – 7-2019 7-2020 + / – 7-2019 7-2020 + / – 7-2019 7-2020 + / – 7-2019 7-2020 + / – Single Family 1 SF District 1 34 50 +47.1% 17 21 +23.5% $1,958,000 $2,300,000 +17.5% 43 35 -18.6% 2.2 3.2 +45.5% 2 SF District 2 56 54 -3.6% 39 28 -28.2% $1,407,000 $1,475,000 +4.8% 19 14 -26.3% 1.8 1.9 +5.6% 3 SF District 3 26 37 +42.3% 17 12 -29.4% $1,305,000 $1,155,250 -11.5% 20 27 +35.0% 2.2 3.6 +63.6% 4 SF District 4 38 54 +42.1% 29 31 +6.9% $1,750,000 $1,560,000 -10.9% 21 21 0.0% 1.4 2.5 +78.6% 5 SF District 5 68 100 +47.1% 43 45 +4.7% $2,315,000 $2,395,000 +3.5% 21 23 +9.5% 2.4 3.9 +62.5% 6 SF District 6 19 19 0.0% 3 5 +66.7% $2,275,000 $2,600,000 +14.3% 31 29 -6.5% 4.9 5.8 +18.4% 7 SF District 7 47 51 +8.5% 2 11 +450.0% $7,535,000 $4,267,500 -43.4% 33 66 +100.0% 5.9 6.8 +15.3% 8 SF District 8 22 25 +13.6% 1 2 +100.0% $3,600,000 $4,212,500 +17.0% 21 30 +42.9% 10.1 12.5 +23.8% 9 SF District 9 59 74 +25.4% 24 25 +4.2% $1,700,000 $1,725,000 +1.5% 19 15 -21.1% 3.1 4.2 +35.5% 10 SF District 10 97 100 +3.1% 38 31 -18.4% $1,022,500 $1,200,000 +17.4% 23 34 +47.8% 2.6 3.3 +26.9% Condo/TIC/Coop 1 SF District 1 30 35 +16.7% 15 19 +26.7% $1,410,000 $1,275,000 -9.6% 21 38 +81.0% 2.2 3.1 +40.9% 2 SF District 2 15 20 +33.3% 3 6 +100.0% $1,250,000 $1,357,500 +8.6% 28 30 +7.1% 4.1 4.5 +9.8% 3 SF District 3 7 15 +114.3% 2 2 0.0% $822,500 $972,500 +18.2% 104 19 -81.7% 2.3 5.2 +126.1% 4 SF District 4 10 18 +80.0% 4 5 +25.0% $657,000 $675,000 +2.7% 76 13 -82.9% 1.9 3.4 +78.9% 5 SF District 5 85 155 +82.4% 38 47 +23.7% $1,502,500 $1,475,000 -1.8% 18 31 +72.2% 2.5 4.7 +88.0% 6 SF District 6 53 92 +73.6% 24 22 -8.3% $1,287,500 $1,185,000 -8.0% 47 33 -29.8% 2.5 5.0 +100.0% 7 SF District 7 62 127 +104.8% 22 31 +40.9% $1,455,000 $1,700,000 +16.8% 24 30 +25.0% 2.5 5.5 +120.0% 8 SF District 8 155 246 +58.7% 48 38 -20.8% $942,500 $1,217,500 +29.2% 46 52 +13.0% 3.8 8.0 +110.5% 9 SF District 9 288 544 +88.9% 76 81 +6.6% $1,252,500 $1,120,000 -10.6% 29 41 +41.4% 3.4 8.0 +135.3% 10 SF District 10 29 48 +65.5% 12 5 -58.3% $842,500 $973,000 +15.5% 31 47 +51.6% 4.6 11.8 +156.5% Key metrics by report month for the districts of San Fransisco. Current as of August 11, 2020. All data from the San Francisco MLS. Report © 2020 ShowingTime. | 16 Active Listings Sold Listings Median Sales Price Days on Market Months Supply