The accompanying data file contains 28 observations with three variables, x1,x2, and x3. Click
here for the Excel Data File a. Using the original values, compute the Euclidean distance for all
possible pairs of the first three observations. Note: Round intermediate calculations to at least 4
decimal places and your final answers to 2 decimal places. b. Use z-scores to standardize the
values, and then compute the Euclidean distance for all possible pairs of the first three
observations. Note: Round intermediate calculations to at least 4 decimal places and your final
answers to 2 decimal places.
c-1. Using the original values, compute the Manhattan distance for all possible pairs of the first
three observations. Note: Round your final answers to 2 decimal places. c-2. Using the z-score
standardized values, compute the Manhattan distance for all possible pairs of the first three
observations. Note: Round intermediate calculations to at least 4 decimal places and your final
answers to 2 decimal places.
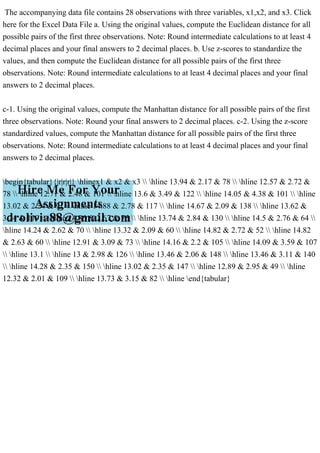
\begin{tabular}{|r|r|r|} \hlinex1 & x2 & x3 \\ \hline 13.94 & 2.17 & 78 \\ \hline 12.57 & 2.72 &
78 \\ \hline 12.71 & 2.48 & 101 \\ \hline 13.6 & 3.49 & 122 \\ \hline 14.05 & 4.38 & 101 \\ \hline
13.02 & 2.24 & 91 \\ \hline 14.88 & 2.78 & 117 \\ \hline 14.67 & 2.09 & 138 \\ \hline 13.62 &
3.24 & 119 \\ \hline 14.86 & 2.67 & 75 \\ \hline 13.74 & 2.84 & 130 \\ \hline 14.5 & 2.76 & 64 \\
\hline 14.24 & 2.62 & 70 \\ \hline 13.32 & 2.09 & 60 \\ \hline 14.82 & 2.72 & 52 \\ \hline 14.82
& 2.63 & 60 \\ \hline 12.91 & 3.09 & 73 \\ \hline 14.16 & 2.2 & 105 \\ \hline 14.09 & 3.59 & 107
\\ \hline 13.1 \\ \hline 13 & 2.98 & 126 \\ \hline 13.46 & 2.06 & 148 \\ \hline 13.46 & 3.11 & 140
\\ \hline 14.28 & 2.35 & 150 \\ \hline 13.02 & 2.35 & 147 \\ \hline 12.89 & 2.95 & 49 \\ \hline
12.32 & 2.01 & 109 \\ \hline 13.73 & 3.15 & 82 \\ \hline \end{tabular}.
The accompanying data file contains 28 observations with three variab.pdf
1. The accompanying data file contains 28 observations with three variables, x1,x2, and x3. Click
here for the Excel Data File a. Using the original values, compute the Euclidean distance for all
possible pairs of the first three observations. Note: Round intermediate calculations to at least 4
decimal places and your final answers to 2 decimal places. b. Use z-scores to standardize the
values, and then compute the Euclidean distance for all possible pairs of the first three
observations. Note: Round intermediate calculations to at least 4 decimal places and your final
answers to 2 decimal places.
c-1. Using the original values, compute the Manhattan distance for all possible pairs of the first
three observations. Note: Round your final answers to 2 decimal places. c-2. Using the z-score
standardized values, compute the Manhattan distance for all possible pairs of the first three
observations. Note: Round intermediate calculations to at least 4 decimal places and your final
answers to 2 decimal places.
begin{tabular}{|r|r|r|} hlinex1 & x2 & x3 hline 13.94 & 2.17 & 78 hline 12.57 & 2.72 &
78 hline 12.71 & 2.48 & 101 hline 13.6 & 3.49 & 122 hline 14.05 & 4.38 & 101 hline
13.02 & 2.24 & 91 hline 14.88 & 2.78 & 117 hline 14.67 & 2.09 & 138 hline 13.62 &
3.24 & 119 hline 14.86 & 2.67 & 75 hline 13.74 & 2.84 & 130 hline 14.5 & 2.76 & 64
hline 14.24 & 2.62 & 70 hline 13.32 & 2.09 & 60 hline 14.82 & 2.72 & 52 hline 14.82
& 2.63 & 60 hline 12.91 & 3.09 & 73 hline 14.16 & 2.2 & 105 hline 14.09 & 3.59 & 107
hline 13.1 hline 13 & 2.98 & 126 hline 13.46 & 2.06 & 148 hline 13.46 & 3.11 & 140
hline 14.28 & 2.35 & 150 hline 13.02 & 2.35 & 147 hline 12.89 & 2.95 & 49 hline
12.32 & 2.01 & 109 hline 13.73 & 3.15 & 82 hline end{tabular}