This document summarizes a research study that examines the relationship between corporate social responsibility (CSR) and firms' financial performance. The study aims to investigate how CSR perception and disclosure can affect accounting-based, market-based, and perception-based financial performance, through the mediation of competitive advantage. It also examines how the relationships are moderated by family ownership and CEO narcissism. The study uses a resource-based view theoretical framework and collects data from 60 manufacturing firms in Pakistan to test hypotheses about the direct, indirect, and moderated relationships between CSR and financial performance. The results found that competitive advantage significantly mediates the indirect impact of perceived CSR and disclosure on financial performance, and this relationship is strengthened by family ownership and CEO
1. sustainability
Article
Corporate Social Responsibility and Firms’ Financial
Performance: A New Insight
Faisal Mahmood 1,* , Faisal Qadeer 1, Usman Sattar 2,* , Antonio Ariza-Montes 3,4 ,
Maria Saleem 1 and Jaffar Aman 5
1 Lahore Business School, The University of Lahore, Lahore 54000, Pakistan; drfaisalqadeer@gmail.com (F.Q.);
mariyasaleem1989@gmail.com (M.S.)
2 Department of Social Work, College of Law and Political Science, Zhejiang Normal University,
Jinhua 321004, China
3 Management Department, Universidad Loyola Andalucía, 14004 Córdoba, Spain; ariza@uloyola.es
4 Facultad de Administración y Negocios, Universidad Autónoma de Chile, Santiago 425, Chile
5 Postdoctoral Station of Public Administration and Sociology, Hohai University, Nanjing 210000, China;
amanjafar5@yahoo.com
* Correspondence: usman@zjnu.edu.cn (U.S.); faisalch62@gmail.com (F.M.); Tel.: +92-301-7122707 (F.M.)
Received: 29 March 2020; Accepted: 19 May 2020; Published: 21 May 2020
Abstract: A vast stream of literature has investigated the effect of corporate social responsibility (CSR)
on firms’ financial performance (FFP). However, this effect has remained unclear and undecided.
For instance, numerous studies have examined the direct impact of firms’ CSR initiatives on FFP,
as well as examining various mechanisms to explain this relationship, but found inconsistent
results. The indecisive results indicate that researchers lack consensus to define a mechanism
to understand how and under what conditions CSR can affect FFP. Thus, this research aims to
investigate how firms’ CSR perception and disclosure derive accounting- (return on equity: ROE,
earnings per share: EPS), market- (Tobin Q) and perception-based firms’ financial performance
through the mediation of competitive advantage and boundary conditions of family ownership and
CEO narcissism. This research underpins the theoretical lens of the resource-based view to derive
hypotheses. The research design employed in this study is quantitative, and the approach to theory
development is deductive. Multi-method and multi-source data with temporal breaks are collected
from 60 manufacturing firms listed on the Pakistan Stock Exchange (PSE). Primary data are collected
from the top and middle managers, while secondary data are collected from the annual reports
published by these firms. This research found that competitive advantage significantly mediated the
indirect impact of perceived CSR and disclosure on FFP. Further, this relationship is strengthened by
the contingencies of family ownership and CEO narcissism. Our results will assist the management
of the firms to understand the implications of CSR perceptions and disclosure to derive a competitive
advantage that ultimately translates into the firms’ financial performance. Further, this research also
revealed that managers should concentrate on the boundary conditions of family ownership and
CEO narcissism as well. In particular, this research contributes to understand why CSR is viewed to
have a strategic importance for the firms and how a resource-based perspective might be utilized in
such endeavors.
Keywords: CSR perception and disclosure; financial performance; competitive advantage; family
ownership; CEO narcissism
Sustainability 2020, 12, 4211; doi:10.3390/su12104211 www.mdpi.com/journal/sustainability
2. Sustainability 2020, 12, 4211 2 of 19
1. Introduction
Academics in the field of management and finance consider corporate social responsibility
(CSR) an indispensable topic of research, and several organizations are also actively getting engaged
in CSR activities [1,2]. CSR investments provide various benefits to the firms that may enhance
their financial performance, i.e., access to funds, low financing cost, an increase in stock returns,
and customer loyalty [3]. Organizations’ CSR initiatives also help them to cope with the uncertain
business environment, such as today’s dynamic, worldwide, and high-tech corporate era [4]. Moreover,
CSR engagements assist organizations to achieve sustainable development as there is increasing
demand for eco-friendly services and products. Accordingly, existing literature has investigated the
concept of CSR in multiple ways and directions to establish the effect of firms’ CSR activities on
their employees’ behaviors [1,5,6], human resources [7], customer satisfaction [8], firm reputation [9],
creative and financial performance [10,11]. But the relationship between the firms’ CSR engagements
and firms’ financial performance (FFP) remains a mainstream topic of research [3].
Thus, numerous studies have investigated the association of CSR with FFP in various viewpoints
but have come up with vague and inconsistent findings. For instance, firms’ CSR initiatives can provide
more gains than the cost incurred, and thus, CSR activities increase firms’ financial performance [12,13].
In contrast, the neoclassical economists claimed that firms could overlook such social costs and
suggested a negative relationship [14]. So, no final consensus has been established so far, and the
relationship of CSR with FFP is still debatable due to inconsistent results. Moreover, existing research has
also argued that CSR and FFP relationships could be better explained through mediation mechanisms
and boundary conditions, which are currently overlooked in most of the studies and can lead to
biased results [15,16]. Existing literature has also suggested that CSR and FFP relationships must be
examined through the mediation and contingencies instead of direct relationships. Xie [3] noted that
existing research on CSR and FFP overlooked various factors that should be addressed in future studies.
Moreover, existing studies also remained distinct regarding CSR and FFP measures [17]. A number
of studies are confined to CSR perception or databases of CSR ratings such as the KLD database
(Kinder, Lydenberg, and Domini). But there are only a few studies that measured CSR disclosure
directly by taking data from the annual reports [8]. Similarly, firms’ financial performance is also
measured through distinctive measures, for example, accounting-, market-, and perception-based
financial performance. But no study has considered all these multiple indicators of CSR and financial
performance under one framework, and this may lead to inconclusive findings.
Thus, the present study aims to address the above-discussed discrepancies and extend the current
debate of CSR and FFP relationship in numerous ways. For example, this research considers both CSR
perceptions and disclosure. We also incorporate multiple indicators of firms’ financial performance,
such as perception-, accounting-, and market-based. Further, this study investigates the mediation
mechanism of competitive advantage. Likewise, the present research analyzes the boundary conditions
of family ownership and CEO narcissism on the CSR and FFP relationship with the mediation of
competitive advantage. Accordingly, this research investigates some important and new questions:
does competitive advantage mediate the CSR and FFP relationship? And when does the moderation of
family ownership and CEO narcissism influence this relationship?
This study attempts to answer these questions through the theoretical lens of resource-based view
following Barney [18], as firms create sustainable competitive advantage by effectually directing and
operating their competencies and resources, which are exceptional, valuable, cannot be exactly imitated
and no exact alternative is accessible [19]. Firms’ CSR initiatives may assist them in developing some of
these competencies and resources [20]. Thus, a resource-based view offers essential insights to explain
CSR and firms’ financial performance relationship; for instance, the effectiveness of resource-based
view to study CSR perception and disclosure as it emphasizes on precise intangible resources like
employees’ skills, capabilities, culture, and reputation as these are challenging to copy or substitute [20].
The present study also investigated the contingencies of family ownership and CEO narcissism
on the CSR and FFP association with the mediation mechanism of competitive advantage. For instance,
3. Sustainability 2020, 12, 4211 3 of 19
family-owned firms may strengthen this relationship as these firms are more committed to
long-term growth and consistent profits for the organization, and they show intense focus on
organizational competitiveness, financial performance, and stakeholders’ activities and interests [16].
Family-owned firms are more socially responsible for increasing their family image and their ties with
stakeholders [21]. Whereas non-family owned firms mostly follow short-term goals and push firm
management towards profit maximization rather than new product developments and distinctive
competencies. Thus, family-owned firms will strengthen the CSR and FFP association with the
mediation mechanism of competitive advantage than the non-family-owned firms. The contingency
of CEO narcissism can also enhance this relationship as narcissistic individuals are showy and
may be inclined towards CSR initiatives to fuel their positive self-image, which will benefit the
organization to achieve sustainable competitive advantage and ultimately translate into superior
financial performance. In particular, this research contributes to understanding why CSR is viewed
to have strategic importance for the firms and how a resource-based perspective might be utilized in
such endeavors.
The rest of the document comprises of literature background and hypotheses development in
Section 2. Section 3 presents the materials and methods. Section 4 represents the data analysis and
results. Finally, Section 5 enlightens discussions and conclusions.
2. Literature Background and Hypotheses Development
2.1. Resource-Based View
Firms can achieve sustainable competitive advantage by means or resources that are rare,
worthwhile, inimitable, and organized to capture the value of customers as explained in the
resource-based view (RBV) [18]. RBV models posit that they are the vital resources for firms’
superior performance, and these resources should be rare, worthwhile, inimitable, and organized to
capture the value of customers. The advocates of RBV suggest that it is valuable for organizations to
use internal resources to exploit outside opportunities. RBV focuses on the resources that may help the
organizations to achieve higher financial performance. These resources can be tangible and intangible
and should be heterogeneous, immobile, and must have VRIO (valuable, rare, inimitable and organized
to capture the value of customers) attributes to gain a competitive advantage.
2.2. CSR and Firms’ Financial Performance
The concept of CSR is investigated from multiple perspectives, such as antecedents and outcomes of
CSR. Aguinis [22] referred to CSR as the firms’ context-specific activities and procedures which consider
stakeholders’ expectations and the triple bottom line of economic, social, and environmental performance.
Despite various CSR perspectives, existing literature substantially considered the link of CSR with firms’
financial performance (FFP). But the results remained inconsistent. For instance, Wang’s [19] meta-analysis
of 42 studies noted a positive CSR and FFP relationship. Similarly, other studies also documented that
CSR positively affected FFP [13,23–25]. In contrast to the positive findings, a few studies also found a
negative effect of CSR on FFP [20].
Some studies even enlighten the no or neutral association of CSR and FFP [26]. Moreover,
existing studies also used distinctive measures of CSR and financial performance that can also cause
inconsistent results. Thus, due to inconsistency in results, no final consent is established, so this debate
is ongoing. This research argues by underpinning RBV that the CSR engagements of the organizations
help them to develop resources that are exceptional, valuable, cannot be exactly imitated, and no exact
alternative is accessible. Such as employees’ skills and firms reputation as these are much challenging
to copy or substitute [19,20]. Hence, we hypothesize that:
Hypothesis 1 (H1). CSR positively affects firms’ financial performance.
4. Sustainability 2020, 12, 4211 4 of 19
2.3. Mediation of Competitive Advantage
Competitive advantage is explained as the condition where competitive strategies are implemented
by the organization, which is gaining benefits from these strategies on such level where its competitors
are not able to copy nor to acquire benefits [27]. The resource-based view explained the importance
of matchless capabilities and resources to attain a competitive benefit. Organizations can achieve
competitive advantage by executing a worthwhile strategy that is not employed by the competitor at the
same time. Competitive advantage is considered as the capabilities and resources of the organizations
and is an essential factor for value creation [28].
Existing literature discussed the role of CSR activities in deriving competitive advantage and the
effect of competitive advantage on FFP as well [29–31]. For example, CSR is essential for innovation,
competitiveness, and sustainability for enterprises [28]. Marin [32] analyzed the causal effect of CSR
on competitiveness and found that organizations achieve competitiveness through CSR. Moreover,
CSR establishes the business resources which help to make positive stakeholder behavior, for instance,
loyalty, commitment, satisfaction, donations, and purchase of products that improve its competitiveness
and market value as well [8]. CSR is positively associated with a competitive advantage, which in turn
translates to FFP [28,33]. Hence, the present study postulates that:
Hypothesis 2 (H2). Competitive advantage mediates the CSR and FFP relationship.
2.4. Moderation of Ownership Structure
The ownership structure is defined as the existence of family participants in the company’s
board of directors or the influence of family members in decision making. Carney [34] examined the
link between corporate governance, family ownership, and competitive advantage and found that
family-owned businesses value creation come through governance advantage. Shahzad [21] tested the
moderation of ownership structure on the link between CSR and investment efficiency. They noted that
family-owned businesses were more engaged in CSR activities in comparison with non-family-owned
businesses. Likewise, Block [35] found that family firms give importance to the non-financial goals like
CSR in developing a reputation, identity, family image, and extending resources.
Family-owned organizations engage in non-financial goals or consider non-family stakeholders
to build their reputation for the longevity of their business [36]. Thus, it is possible to conclude that
the effect of firms’ CSR perception and disclosure on competitive advantage becomes stronger when
the firm is family-owned. In other words, when firms are family-owned, then their CSR initiatives
tend to provide more competitive advantage. As these firms are more committed to long-term
growth and consistent profits of the organization, they show intense concentration with organizational
competitiveness [28] and are more socially responsible for increasing their family image and their ties
with stakeholders [21]. Hence, we hypothesize that:
Hypothesis 3 (H3). Family ownership moderates the CSR and FFP relationship mediated by competitive
advantage, and the effect is strengthened when family ownership is high than when it is low.
2.5. Moderation of CEO Narcissism
Narcissistic individuals consider themselves exceptional, distinctive, and overstate their abilities
and achievements [37]. The existing literature has investigated both the negative and positive roles
of narcissist leaders to influence organizational strategies and outcomes like risky initiative, excessive
research, and development, innovations, and CSR investments. Tang [38] analyzed the association of
CEO narcissism with CSR. According to these authors, narcissist CEOs utilize CSR as a tool for positive
self-perception. Moreover, narcissist CEOs tend towards CSR initiatives for their personal admiration,
media attention, and personal exhibitions. Using a sample of Fortune 500 CEOs, Petrenko [39] documented
5. Sustainability 2020, 12, 4211 5 of 19
the positive link between CSR and CEO narcissism. CEO narcissism plays an essential part in enhancing
the firm’s CSR initiatives. Therefore, the effect of firms’ CSR perceptions and disclosure on competitive
advantage becomes stronger when the CEO is narcissistic. As narcissistic individuals are showy, they may
be inclined to use CSR initiatives to fuel their positive self-image; narcissistic CEOs may also highlight the
CSR actions of their organizations to gain reputation. Accordingly, we hypothesize that:
Hypothesis 4 (H4). CEO narcissism moderates the CSR and FFP relationship mediated by competitive
advantage, and the effect is strengthened when CEO narcissism is high than when it is low.
Figure 1 presents all the hypothesized relationships on the direct and indirect CSR and FFP
relationship with the mediation of competitive advantage and moderation of family ownership and
CEO narcissism. RBV is used to derive all hypotheses. CSR is presented by perception and disclosure,
and similarly, FFP is considered by perception-, market-, and accounting-based indicators.
Sustainability 2020, 12, x FOR PEER REVIEW 5 of 19
self-image; narcissistic CEOs may also highlight the CSR actions of their organizations to gain
reputation. Accordingly, we hypothesize that:
Hypothesis 4 (H4). CEO narcissism moderates the CSR and FFP relationship mediated by competitive
advantage, and the effect is strengthened when CEO narcissism is high than when it is low.
Figure 1 presents all the hypothesized relationships on the direct and indirect CSR and FFP
relationship with the mediation of competitive advantage and moderation of family ownership and
CEO narcissism. RBV is used to derive all hypotheses. CSR is presented by perception and disclosure,
and similarly, FFP is considered by perception-, market-, and accounting-based indicators.
Figure 1. Hypothesized Model.
3. Materials and Methods
3.1. Data Collection and Sample
The present study utilized a cross-sectional quantitative research design with a deduction
approach to theory development. This is a multi-method and multi-source research with firms as a
unit of analysis. This research collected primary data by using survey strategy and secondary data
from the annual reports. This study followed a two-stage sampling process. In the sample selection
process, we did not consider the firms that had not reported CSR initiatives or activities on their
annual reports and whose data was not available. Thus, in the first stage, after prudentially
considering the objectives of this research, we selected 89 manufacturing firms listed at PSE, which
are engaged in CSR activities. These firms contribute to employees’ benefits, healthcare foundations,
and free education and also stipulate their CSR intents on their authorized websites.
In the second stage, we made requests to the top management of these selected firms for the
primary data collection by clearly communicating the purpose of our research. Eventually, we
received confirmation from 60 firms. We promised to keep anonymity and privacy and signed an
ethics agreement with these firms. After that, we visited the human resource (HR) management of
each firm. HR had already been informed about our research by the top management, and they
provided us the complete details of permanent employees. Primary data were collected from multiple
sources, including top managers, middle managers, and finance managers. With HR support, we
identified 325 top managers, 225 middle managers, and 250 finance managers. After that, we
conducted multiple self-administrative surveys to collect data from multiple sources with temporal
breaks over six weeks from December 2019 to January 2020. Podsakoff [40] explained that single-time
data collection in primary research could cause common method biases. Thus, to minimize these
biases, the data were collected in two waves about three weeks apart. Time-lagged designed is also
referred to as a desirable design in most of the CSR research [41,42].
In the first wave, we conducted our Survey 1 and distributed 300 self-administrated
questionnaires among randomly selected top managers (five top managers each firm) to rate their
CSR perception and their CEO narcissism; 123 (41%) usable questionnaires were collected. This
response rate seems low at first glance. However, a similar response rate is also reported in numerous
CSR studies who collected data from top managers such as Mishra [43] and Saeidi et al. [8] who
Figure 1. Hypothesized Model.
3. Materials and Methods
3.1. Data Collection and Sample
The present study utilized a cross-sectional quantitative research design with a deduction approach
to theory development. This is a multi-method and multi-source research with firms as a unit of
analysis. This research collected primary data by using survey strategy and secondary data from the
annual reports. This study followed a two-stage sampling process. In the sample selection process,
we did not consider the firms that had not reported CSR initiatives or activities on their annual reports
and whose data was not available. Thus, in the first stage, after prudentially considering the objectives
of this research, we selected 89 manufacturing firms listed at PSE, which are engaged in CSR activities.
These firms contribute to employees’ benefits, healthcare foundations, and free education and also
stipulate their CSR intents on their authorized websites.
In the second stage, we made requests to the top management of these selected firms for the
primary data collection by clearly communicating the purpose of our research. Eventually, we received
confirmation from 60 firms. We promised to keep anonymity and privacy and signed an ethics
agreement with these firms. After that, we visited the human resource (HR) management of each firm.
HR had already been informed about our research by the top management, and they provided us
the complete details of permanent employees. Primary data were collected from multiple sources,
including top managers, middle managers, and finance managers. With HR support, we identified
325 top managers, 225 middle managers, and 250 finance managers. After that, we conducted multiple
self-administrative surveys to collect data from multiple sources with temporal breaks over six weeks
from December 2019 to January 2020. Podsakoff [40] explained that single-time data collection in
primary research could cause common method biases. Thus, to minimize these biases, the data were
collected in two waves about three weeks apart. Time-lagged designed is also referred to as a desirable
design in most of the CSR research [41,42].
6. Sustainability 2020, 12, 4211 6 of 19
In the first wave, we conducted our Survey 1 and distributed 300 self-administrated questionnaires
among randomly selected top managers (five top managers each firm) to rate their CSR perception
and their CEO narcissism; 123 (41%) usable questionnaires were collected. This response rate seems
low at first glance. However, a similar response rate is also reported in numerous CSR studies who
collected data from top managers such as Mishra [43] and Saeidi et al. [8] who reported 10% and
17%, respectively. In Survey 2, we distributed 180 questionnaires among randomly selected middle
managers (three middle managers each firm) to collect data on competitive advantage and received
106 (58.8%) useable questionnaires.
In the second wave, Survey 3 was conducted to collect data from 200 randomly selected finance
managers (five finance managers each firm) on their perception of firms’ financial performance and
family ownership; we obtained 131 (65.5%) completed questionnaires. All the participants were
granted anonymity, privacy, and no effect of their responses on their performance, which was also
guaranteed to minimize biases such as social desirability Podsakoff [40]. Our final data set consists of
340 completed questionnaires with a final response rate of 50% in all facets.
The secondary data was collected regarding CSR disclosure and FFP (Tobin Q, EPS, and ROE)
PSE, the central bank of Pakistan, annual and sustainability reports available at the official website of
each firm. CSR disclosure data were collected for 2018 and one-year-lagged financial performance for
2019. At first sight, this period seems short, but the CSR disclosure data for previous years were not
available for a number of firms because reporting CSR activities or issuing sustainability reports is in
its beginning in Pakistan, thus restricting us from collecting recent data.
3.2. Measures
This research incorporates well-established measures and uses both primary and secondary
measures of CSR and financial performance. Primary data is collected on CSR perceptions by using
measures developed by Maignan [44], a 29-item Likert-type scale (5 for strongly agree (SA) to 1 for
strongly disagree (SD)). The sample items are: “We continually improve the quality of our products”,
“We are recognized as a trustworthy company”. The high reliability of the scale is shown by the
Cronbach’s alpha value of 0.92. Existing research has extensively documented various databases, for
instance, Kinder, Lydenberg, and Domini, Fortune’s Most Admired Companies, to measure CSR by
using secondary data. But no such databases are available in developing countries such as Pakistan.
Thus, existing studies have constructed a CSR disclosure index by taking data from annual and
sustainability reports. For instance, Khan [45] developed a 20-item index to measure CSR disclosures.
A binary procedure was applied to rate the presence of required information in the firm, and the
index is calculated by the ratio of actual score to attainable score for a firm. Blasi [46] constructed a
CSR disclosure index based on firms’ involvement in community, environment, employee relations,
human rights, governance, and management diversity. Kansal [47] also constructed the CSR index
by considering environmental factors, minority rights, and annual reports of the firms with CSR
disclosure. Yuen [48] used firm engagements like employee education, charity, reporting standards,
environmental involvement, and customer relations to develop the CSR disclosure index. Malik [49]
calculated the CSR disclosure index by firms’ engagements with employee, community, and customer
relations, and environmental involvement.
This research constructed the CSR disclosure index along with five dimensions, including
community involvement, environmental involvement, employee information, value-added information,
and product and service information, similar to Khan [45]. The index comprised of 20 items and
represents the extent to which firms reveal their CSR undertakings in the annual reports. A binary
method was applied in which a firm was awarded one in case an item incorporated in the index was
exposed, otherwise the firm was awarded zero. Moreover, a firm was not penalized for a zero if the
index item was not related to it, and this was done after reading the complete annual report. The index
is derived by estimating the ratio of the score achieved by a firm to the highest possible score (20).
The index for every firm is measured by dividing the attained score to the highest attainable score for
7. Sustainability 2020, 12, 4211 7 of 19
that firm Galvin [50]. We assessed the index’s internal consistency by making use of Cronbach’s alpha,
which was 0.81.
Firms’ financial performance is measured through perception-, market-, and accounting-based
indicators. Perception of financial performance is measured through the Saeidi et al. [8] seven-item
scale (1 = Much worse to 5 = Much better). The sample items included: “In the last three years,
our firm has performed worse/better than the major competitors in the industry regarding growth in
sales.” We measured accounting- and market-based indicators of FFP by using the secondary data
from the annual reports. In the existing literature, competitive advantage is measured by using various
scales. For instance, Zho [51] measured competitive advantage along with financial and market
dimensions by following existing scales, such as those developed by Protogerou [52] and Chen [53].
This study measured competitive advantage by using Chen’s [54] eight-item five-point Likert scale
(1 = SD to 5 = SA). This measure explained the firm’s competitive advantage by concentrating on
cost-effectiveness, product quality, innovation and research, managerial capability, growth, profitability,
position, and image of the company in contrast to competitors. The sample items include: “The corporate
image of the firm is better than that of the competitors”, “The Company is more capable of RD and
innovation than the competitors”. CEO narcissism is measured by using the Resick [55] eight-item
scale (1 = Very to 5 = Not at all). The sample items consist of: “How accurately the word arrogant
describes your CEO”. Family ownership was considered as a binary variable that takes the value
of one in case of family ownership (presence of family members in the firm’s board of directors),
otherwise zero for non-family-owned firms. Moreover, control variables incorporated in this research
were respondents’ gender, education, age, tenure with organization, firm size and leverage.
3.3. Analytical Strategy
This research employed contemporary data analysis procedures. We conducted preliminary data
analysis to test for accuracy, outliers, missing values, normality, summary, and inferential statistics in
SPSS. We also performed a confirmatory factor analysis to examine construct validity and model fitness
indicators by making use of AMOS. Model fitness is assessed by commonly used indices, such as
chi-square/degrees of freedom, root mean square error approximation (RMSEA), standardized root
mean square residual (SRMR), Tucker–Lewis index (TLI) and comparative fit index (CFI). The acceptable
values for these indicators ranged from 2 for X2/dƒ; the value for RMSEA and SRMR must be less
than 0.08, and it should be greater than 0.90 for CFI and TLI [56]. Reliability of the constructs was
measured through Cronbach’s alpha, and composite reliability and further discriminant validity were
established through average variance extracted. Further, to investigate the existence of common
method biases, we performed Harman’s one-factor test because of the self-reported surveys and the
cross-sectional nature of data, and found no such issue in this research. Finally, structural equation
modeling (SEM) was used to find direct and indirect effects. CSR perception, competitive advantage,
and perceived financial performance were aggregated to firm-level by following Chan’s [57] typology
of the direct consensus model. As top managers’ perception of CSR, middle managers’ ratings of
competitive advantage and finance managers’ perception of financial performance were aggregated
from individual-level responses to firm-level.
Chan [57] and Farh [58] explained that such aggregation is possible. Further, to found this
consensus to aggregate individual responses to the firm-level, we computed RWG (j) for perceived
CSR (0.69), competitive advantage (0.78), and perceived financial performance (0.83) following
Preacher et al. [59]. We found that these values were within the acceptable range [60,61] and validated
the aggregation. This decision is also consistent with other studies that have also made such
aggregation [5,62,63]. Further, existing studies noted the endogeneity bias while investigating direct
CSR and firms’ financial performance relationship. Endogeneity bias presents a crucial concern to
analyze cause and effect relations, and failure to control endogeneity bias may result in misleading
and counterfeit findings [10,64]. Javeed [10] documented that endogeneity is a common issue in most
8. Sustainability 2020, 12, 4211 8 of 19
panel data analysis due to the correlation of explanatory variables with the error term in regression
that causes biased findings.
Existing literature has found various sources of endogeneity, such as simultaneous causality,
omitted variable, and errors in variables [64,65]. Simultaneous causality is the most common cause of
endogeneity bias in CSR and firms’ financial performance relationship. Exiting research addressed the
endogeneity issue with various remedies, such as the use of control variables, instrumental variables
(two-stage least square, three-stage least square), high moment, latent instrumental variable, matching
method, generalized method of moments (GMM), Heckman two-step procedure and lagging
independent and dependent variable [9,63]. Each of these remedies has its implication; for example,
GMM is suitable and frequently used to deal with endogeneity issues in panel data and lagged
variables for simultaneous endogeneity bias. The present research employs a lagged variable technique
to deal with endogeneity concerns while examining the direct CSR and FFP relationship. This is a
non-statistical remedy to mitigate the possible endogeneity issue and consider in advance at the time of
the research design stage by adopting a time-lagged measurement of the explanatory and dependent
variables. Accordingly, we lagged the dependent variable by one period as the data for CSR disclosure
was collected for 2018 with one-year-lagged financial performance (market and accounting-based
indicators) data for 2019, and this is also consistent with other studies that alleviated endogeneity bias
by employing the lagged variable method [10,66–68].
4. Data Analysis and Results
4.1. Descriptive Analysis
Table 1 explains the construct reliability, validity, and descriptive statistics, and the results specified
no issue of validity and reliability.
Table 1. Reliability and Descriptive Statistics.
Item Alpha AVE CR Mean SD
Perceived Financial Performance 7 0.76 0.50 0.94 4.00 0.41
Perceived CSR 29 0.92 0.51 0.89 4.30 0.31
Competitive Advantage 8 0.71 0.61 0.79 4.10 0.57
CEO Narcissism 8 0.59 0.77 0.77 4.00 0.41
Family Ownership 2 0.62 0.70 0.69 0.46 0.20
Tobin Q 2.03 1.55
Earnings per Share 34.01 18.0
Return on Equity 25.09 40.1
CSR Disclosure 0.71 0.12
Notes: Alpha stands for Cronbach’s alpha, AVE represents average variance extracted, CR is the composite reliability,
and SD signifies the standard deviation.
The Cronbach’s alpha is within the acceptable range values for all the constructs, as recommended
by Nunnally [69]. For instance, 0.76 for perceived financial performance, 0.92 for perceived CSR,
0.71 for competitive advantage, 0.59 and 0.62 for CEO narcissism and family ownership, respectively.
The data were also tested for composite reliability and validity, and there was no such issue. Our results
were in an acceptable range; for example, CR is above 0.70, and AVE is 0.50 for all the constructs [56].
Further, the mean and standard deviation values (SD) were also satisfactory. For instance, the CSR
perception mean value was 4.30, which might seem high because the firms considered in this research
are known for their CSR initiatives, whereas the values for standard deviation were also within the
normal range. But standard deviation values were high for accounting-based indicators as the firms
with distinctive size and sectors were considered.
Table 2 represented the bivariate correlation results among the studied variables. We found that
no variable is exactly or strongly correlated with other variables. Thus, there is no multicollinearity
9. Sustainability 2020, 12, 4211 9 of 19
problem, and the correlation coefficients are also in the supposed directions. Thus, we found a
statistically significant positive relationship of CSR perception with perceived financial performance
(0.11, p 0.05), Tobin Q (0.23, p 0.01), earning per share (0.17, p 0.01) and return on equity
(0.20, p 0.01). Similarly, CSR disclosure was also positively and significantly related to perceived
financial performance (0.21, p 0.01), return on equity (0.20, p 0.01), Tobin Q (0.04, insignificant)
and earning per share (0.05, insignificant). We found that perceived CSR and competitive advantage
were significantly and positively related (0.25, p 0.01), as well as CSR disclosure and competitive
advantage (0.24, p 0.01). Competitive advantage and perceived financial performance positively and
significantly correlated (0.15, p 0.01), whereas Tobin Q (0.04, insignificant), earning per share (0.09,
insignificant) and return on equity (0.02, insignificant) remained statistically insignificant.
Table 2. Inferential Statistics.
1 2 3 4 5 6 7 8 9
1. Perceived FFP 1
2. Perceived CSR 0.11 ** 1
3. Competitive Advantage 0.15 * 0.25 * 1
4. CEO Narcissism 0.57 * 0.11 0.05 1
5. Family Ownership 0.08 0.22 0.30 ** 0.08 1
6. Tobin Q 0.05 0.23 * 0.04 0.05 0.00 1
7. Earnings per Share 0.06 0.17 * 0.09 0.06 0.02 0.16 1
8. Return on Equity 0.07 0.20 ** 0.02 0.06 0.11 0.28 * 0.43 * 1
9. CSR Disclosers 0.21 * 0.04 0.24 * 0.21 0.00 0.04 0.05 0.20 * 1
Notes: FFP stands for firms’ financial performance, * p 0.01, ** p 0.05.
4.2. Hypotheses Testing
Table 3 and Figure 2 report the direct effects among the variables. Model fit indices were X2/df = 2.31,
RMSEA = 0.035, SRMR = 0.017, CFI = 0.98 and TLI = 0.97.
Table 3. Summary of Direct Effects.
Estimates p-Value Remarks
Perceived CSR → Perceived Financial Performance 0.18 ** 0.05 H1: Supported
Perceived CSR → Tobin Q 1.63 ** 0.03 H1: Supported
Perceived CSR → Earning Per Share 0.40 ** 0.04 H1: Supported
Perceived CSR → Return on Equity 0.30 * 0.03 H1: Supported
CSR Disclosers → Perceived Financial Performance 0.83 * 0.02 H1: Supported
CSR Disclosers → Tobin Q 0.85 ** 0.05 H1: Supported
CSR Disclosers → Earning Per Share 0.21 ** 0.05 H1: Supported
CSR Disclosers → Return on Equity 0.99 * 0.01 H1: Supported
Perceived CSR → Competitive Advantage 1.29 * 0.03
CSR Disclosers → Competitive Advantage 0.45 ** 0.05
Competitive Advantage → Perceived Financial Performance 0.02 ** 0.05
Competitive Advantage → Tobin Q 0.12 ns
Competitive Advantage → Earning Per Share 0.37 Ns
Competitive Advantage → Return on Equity 0.29 Ns
* p 0.01, ** p 0.05 Disclosure.
10. Sustainability 2020, 12, 4211 10 of 19
affected competitive advantage (1.29, p = 0.03) and CSR disclosure on competitive advantage (0.45, p
= 0.03). Thus, with a one-unit increase in CSR perception and disclosure, firms’ competitive
advantage increases by 1.29 units and 0.45 units, respectively. Likewise, the competitive advantage
was also found to have a significant and positive effect on perceived financial performance (0.02, p =
0.05). However, it had a positive and insignificant effect on Tobin Q (0.12, p = 0.07), EPS (0.37, p =
0.065), and ROE (0.29, p = 0.495).
Figure 2. Direct Effects.
Table 4 and Figure 3 represent the indirect effects of perceived CSR and CSR disclosure on
perceived financial performance, Tobin Q, EPS, and ROE through the mediation of competitive
advantage. We stated in Hypothesis 2 that the CSR and FFP relationship is mediated by competitive
advantage. Our results indicated that competitive advantage significantly mediated the relationship
of perceived CSR and Tobin Q 0.15 (95% CI [0.05, 0.19]), earning per share 0.48 (95% CI [0.05, 0.19]),
return on equity 0.37 (95% CI [0.05, 0.19]), but it remained statistically insignificant for perceived
financial performance 0.02 (95% CI [−0.01, 0.04]). Thus, this supported our Hypotheses 2 except for
the association of perceived CSR with a perceived financial performance by the mediation of
competitive advantage. Moreover, we also noted the mediation of competitive advantage between
CSR disclosure and EPS 0.17 (95% CI [0.22, 0.41]) and ROE 0.13 (95% CI [0.03, 0.59]). However, this
relationship remained statistically insignificant for perceived financial performance, and Tobin Q and
our Hypothesis 2 is not supported. In particular, competitive advantage mediated the relationship of
perceived CSR and market-based and accounting-based financial performance indicators. Likewise,
we also found the mediation of competitive advantage between CSR disclosure and accounting-
based financial performance.
Table 4. Summary of Mediation Effects.
Estimates 95% CI Remarks
Perceived CSR → CA → PFP 0.02 [−0.01, 0.04] ns
Perceived CSR → CA → Tobin Q 0.15 * [0.05, 0.19] H2: Supported
Perceived CSR → CA → EPS 0.48 * [0.21, 0.77] H2: Supported
Perceived CSR → CA → ROE 0.37 * [0.12, 0.55] H2: Supported
CSR Disclosure → CA → PFP 0.009 [−0.11, 0.02] ns
CSR Disclosure → CA → Tobin Q 0.05 [−0.16, 0.04] ns
CSR Disclosure → CA → EPS 0.17 ** [0.22, 0.41] H2: Supported
CSR Disclosure → CA → ROE 0.13 ** [0.03, 0.59] H2: Supported
Notes: * p 0.01, ** p 0.05, CA = Competitive Advantage, PFP = Perceived Financial Performance,
EPS = Earnings per Share, ROE = Return on Equity.
Table 5 and Figure 3 reported the moderation of family ownership on the relationship of CSR
perception and disclosure with firms’ perceived financial performance, Tobin Q, EPS, and ROE
Figure 2. Direct Effects, * p 0.01, ** p 0.05.
In Hypothesis 1, we stated that CSR positively affects firms’ financial performance. Accordingly,
we tested the effect of multiple indicators of CSR (CSR perception and disclosure) on multiple indicators of
firms’ financial performance (perceived financial performance, Tobin Q as market-based, earning per share,
and return on equity as accounting-based). We found that perceived CSR has a statistically significant
positive effect on perceived financial performance (0.18, p = 0.05), Tobin Q (1.63, p = 0.03), earning per
share (0.40, p = 0.04) and return on equity (0.30, p = 0.03). Thus, by keeping all other things constant,
with a one-unit increase in CSR perceptions, perceived financial performance, Tobin Q, EPS, and ROE
increase by 0.18 units, 1.63 units, 0.40 units, and 0.30 units, respectively. We also noted a positive and
significant effect of CSR disclosure on perceived financial performance (0.83, p = 0.02), Tobin Q (0.85,
p = 0.05), earning per share (0.21, p = 0.05) and return on equity (0.99, p = 0.01). Thus, by keeping all other
things constant, with a one-unit increase in CSR disclosure, perceived financial performance, Tobin Q,
EPS, and ROE increase by 0.83 units, 0.85 units, 0.21 units, and 0.99 units, respectively.
Therefore, our Hypothesis 1 is supported across all multiple indicators of CSR and firms’
financial performance. Further, we also tested the direct effect of perceived CSR and CSR disclosure
on competitive advantage and the direct effect of competitive advantage on perceived financial
performance, Tobin Q, EPS, and ROE. We found that CSR perception positively and significantly
affected competitive advantage (1.29, p = 0.03) and CSR disclosure on competitive advantage (0.45,
p = 0.03). Thus, with a one-unit increase in CSR perception and disclosure, firms’ competitive advantage
increases by 1.29 units and 0.45 units, respectively. Likewise, the competitive advantage was also
found to have a significant and positive effect on perceived financial performance (0.02, p = 0.05).
However, it had a positive and insignificant effect on Tobin Q (0.12, p = 0.07), EPS (0.37, p = 0.065),
and ROE (0.29, p = 0.495).
Table 4 and Figure 3 represent the indirect effects of perceived CSR and CSR disclosure on
perceived financial performance, Tobin Q, EPS, and ROE through the mediation of competitive
advantage. We stated in Hypothesis 2 that the CSR and FFP relationship is mediated by competitive
advantage. Our results indicated that competitive advantage significantly mediated the relationship
of perceived CSR and Tobin Q 0.15 (95% CI [0.05, 0.19]), earning per share 0.48 (95% CI [0.05, 0.19]),
return on equity 0.37 (95% CI [0.05, 0.19]), but it remained statistically insignificant for perceived
financial performance 0.02 (95% CI [−0.01, 0.04]). Thus, this supported our Hypotheses 2 except
for the association of perceived CSR with a perceived financial performance by the mediation of
competitive advantage. Moreover, we also noted the mediation of competitive advantage between
CSR disclosure and EPS 0.17 (95% CI [0.22, 0.41]) and ROE 0.13 (95% CI [0.03, 0.59]). However,
this relationship remained statistically insignificant for perceived financial performance, and Tobin Q
and our Hypothesis 2 is not supported. In particular, competitive advantage mediated the relationship
of perceived CSR and market-based and accounting-based financial performance indicators. Likewise,
11. Sustainability 2020, 12, 4211 11 of 19
we also found the mediation of competitive advantage between CSR disclosure and accounting-based
financial performance.
Table 4. Summary of Mediation Effects.
Estimates 95% CI Remarks
Perceived CSR → CA → PFP 0.02 [−0.01, 0.04] ns
Perceived CSR → CA → Tobin Q 0.15 * [0.05, 0.19] H2: Supported
Perceived CSR → CA → EPS 0.48 * [0.21, 0.77] H2: Supported
Perceived CSR → CA → ROE 0.37 * [0.12, 0.55] H2: Supported
CSR Disclosure → CA → PFP 0.009 [−0.11, 0.02] ns
CSR Disclosure → CA → Tobin Q 0.05 [−0.16, 0.04] ns
CSR Disclosure → CA → EPS 0.17 ** [0.22, 0.41] H2: Supported
CSR Disclosure → CA → ROE 0.13 ** [0.03, 0.59] H2: Supported
Notes: * p 0.01, ** p 0.05, CA = Competitive Advantage, PFP = Perceived Financial Performance, EPS = Earnings
per Share, ROE = Return on Equity.
Sustainability 2020, 12, x FOR PEER REVIEW 11 of 19
through the mediation of competitive advantage. In Figure 3, CSRD stands for CSR disclosure, and
FO represents family ownership. Further, to investigate the moderation of family ownership on the
above-discussed relationship, we examined the interaction effect of CSR perception and family
ownership, and CSR disclosure and family ownership on the competitive advantage.
Figure 3. Indirect Effects.
We found a statistically significant positive effect on competitive advantage for both CSR
perception and disclosure (Perceived CSR*FO = 1.39), 95% CI [0.88, 2.99] and (CSR disclosure*FO =
0.51), 95% CI [0.13, 2.68]. In our third hypothesis, we stated that family ownership moderates the CSR
and FFP relationship through the mediation of competitive advantage. Accordingly, we found that
family ownership strengthened this relationship. For example, the impact of perceived CSR on
perceived financial performance mediated through competitive advantage is strengthened by family
ownership 0.03 (95% CI [0.01, 0.05]) as previously as discussed in Table 4; it was statistically
insignificant 0.02 (95% CI [−0.01, 0.04]).
Table 5. Moderation of Family Ownership.
Estimates 95% CI Remarks
Perceived CSR*FO → CA 1.39 * [0.88, 2.99]
CSR Disclosure *FO → CA 0.51 * [0.13, 0.68]
Perceived CSR*FO → CA → PFP 0.03 ** [0.01, 0.05] H3: Supported
Perceived CSR*FO → CA → Tobin Q 0.17 * [0.02, 0.21] H3: Supported
Perceived CSR*FO → CA → EPS 0.51 * [0.14, 0.68] H3: Supported
Perceived CSR*FO → CA → ROE 0.40 * [0.09, 0.11] H3: Supported
CSR Disclosure *FO → CA → PFP 0.01 [−0.01, 0.03] ns
CSR Disclosure*FO → CA → Tobin Q 0.06 [−0.14, 0.03] ns
CSR Disclosure*FO → CA → EPS 0.19 ** [0.19, 0.32] H3: Supported
CSR Disclosure*FO → CA → ROE 0.15 ** [0.01, 0.47] H3: Supported
* p 0.01, ** p 0.05, FO = Family Ownership, CA = Competitive Advantage, PFP = Perceived Financial
Performance, EPS = Earnings Per Share, ROE = Return On Equity.
Figure 3. Indirect Effects, * p 0.01, ** p 0.05.
Table 5 and Figure 3 reported the moderation of family ownership on the relationship of CSR
perception and disclosure with firms’ perceived financial performance, Tobin Q, EPS, and ROE through
the mediation of competitive advantage. In Figure 3, CSRD stands for CSR disclosure, and FO represents
family ownership. Further, to investigate the moderation of family ownership on the above-discussed
relationship, we examined the interaction effect of CSR perception and family ownership, and CSR
disclosure and family ownership on the competitive advantage.
We found a statistically significant positive effect on competitive advantage for both CSR perception
and disclosure (Perceived CSR*FO = 1.39), 95% CI [0.88, 2.99] and (CSR disclosure*FO = 0.51), 95% CI
[0.13, 2.68]. In our third hypothesis, we stated that family ownership moderates the CSR and FFP
relationship through the mediation of competitive advantage. Accordingly, we found that family
ownership strengthened this relationship. For example, the impact of perceived CSR on perceived
financial performance mediated through competitive advantage is strengthened by family ownership
0.03 (95% CI [0.01, 0.05]) as previously as discussed in Table 4; it was statistically insignificant 0.02
(95% CI [−0.01, 0.04]).
12. Sustainability 2020, 12, 4211 12 of 19
Table 5. Moderation of Family Ownership.
Estimates 95% CI Remarks
Perceived CSR*FO → CA 1.39 * [0.88, 2.99]
CSR Disclosure *FO → CA 0.51 * [0.13, 0.68]
Perceived CSR*FO → CA → PFP 0.03 ** [0.01, 0.05] H3: Supported
Perceived CSR*FO → CA → Tobin Q 0.17 * [0.02, 0.21] H3: Supported
Perceived CSR*FO → CA → EPS 0.51 * [0.14, 0.68] H3: Supported
Perceived CSR*FO → CA → ROE 0.40 * [0.09, 0.11] H3: Supported
CSR Disclosure *FO → CA → PFP 0.01 [−0.01, 0.03] ns
CSR Disclosure*FO → CA → Tobin Q 0.06 [−0.14, 0.03] ns
CSR Disclosure*FO → CA → EPS 0.19 ** [0.19, 0.32] H3: Supported
CSR Disclosure*FO → CA → ROE 0.15 ** [0.01, 0.47] H3: Supported
* p 0.01, ** p 0.05, FO = Family Ownership, CA = Competitive Advantage, PFP = Perceived Financial Performance,
EPS = Earnings Per Share, ROE = Return On Equity.
Moreover, we also find that relationships of perceived CSR with Tobin Q, EPS and ROE mediated
by competitive advantage are strengthened with the moderation of family ownership: 0.17 (95% CI
[0.02, 0.21]), 0.51 (95% CI [0.14, 0.68]), 0.40 (95% CI [0.09, 0.11]), respectively. This supported our
Hypothesis 3. However, the indirect effects of CSR disclosure on perceived financial performance and
Tobin Q mediated by competitive advantage remained statistically insignificant: 0.01 (95% CI [−0.01,
0.03]), 0.06 (95% CI [−0.14, 0.03]). Meanwhile, family ownership strengthened the indirect effect of
CSRD on EPS and ROE mediated by competitive advantage: 0.19 (95% CI [0.19, 0.32]), 0.15 (95% CI
[0.01, 0.47]). These results supported Hypothesis 3 as well.
Further, to better understand the moderation of family ownership on perceived CSR and
competitive advantage, and CSR disclosure and competitive advantage that ultimately translate to
multiple indicators of financial performance, we plotted the moderation effects in Figure 4. It represents
that family ownership strengthened the effect of perceived CSR and CSR disclosure on competitive
advantage. Additionally, it can also be noticed that CSR perception and competitive advantage,
CSR disclosure, and competitive advantage relationships are strengthened when family ownership is
high than when it is low.
Sustainability 2020, 12, x FOR PEER REVIEW 12 of 19
effect of CSRD on EPS and ROE mediated by competitive advantage: 0.19 (95% CI [0.19, 0.32]), 0.15
(95% CI [0.01, 0.47]). These results supported Hypothesis 3 as well.
Further, to better understand the moderation of family ownership on perceived CSR and
competitive advantage, and CSR disclosure and competitive advantage that ultimately translate to
multiple indicators of financial performance, we plotted the moderation effects in Figure 4. It
represents that family ownership strengthened the effect of perceived CSR and CSR disclosure on
competitive advantage. Additionally, it can also be noticed that CSR perception and competitive
advantage, CSR disclosure, and competitive advantage relationships are strengthened when family
ownership is high than when it is low.
Figure 4. Moderation of family ownership.
Table 6 and Figure 3 showed the moderation effect of CEO narcissism on the impact of CSR
perception and CSR disclosure on the perception of financial performance, Tobin Q, EPS and ROE
through the mediation of competitive advantage. Hypothesis 4 stated that CEO narcissism
strengthens the above-mentioned indirect relationship of CSR with firms’ financial performance.
Firstly, we tested for the interaction effect of CSR perception and CEO narcissism, as well as CSR
disclosure and CEO narcissism on competitive advantage and found statistically significant positive
effects: (Perceived CSR*CEO narcissism = 1.31), 95% CI [0.91, 1.87] and (CSR disclosure*CEO
narcissism = 0.49), 95% CI [0.03, 0.61]. Further, we found that CEO narcissism strengthened the impact
of CSR perception on perceived financial performance through the mediated mechanism of
competitive advantage, 0.03 (95% CI [0.02, 0.09]), as it was statistically insignificant, 0.02 (95% CI
[−0.01, 0.04]), as previously shown in Table 4.
1
1.5
2
2.5
3
3.5
4
4.5
5
Low CSRD High CSRD
Competitive
Advantage
1
1.5
2
2.5
3
3.5
4
4.5
5
Low PCSR High PCSR
Competitive
Advantage
Low FO
Figure 4. Moderation of family ownership.
Table 6 and Figure 3 showed the moderation effect of CEO narcissism on the impact of CSR
perception and CSR disclosure on the perception of financial performance, Tobin Q, EPS and
ROE through the mediation of competitive advantage. Hypothesis 4 stated that CEO narcissism
strengthens the above-mentioned indirect relationship of CSR with firms’ financial performance.
Firstly, we tested for the interaction effect of CSR perception and CEO narcissism, as well as
CSR disclosure and CEO narcissism on competitive advantage and found statistically significant
positive effects: (Perceived CSR*CEO narcissism = 1.31), 95% CI [0.91, 1.87] and (CSR disclosure*CEO
13. Sustainability 2020, 12, 4211 13 of 19
narcissism = 0.49), 95% CI [0.03, 0.61]. Further, we found that CEO narcissism strengthened the
impact of CSR perception on perceived financial performance through the mediated mechanism of
competitive advantage, 0.03 (95% CI [0.02, 0.09]), as it was statistically insignificant, 0.02 (95% CI
[−0.01, 0.04]), as previously shown in Table 4.
Table 6. Moderation of CEO Narcissism.
Estimates 95% CI Remarks
Perceived CSR*CEON → CA 1.31 * [0.91, 1.87]
CSR Disclosure * CEON → CA 0.49 ** [0.03, 0.61]
Perceived CSR* CEON → CA → PFP 0.03 ** [0.02, 0.09] H4: Supported
Perceived CSR* CEON → CA → Tobin Q 0.16 * [0.15, 0.39] H4: Supported
Perceived CSR* CEON → CA → EPS 0.49 * [0.11, 1.22] H4: Supported
Perceived CSR* CEON → CA → ROE 0.38 * [0.19, 0.88] H4: Supported
CSR Disclosure* CEON → CA → PFP 0.01 [−0.02, 0.09] ns
CSR Disclosure* CEON → CA → Tobin Q 0.06 ** [0.03, 0.10] H4: Supported
CSR Disclosure* CEON → CA → EPS 0.18 * [0.06, 0.23] H4: Supported
CSR Disclosure* CEON → CA → ROE 0.14 * [0.04, 0.29] H4: Supported
* p 0.01, ** p 0.05, CA = Competitive Advantage, CEON = CEO Narcissism, PFP = Perceived Financial
Performance, EPS = Earnings Per Share, ROE = Return on Equity.
We also found that the relationships of perceived CSR with Tobin Q, EPS, and ROE mediated
by competitive advantage are strengthened with the moderation of CEO narcissism: 0.16 (95% CI
[0.15, 0.39]), 0.49 (95% CI [0.11, 1.22]), 0.38 (95% CI [0.19, 0.88]), respectively. Thus, Hypothesis 4 is
supported. Moreover, we also found statistically significant effect of CSR disclosure with Tobin Q,
earnings per share and return on equity mediated by competitive advantage is strengthen with the
moderation of CEO narcissism 0.06 (95% CI [0.03, 0.10]), 0.18 (95% CI [0.06, 0.23]), 0.14 (95% CI [0.04,
0.29]) respectively. This supported our Hypothesis 4. Conversely, the impact of CSR disclosure on
perceived financial performance through the mediation of competitive advantage remained statistically
insignificant: 0.01 (95% CI [−0.02, 0.09]).
Moreover, for a better understanding of the CEO narcissism moderation effect, we plotted the
moderation effects in Figure 5. It represented, CEO narcissism strengthened the impact of perceived
CSR and CSR disclosure on competitive advantage. It can also be noticed in Figure 5 that the
above-mentioned effects are strengthened at a high level of CEO narcissism than when it is low.
Sustainability 2020, 12, x FOR PEER REVIEW 13 of 19
We also found that the relationships of perceived CSR with Tobin Q, EPS, and ROE mediated
by competitive advantage are strengthened with the moderation of CEO narcissism: 0.16 (95% CI
[0.15, 0.39]), 0.49 (95% CI [0.11, 1.22]), 0.38 (95% CI [0.19, 0.88]), respectively. Thus, Hypothesis 4 is
supported. Moreover, we also found statistically significant effect of CSR disclosure with Tobin Q,
earnings per share and return on equity mediated by competitive advantage is strengthen with the
moderation of CEO narcissism 0.06 (95% CI [0.03, 0.10]), 0.18 (95% CI [0.06, 0.23]), 0.14 (95% CI [0.04,
0.29]) respectively. This supported our Hypothesis 4. Conversely, the impact of CSR disclosure on
perceived financial performance through the mediation of competitive advantage remained
statistically insignificant: 0.01 (95% CI [−0.02, 0.09]).
Moreover, for a better understanding of the CEO narcissism moderation effect, we plotted the
moderation effects in Figure 5. It represented, CEO narcissism strengthened the impact of perceived
CSR and CSR disclosure on competitive advantage. It can also be noticed in Figure 5 that the above-
mentioned effects are strengthened at a high level of CEO narcissism than when it is low.
Figure 5. Moderation of CEO narcissism.
5. Discussions and Conclusions
The CSR and FFP relationship has remained the topic of importance for academic scholars and
practitioners in the field of management and finance for the last few decades [1,8]. Recent calls for
research on antecedents and consequences of CSR have drawn the attention of researchers worldwide
and in developing economies in particular [42]. A vast stream of literature on the CSR and FFP
relationship investigated the direct impact of CSR on FFP and found positive, negative, and even no
effects [13,70]. However, these studies have not explained how CSR can be related to financial
performance positively, negatively or neutrally. Accordingly, various attempts have been made to
come up with the mechanisms and boundary conditions which can justify the direction of this
relationship. But no final consensus has been established so far on the association of CSR with firms’
1
2
3
4
5
Low PCSR High PCSR
Competitive
Advantage
Low CEON
1
1.5
2
2.5
3
3.5
4
4.5
5
Low CSRD High CSRD
Competitive
Advantage
Low CEON
Figure 5. Moderation of CEO narcissism.
5. Discussions and Conclusions
The CSR and FFP relationship has remained the topic of importance for academic scholars and
practitioners in the field of management and finance for the last few decades [1,8]. Recent calls for
research on antecedents and consequences of CSR have drawn the attention of researchers worldwide
and in developing economies in particular [42]. A vast stream of literature on the CSR and FFP
14. Sustainability 2020, 12, 4211 14 of 19
relationship investigated the direct impact of CSR on FFP and found positive, negative, and even
no effects [13,70]. However, these studies have not explained how CSR can be related to financial
performance positively, negatively or neutrally. Accordingly, various attempts have been made
to come up with the mechanisms and boundary conditions which can justify the direction of this
relationship. But no final consensus has been established so far on the association of CSR with firms’
financial performance due to inconsistent findings, and the debate is ongoing [3]. Most of the existing
research has overlooked numerous mediators and boundary conditions to explaining CSR and FFP [28].
Moreover, existing studies have also used distinctive measures of CSR and financial performance,
which may provide ambiguous findings [71].
Thus, the need of the hour is to investigate the CSR and FFP relationship by considering the factors
that have been ignored or given less attention in the present literature. Further, it is also essential to
investigate the multiple indicators of CSR and firms’ financial performance within one framework.
Therefore, this study aims to address these gaps in the existing research on CSR and FFP relationship by
examining an essential mechanism and boundary conditions to explain how and when CSR is linked
with FFP. This research intends to examine the impact of CSR on FFP with the mediation mechanism of
competitive advantage and boundary conditions of CEO narcissism and family ownership. RBV is
used to ground the underlying framework.
Specifically, this research advances the current debate of CSR and firms’ financial performance
relationship by collecting multi-source, multi-method data for various indicators of firms’ CSR initiatives
(CSR perception and disclosure) and financial performance (perception-, market-, and accounting-based)
that have not been jointly investigated so far. Further, the mediation mechanism of competitive
advantage by the theoretical lens of RBV is investigated. Additionally, the boundary conditions of
family ownership and CEO narcissism further enhanced the significance of this research.
First, we investigated the direct impact of CSR perception and disclosure on perception, accounting,
and market-based firms’ financial performance. We found interesting and unique results across several
indicators of CSR and FFP. For instance, there is a direct positive impact of CSR perception on perceived,
accounting, and market-based financial performance. Our findings are in line with the existing
literature on this relationship. For example, Waddock [13] and Akben-Selcuk [72] also reported similar
results. Thus, our research validated studies that have reported a positive impact of CSR on FFP,
in contrast with the neoclassical view, which suggested this relationship to be negative. This research
also found a positive and statistically significant direct impact of CSR disclosure on perception-,
accounting-, and market-based financial performance. These results also verified the existing studies
on this relationship, such as Javeed [10] who found that CSR disclosure and accounting-based financial
performance are directly and positively related. Further, our research also validated that CSR disclosure
is strongly linked with accounting-based financial performance [68,73,74].
Secondly, the present study also seeks to inspect the impact of CSR perception and CSR disclosure
on FFP indicators through the mediation of competitive advantage, and we found partial mediation.
Existing studies carried out by employing the resource-based view noted that sustainable competitive
advantage plays an essential role in achieving a key aim of the corporation, which is to maximize
financial performance [8,75]. Thus, the objective of various organizational strategies is to attain a
sustainable competitive advantage. CSR is one of these strategies which intent to create a good standing
for the firms in the massive competitive environment. Our findings validated the perspectives of
the resource-based view and existing studies on this relationship. For example, Cantele [28] noted
a positive and statistically significant effect of CSR perceptions on perceived financial performance
through the mediation of competitive advantage. We also found a positive relationship, but it remained
statistically insignificant.
There exists little evidence of the impact of CSR disclosure on competitive advantage,
which ultimately translates into accounting- and market-based financial performance. We found
partial mediation of competitive advantage on CSR disclosure and multiple indicators of financial
performance relationship. Saeidi [8] also found partial mediation of competitive advantage on the
15. Sustainability 2020, 12, 4211 15 of 19
effect of CSR disclosure on the perception of financial performance. Regarding the indirect impact
of CSR disclosure on accounting and market-based indicators through the mediation of competitive
advantage, it is not evident in the present literature. However, numerous studies have examined the
direct effect of CSR disclosure on accounting- and market- based financial performance and noted
positive relationship. Thus, further investigations are required to verify our findings.
We analyzed the moderation of family ownership of the effect of perceived CSR and CSR disclosure
on the competitive advantage that, in turn, translate into perception-, market-, and accounting-based
indicators. We found that family ownership strengthened this relationship. To date, we have not found
any research that has investigated the boundary condition of family ownership on the above-mentioned
relationship as most of the existing research is confined to direct effect; we showed that the CSR and
FFP relationship is strengthened with the presence of family ownership.
Moreover, the originality and significance of this study are further enhanced by the boundary
condition of CEO narcissism. We found that the impact of CSR perception and disclosure on the
competitive advantage that ultimately translates to perception-, market-, and accounting-based FFP is
strengthened by CEO narcissism. We noted that no research has so far investigated the moderation of
CEO narcissism directly or indirectly of the association of CSR perceptions and disclosure with multiple
indicators of financial performance or through the mediation of competitive advantage. Hu [76] and
Grewatsch [16] recently called for research on CEO characteristics. The scarcity in the literature on this
relationship is worse in emerging and developing countries particularly.
Specifically, we extended the ongoing CSR and financial performance debate in numerous
ways, such as investigating the mediation mechanism of competitive advantage by underpinning a
resource-based view and moderation of family ownership and CEO narcissism. Finally, we examined
multiple indicators of CSR (perception and disclosure) and firms’ financial performance (perception-,
market-, and accounting-based) under one cohesive framework.
5.1. Theoretical and Practical Implications
This research makes numerous theoretical and practical contributions. For instance, this study
progressed our current understandings of how CSR perception and disclosure provide a competitive
advantage to the firms, which ultimately translated into the perception-, market-, and accounting-based
indicators of financial performance. It also highlighted when the boundary conditions of family
ownership and CEO narcissism influenced this above-said relationship of CSR and FFP. Academically,
our research contributes to the CSR and FFP literature in various striking ways.
First, this research extends and confirms the current line of research on CSR and firms’ financial
performance relationship by analyzing the direct impact of multiple CSR indicators (CSR perception and
disclosure) on multiple financial performance indicators (perception, market and accounting). To date,
there exist no such studies that have examined these relationships together. Second, theoretically,
this research validates the perspectives of the resource-based view, as we found that organizations can
achieve competitive advantage by executing CSR as a value-creating strategy to achieve sustainable
competitive advantage. While existing studies have also examined this mediation of competitive
advantage on the CSR and FFP relationship, our research considered the mediation of competitive
advantage between multiple indicators of CSR and FFP under one cohesive framework. This study also
established that both CSR perception and disclosure provided sustainable competitive advantage to
the firms. Third, the value of this study is extended with the boundary conditions of family ownership
and CEO narcissism as well. We found that the existing literature overlooked the effect of these
boundary conditions on indirect CSR and FFP relationship. Thus, in accordance with RBV, the present
study proved that family ownership and CEO narcissism are such intangible resources that they are
heterogeneous, immobile, valuable, rare, and inimitable. These resources assist firms in achieving
sustainable competitive advantage that ultimately turns into firms’ financial performance.
From a practical viewpoint, this research revealed various means through which managers may
strategically concentrate on their policy implications regarding CSR. Firms can achieve sustainable
16. Sustainability 2020, 12, 4211 16 of 19
competitive advantage by keeping in check their CSR perception and disclosure. Firms should also
focus on their CEO’s narcissism to attain their sustainable development objectives. Narcissism is
usually considered a dark personality trait; however, here, for the CSR policy implications, it is proved
to be strengthen the firms’ CSR initiatives and competitive advantage relationship. The human resource
management of firms should also align the recruitment process with firms’ sustainability policies.
For example, applicants can be evaluated on their personality traits, such as narcissism by asking,
related questions at the time of the interview. Thus, when firms consider CSR as a value-creating strategy,
they may prefer to appoint narcissistic individuals to achieve sustainable competitive advantage.
Finally, managers must also give due attention to family ownership, as family ownership structure
was found to positively influence the firms’ CSR actions and competitive advantage relationship.
5.2. Limitations and Future Directions
This study focuses on firms’ CSR perception and disclosure on FFP with the mediation mechanism
of competitive advantage. It would be valuable to examine the impact of CSR perception and disclosure
on financial performance by considering cross-level mediators and boundary conditions like employees’
performance, leadership style. This research used cross-sectional data. It is recommended for further
studies to collect longitudinal data. This research contributed to the resource-based view. Moreover,
it is also suggested to investigate the relationship of CSR with FFP through other theoretical lenses such
as social identity theory. It would be interesting to uncover the role of micro-level (employee-level)
theory to derive a macro-level (firm-level) relationship. Thus, future studies must concentrate on
multilevel aspects.
Author Contributions: Conceptualization, methodology, formal analysis and preparation of original draft, F.M.,
F.Q. and M.S.; Review and editing, A.A.-M.; Software and formal analysis, J.A., U.S. All authors have read and
agreed to the published version of the manuscript.
Funding: No external funding was received.
Acknowledgments: We thank anonymous reviewers and the editors for their very useful recommendations.
Conflicts of Interest: We state no conflict of interest.
References
1. Wang, W.; Fu, Y.; Qiu, H.; Moore, J.H.; Wang, Z. Corporate social responsibility and employee outcomes:
A moderated mediation model of organizational identification and moral identity. Front. Psychol. 2017,
8, 1906. [CrossRef]
2. Ashrafi, M.; Magnan, G.M.; Adams, M.; Walker, T.R. Understanding the Conceptual Evolutionary Path and
Theoretical Underpinnings of Corporate Social Responsibility and Corporate Sustainability. Sustainability
2020, 12, 760. [CrossRef]
3. Xie, X.; Jia, Y.; Meng, X.; Li, C. Corporate social responsibility, customer satisfaction, and financial performance:
The moderating effect of the institutional environment in two transition economies. J. Clean. Prod. 2017, 150,
26–39. [CrossRef]
4. Van Beurden, P.; Gössling, T. The worth of values–a literature review on the relation between corporate social
and financial performance. J. Bus. Ethics. 2008, 82, 407. [CrossRef]
5. Mahmood, F.; Qadeer, F.; Abbas, Z.; Hussain, I.; Saleem, M.; Hussain, A.; Aman, J. Corporate Social
Responsibility and Employees’ Negative Behaviors under Abusive Supervision: A Multilevel Insight.
Sustainability 2020, 12, 2647. [CrossRef]
6. Abbas, J.; Mahmood, S.; Ali, H.; Ali Raza, M.; Ali, G.; Aman, J.; Bano, S.; Nurunnabi, M. The Effects of
Corporate Social Responsibility Practices and Environmental Factors through a Moderating Role of Social
Media Marketing on Sustainable Performance of Business Firms. Sustainability 2019, 11, 3434. [CrossRef]
7. Herrera, J.; de las Heras-Rosas, C. Corporate social responsibility and human resource management:
Towards sustainable business organizations. Sustainability 2020, 12, 841. [CrossRef]
17. Sustainability 2020, 12, 4211 17 of 19
8. Saeidi, S.P.; Sofian, S.; Saeidi, P.; Saeidi, S.P.; Saaeidi, S.A. How does corporate social responsibility contribute
to firm financial performance? The mediating role of competitive advantage, reputation, and customer
satisfaction. J. Bus. Res. 2015, 68, 341–350. [CrossRef]
9. Wang, Y.; Berens, G. The impact of four types of corporate social performance on reputation and financial
performance. J. Bus. Ethics. 2015, 131, 337–359. [CrossRef]
10. Javeed, S.A.; Lefen, L. An analysis of corporate social responsibility and firm performance with moderating
effects of CEO power and ownership structure: A case study of the manufacturing sector of Pakistan.
Sustainability 2019, 11, 248. [CrossRef]
11. Abdullah, M.I.; Ashraf, S.; Sarfraz, M. The organizational identification perspective of CSR on creative
performance: The moderating role of creative self-efficacy. Sustainability 2017, 9, 2125. [CrossRef]
12. Shin, Y.; Thai, V.V. The impact of corporate social responsibility on customer satisfaction, relationship maintenance
and loyalty in the shipping industry. Corp. Soc. Responsib. Environ. Manag. 2015, 22, 381–392. [CrossRef]
13. Waddock, S.A.; Graves, S.B. The corporate social performance–financial performance link. Strateg. Manag.
1997, 18, 303–319. [CrossRef]
14. Trumpp, C.; Guenther, T. Too little or too much? Exploring U-shaped relationships between corporate
environmental performance and corporate financial performance. Bus. Strat. Environ. 2017, 26, 49–68.
[CrossRef]
15. Ali, H.Y.; Danish, R.Q.; Asrar-ul-Haq, M. How corporate social responsibility boosts firm financial
performance: The mediating role of corporate image and customer satisfaction. Corp. Soc. Responsib.
Environ. Manag. 2019, 27, 166–177. [CrossRef]
16. Grewatsch, S.; Kleindienst, I. When does it pay to be good? Moderators and mediators in the corporate
sustainability–corporate financial performance relationship: A critical review. J. Bus. Ethics 2017, 145,
383–416. [CrossRef]
17. Wang, Q.; Dou, J.; Jia, S. A meta-analytic review of corporate social responsibility and corporate financial
performance: The moderating effect of contextual factors. Bus. Soc. 2016, 55, 1083–1121. [CrossRef]
18. Barney, J.B. The resource-based theory of the firm. Organ. Sci. 1996, 7, 469. [CrossRef]
19. McWilliams, A.; Siegel, D.S.; Wright, P.M. Corporate social responsibility: Strategic implications. J. Manag. Stud.
2006, 43, 1–18. [CrossRef]
20. Branco, M.C.; Rodrigues, L.L. Corporate social responsibility and resource-based perspectives. J. Bus. Ethics.
2006, 69, 111–132. [CrossRef]
21. Shahzad, F.; Rehman, I.U.; Nawaz, F.; Nawab, N. Does family control explain why corporate social
responsibility affects investment efficiency? Corp. Soc. Responsib. Environ. Manag. 2018, 25, 880–888.
[CrossRef]
22. Aguinis, H. Organizational responsibility: Doing good and doing well. APA Handb. Ind. Organ. Psychol.
2011, 3, 855–879.
23. Anser, M.K.; Zhang, Z.; Kanwal, L. Moderating effect of innovation on corporate social responsibility and
firm performance in realm of sustainable development. Corp. Soc. Responsib. Environ. Manag. 2018, 25,
799–806. [CrossRef]
24. Lin, C.-H.; Yang, H.-L.; Liou, D.-Y. The impact of corporate social responsibility on financial performance:
Evidence from business in Taiwan. Technol. Soc. 2009, 31, 56–63. [CrossRef]
25. Ruggiero, P.; Cupertino, S. CSR strategic approach, financial resources and corporate social performance:
The mediating effect of innovation. Sustainability 2018, 10, 3611. [CrossRef]
26. Lu, W.; Chau, K.; Wang, H.; Pan, W. A decade’s debate on the nexus between corporate social and corporate
financial performance: A critical review of empirical studies 2002–2011. J. Clean. Prod. 2014, 79, 195–206.
[CrossRef]
27. Chang, C.-H. The influence of corporate environmental ethics on competitive advantage: The mediation role
of green innovation. J. Bus. Ethics. 2011, 104, 361–370. [CrossRef]
28. Cantele, S.; Zardini, A. Is sustainability a competitive advantage for small businesses? An empirical analysis
of possible mediators in the sustainability–financial performance relationship. J. Clean. Prod. 2018, 182,
166–176. [CrossRef]
29. Kim, K.-H.; Kim, M.; Qian, C. Effects of corporate social responsibility on corporate financial performance:
A competitive-action perspective. J. Manag. 2018, 44, 1097–1118. [CrossRef]
18. Sustainability 2020, 12, 4211 18 of 19
30. McWilliams, A.; Siegel, D.S. Creating and capturing value: Strategic corporate social responsibility,
resource-based theory, and sustainable competitive advantage. J. Manag. 2011, 37, 1480–1495. [CrossRef]
31. Rhou, Y.; Singal, M.; Koh, Y. CSR and financial performance: The role of CSR awareness in the restaurant
industry. Int. J. Hosp. Manag. 2016, 57, 30–39. [CrossRef]
32. Marin, L.; Martín, P.J.; Rubio, A. Doing good and different! The mediation effect of innovation and investment
on the influence of CSR on competitiveness. Corp. Soc. Responsib. Environ. Manag. 2017, 24, 159–171.
[CrossRef]
33. Marín, L.; Rubio, A.; de Maya, S.R. Competitiveness as a strategic outcome of corporate social responsibility.
Corp. Soc. Responsib. Environ. Manag. 2012, 19, 364–376. [CrossRef]
34. Carney, M. Corporate governance and competitive advantage in family-controlled firms. Entrep. Theory Pr.
2005, 29, 249–265. [CrossRef]
35. Block, J.H.; Wagner, M. The effect of family ownership on different dimensions of corporate social
responsibility: Evidence from large US firms. Bus. Strat. Environ. 2014, 23, 475–492. [CrossRef]
36. Zellweger, T.M.; Nason, R.S.; Nordqvist, M.; Brush, C.G. Why do family firms strive for nonfinancial goals?
An organizational identity perspective. Entrep. Theory Pr. 2013, 37, 229–248. [CrossRef]
37. Campbell, W.K.; Hoffman, B.J.; Campbell, S.M.; Marchisio, G. Narcissism in organizational contexts.
Hum. Resour. Manag. Rev. 2011, 21, 268–284. [CrossRef]
38. Tang, Y.; Mack, D.Z.; Chen, G. The differential effects of CEO narcissism and hubris on corporate social
responsibility. Strateg. Manag. 2018, 39, 1370–1387. [CrossRef]
39. Petrenko, O.V.; Aime, F.; Ridge, J.; Hill, A. Corporate social responsibility or CEO narcissism? CSR motivations
and organizational performance. Strateg. Manag. 2016, 37, 262–279. [CrossRef]
40. Podsakoff, P.M.; MacKenzie, S.B.; Lee, J.-Y.; Podsakoff, N.P. Common method biases in behavioral research:
A critical review of the literature and recommended remedies. J. Appl. Psychol. 2003, 88, 879. [CrossRef]
41. Jones, D.A.; Newman, A.; Shao, R.; Cooke, F.L. Advances in employee-focused micro-level research on
corporate social responsibility: Situating new contributions within the current state of the literature.
J. Bus. Ethics. 2019, 157, 293–302. [CrossRef]
42. John, A.; Qadeer, F.; Shahzadi, G.; Jia, F. Getting paid to be good: How and when employees respond to
corporate social responsibility? J. Clean. Prod. 2019, 215, 784–795. [CrossRef]
43. Mishra, S.; Suar, D. Does corporate social responsibility influence firm performance of Indian companies?
J. Bus. Ethics. 2010, 95, 571–601. [CrossRef]
44. Maignan, I.; Ferrell, O. Antecedents and benefits of corporate citizenship: An investigation of French
businesses. J. Bus. Res. 2001, 51, 37–51. [CrossRef]
45. Khan, A.; Muttakin, M.B.; Siddiqui, J. Corporate governance and corporate social responsibility disclosures:
Evidence from an emerging economy. J. Bus. Ethics. 2013, 114, 207–223. [CrossRef]
46. Blasi, S.; Caporin, M.; Fontini, F. A multidimensional analysis of the relationship between corporate social
responsibility and firms’ economic performance. Ecol. Econ. 2018, 147, 218–229. [CrossRef]
47. Kansal, M.; Joshi, M.; Batra, G.S. Determinants of corporate social responsibility disclosures: Evidence from
India. Adv. Account. 2014, 30, 217–229. [CrossRef]
48. Yuen, K.F.; Thai, V.V.; Wong, Y.D.; Wang, X. Interaction impacts of corporate social responsibility and service
quality on shipping firms’ performance. Transport. Res. A-Pol. 2018, 113, 397–409. [CrossRef]
49. Malik, M.S.; Kanwal, L. Impact of corporate social responsibility disclosure on financial performance:
Case study of listed pharmaceutical firms of Pakistan. J. Bus. Ethics. 2018, 150, 69–78. [CrossRef]
50. Galvin, B.M.; Lange, D.; Ashforth, B.E. Narcissistic organizational identification: Seeing oneself as central to
the organization’s identity. Acad. Manag. Rev. 2015, 40, 163–181. [CrossRef]
51. Zhao, Z.; Meng, F.; He, Y.; Gu, Z. The influence of corporate social responsibility on competitive advantage
with multiple mediations from social capital and dynamic capabilities. Sustainability 2019, 11, 218. [CrossRef]
52. Protogerou, A.; Caloghirou, Y.; Lioukas, S. Dynamic capabilities and their indirect impact on firm performance.
Ind. Corp. Chang. 2012, 21, 615–647. [CrossRef]
53. Chen, C.; Zhou, Z. Research on the Influence of Corporate Social Responsibility on the Persistence of
Corporate Competitive Advantage. Forum Sci. Technol. China 2014, 5, 68–73.
54. Chen, Y.-S.; Lai, S.-B.; Wen, C.-T. The influence of green innovation performance on corporate advantage in
Taiwan. J. Bus. Ethics. 2006, 67, 331–339. [CrossRef]
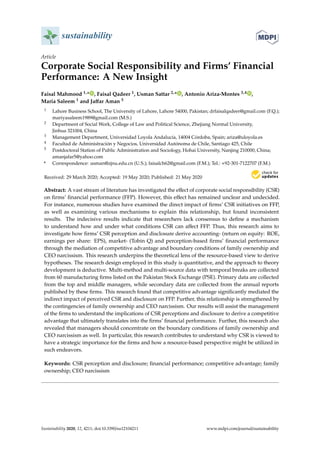
![Sustainability 2020, 12, 4211 2 of 19
1. Introduction
Academics in the field of management and finance consider corporate social responsibility
(CSR) an indispensable topic of research, and several organizations are also actively getting engaged
in CSR activities [1,2]. CSR investments provide various benefits to the firms that may enhance
their financial performance, i.e., access to funds, low financing cost, an increase in stock returns,
and customer loyalty [3]. Organizations’ CSR initiatives also help them to cope with the uncertain
business environment, such as today’s dynamic, worldwide, and high-tech corporate era [4]. Moreover,
CSR engagements assist organizations to achieve sustainable development as there is increasing
demand for eco-friendly services and products. Accordingly, existing literature has investigated the
concept of CSR in multiple ways and directions to establish the effect of firms’ CSR activities on
their employees’ behaviors [1,5,6], human resources [7], customer satisfaction [8], firm reputation [9],
creative and financial performance [10,11]. But the relationship between the firms’ CSR engagements
and firms’ financial performance (FFP) remains a mainstream topic of research [3].
Thus, numerous studies have investigated the association of CSR with FFP in various viewpoints
but have come up with vague and inconsistent findings. For instance, firms’ CSR initiatives can provide
more gains than the cost incurred, and thus, CSR activities increase firms’ financial performance [12,13].
In contrast, the neoclassical economists claimed that firms could overlook such social costs and
suggested a negative relationship [14]. So, no final consensus has been established so far, and the
relationship of CSR with FFP is still debatable due to inconsistent results. Moreover, existing research has
also argued that CSR and FFP relationships could be better explained through mediation mechanisms
and boundary conditions, which are currently overlooked in most of the studies and can lead to
biased results [15,16]. Existing literature has also suggested that CSR and FFP relationships must be
examined through the mediation and contingencies instead of direct relationships. Xie [3] noted that
existing research on CSR and FFP overlooked various factors that should be addressed in future studies.
Moreover, existing studies also remained distinct regarding CSR and FFP measures [17]. A number
of studies are confined to CSR perception or databases of CSR ratings such as the KLD database
(Kinder, Lydenberg, and Domini). But there are only a few studies that measured CSR disclosure
directly by taking data from the annual reports [8]. Similarly, firms’ financial performance is also
measured through distinctive measures, for example, accounting-, market-, and perception-based
financial performance. But no study has considered all these multiple indicators of CSR and financial
performance under one framework, and this may lead to inconclusive findings.
Thus, the present study aims to address the above-discussed discrepancies and extend the current
debate of CSR and FFP relationship in numerous ways. For example, this research considers both CSR
perceptions and disclosure. We also incorporate multiple indicators of firms’ financial performance,
such as perception-, accounting-, and market-based. Further, this study investigates the mediation
mechanism of competitive advantage. Likewise, the present research analyzes the boundary conditions
of family ownership and CEO narcissism on the CSR and FFP relationship with the mediation of
competitive advantage. Accordingly, this research investigates some important and new questions:
does competitive advantage mediate the CSR and FFP relationship? And when does the moderation of
family ownership and CEO narcissism influence this relationship?
This study attempts to answer these questions through the theoretical lens of resource-based view
following Barney [18], as firms create sustainable competitive advantage by effectually directing and
operating their competencies and resources, which are exceptional, valuable, cannot be exactly imitated
and no exact alternative is accessible [19]. Firms’ CSR initiatives may assist them in developing some of
these competencies and resources [20]. Thus, a resource-based view offers essential insights to explain
CSR and firms’ financial performance relationship; for instance, the effectiveness of resource-based
view to study CSR perception and disclosure as it emphasizes on precise intangible resources like
employees’ skills, capabilities, culture, and reputation as these are challenging to copy or substitute [20].
The present study also investigated the contingencies of family ownership and CEO narcissism
on the CSR and FFP association with the mediation mechanism of competitive advantage. For instance,](data:image/gif;base64,R0lGODlhAQABAIAAAAAAAP///yH5BAEAAAAALAAAAAABAAEAAAIBRAA7)