
Recommended
Recommended
More Related Content
Similar to Intended thesis - explanation in steps.pdf
Similar to Intended thesis - explanation in steps.pdf (19)
More from raazia gul
Recently uploaded
Recently uploaded (20)
Intended thesis - explanation in steps.pdf
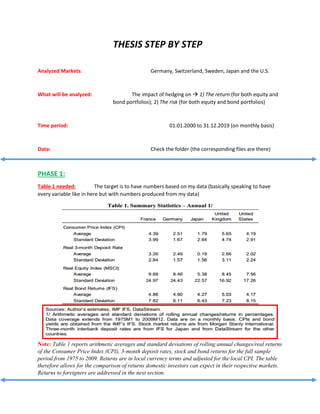
- 1. THESIS STEP BY STEP Analyzed Markets: Germany, Switzerland, Sweden, Japan and the U.S. What will be analyzed: The impact of hedging on 1) The return (for both equity and bond portfolios); 2) The risk (for both equity and bond portfolios) Time period: 01.01.2000 to 31.12.2019 (on monthly basis) Data: Check the folder (the corresponding files are there) PHASE 1: Table 1 needed: The target is to have numbers based on my data (basically speaking to have every variable like in here but with numbers produced from my data) Note: Table 1 reports arithmetic averages and standard deviations of rolling annual changes/real returns of the Consumer Price Index (CPI), 3-month deposit rates, stock and bond returns for the full sample period from 1975 to 2009. Returns are in local currency terms and adjusted for the local CPI. The table therefore allows for the comparison of returns domestic investors can expect in their respective markets. Returns to foreigners are addressed in the next section.
- 2. PHASE 2: Unhedged returns equations empirically explained:
- 3. Table 2 needed: The target is to have numbers based on my data (basically speaking to have every variable like in here but with numbers produced from my data) Note: Table 2 presents exchange rate gains/losses, currency excess return, and unhedged equity and bond returns on a quarterly basis for investors investing in France, Germany, Japan, the U.K. and the U.S. Currency excess returns are returns from borrowing in domestic currency for 3- months, lending the proceeds in foreign currency for the same period, and exchanging back into domestic currency after three months to repay the domestic currency loan. We assume that investors can borrow and lend at the same rate. In reality, currency excess returns to investors would be lower because of transaction costs and bid- ask spreads.
- 4. Tables 3a and 3b needed: The target is to have numbers based on my data (basically speaking to have every variable like in here but with numbers produced from my data)
- 5. Note: Tables 3a and 3b present the breakdown of the volatility of returns to international investors into different components. Exchange rate volatility contributes between 16 and 40 percent to the volatility of investing in foreign stock markets.10 For bond portfolios, exchange rate risk dominates overall volatility contributing up to 95 percent of total unhedged return volatility. The larger relative importance of exchange rate risk for bond portfolios compared to equity portfolios explains why practitioners tend to view hedging exchange risk in the case of bonds as much more important. The covariance of currency returns with bond and equity returns matters generally a lot less for overall investment volatility than currency volatility itself. We also find covariance structures to be unstable over time in many cases.
- 6. PHASE 3: HEDGING How to implement currency hedging: Simply hedge the beginning-of-period value of the investments, in effect setting: Hedging will be done through currency forward contracts: For 100% hedging use this: WHAT DOES HEDGING DO? HEDGING REPLACES THE STOCHASTIC EXCHANGE RATE GAIN/LOSS WITH THE EX ANTE KNOWN FORWARD PREMIUM/DISCOUNT Calculating the forward premium: The calculation of hedged returns requires data on interest rates in the investor’s base currency and in the foreign currency. To be comparable across countries, interest rates should be based on instruments with the same maturity, credit risk and liquidity (Use the Forward Premiums excel files from the folder).
- 7. HEDGING RESULTS FOR: 50% Hedge, 100% Hedge, and No Hedge: A) Single Country Portfolios: Tables 5a and 5b needed: The target is to have numbers based on my data (basically speaking to have every variable like in here but with numbers produced from my data)
- 9. Tables 6a and 6b needed: The target is to have numbers based on my data (basically speaking to have every variable like in here but with numbers produced from my data) Note: Tables 6a and 6b present standard deviations for unhedged, half hedged and fully hedged bond and equity portfolios.
- 10. Note: Tables 6a and 6b present standard deviations for unhedged, half hedged and fully hedged bond and equity portfolios.
- 11. B) Multi Country Portfolios: Returns on multi-country portfolios are simply weighted averages of single-country portfolios. We form portfolios by equally weighting the Swiss, German, Japanese, Swedish, and U.S. stock and bond markets. For portfolio risk, however, results in the multi-country context depend on the covariances among the stock/bond market returns, the covariances among the exchange rate changes, and the cross-covariances among the stock/bond market returns and the exchange rate changes. Table 7 needed: The target is to have numbers based on my data (basically speaking to have every variable like in here but with numbers produced from my data) Note: Table 7 presents quarterly unhedged and hedged returns
- 12. Table 8 needed: The target is to have numbers based on my data (basically speaking to have every variable like in here but with numbers produced from my data) Note: We present quarterly standard deviations of unhedged and hedged returns for multi-country portfolios in Table 8
- 13. PHASE 4: OPTIMAL HEDGING Optimal Hedge Ratios: the hedge resulting in the greatest risk reduction. A) Single Country Portfolios: Optimal Hedge Ratios empirically: From equation (11) it follows that minimizing the variance of a hedged return with respect to the hedge ratio, Φ, is equal to
- 14. Table 9 needed: The target is to have numbers based on my data (basically speaking to have every variable like in here but with numbers produced from my data) Note: We present estimated minimum-variance hedge ratios and associated Newey-West standard errors to correct for autocorrelation due to overlapping return intervals in Table 9.
- 15. B) Multi Country Portfolios: Empirically: Table 10 needed: The target is to have numbers based on my data (basically speaking to have every variable like in here but with numbers produced from my data) Note: Table 10 contains estimated hedge ratios and associated standard errors for stock and bond portfolios formed by equally weighting the markets of Germany, Japan, the U.K. and the U.S over the entire sample period.