CCS335 _ Neural Networks and Deep Learning Laboratory_Lab Complete Record
Use of Box Plot in Six Sigma Data Analyse
1. INTERNATIONAL JOURNAL OF SCIENCE AND INNOVATIVE ENGINEERING & TECHNOLOGY
Use of Box Plot in Six Sigma Data Analyse
Prashant C. Uttarkar
QA Inspector
Poonya Steel Processor Pvt ltd,
Taloja, New Panvel, Maharashtra
Email: prashantlight@yahoo.co.in
I. INTRODUCTION
Six Sigma is a quality improvement programme with a
goal to reduce the number of defects as low as 3.4 parts
per million. Six Sigma is a methodology provides
businesses with the tools to improve the capability of their
business processer. The Six Sigma approach was first
developed in the late 1980s within mass manufacturing
environment in Motorola. In Six Sigma, the purpose of
process improvement is to increase performance and
decrease performance variation. The DMAIC
methodology consists of, succinctly, in defining (D) and
measure (M) the problem, analyse (A) Plan for data
collection; analyse the data and establish and confirm the
“vital few” determinants of performance, improve (I) the
process to remove the root causes and control (C) or
monitor the process to prevent the reappearance of
defects. Box Plot is one of the statistical tools used for Six
Sigma data analysis, useful in identifying outliers and
comparing distributions.
John Tukey introduced the box plot as part of his toolkit
for exploratory data analysis (Tukey, 1970), but it did not
become widely known until formal publication (Book-
Exploratory Data Analysis, Tukey, 1977). In 20th century
Box Plot has become one of the most frequently used
statistical graphics. When comparing distributions
between batches, Tukey’s boxplot is commonly used. Box
plot is based on robust statistics, i.e. it is more tolerant (or
robust) to the presence of outliers. It gives an indication of
shape of distribution in terms of symmetry. It is an
excellent means to determine if there are similarities (or
differences) between two or more data sets by juxtaposing
their box plots.
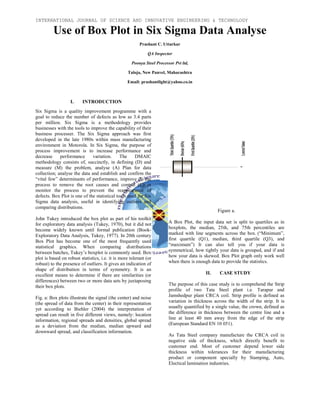
Fig. a: Box plots illustrate the signal (the center) and noise
(the spread of data from the center) in their representation
yet according to Biehler (2004) the interpretation of
spread can result in five different views, namely: location
information, regional spreads and densities, global spread
as a deviation from the median, median upward and
downward spread, and classification information.
Figure a.
A Box Plot, the input data set is split to quartiles as in
boxplots, the median, 25th, and 75th percentiles are
marked with line segments across the box. (“Minimum”,
first quartile (Q1), median, third quartile (Q3), and
“maximum”) It can also tell you if your data is
symmetrical, how tightly your data is grouped, and if and
how your data is skewed. Box Plot graph only work well
when there is enough data to provide the statistics.
II. CASE STUDY
The purpose of this case study is to comprehend the Strip
profile of two Tata Steel plant i.e. Tarapur and
Jamshedpur plant CRCA coil. Strip profile is defined as
variation in thickness across the width of the strip. It is
usually quantified by a single value, the crown, defined as
the difference in thickness between the centre line and a
line at least 40 mm away from the edge of the strip
(European Standard EN 10 051).
As Tata Steel company manufacture the CRCA coil in
negative side of thickness, which directly benefit to
customer end. Most of customer depend lower side
thickness within tolerances for their manufacturing
product or component specially by Stamping, Auto,
Electical lamination industries.
2. INTERNATIONAL JOURNAL OF SCIENCE AND INNOVATIVE ENGINEERING & TECHNOLOGY
For instance, randomly 20 coil approx. of each selected
thickness i.e. 4 thickness such as 2 mm, 1.5mm, 1.2 mm, 1
mm. which is maximum consumsion of
customers. Standard width considered as 1250mm
edge (Tol +20/-00.00) as per Tata Steel TDC.
illustrates Box Plot of Width observsion selected coil
during processing. In Jamshedpur Box Plot two outlier
observed, this two point are Slit coil width.
Figure 1a: Box Plot of CRCA Coil Width as Selected coil for this case
study.
Box Plot shows differences of two plant, the
rectangle span of the box, the position of the median and
the box, the length of the whiskers, and the characteristics
of outliers all convey valuable information about
differences in process performance. Jamshedpur strip
width tolerances is less as compare to Tarapur strip,
therefore Jamshepur coil is more sutiable for any OEM or
prime customer who follow lean principle.
The Profile measurement method along the Strip
C20, C40, 300, Centre, 300, C40, C20. This is 6 standard
position/ point which Tata Steel representative
recommended, which shows work roll profile us
cold rolling process. Graphically using Control
look like concex shape. Below shows Thickness Tol.
Chart at center of width, it is as per Tata TDC.
juxtaposed clearly to highlight the differences (or
similarities) in central tendencies and dispersions
In box Plot, the Strip Profile of Tarapur coil is non
symmetrical as compare to jamshedpur coil is symmetrical
distributed. In Control Chart, the show convex curve
Strip profile which is standard curve of any strip thickness
variation across the width. Jamshedpur Strip is better than
tarapur strip profile, as thickness is in lower negative side
but is tolerance -0.04mm at centre, but at both edge
thickness drops below tolerances C20.
We concluded by Box Plot and with the help of control
chart, jamshedpur strip profile and width of strip both
parameter is appropriate accounding to market depend as
todays top companys follow the Lean Thinking principal
and try to implement DMAIC methodology in their
organization
This dataset shared with Tata Steel every month as a
feedback and suggest any improvement in Profile or
special requirement from any ciritical customer.
time to time depend the strip profile to anal
process parameter, to sustain in global market
INTERNATIONAL JOURNAL OF SCIENCE AND INNOVATIVE ENGINEERING & TECHNOLOGY
approx. of each selected
4 thickness such as 2 mm, 1.5mm, 1.2 mm, 1
consumsion of material by
as 1250mm mill
00.00) as per Tata Steel TDC. Figure 1a
selected coil
In Jamshedpur Box Plot two outlier
Selected coil for this case
Box Plot shows differences of two plant, the size of
, the position of the median and
the box, the length of the whiskers, and the characteristics
of outliers all convey valuable information about
. Jamshedpur strip
width tolerances is less as compare to Tarapur strip,
therefore Jamshepur coil is more sutiable for any OEM or
Strip width is
C20, C40, 300, Centre, 300, C40, C20. This is 6 standard
position/ point which Tata Steel representative
recommended, which shows work roll profile used during
Control chart it
k like concex shape. Below shows Thickness Tol.
TDC. Box Plot
juxtaposed clearly to highlight the differences (or
similarities) in central tendencies and dispersions.
rofile of Tarapur coil is non-
l as compare to jamshedpur coil is symmetrical
show convex curve of
Strip profile which is standard curve of any strip thickness
variation across the width. Jamshedpur Strip is better than
tarapur strip profile, as thickness is in lower negative side
0.04mm at centre, but at both edge
by Box Plot and with the help of control
jamshedpur strip profile and width of strip both
to market depend as
king principal
thodology in their
This dataset shared with Tata Steel every month as a
feedback and suggest any improvement in Profile or
special requirement from any ciritical customer. Tata Steel
time to time depend the strip profile to analysis thier
to sustain in global market.
Tata Steel TDC: Thickness Tolerances Chart.
Figure 1:- Box Plot- Thickness Profile of 1.00 mm.
Figure 2: Average Thickness Tolances Profiles of 1
Table 1: AVERAGE THICKNESS OF STRIP PROFILES 1
Plant C20 C40 300 Centre
Tarapur -0.026 -0.014 -0.010 -0.004
Jamshedpur -0.025 -0.019 -0.010 -0.006
.
-0.030
-0.020
-0.010
0.000
C20 C40 300 Centre
Tarapur Jamshedpur
INTERNATIONAL JOURNAL OF SCIENCE AND INNOVATIVE ENGINEERING & TECHNOLOGY
Chart.
Thickness Profile of 1.00 mm.
files of 1.00mm.
STRIP PROFILES 1.00MM
Centre 300 -1 C40-1 C20-1
0.004 -0.006 -0.018 -0.028
0.006 -0.011 -0.014 -0.020
300 -1 C40-1 C20-1
Jamshedpur
3. INTERNATIONAL JOURNAL OF SCIENCE AND INNOVATIVE ENGINEERING & TECHNOLOGY
Figure 3:- Box Plot: Thickness Proflie of 2.00 mm
Figure 4: Average Thickness of Strip Profiles 2.00mm.
Table 2: AVERAGE THICKNESS OF STRIP PROFILES
Plant
C20 C40 300 Centre 300
Tarapur -0.041 -0.027 -0.019 -0.014 -0.018
Jamshedpur -0.046 -0.035 -0.017 -0.008 -0.014
-0.050
-0.040
-0.030
-0.020
-0.010
0.000
C20 C40 300 Centre 300
Tarapur Jamshedpur
Plant C20 C40 300 Centre 300 C40
Tarapur -0.033 -0.018 -0.007 -0.001 -0.006 -0.015
Jamshedpur -0.036 -0.025 -0.013 -0.010 -0.015 -0.026
INTERNATIONAL JOURNAL OF SCIENCE AND INNOVATIVE ENGINEERING & TECHNOLOGY
STRIP PROFILES 2.00MM.
C40 C20
-0.026 -0.040
-0.026 -0.038
Figure 5: Box Plot-Thickness Profile of 1.50 mm
Figure 6: Average Thickness Tolances Profiles of 1.5
Table 3: AVERAGE THICKNESS OF STRIP PROFILES 1.5
Figure 7: Box Plot: Thickness Profile of 1.20 mm
Figure 8: Average Thickness Tolances Profiles of 1
Table 4: AVERAGE THICKNESS OF STRIP PROFILES 1.2
Plant C20 C40 300 Centre
Tarapur -0.028 -0.017 -0.010 -0.006
Jamshedpur -0.031 -0.021 -0.013 -0.008
III. CONCLUSION
C40 C20
Jamshedpur
-0.040
-0.030
-0.020
-0.010
0.000
C20 C40 300 Centre
Tarapur
-0.040
-0.030
-0.020
-0.010
0.000
C20 C40 300 Centre
Tarapur
C40 C20
0.015 -0.030
0.026 -0.036
INTERNATIONAL JOURNAL OF SCIENCE AND INNOVATIVE ENGINEERING & TECHNOLOGY
Thickness Profile of 1.50 mm.
Average Thickness Tolances Profiles of 1.5mm.
AVERAGE THICKNESS OF STRIP PROFILES 1.50MM.
Thickness Profile of 1.20 mm.
Average Thickness Tolances Profiles of 1.2mm.
OF STRIP PROFILES 1.20MM.
Centre 300 C40 C20
0.006 -0.010 -0.022 -0.031
0.008 -0.012 -0.020 -0.030
CONCLUSION
Centre 300 C40 C20
Jamshedpur
Centre 300 C40 C20
Jamshedpur
4. INTERNATIONAL JOURNAL OF SCIENCE AND INNOVATIVE ENGINEERING & TECHNOLOGY
MAY 2019 ISSUE VOLUME 5 ISBN 978-93-81288-18-4
In todays globalisation world, as competition intensifies,
providing quality products and services has become a
competitive advantage and a need to ensure survival. The
strip profile is one of the parament in sheet metal
industries which increase profit (increase in number of
parts/ components due to negative thickness with in
specification limits) without any exertion. Tata steel
mostly focuse on strip profile in negative side rolling as
per market demand. Jamshedpur coil Strip and Width
profile is much better and close to the median, by Control
Chart shows the convex curves which represent the work
roll crown and rolling methods.
REFERENCES
1. Warren W. Esty and Jeffrey D. Banfield, “The Box-Percentile
Plot”.
2. Maxine P fannkuch, “Comparing Box Plot Distributions: A
Teacher’s Reasoning,” The University of Auckland, New
Zealand.
3. Vignesh M and Balaji R, “Data analysis using Box and Whisker
Plot for Lung Cancer,” International Conference on Innovations
in Power and Advanced Computing Technologies [i-
PACT2017].
4. Heidi Wiesenfelder, “Analyzing Stats with Box-and-Whiskers
Plots,” Six Sigma Data Analysis with Box-and-Whiskers Plots
Six Sigma.
5. Praveen V, Delhi Narendran T, Pavithran R, Chandrasegar
Thirumalai,“Data analysis using Box plot and Control Chart for
Air Quality,” International Conference on Trends in Electronics
and Informatics ICEI 2017.
6. Douglas C. Montgomery and William H. Woodall, “An
Overview of Six Sigma,” International Statistical Review (2008),
76, 3, 329–346 doc.
7. Adan Valles, Jaime Sanchez, Salvador Noriega, and Berenice
Gómez Nuñez,”Implementation of Six Sigma in a Manufacturing
Process: A Case Study,” International Journal of Industrial
Engineering, 16(3), 171-181, 2009.
8. David F. Williamson, PhD; Robert A. Parker, DSc; and Juliette
S. Kendrick, MD,” The Box Plot: A Simple Visual Method to
Interpret Data,” July 1989.
9. Tauseef Aized, “Total Quality Management And Six Sigma”
First published July, 2012.
10. Tata Steel Steelium Brochure and JCAPCPL Product Brochure.
11. Lars Nolle, Alun Armstrong, Adrian Hopgood and Andrew
Ware, “Optimum Work Roll Profile Selection in the Hot Rolling
of Wide Steel Strip using Computational Intelligence”, Lecture
Notes in Computer Science, Vol. 1625, Springer, 1999.
12. Aljabri, A., Jiang, Z. & Wei, D. (2015). Analysis of thin strip
profile by work roll crossing and shifting in asymmetrical
cold rolling. International Journal of Modern Physics B, 29
(10-11), 1540032-1-1540032-7.
13. M. Hubert, E. Vandervieren “An Adjusted Boxplot for Skewed
Distributions”.
14. Sang-Ho Lee1, Gil-Ho Song2, Sung-Jin Lee2 and Byung-Min
Kim “Study on the improved accuracy of strip profile using
numerical formula model in continuous cold rolling with 6-high
mill.” Journal of Mechanical Science and Technology 25 (8)
(2011) 2101~2109.