Downloaded 69 times


![•Starting logstash! --- /opt/logstash/bin
$ sudo ./logstash -f [Location].conf
•Lets start the most basic setup
…continued](https://image.slidesharecdn.com/nullbachav-07may2016-160508075622/75/Null-Bachaav-May-07-Attack-Monitoring-workshop-34-2048.jpg)
![run this!
./logstash -e 'input { stdin { } } output
{elasticsearch {hosts => ["IP:9200"] } }'
Check head plugin
http://IP:9200/_plugin/head](https://image.slidesharecdn.com/nullbachav-07may2016-160508075622/75/Null-Bachaav-May-07-Attack-Monitoring-workshop-35-2048.jpg)
![Setup - Apache access.log
input {
file {
path => "/var/log/apache2/access.log"
type => "apache"
}
}
output {
elasticsearch { hosts => ["IP:9200"] }
stdout { codec => json }
}
Apache logs!](https://image.slidesharecdn.com/nullbachav-07may2016-160508075622/75/Null-Bachaav-May-07-Attack-Monitoring-workshop-36-2048.jpg)

![2 File input configuration!
input {
file {
path => "/var/log/syslog"
type => "syslog"
}
file {
path => "/var/log/apache2/access.log"
type => "apache"
}
}
output {
elasticsearch { hosts => ["IP:9200"] }
stdout { codec => rubydebug }
}](https://image.slidesharecdn.com/nullbachav-07may2016-160508075622/75/Null-Bachaav-May-07-Attack-Monitoring-workshop-38-2048.jpg)
![Logstash Filters!!
input {
file {
path => "/var/log/apache2/access.log"
type => "apache"
}
}
filter {
grok {
match => { "message" => "%{COMBINEDAPACHELOG}" }
}
}
output {
elasticsearch { hosts => ["IP:9200"] }
stdout { codec => json }
}](https://image.slidesharecdn.com/nullbachav-07may2016-160508075622/75/Null-Bachaav-May-07-Attack-Monitoring-workshop-39-2048.jpg)


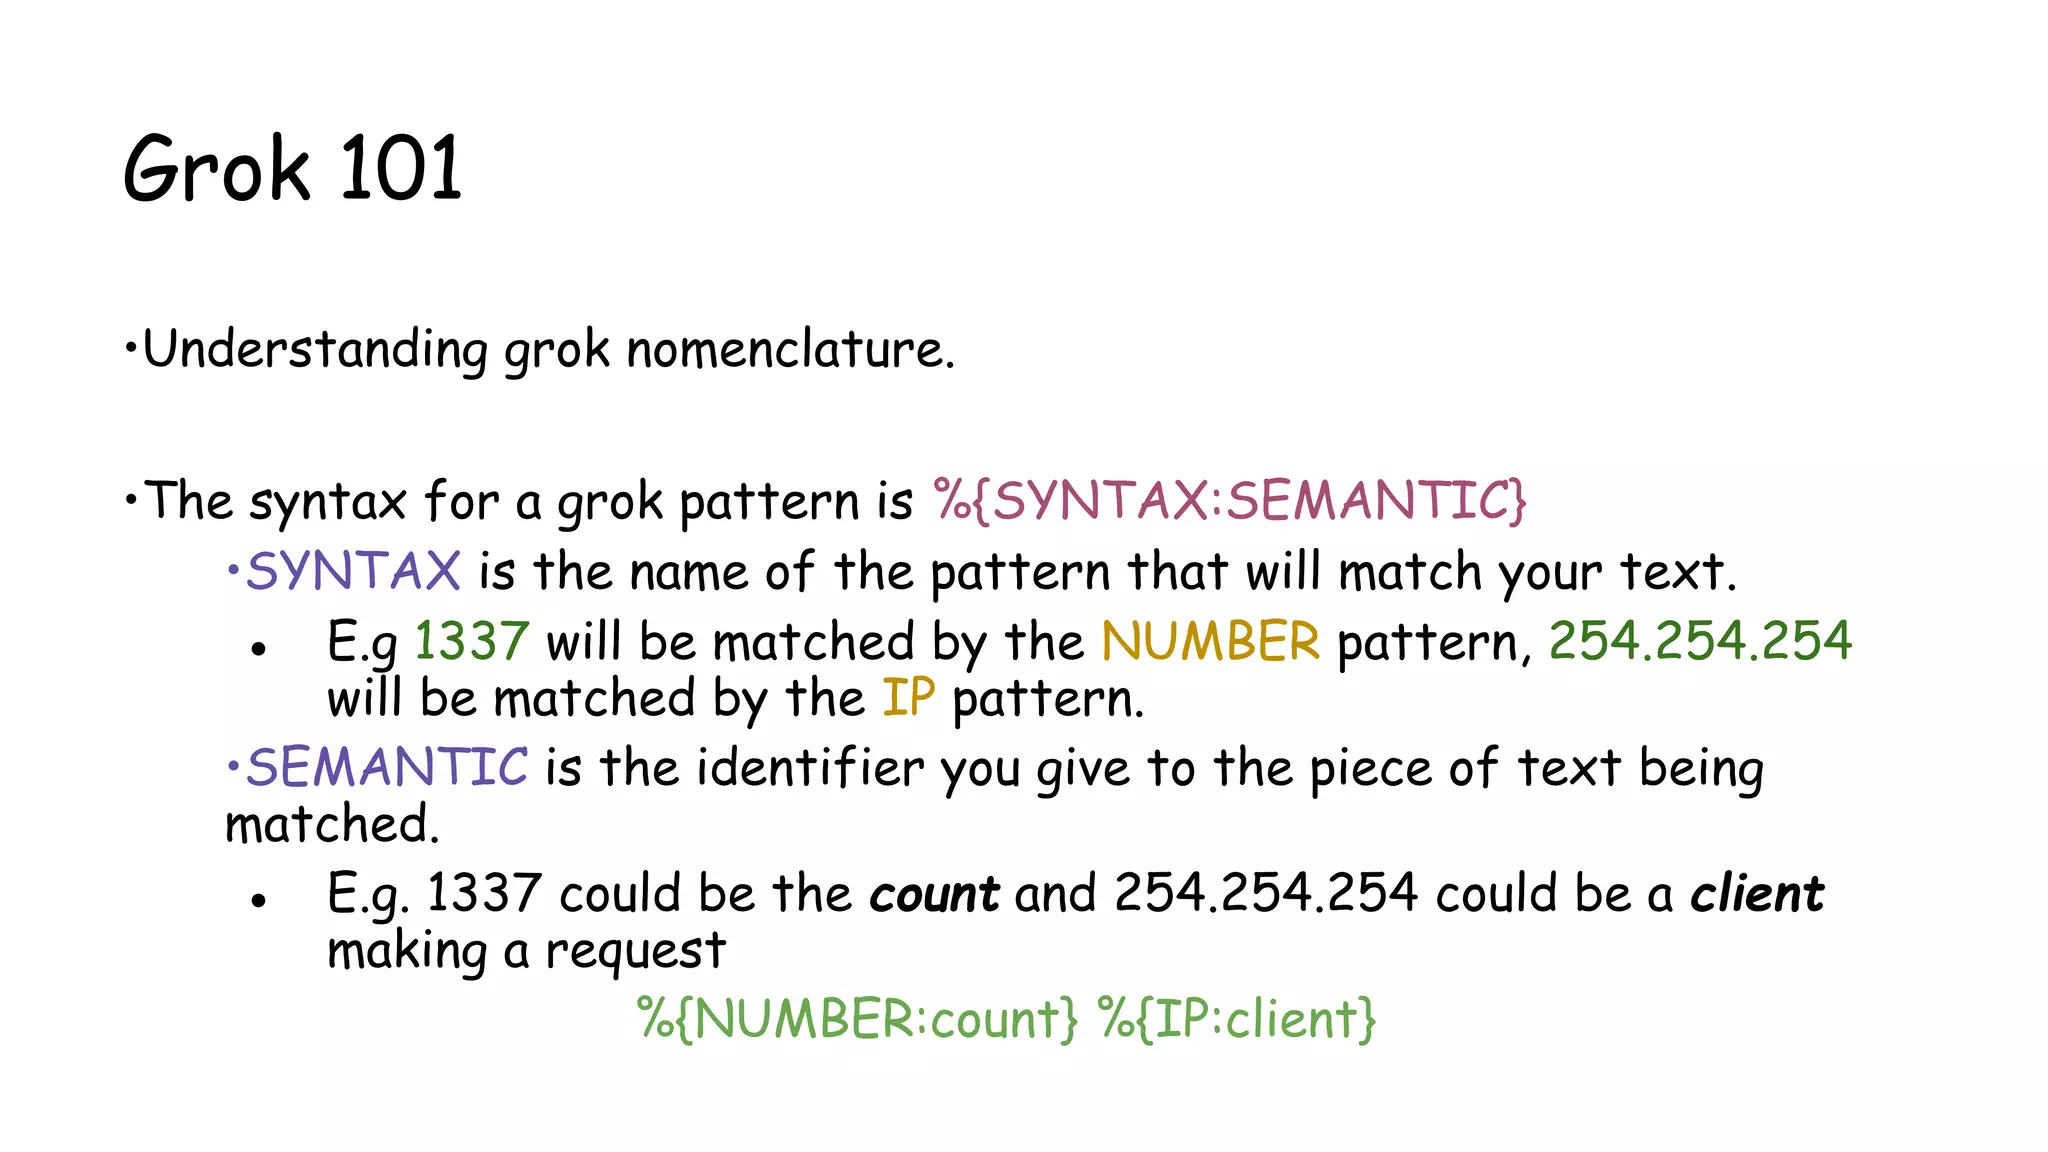

![Grok 101…(continued)
Let’s work out GROK for below:
● 192.168.1.101
● 192.168.1.101:8080
● [15:30:00]
● [03/08/2016]
● [08/March/2016:14:12:13 +0000]](https://image.slidesharecdn.com/nullbachav-07may2016-160508075622/75/Null-Bachaav-May-07-Attack-Monitoring-workshop-48-2048.jpg)
![Playing with grok filters
•Apache access.log event:
123.249.19.22 - - [08/Mar/2016:14:12:13 +0000] "GET /manager/html HTTP/1.1" 404 448
"-" "Mozilla/3.0 (compatible; Indy Library)"
•Matching grok:
%{IPV4} %{USER:ident} %{USER:auth} [%{HTTPDATE:timestamp}] "(?:%{WORD:verb} %
{NOTSPACE:request}(?: HTTP/%{NUMBER:httpversion})?)" %{NUMBER:response} (?:%
{NUMBER:bytes}|-)
•Things can get even more simpler using grok:
%{COMBINEDAPACHELOG}](https://image.slidesharecdn.com/nullbachav-07may2016-160508075622/75/Null-Bachaav-May-07-Attack-Monitoring-workshop-49-2048.jpg)


![#### Filebeat ####
filebeat:
prospectors:
-
paths:
- /var/log/apache2/access.log
input_type: log
document_type: beat
registry_file: /var/lib/filebeat/registry
#### Output ####
output:
### Logstash as output
logstash:
hosts: ["INDEXER-IP:5044"]
#### Logging #####
logging:
to_files: true
files:
path: /var/log/filebeat
name: filebeat
rotateeverybytes: 10485760 # = 10MB
level: error
filebeat-shipper Setup
$sudo nano /etc/filebeat/filebeat.yml](https://image.slidesharecdn.com/nullbachav-07may2016-160508075622/75/Null-Bachaav-May-07-Attack-Monitoring-workshop-56-2048.jpg)
![logstash server(indexer) config -/etc/logstash/beat_indexer.conf
input {
beats {
port => 5044
}
}
filter {
if [type] == "beat" {
grok {
match => { "message" => "%
{COMBINEDAPACHELOG}" }
}
date {
match => [ "timestamp" ,
"dd/MMM/yyyy:HH:mm:ss Z" ]
}
}
}
output {
elasticsearch {
hosts => ["localhost:9200"]
}
}](https://image.slidesharecdn.com/nullbachav-07may2016-160508075622/75/Null-Bachaav-May-07-Attack-Monitoring-workshop-57-2048.jpg)


![DoS Examples!
-Layer 7 attacks:
-Slowloris : GET /index.php HTTP/1.1[CRLF]
-SlowRead : syn->syn,ack->ack->{win:98bytes}
-XMLRPC Attack
-Layer 4 attacks:
-SynFlood
-Zero window scan {window size: 0}
-Amplification attacks](https://image.slidesharecdn.com/nullbachav-07may2016-160508075622/75/Null-Bachaav-May-07-Attack-Monitoring-workshop-60-2048.jpg)
![Logs to Rescue
● "HEAD / HTTP/1.1" 301 5.000 0 "-" "-" - -
● "GET / HTTP/1.1" 408 0 "-" "-"
● **SYN Flood to Host** SourceIP, 3350->> DestIP, 80
● SourceIP - - [09/Mar/2014:11:05:27 -0400] "GET /?4137049=6431829 HTTP/1.0" 403 0 "-
" "WordPress/3.8; http://www.victim.com"](https://image.slidesharecdn.com/nullbachav-07may2016-160508075622/75/Null-Bachaav-May-07-Attack-Monitoring-workshop-61-2048.jpg)

![SynFlood Demo
hping3
Attacker:
$ sudo hping3 -i u1 -S -p 80 192.168.1.1
Victim:
$ tcpdump -n -i eth0 'tcp[13] & 2 !=0'](https://image.slidesharecdn.com/nullbachav-07may2016-160508075622/75/Null-Bachaav-May-07-Attack-Monitoring-workshop-64-2048.jpg)


![Rules Config
● All rules reside in a folder.
● Rules_folder in config.yaml
● Important Configurations
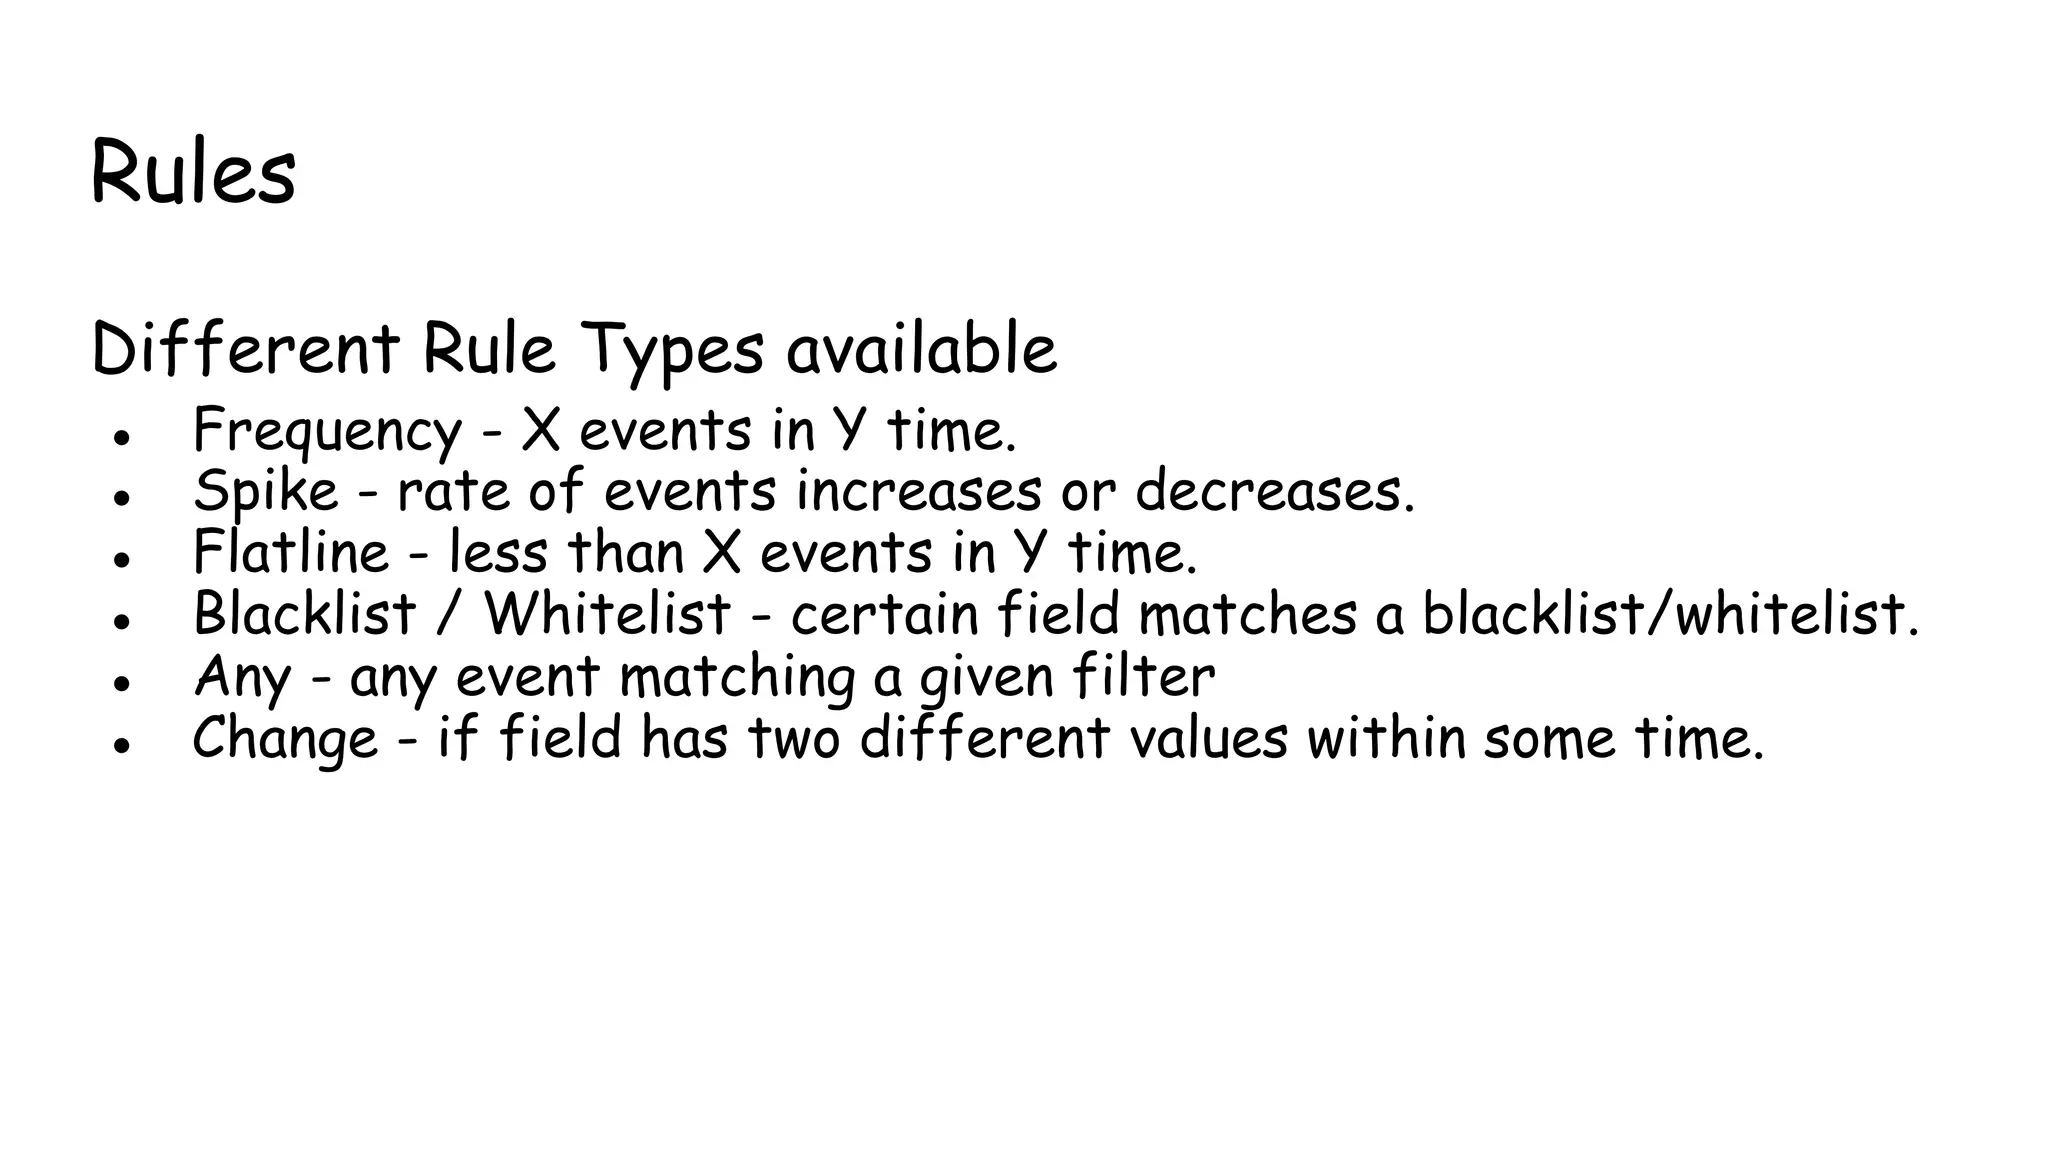
○ type: Rule type to be used (eg. Frequency / spike / etc.)
○ index: (eg. Logstash-*)
○ filter: (eg. term: n host:’xyzhostname’)
○ num_events: (eg. 10)
○ timeframe: [hours / minutes / seconds / days] (eg. Hours: 3)
○ alert: (eg. Email / JIRA / Command / etc.)](https://image.slidesharecdn.com/nullbachav-07may2016-160508075622/75/Null-Bachaav-May-07-Attack-Monitoring-workshop-93-2048.jpg)


![Installing osquery
$ sudo apt-key adv --keyserver keyserver.ubuntu.com --recv-keys
1484120AC4E9F8A1A577AEEE97A80C63C9D8B80B
$ sudo add-apt-repository "deb [arch=amd64] https://osquery-packages.s3.
amazonaws.com/trusty trusty main"
$ sudo apt-get update
$ sudo apt-get install osquery](https://image.slidesharecdn.com/nullbachav-07may2016-160508075622/75/Null-Bachaav-May-07-Attack-Monitoring-workshop-98-2048.jpg)


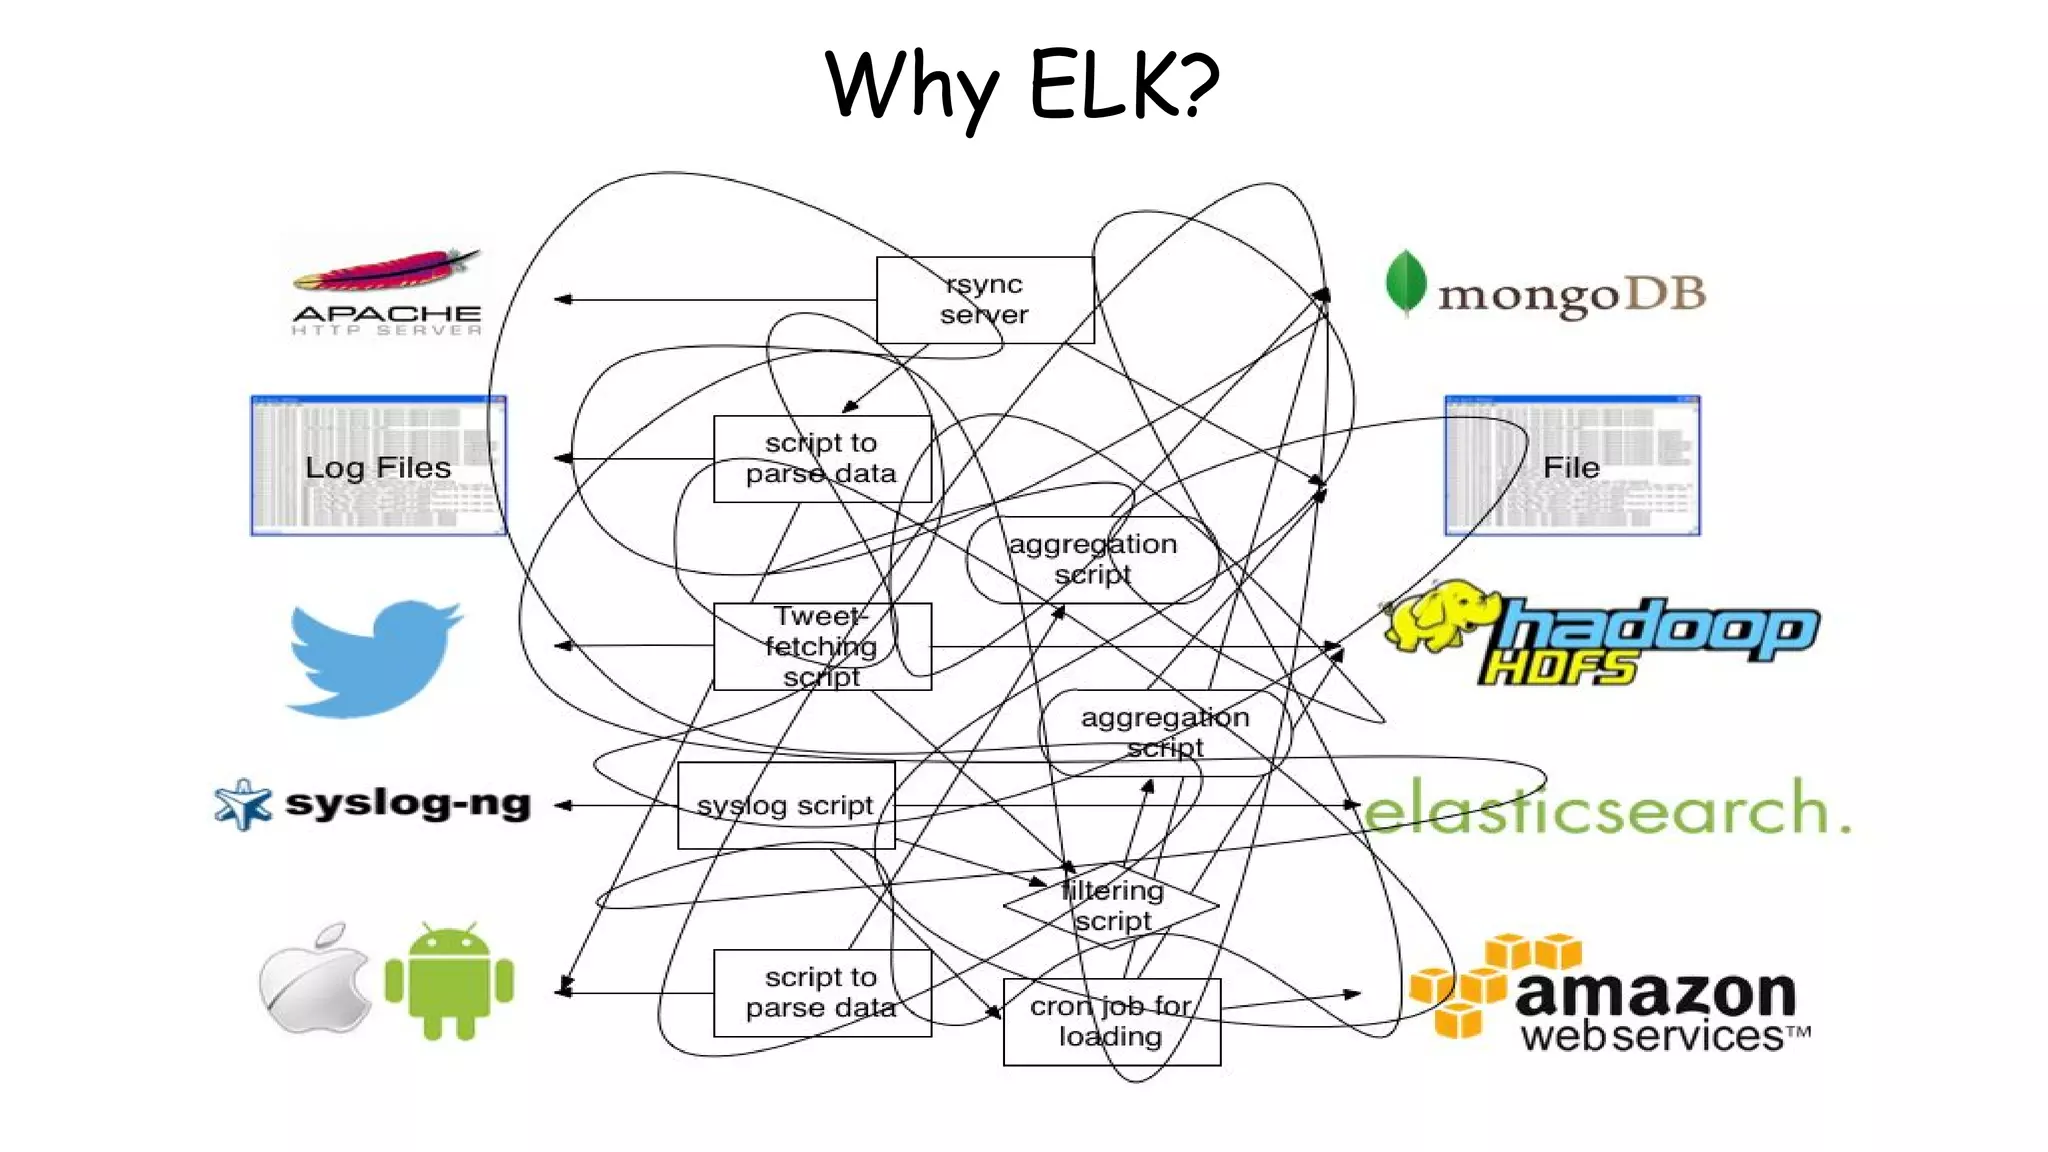
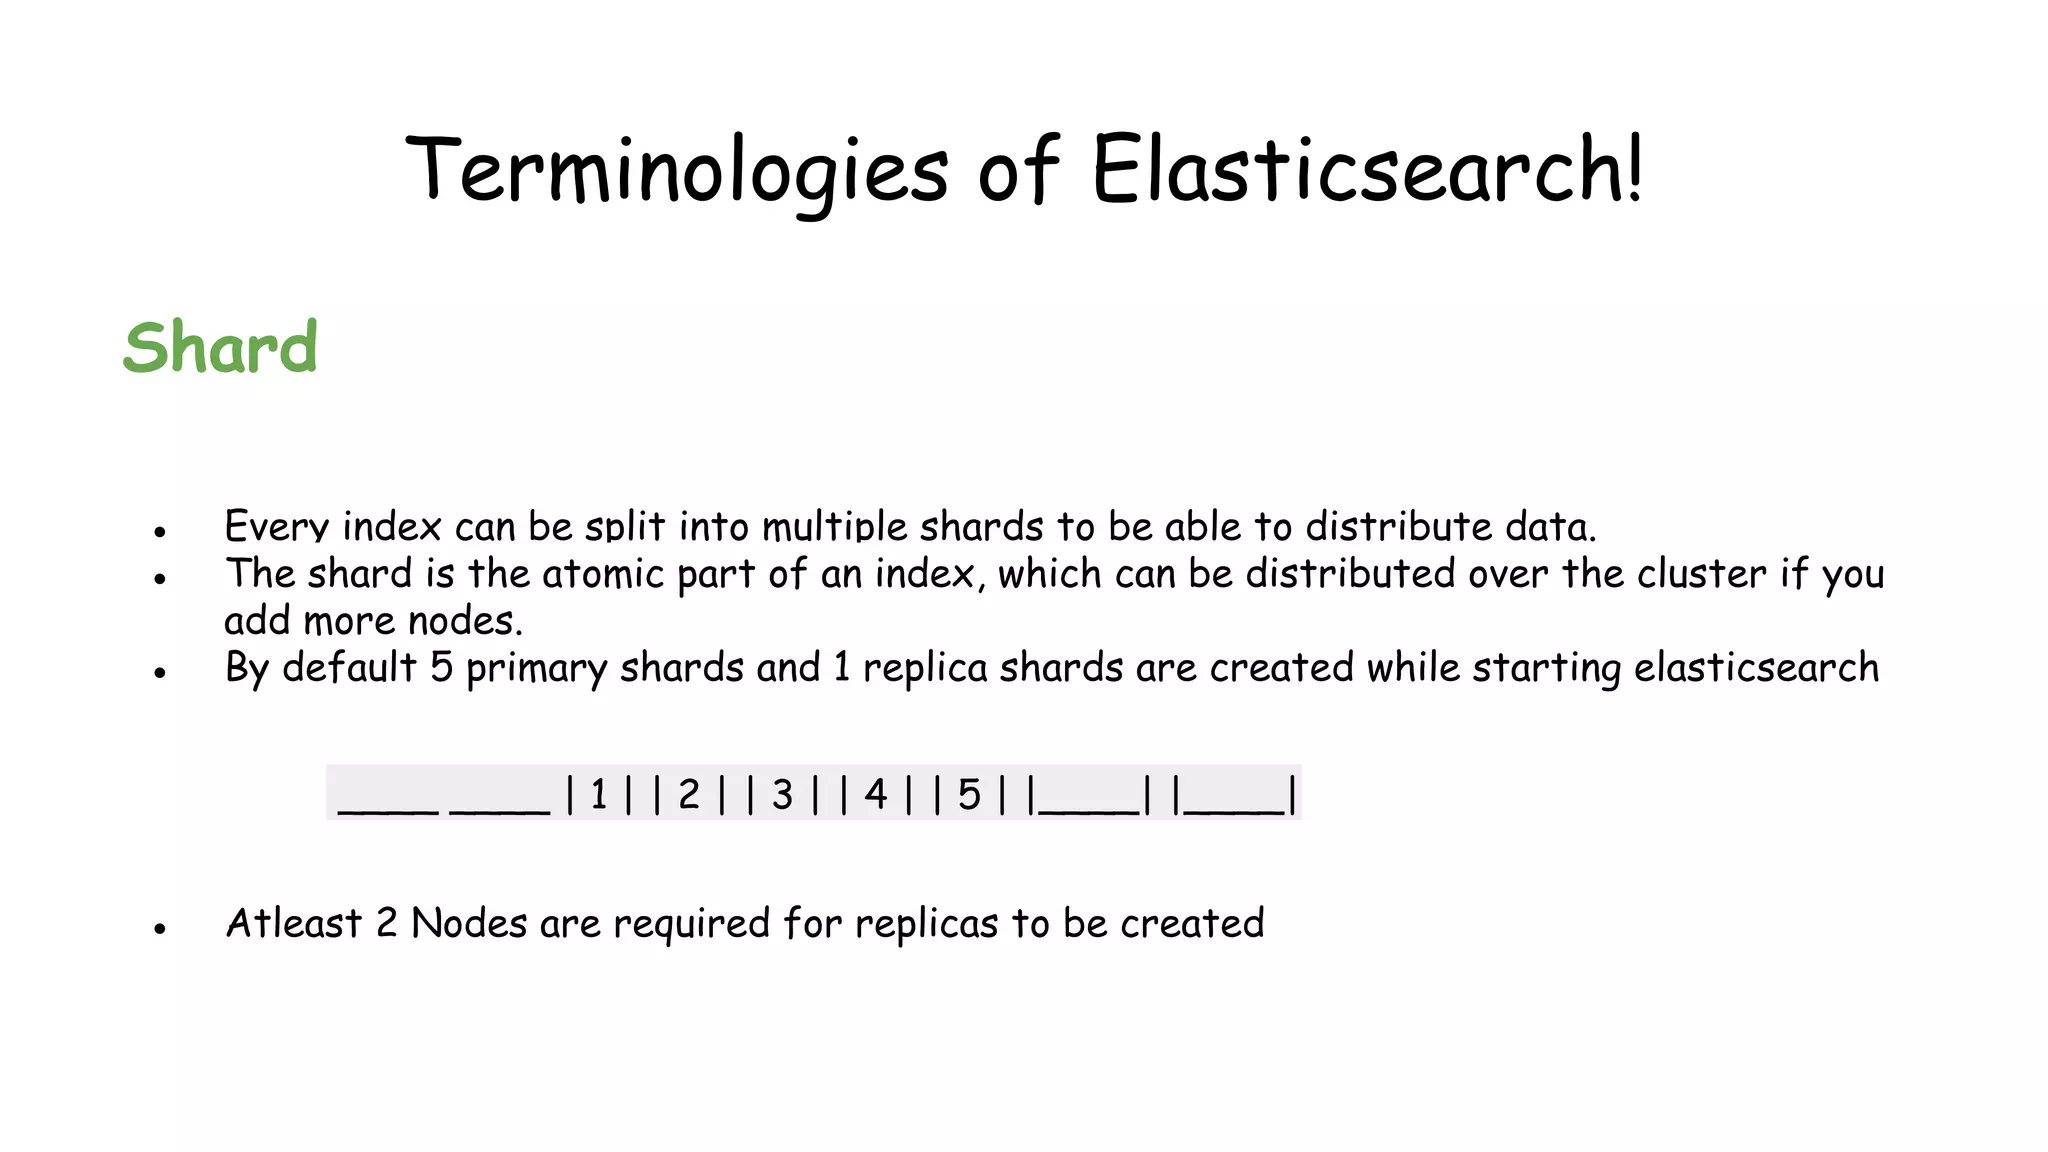
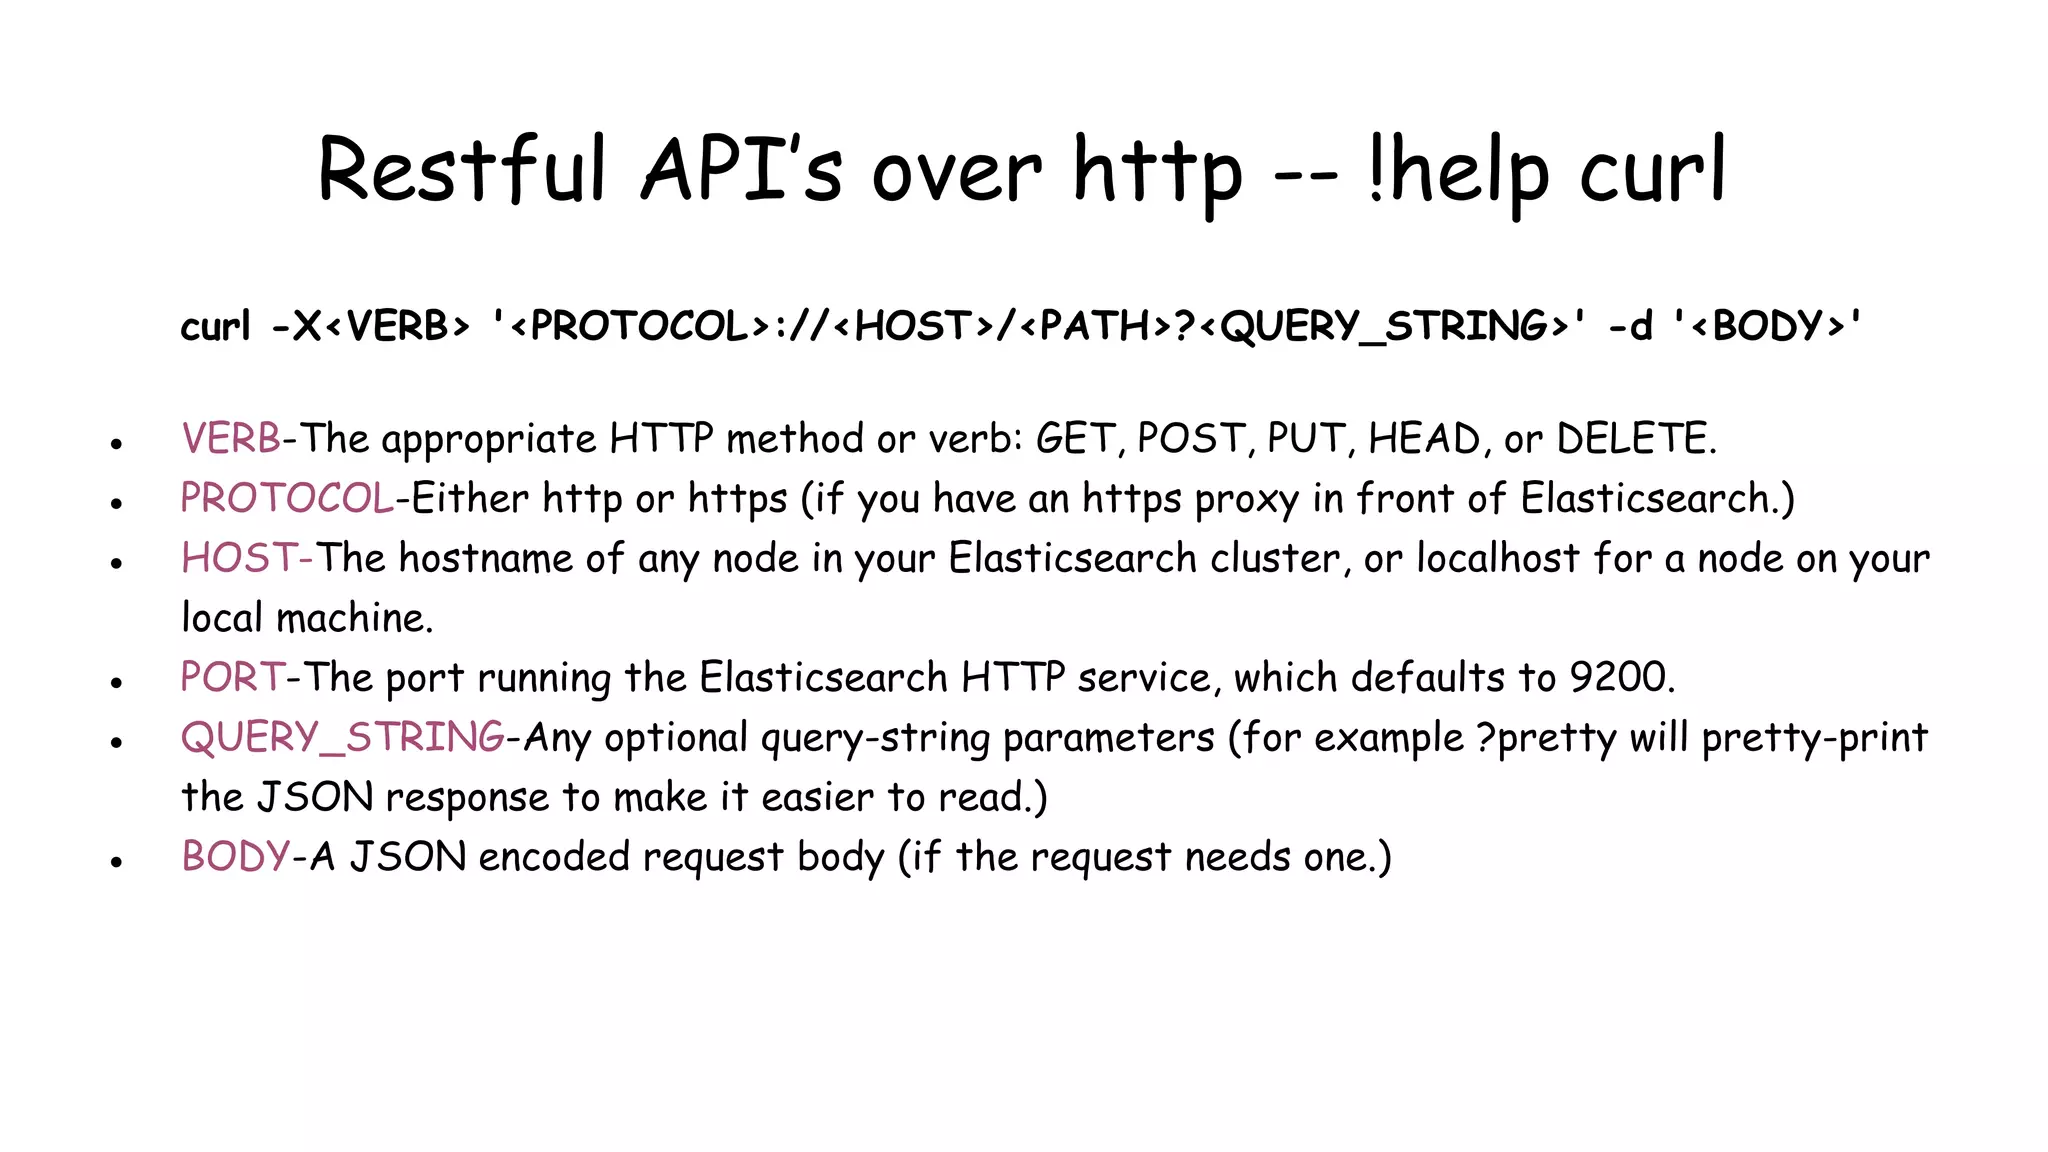
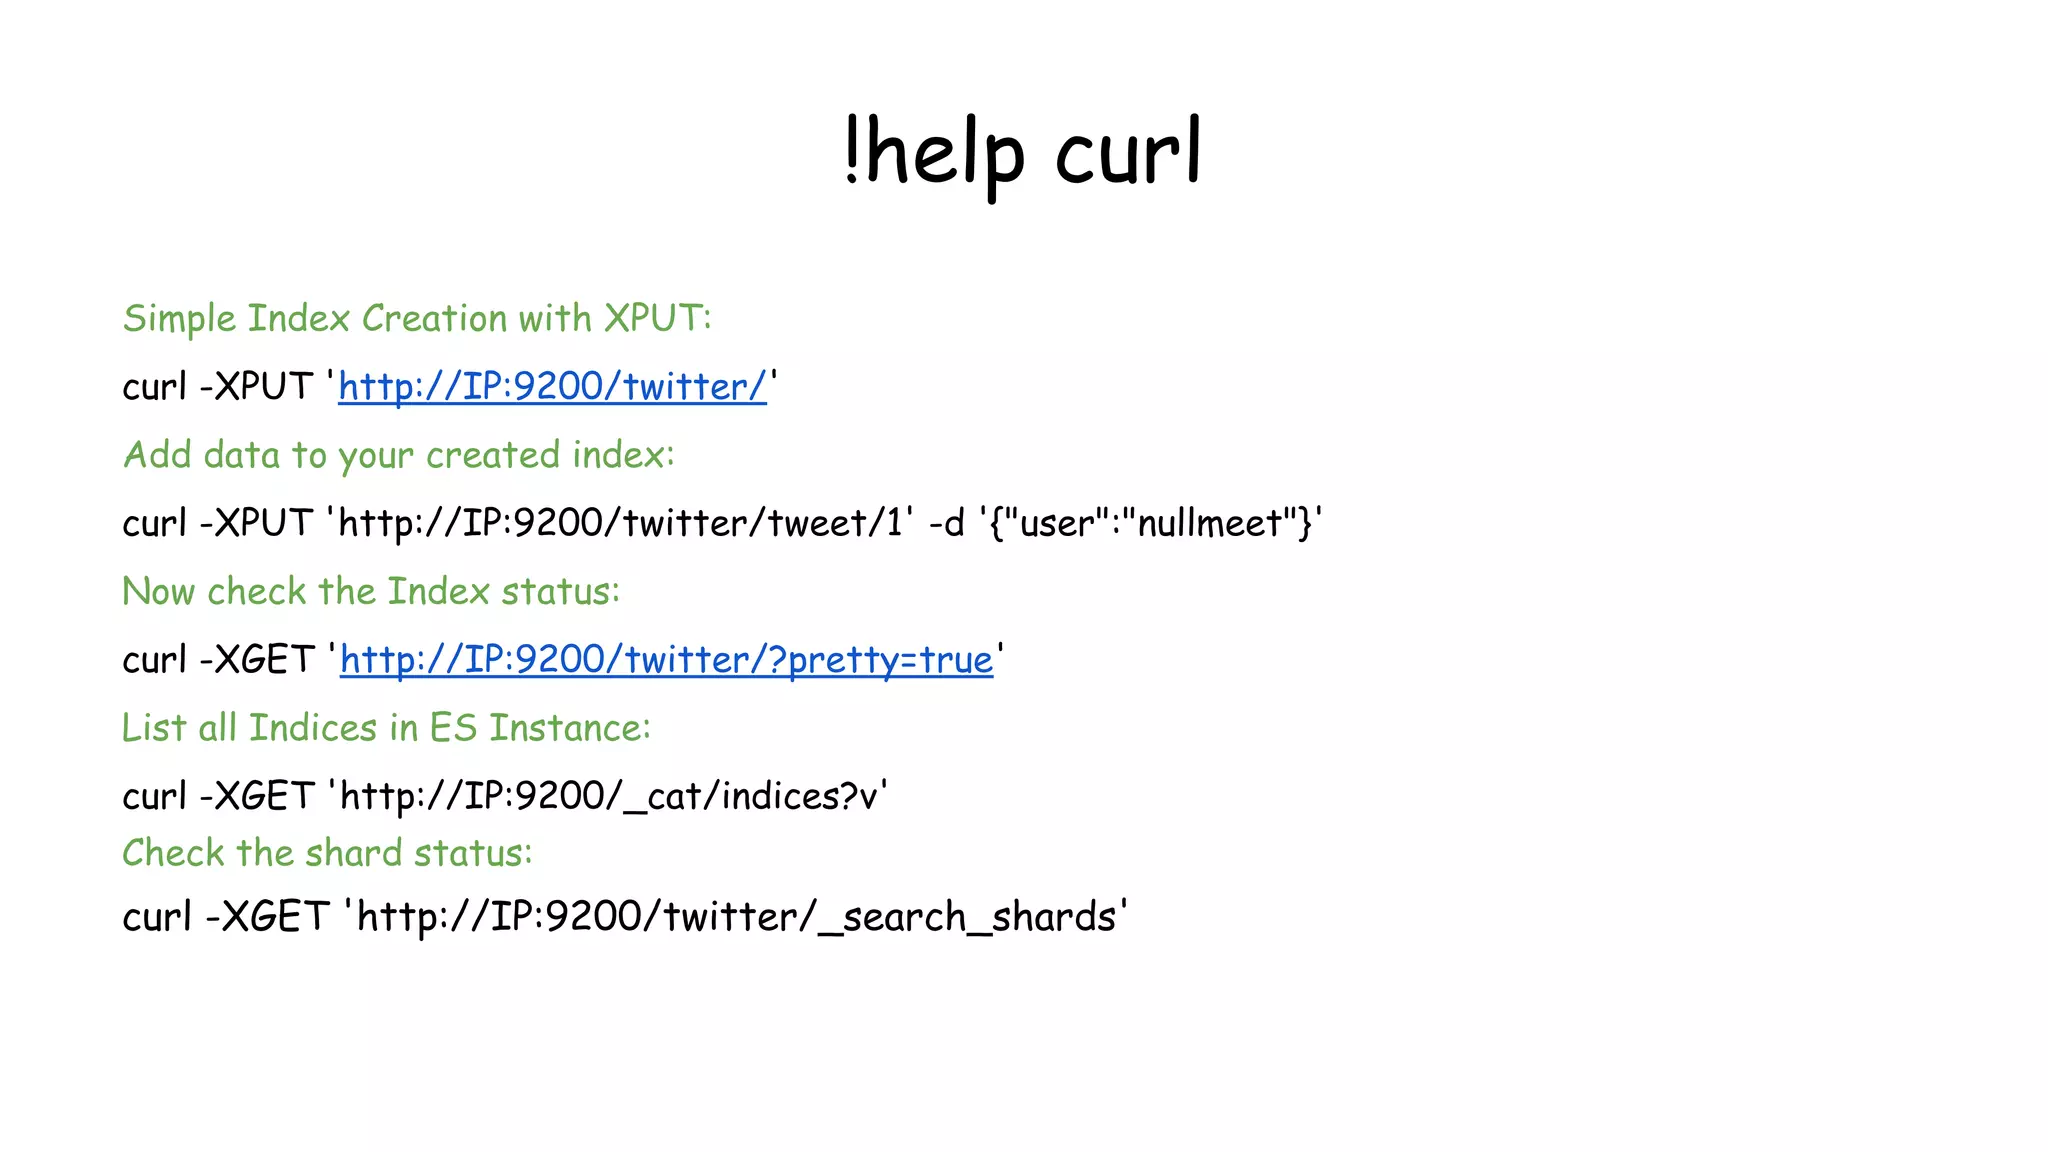
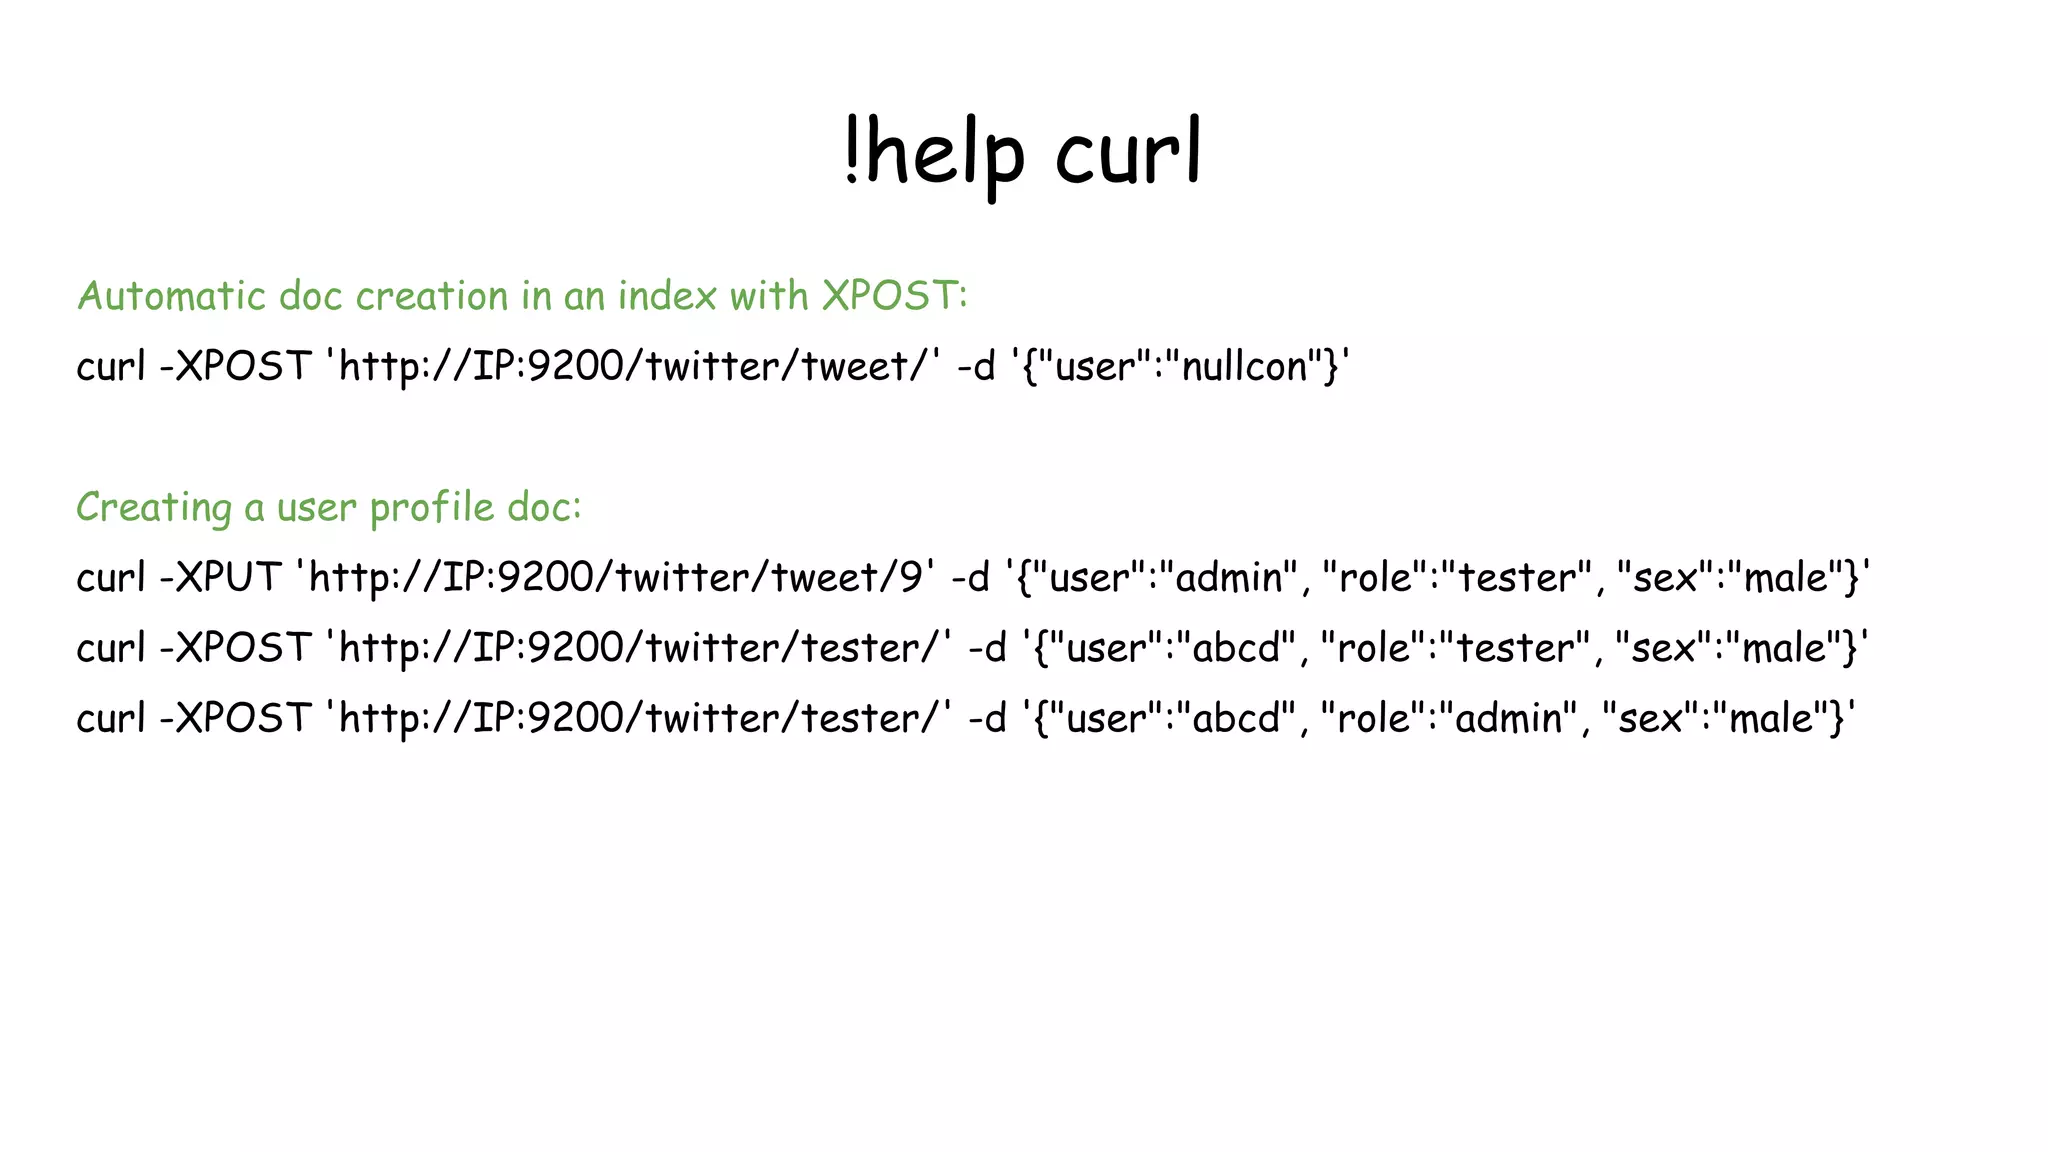
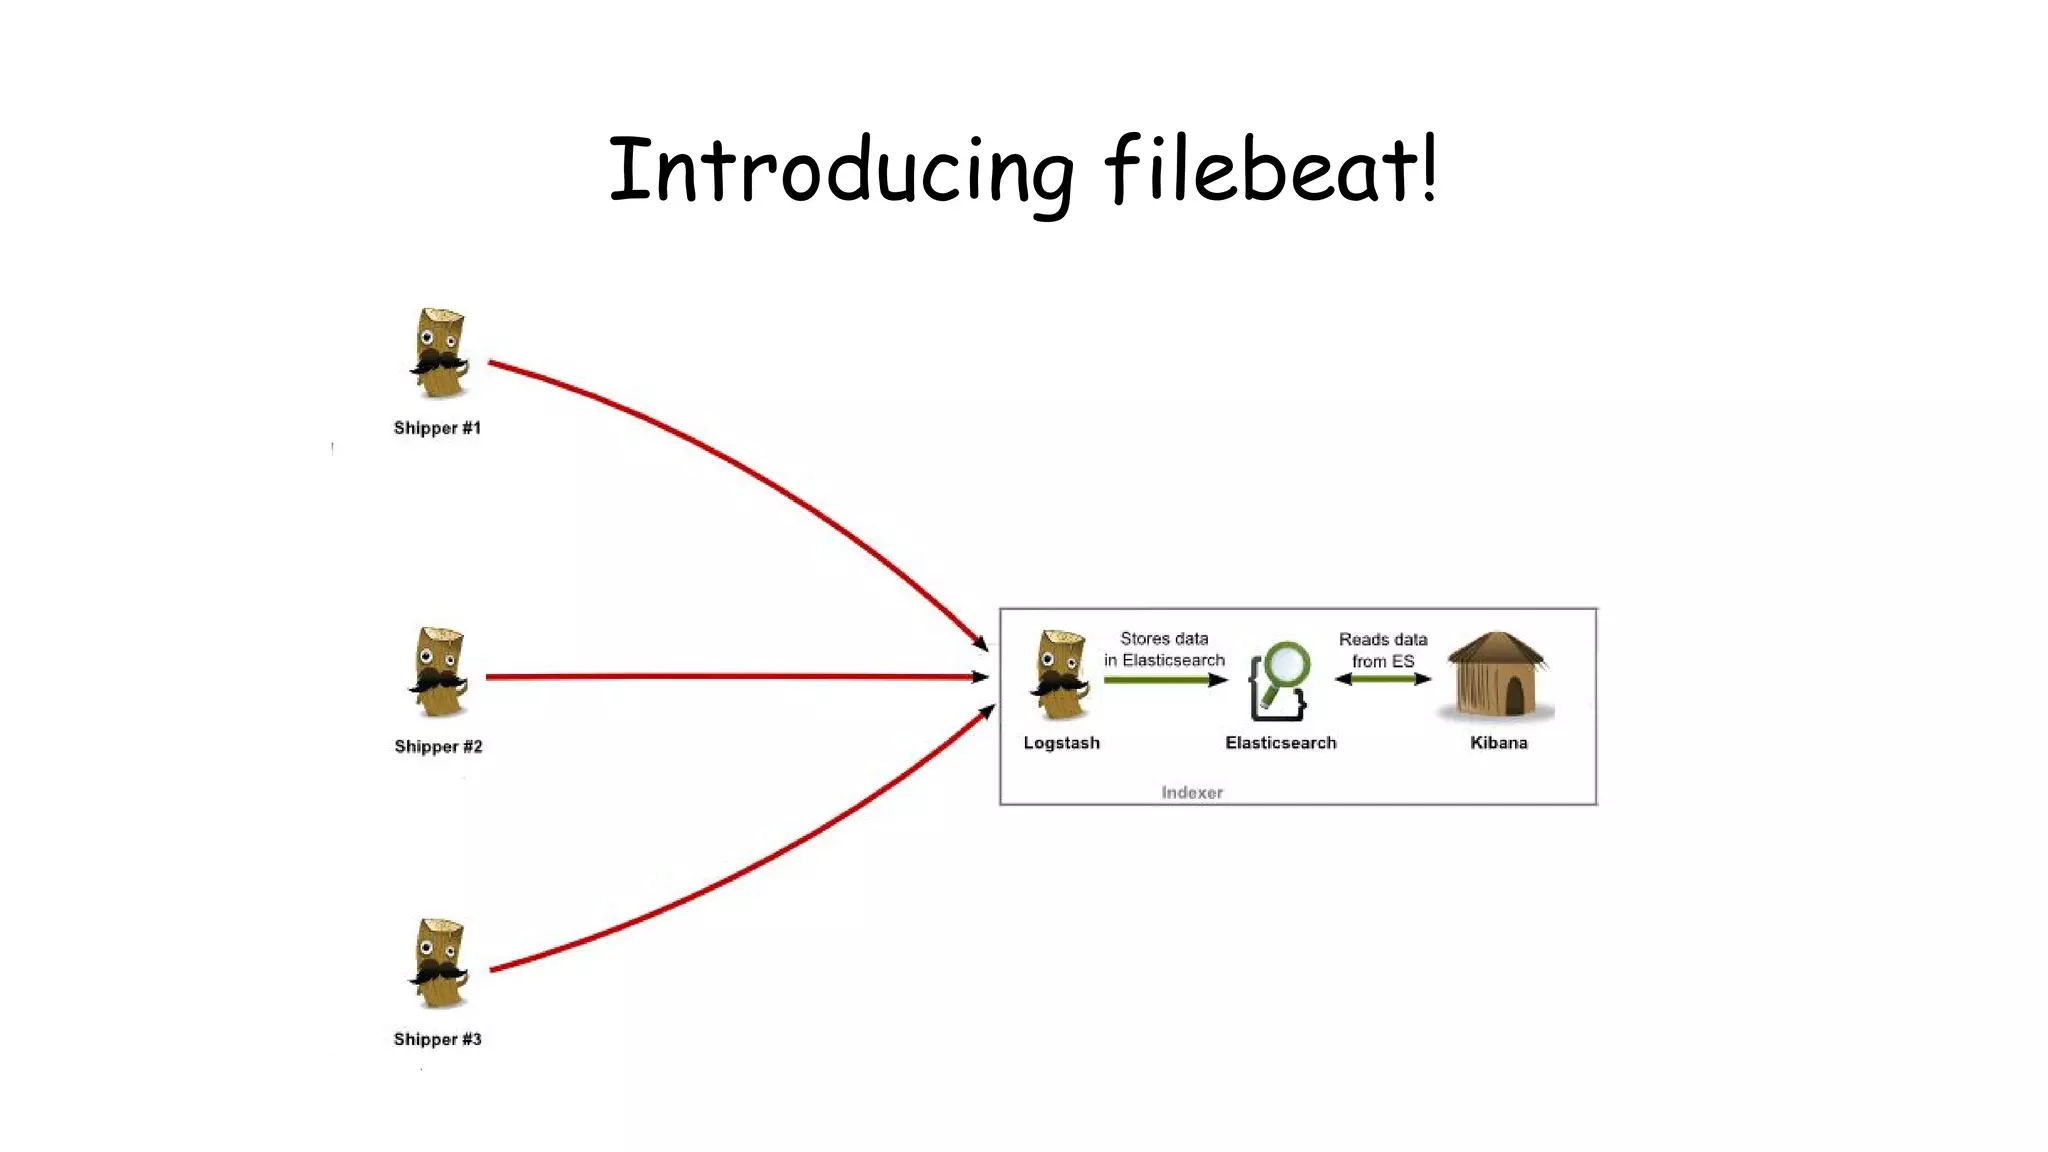
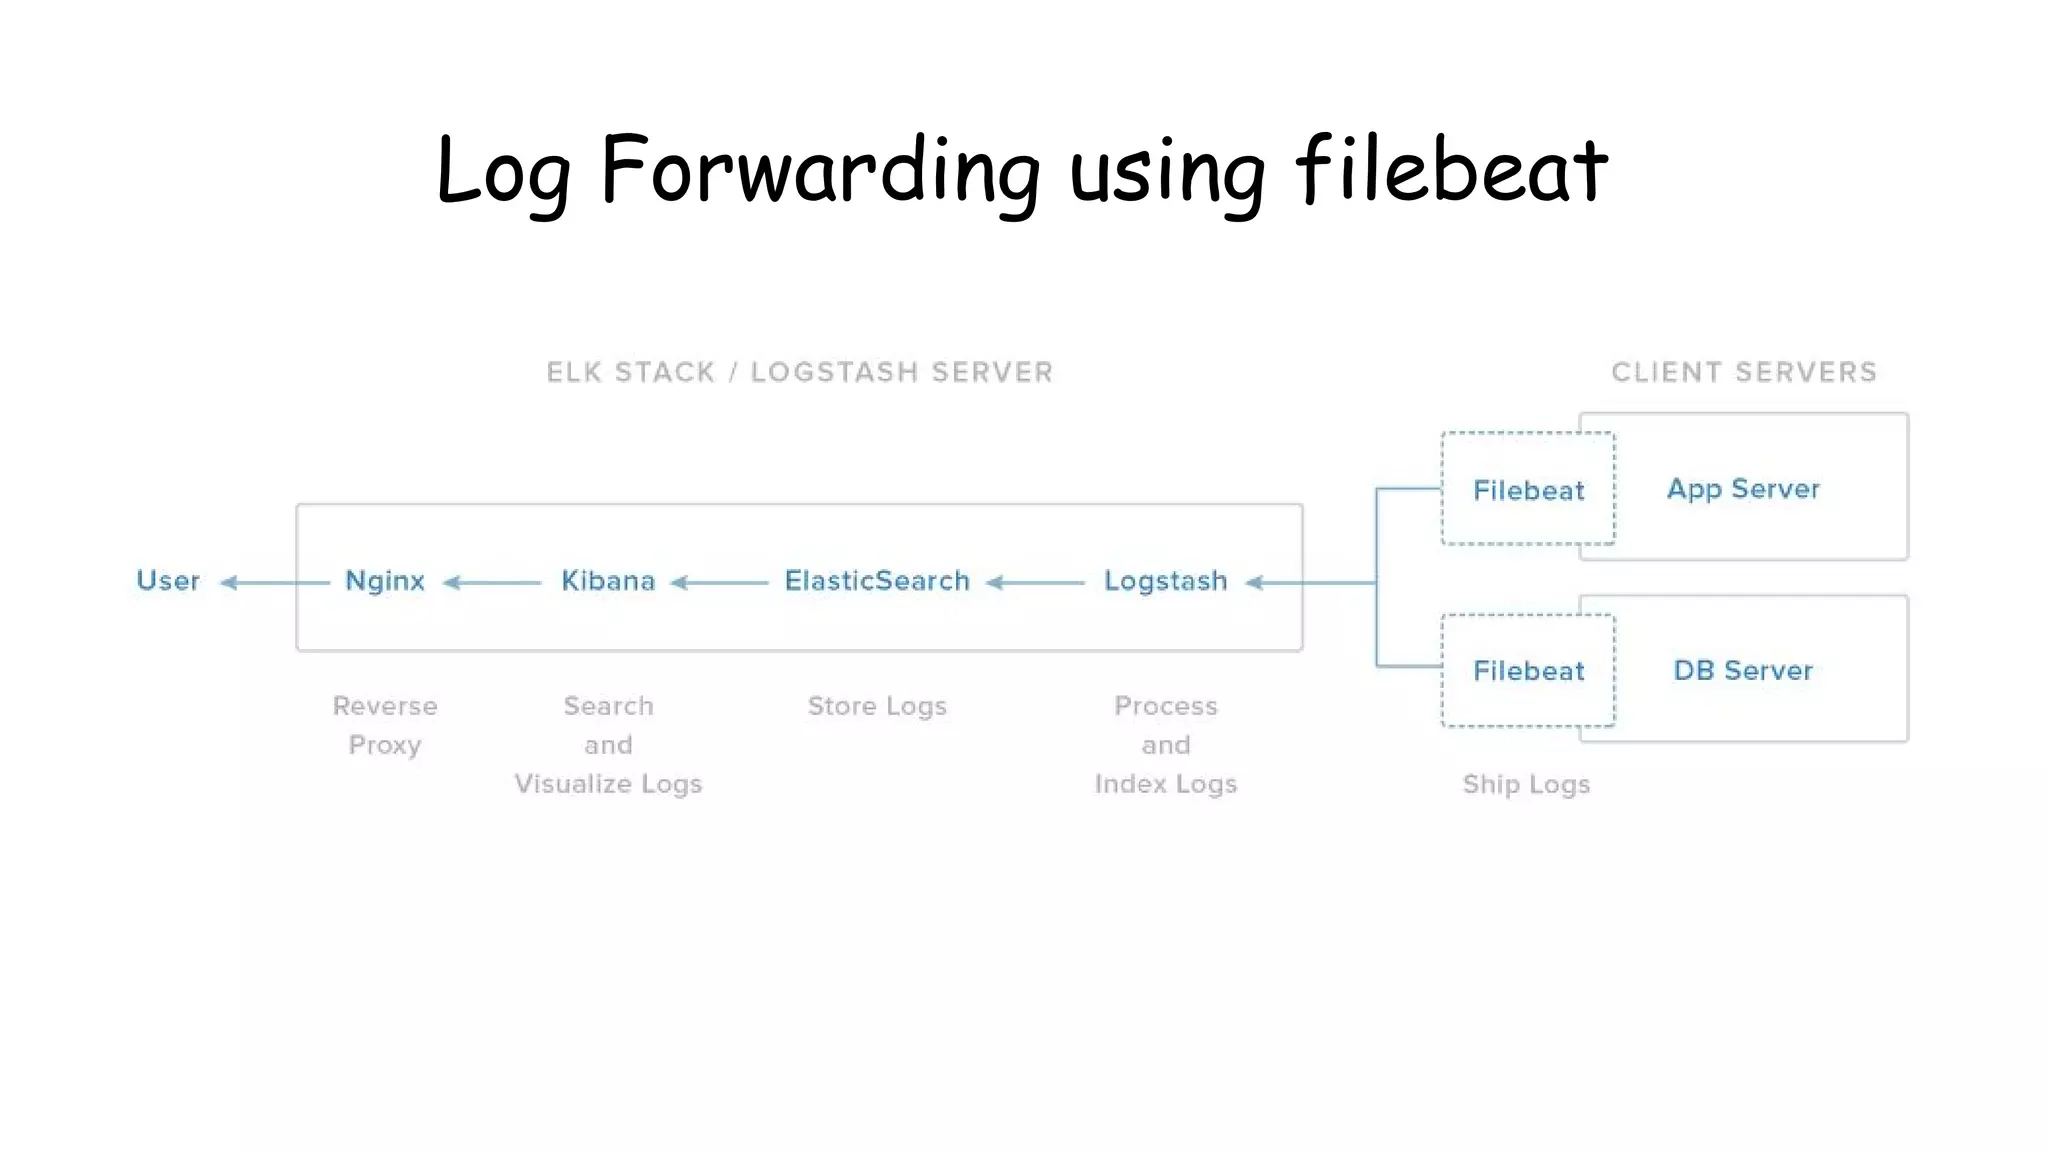
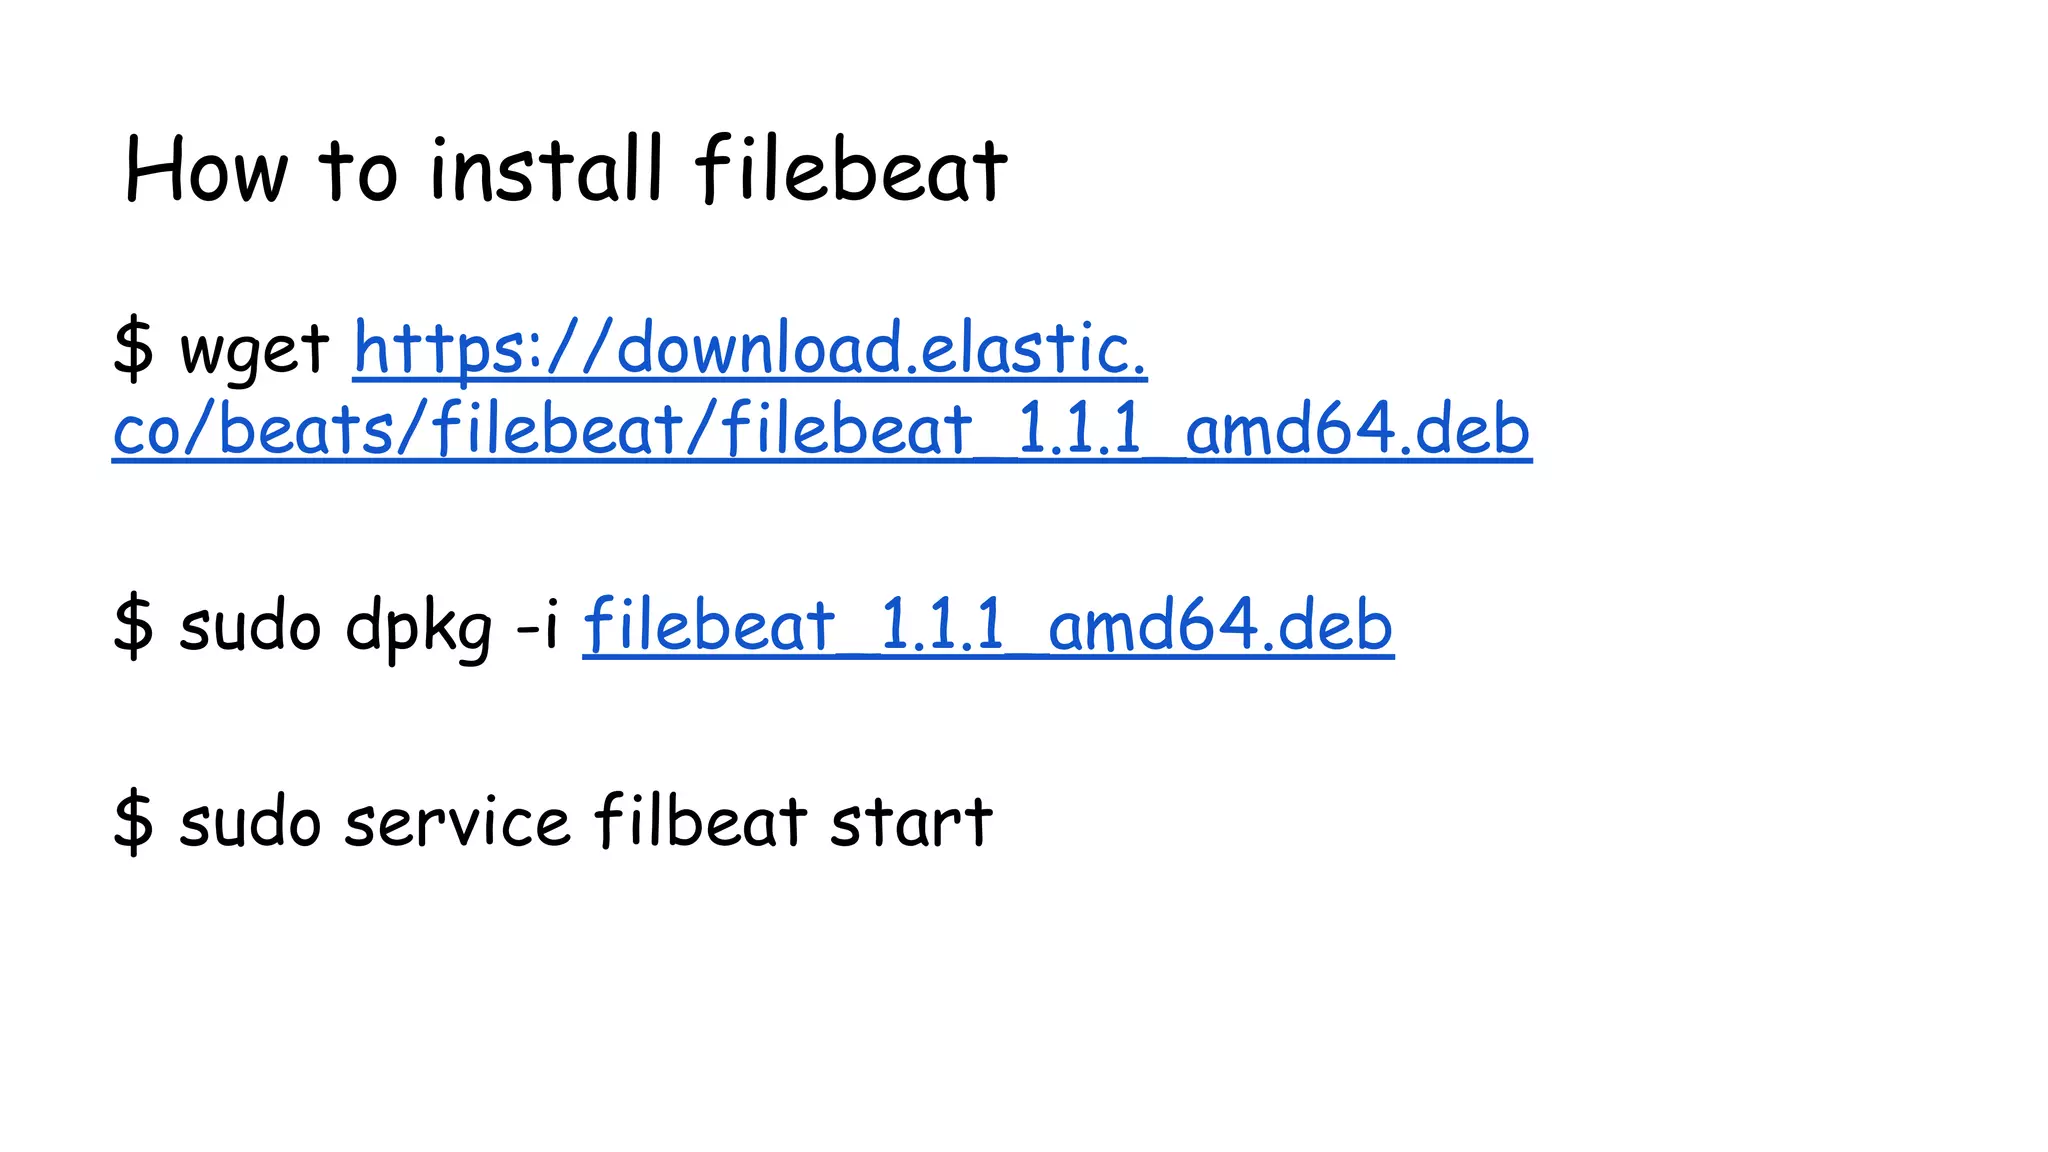
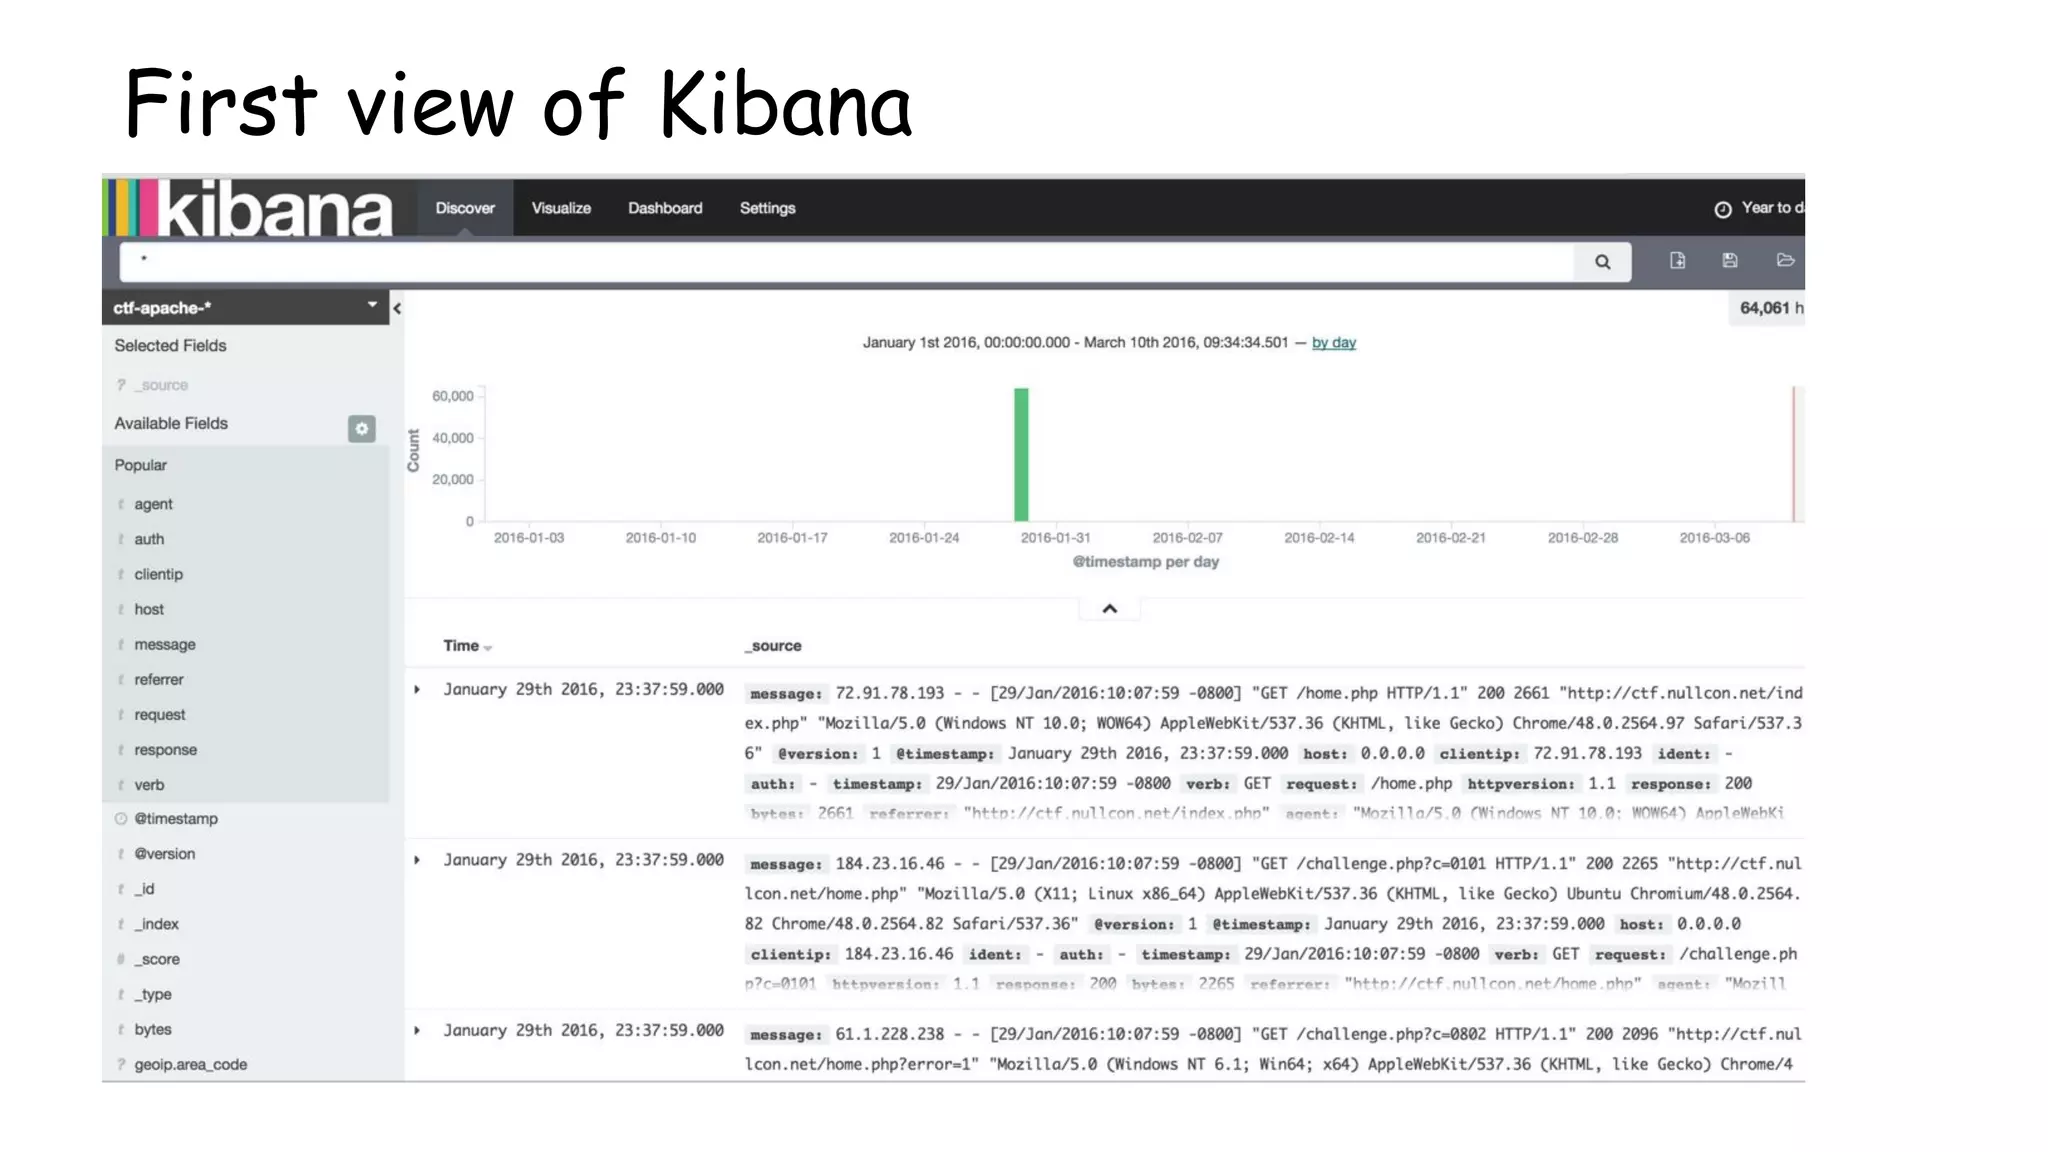
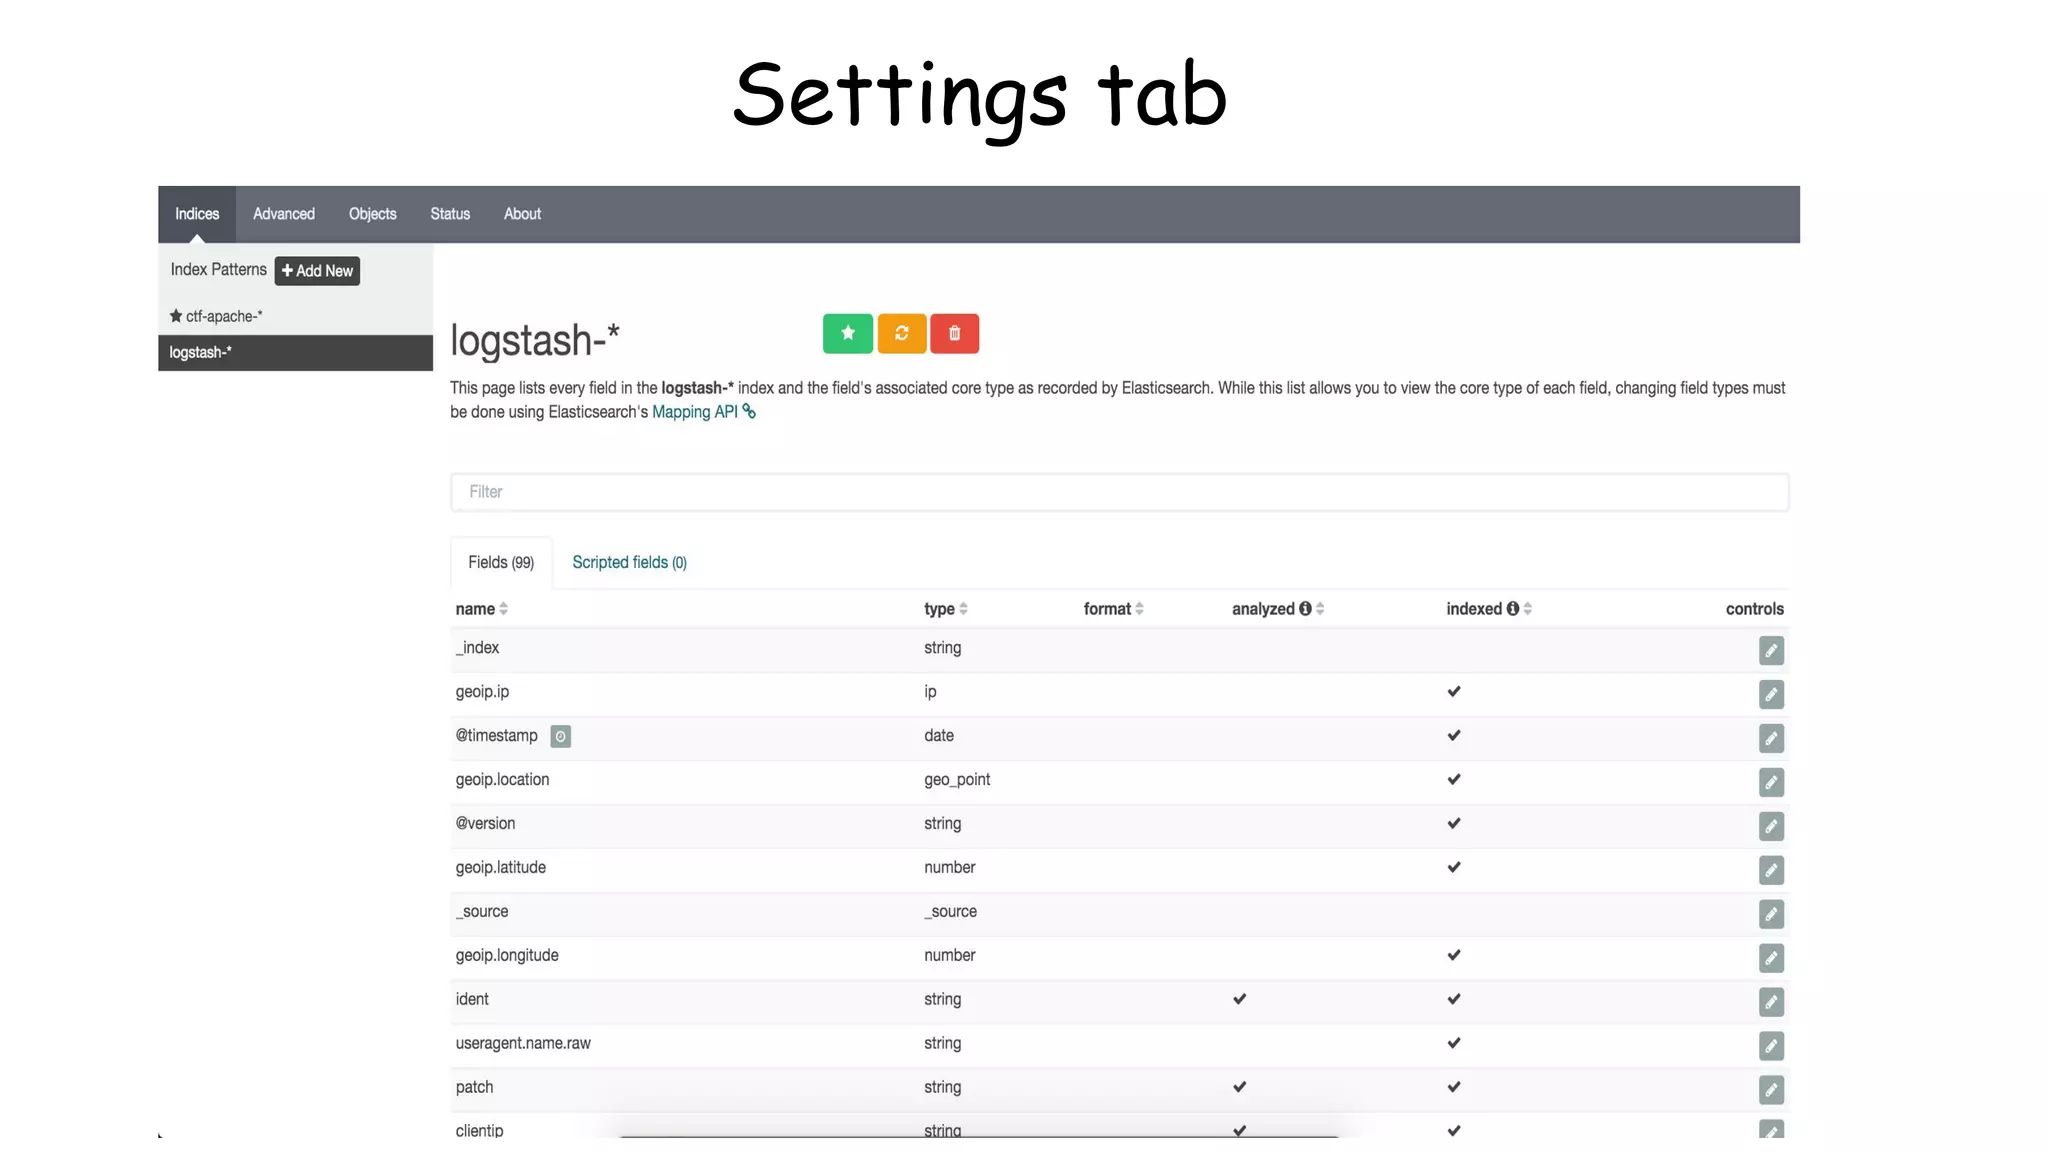
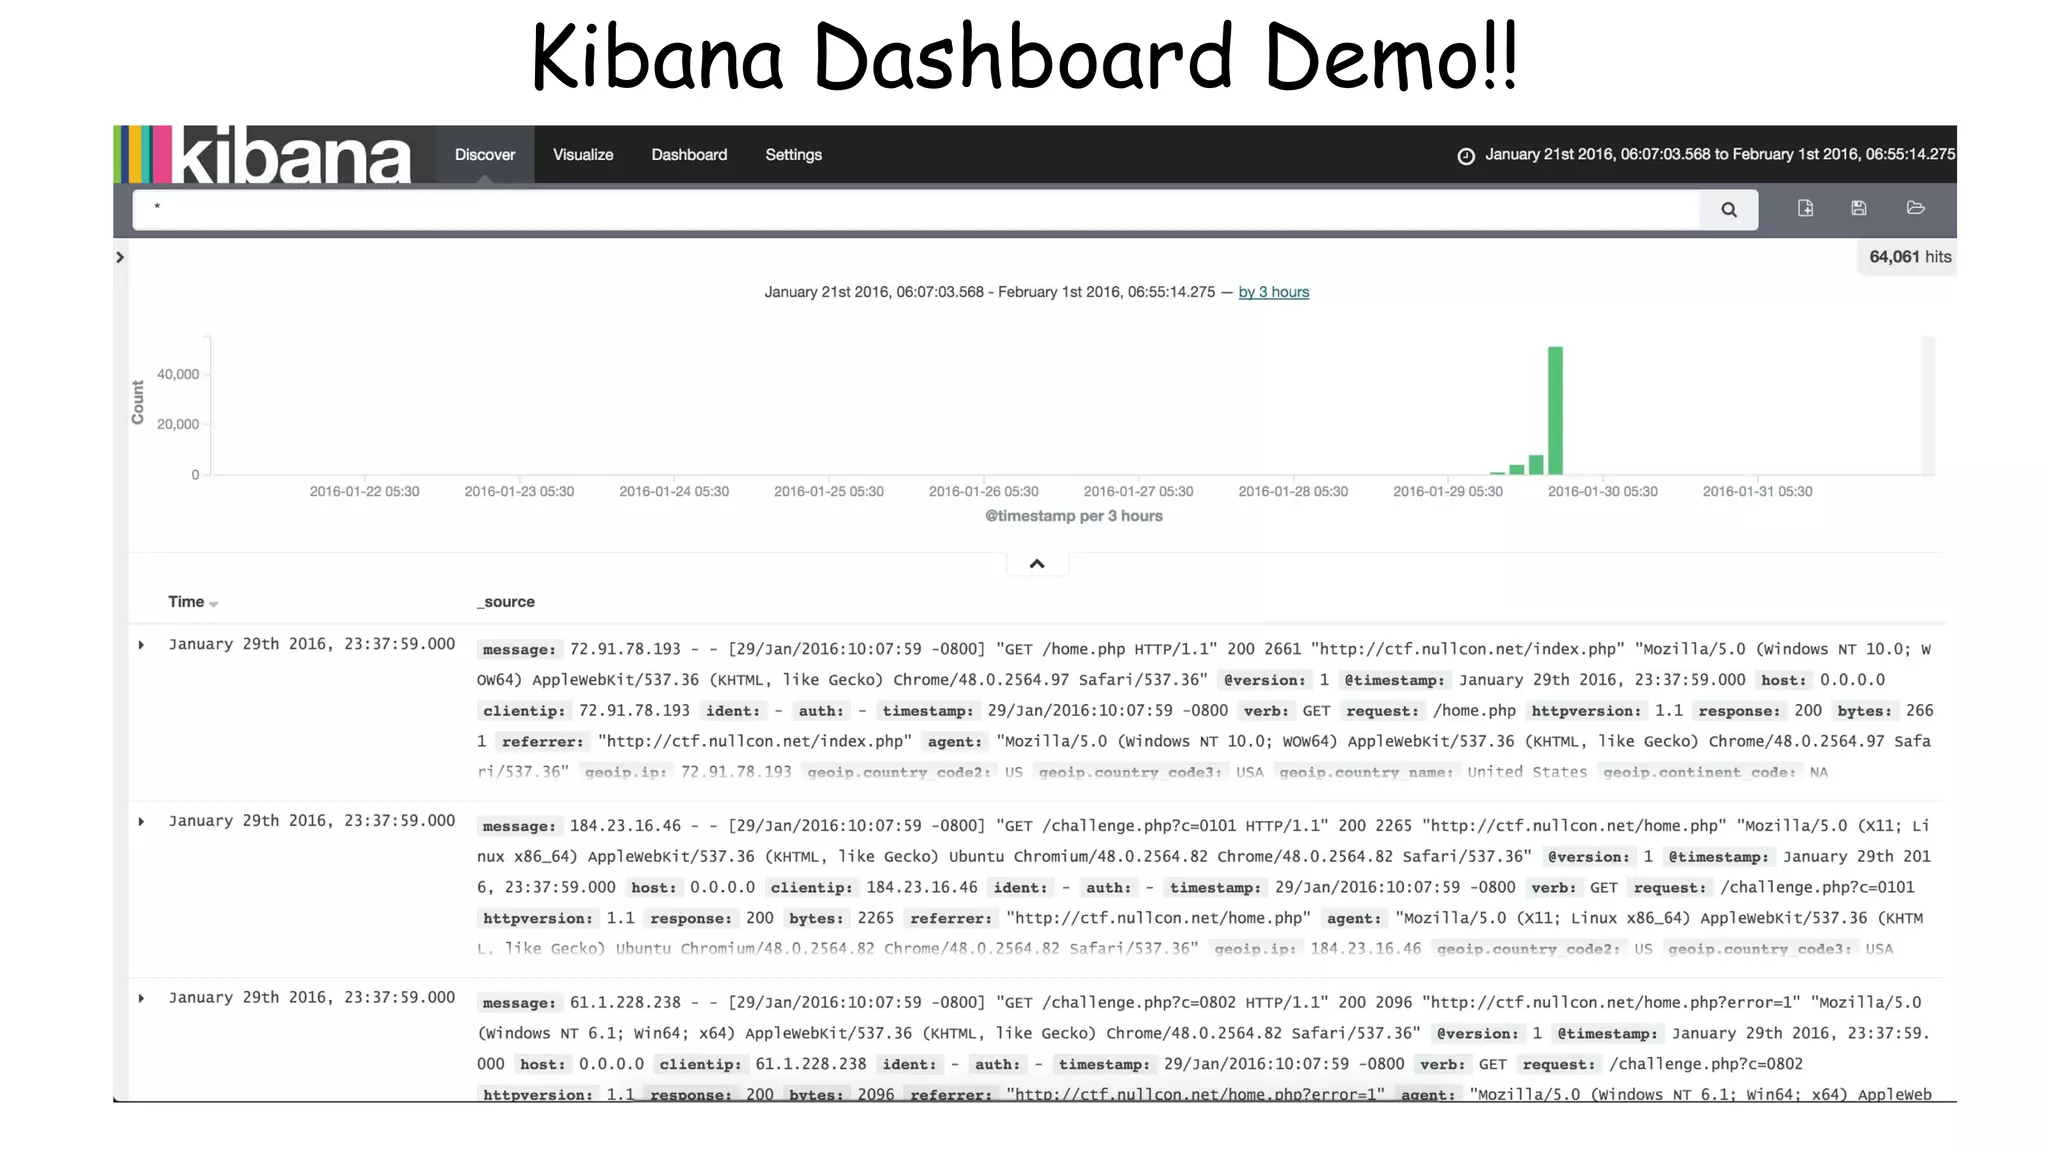
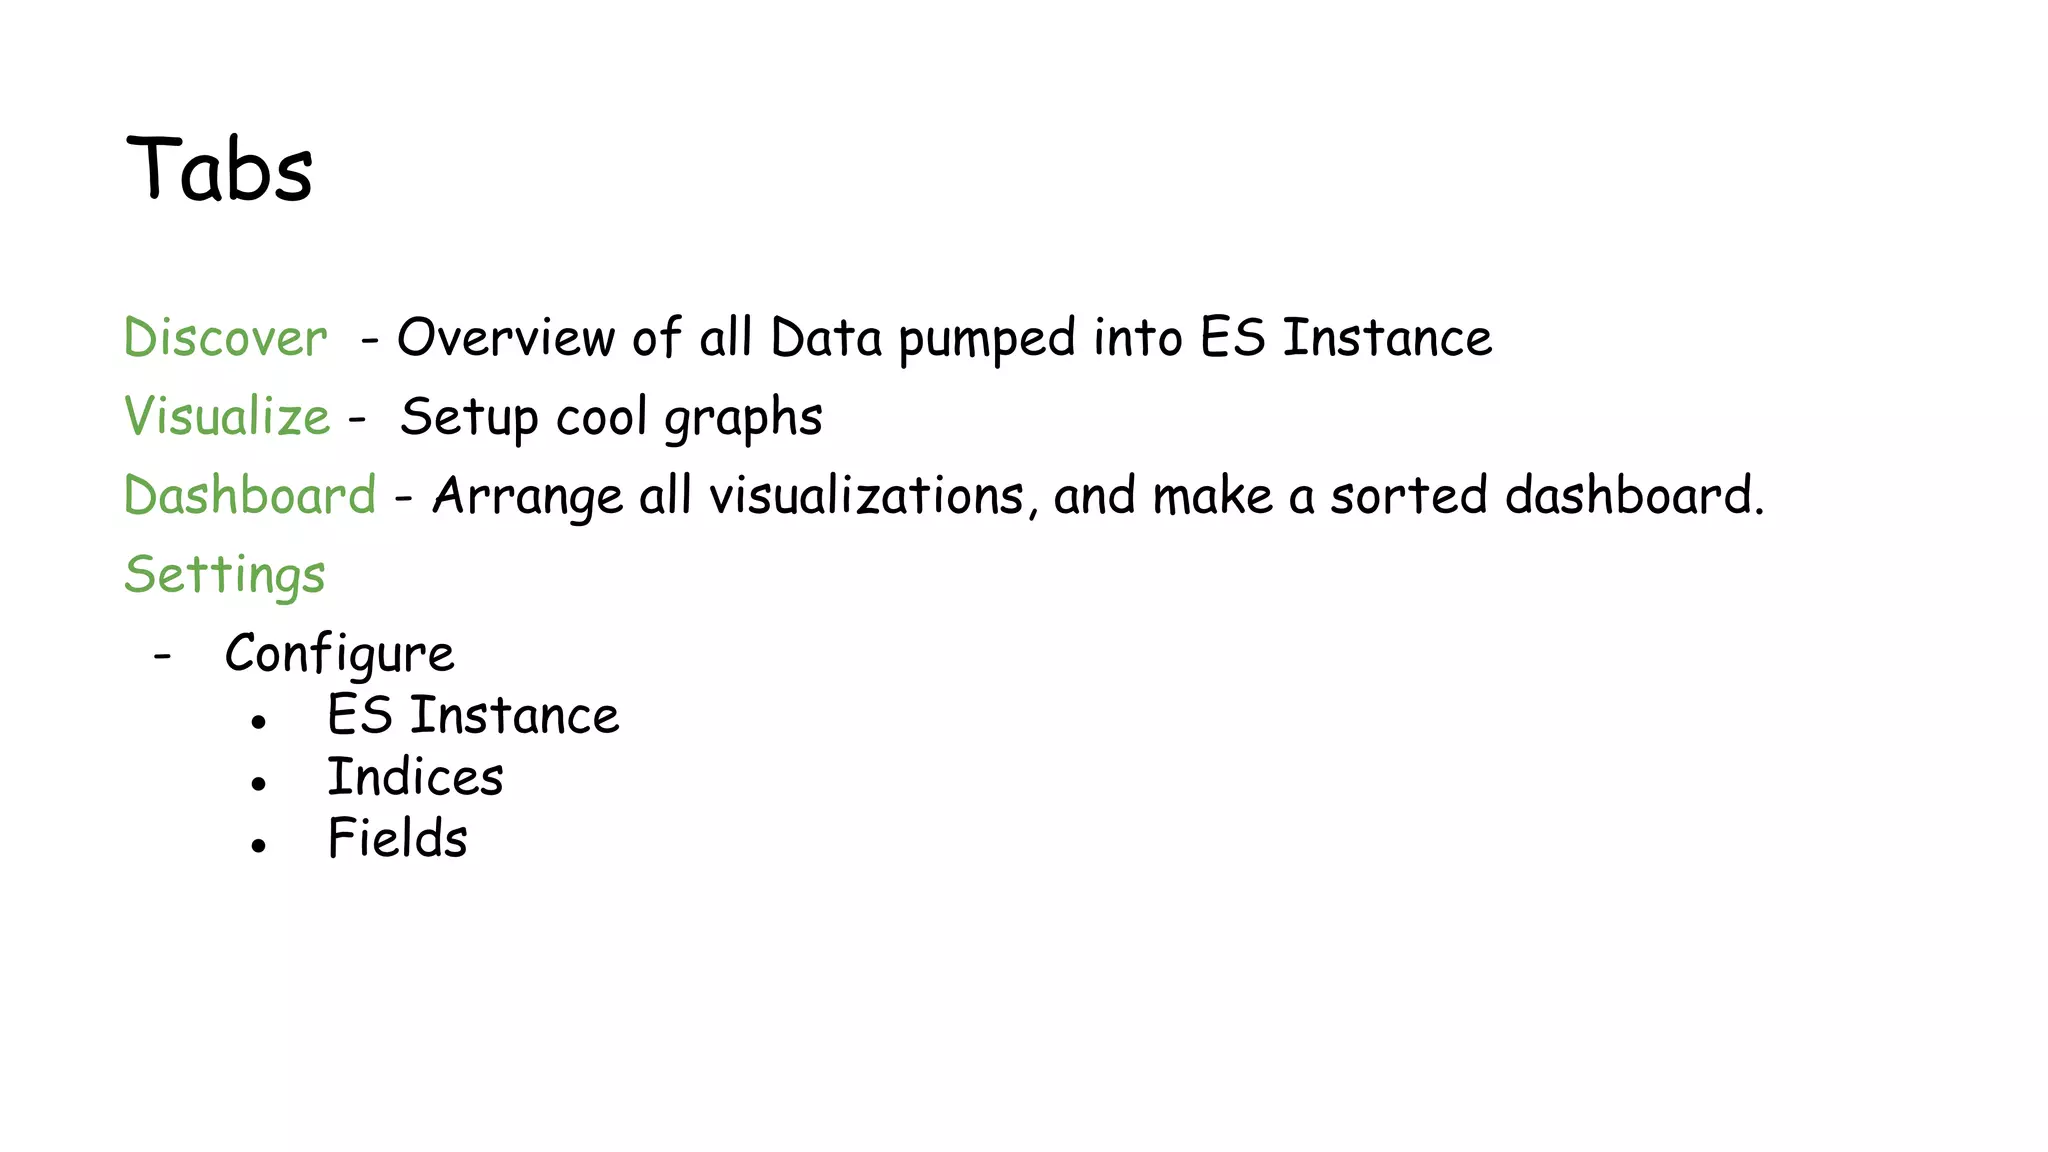
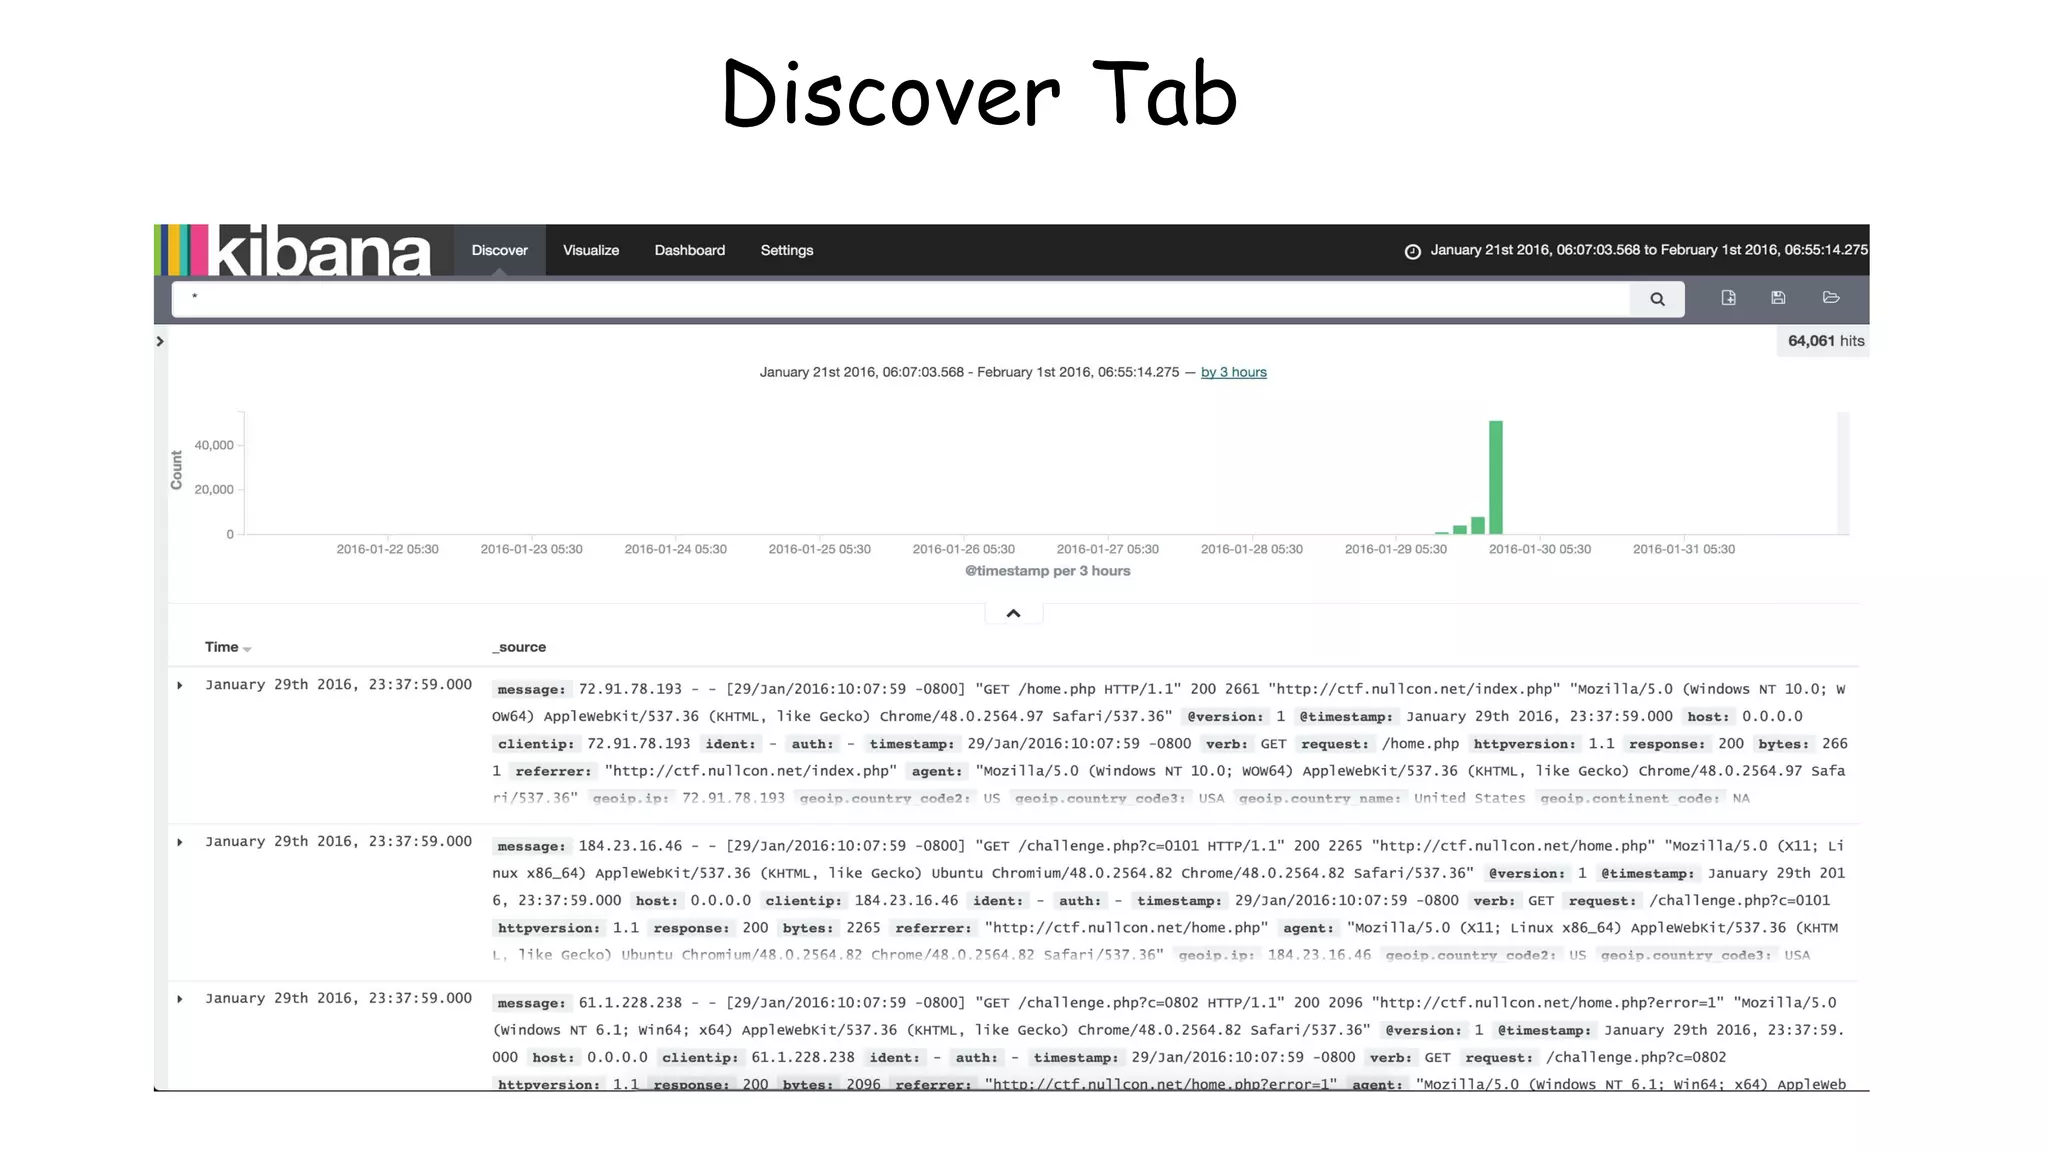
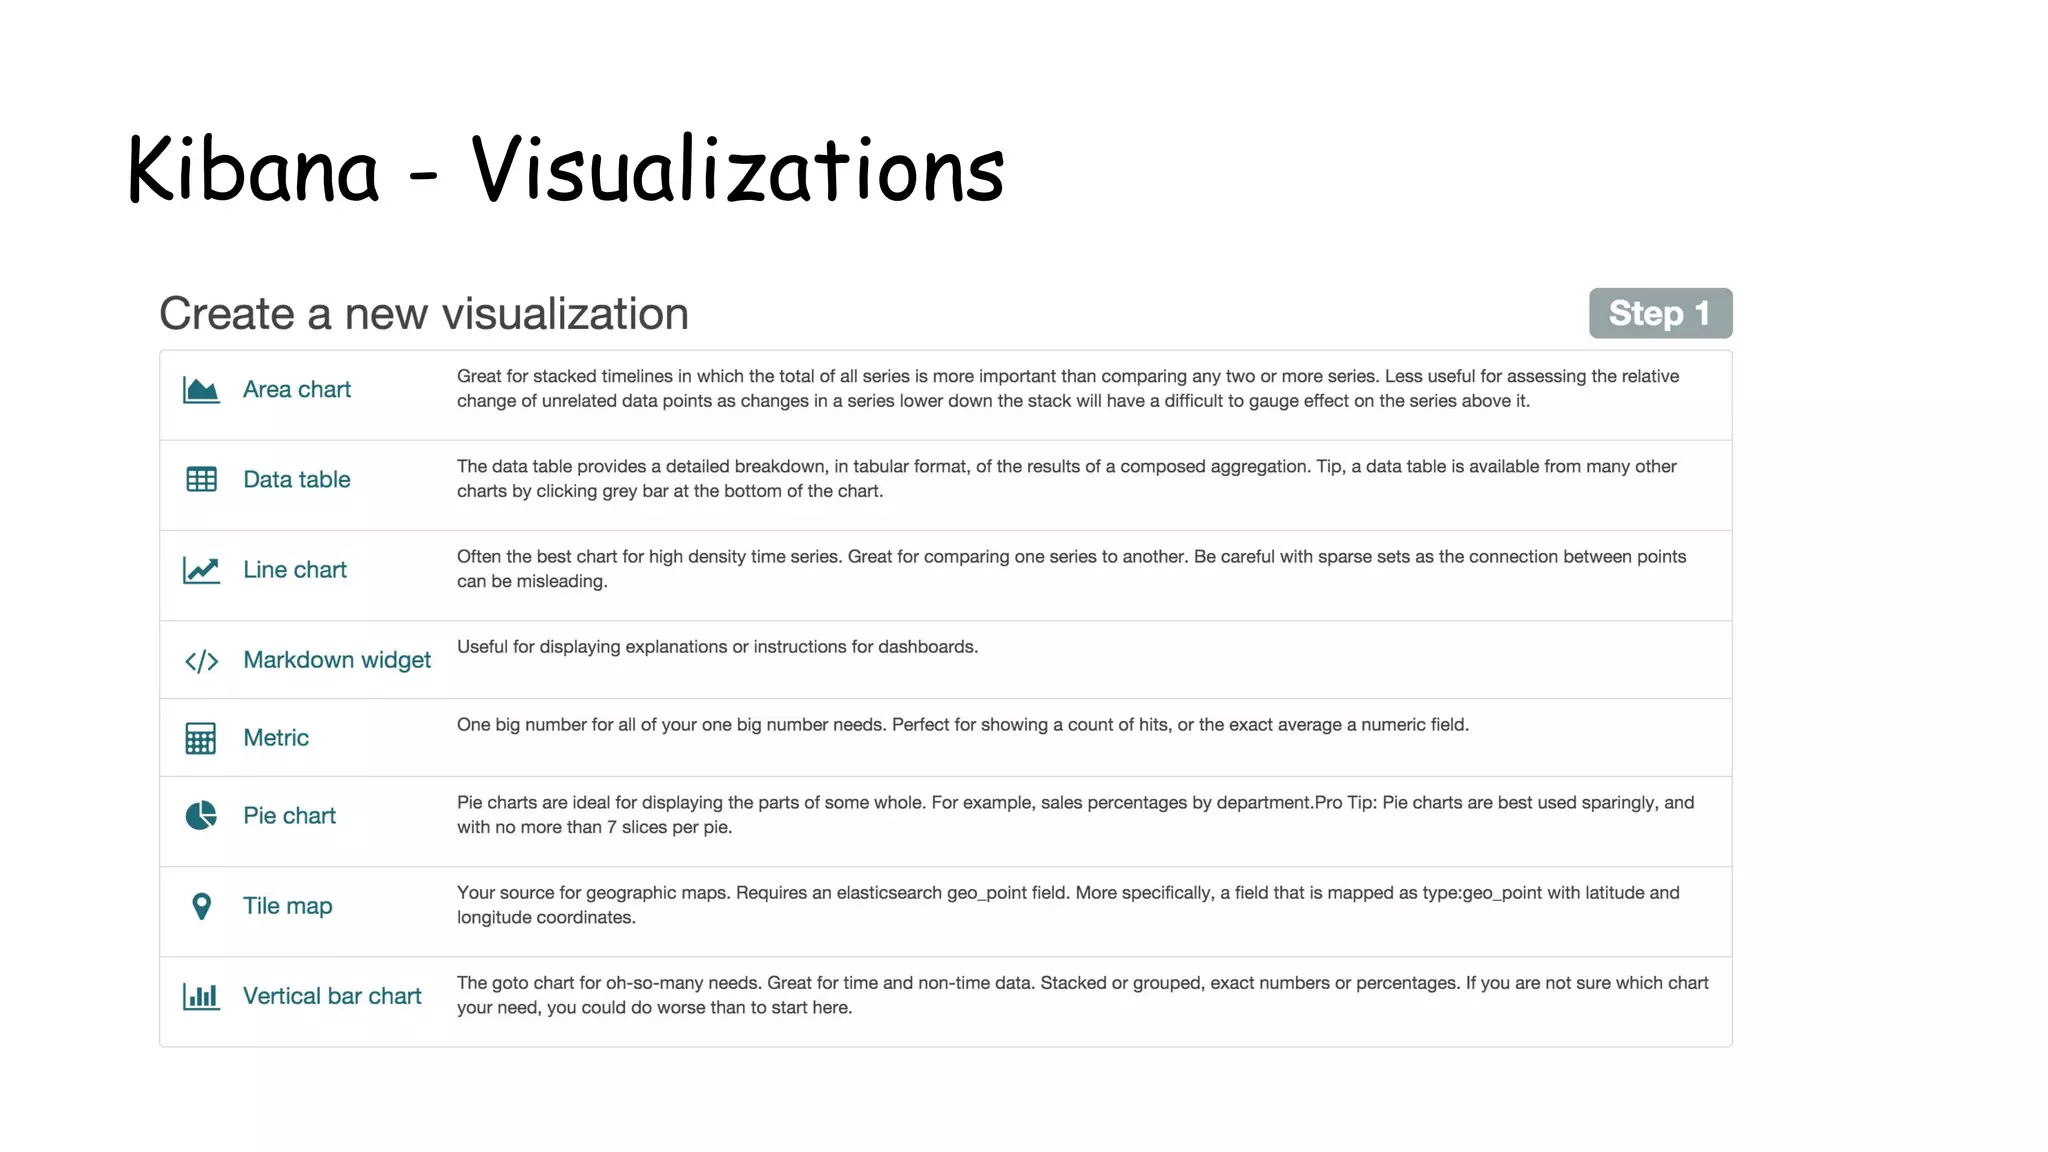
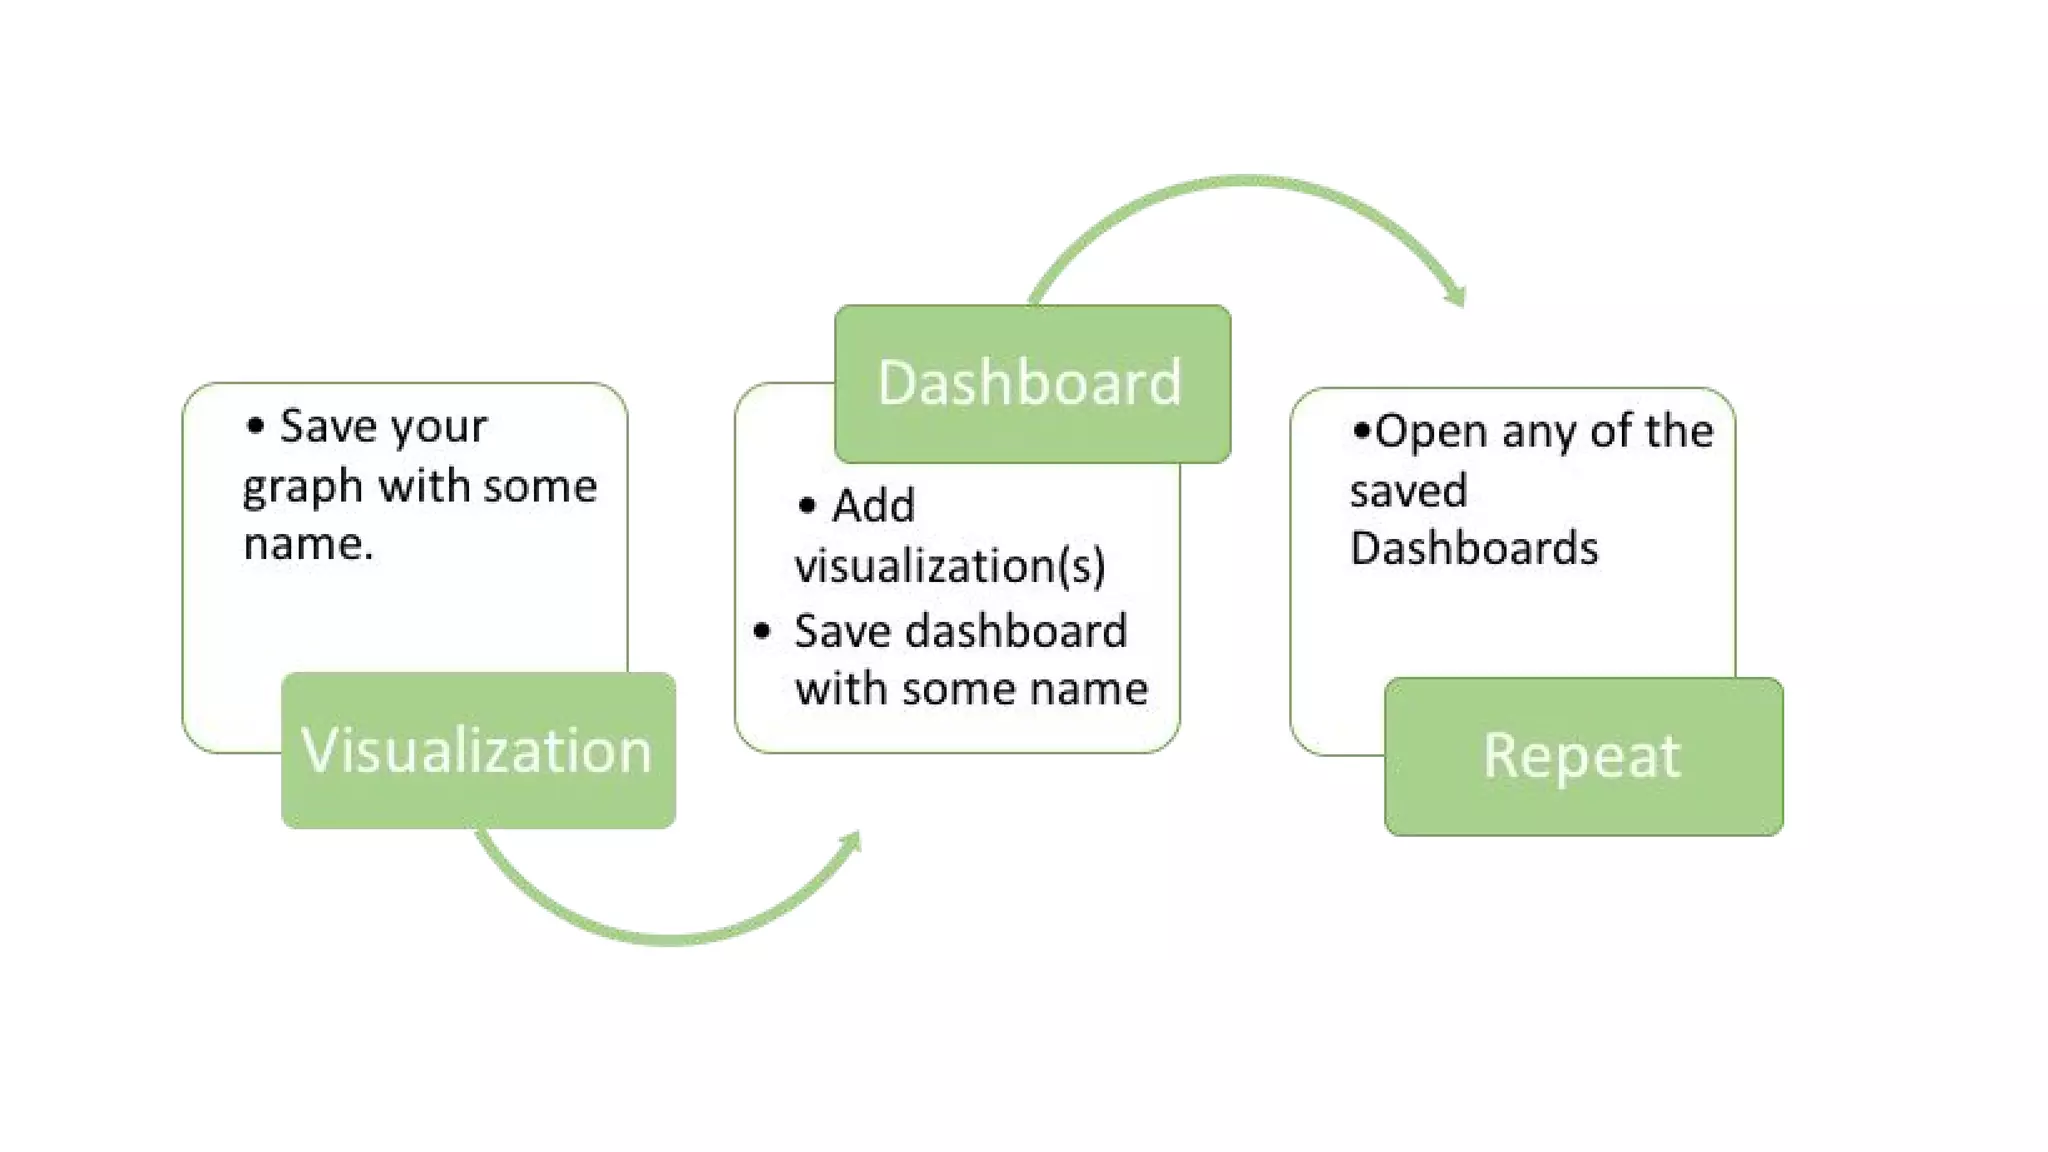
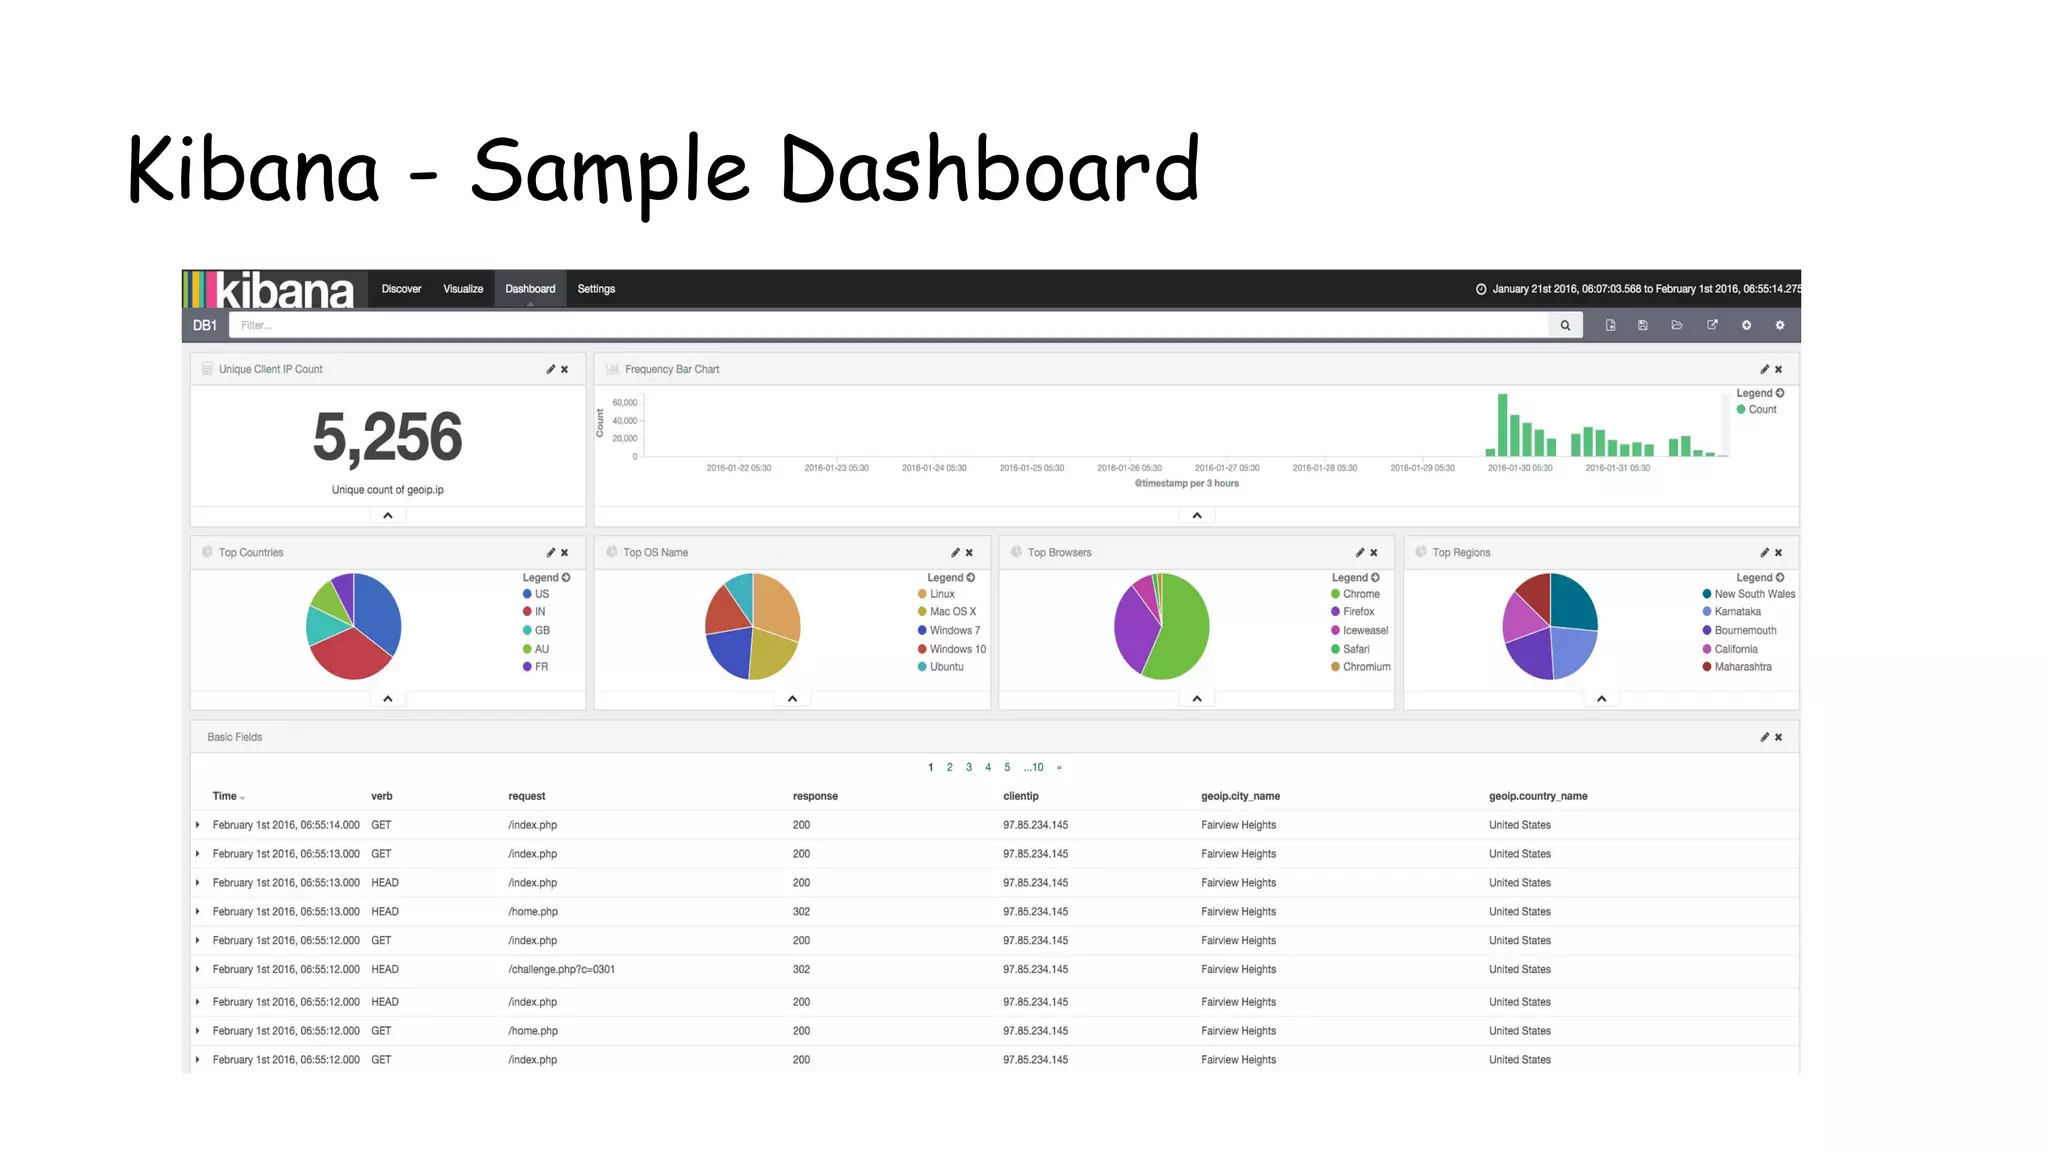
This document provides an overview and instructions for setting up the ELK stack (Elasticsearch, Logstash, Kibana) for attack monitoring. It discusses the components, architecture, and configuration of ELK. It also covers installing and configuring Filebeat for centralized logging, using Kibana dashboards for visualization, and integrating osquery for internal alerting and attack monitoring.


