1. ESTONIAN DAIRY SECTOR IN 2003
THE ROLE OF DAIRY SECTOR IN ESTONIAN ECONOMY
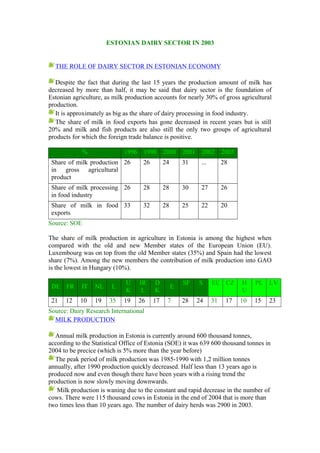
Despite the fact that during the last 15 years the production amount of milk has
decreased by more than half, it may be said that dairy sector is the foundation of
Estonian agriculture, as milk production accounts for nearly 30% of gross agricultural
production.
It is approximately as big as the share of dairy processing in food industry.
The share of milk in food exports has gone decreased in recent years but is still
20% and milk and fish products are also still the only two groups of agricultural
products for which the foreign trade balance is positive.
%
1996
1998
2000
2001
2002
2003
Share of milk production 26
in gross agricultural
product
26
24
31
...
28
Share of milk processing 26
in food industry
28
28
30
27
26
Share of milk in food 33
exports
32
28
25
22
20
Source: SOE
The share of milk production in agriculture in Estonia is among the highest when
compared with the old and new Member states of the European Union (EU).
Luxembourg was on top from the old Member states (35%) and Spain had the lowest
share (7%). Among the new members the contribution of milk production into GAO
is the lowest in Hungary (10%).
DE FR
IT
NL
L
U
K
IR
L
D
K
21
10
19
35
19
26
17
12
E
7
SF
S
EE
CZ
H
U
PL
LV
28
24
31
17
10
15
23
Source: Dairy Research International
MILK PRODUCTION
Annual milk production in Estonia is currently around 600 thousand tonnes,
according to the Statistical Office of Estonia (SOE) it was 639 600 thousand tonnes in
2004 to be precice (which is 5% more than the year before)
The peak period of milk production was 1985-1990 with 1,2 million tonnes
annually, after 1990 production quickly decreased. Half less than 13 years ago is
produced now and even though there have been years with a rising trend the
production is now slowly moving downwards.
Milk production is waning due to the constant and rapid decrease in the number of
cows. There were 115 thousand cows in Estonia in the end of 2004 that is more than
two times less than 10 years ago. The number of dairy herds was 2900 in 2003.
2. However, the productivity of cows has risen. Although the growth has slowed
down in the recent years the productivity is getting closer to that of the EU. The
average annual yield per cow was 5484 kg in 2004; which is 308 kg more than in the
previous year.
Herd structure
Effectiveness in milk production can also be observed in herd structure. The bulk
of Estonian cows live in heards with more than 100 cows (72% in 2001), merely 7%
of cows live in heards with less than 10 cows. As a comparison the same division is
given for Denmark and France where the share of the smallest herds is nearly zero
and most of the cows are divided between herds with 10-49 and 50-99 cows.
MILK QUOTA
From 1 April 2003 to 31 March 2004 Estonia implemented milk quotas for the first
time. The Agricultural Registers and Information Board (ARIB) confirmed 642
thousand tonnes of quota to 2444 producers, 619 thousand tonnes for deliveries to
dairies and 23 thousand tonnes for direct sales.
According to ARIB 491 thousand tonnes or 76% of the quota was fulfilled, 479
thousand tonnes was delivered to dairies and 12 thousand tonnes marketed directly.
Beginning with the 2004/2005 quota year, the quota of Estonia determined by the
EU is 624 thousand tonnes, that is divided to 537 thousand tonnes as delivery and 87
thousand tonnes as direct sales quota. ARIB confirmed 525 thousand tonnes of quota,
514 thousand tonnes as deliveries and 12 thousand tonnes as direct sales. If the quota
is fulfilled successfully 25 thousand tonnes may be added in 2006.
This means that Estonia, as the only one among the bigger new Member states of
the EU has been given a possibility to produce more milk than it currently does. Malta
has also got a quota bigger than the actual production but the amount is very small
there (44 th tonnes). Poland as well as Slovakia, however, need to restrict production
considerably. Estonian quota accounts for 3.4% of the total quota of the new Member
states.
Toorpiima turu jaotus
STRUCTURE OF DAIRY INDUSTRY, NUMBER AND LOCATION OF
COMPANIES
DELIVERIES AND QUALITY OF RAW MILK
Deliveries to dairies have increased in recent years, accounting for 81% of milk
production. The remaining part is either sold directly to consumers or used as animal
feed or substance in milk producing households. By the size of direct sales quota in
2003/04 quota year it is clear that direct sales are not very considerable, probably it
has been on account of decrease in direct sales that the deliveries have increased.
1989
1992
1996
1998
2000
2001
2002
2003
Milk production (th tonnes) 1277
919
675
730
629
684
612
596
Deliveries, %
59
73
73
63
62
81
81
62
3. The quality of raw milk has remarkably improved over the years. 93% of all milk
delivered to dairies meets the raw milk requirements of the EU. The average fat
content is 4% and protein content 3.3%.
Quality of Raw Milk, % of delivered milk of certain grade
higher grade
100%
90%
80%
70%
60%
50%
40%
30%
20%
10%
0%
32%
27%
elite grade
23%
elite or higher grade
17%
14%
grade I
12%
10%
6%
41%
43%
58%
67%
71%
1997
1998
79%
83%
87%
88%
52%
41%
1995
1996
1999
2000
2001
2002
2003
PRODUCTION AND CONSUMPTION OF DAIRY PRODUCTS
As milk production, the production of dairy products is also consoderably smaller
scale when compared to 15 years ago. However, it can be seen from the structure of
production that it is much more market oriented now, this trend is especially clear in
the case of powders. The powder more valued at the market is the one produced more.
The share of cheese has increased due to more favourable export conditions and as a
result of a slight increase in domestic consumption. Since export markets are
overloaded with butter and Estonian consumers are also eating less of it, the share of
butter is decreasing.
While production of dairy products expressed in quantities has decreased, the range is
constantly widening, completely new products have been introduced and the varieties
inside product groups are growing. Shops and especially supermarket chains play a
vital role in new product launches as they are the ones directing the production being
also an indicator about consumer preferences in doing so. The member companies of
Estonian Dairy Association produce the following products:
As mentioned above, some changes are observable in the dairy products consumption
patterns. Drinkink milk has to a certain degree been replaced by several other fresh
dairy products but also by other non-dairy drinks. Due to different reasons (health,
scarce financial resources) the consumption of butter has decreased. The results of the
surveys of the Esronian Economic Research Institute show that domestic dairy
products are generally cheaper than imports and consumers prefer them also because
of familiar taste.
When compared to the other EU Member States the consumption of dairy products is
still relatively low in Estonia. Leading consumer of drinking milk is Ireland with 156
kg milk per capita in 2002 while only 74,3 kg was drank in Estonia and approximately
the same amount in France, Hungary, Austria, Germany, Czech Rep., Belgium,
Poland and Slovenia. Cheese is eaten the most in France and Greece (25 kg per capita
annually), Estonia with 9 kilos is at the same level with Poland and Slovenia. Both in
Estonia and Denmark 2 kg of butter is used per capita, the leader is France again (8
kg).
FOREIGN TRADE OF DAIRY PRODUCTS
4. Export of dairy products in monetary terms was 952 million kroons in 2003 that is
20% of total exports of agricultural products (21,5% in 2002). Foreign trade balance
of dairy products continues to be positive, exports exceeded imports by 311 million
kroons. However, excess of exports was twice smaller than in 2001 (660 millions).
Foreign Trade Balance, million kroons
1000
500
0
-500
-1000
-1500
-2000
-2500
-3000
-3500
-4000
agricultural
products
milk & milk
products
1995 1996 1997 1998 1999 2000 2001 2002 2003
Source: Ministry of Agriculture of Estonia
Exports in monetary terms decreased by 60.5 million kroons or 5.9% in 2003 when
compared to the previous year. Dairy products are exported more and more to the EU
and the Candidate countries, 98% of dairy exports was directed there in 2003. The
market of the EU was attractive to the Estonian dairy companies due to ever
liberalising trade conditions since July 1, 2000. Estonia had free trade agreements
with several of the Candidate countries which were terminated on accession but these
countries together with Estonia are now part of the single market area.
By countries the main export partner in 2003 were the Netherlands (45% ekspordist)
and Germany (24%), the most important Candidate country partners were Lithuania
(8.1%), Latvia (7.5%) and Poland (1.5%).
The main export articles are powders (the share of skimmed milk powder in exports
was 21% and that of milk powder 13%), cheese (33%) and butter (22%). The share of
cheese in absolute terms has increased in the recent years, but the increase has been
stable since cheese is not a product exports of which would significantly be affected
by market trends. On the contrary market fluctuations are visible in powder exports,
milk powder exports in 2002 in monetary terms was nearly three times as big as in
2003 and accounted for 34% of dairy exports. The bulk of powders (98%) was
exported to the EU, more precisely to the Netherlands and Germany. Cheese went to
the Netherlands (41%), Lithuania (20%), Germany (15%), Italy (9.4%) and Denmark
(5.3%). Butter was also mostly exported to the Netherlands (41%) and Germany
(26%), sour milk products to Germany (50%) and Latvia (45%).
Imports increased to 641 million kroons in 2003 from 353 millions in 2002. Dairy
products accounted for 7.8% of the total imports of agricultural products (4.6% in
2002). 83% of imports originated in the EU or the Candidate countries, while imports
from the latter (especially from Czech Reublic and Slovakia) significantly increased
when compared to 2002 and the share of the old EU Member states decreased. The
5. main import partner was in fact the Czech Republic (26%) followed by Lithuania
(23%) and Slovakia (10%).
The structure of imports is similar to that of exports. Powders account for the biggest
share (skimmed milk powder 23% and milk powder 8.5% of imports), butter (31%),
cheese (19%) and sour milk products (3.4%) follow. As for exports changes have
occured in powder imports. Skimmed milk powder imports have increased three times
and milk powder imports half as much. However, while the share of skimmed milk in
total imports has increased from 15% to 23%, the share of milk powder has decreased
from 12% to 8.5%. Powder was imported from Slovakia, Czech Republic, USA,
New-Zealand and Poland, butter from Lithuania, Switzerland, Slovakia, Slovenia and
Hungary and cheese from Lithuania, Latvia and Czech Republic.
PRICES
The price of raw milk rapidly grew in Estonia in the end of 2003, in the 1 st quarter the
average price was 2.76 EEK/kg and by the end of the year it had risen to 3.29
EEK/kg. Obviously this development was caused by the approaching accession to the
EU but also by the densifying competition on the raw milk market. Although the price
has gone up in Estonia it is still far behind the average of the EU, which was 4.90
EEK/kg in 2003. This does not mean that the price is that high in all the Member
states. Higher price is generally paid in Scandinavia and in the countries where milk is
a luxury product (Greece), producers get paid less in Great Britain, Belgium and
Germany. The highest prices in 2003 were paid in Luxembourg (5.79 EEK/kg) and
Greece (5.64 EEK/kg) and the lowest in Great Britain (3.82 EEK/kg).
Price of Raw Milk, EEK/kg
6
Finland
5
EU average
4
Estonia
3
2
Latvia
1
0
1994
1995
1996
1997
1998
1999
2000
2001
2002
2003
Source: SOE, Dairy Researh International. EUROSTAT
At the present time, the system of basic indicators and premiums-deductions is used in
Estonia in milk payment. Dairies fix the price for milk with basic fat and protein
content and a premium or a deduction for any additional or missing per cent of fat or
protein. Such a system is easily comprehensible but the producer can not see clearly
how is the basic price derived and the dairies do not pay for the milk according to
how it is valued on the market.