


![Detection of the Prodromal Phase of Bipolar Disorder from
Psychological and Phonological Aspects in Social Media
Yen-Hao Huang
National Tsing Hua University
Hsinchu, Taiwan
yenhao0218@gmail.com
Lin-Hung Wei
National Tsing Hua University
Hsinchu, Taiwan
adeline80916@gmail.com
Yi-Shin Chen
National Tsing Hua University
Hsinchu, Taiwan
yishin@gmail.com
ABSTRACT
Seven out of ten people with bipolar disorder are initially
misdiagnosed and thirty percent of individuals with bipolar
disorder will commit suicide. Identifying the early phases of
the disorder is one of the key components for reducing the
full development of the disorder. In this study, we aim at
leveraging the data from social media to design predictive
models, which utilize the psychological and phonological fea-
tures, to determine the onset period of bipolar disorder and
provide insights on its prodrome. This study makes these dis-
coveries possible by employing a novel data collection process,
coined as Time-specific Subconscious Crowdsourcing, which
helps collect a reliable dataset that supplements diagnosis
information from people suffering from bipolar disorder. Our
experimental results demonstrate that the proposed models
could greatly contribute to the regular assessments of people
with bipolar disorder, which is important in the primary care
setting.
KEYWORDS
Bipolar Disorder Detection, Mental Disorder, Prodromal
Phrase, Emotion Analysis, Sentiment Analysis, Phonology,
Social Media
1 INTRODUCTION
Bipolar disorder (BD) is a common mental illness charac-
terized by recurrent episodes of mania/hypomania and de-
pression, which is found among all ages, races, ethnic groups
and social classes. The regular assessment of people with
BD is an important part of its treatment, though it may be
very time-consuming [21]. There are many beneficial treat-
ments for the patients, particularly for delaying relapses. The
identification of early symptoms is significant for allowing
early intervention and reducing the multiple adverse conse-
quences of a full-blown episode. Despite the importance of
the detection of prodromal symptoms, there are very few
studies that have actually examined the ability of relatives to
detect these symptoms in BD patients. [20] For the purpose
of early treatment, the challenge leads to: how to identify
the prodrome period of BD. Current studies are thus
aimed at detecting prodromes and analyzing the prodromal
symptoms of manic recurrence in clinics.
With regards to the symptom of social isolation, people
are increasingly turning to popular social media, such as
Facebook and Twitter, to share their illness experiences or
seek advice from others with similar mental health conditions.
As the information is being shared in public, people are
subconsciously providing rich contents about their states
of mind. In this paper, we refer to this sharing and data
collection as time-specific subconscious crowdsourcing.
In this study, we carefully look at patients who have been
diagnosed with BD and who explicitly indicate the diagnosis
and time of diagnosis on Twitter. Our goal is to both predict
whether BD rises on a given period of time, and to discover
the prodromal period for BD. It’s important to clarify that
our goal doesn’t seek to offer a diagnosis but rather to make
a prediction of which users are likely to be suffering from the
BD. The main contributions of our work are:
• Introducing the concept of time-specific subconscious
crowdsourcing, which can aid in locating the social
network behavior data of BD patients with the corre-
sponding time of diagnosis.
• A BD assessment mechanism that differentiates be-
tween prodromal symptoms and acute symptoms.
• Introducing the phonological features into the assess-
ment mechanism, which allows for the possibility to
assess patients through text only.
• An automatic recognition approach that detects the
possible prodromal period for BD.
2 RELATED WORK
Social media resources have been widely utilized by researchers
to study mental health issues. The following literature em-
phasizes on data collection and feature engineering, including
subject recruitment, manual data collection, data collection
applications, keyword matching, and combined approaches.
The clinical approach for mental disorders and prodrome
studies are also discussed in this section.
Subject recruitment: Based on customized question-
naires and contact with subjects, Park et al. [15] recruited
participants for the Center for Epidemiologic Studies Depres-
sion scale(CES-D) [17] and provided their Twitter data. By
analyzing the information contained in tweets, participants
were divided into normal and depressive groups based on
their scores on CES-D. An approach like this one requires ex-
pensive costs to acquire data and conduct the questionnaire.
Manual and automatic data collecting: Moreno et
al. [14] collected data via the Facebook profiles of college stu-
dents reviewed by two investigators. They aimed at revealing
the relationship between demographic factors and depression.
Similarly, in our work, we invest on manual efforts to collect
and properly annotate our dataset. In addition, there are
many applications built on top of social networks that provide
free services where users may need to input their credentials
arXiv:1712.09183v1[cs.IR]26Dec2017](https://image.slidesharecdn.com/digitalhealthcare-intheperspectiveofmentaldisorder-180420075555/85/slide-56-320.jpg)
![Detection of the Prodromal Phase of Bipolar Disorder from
Psychological and Phonological Aspects in Social Media
Yen-Hao Huang
National Tsing Hua University
Hsinchu, Taiwan
yenhao0218@gmail.com
Lin-Hung Wei
National Tsing Hua University
Hsinchu, Taiwan
adeline80916@gmail.com
Yi-Shin Chen
National Tsing Hua University
Hsinchu, Taiwan
yishin@gmail.com
ABSTRACT
Seven out of ten people with bipolar disorder are initially
misdiagnosed and thirty percent of individuals with bipolar
disorder will commit suicide. Identifying the early phases of
the disorder is one of the key components for reducing the
full development of the disorder. In this study, we aim at
leveraging the data from social media to design predictive
models, which utilize the psychological and phonological fea-
tures, to determine the onset period of bipolar disorder and
provide insights on its prodrome. This study makes these dis-
coveries possible by employing a novel data collection process,
coined as Time-specific Subconscious Crowdsourcing, which
helps collect a reliable dataset that supplements diagnosis
information from people suffering from bipolar disorder. Our
experimental results demonstrate that the proposed models
could greatly contribute to the regular assessments of people
with bipolar disorder, which is important in the primary care
setting.
KEYWORDS
Bipolar Disorder Detection, Mental Disorder, Prodromal
Phrase, Emotion Analysis, Sentiment Analysis, Phonology,
Social Media
1 INTRODUCTION
Bipolar disorder (BD) is a common mental illness charac-
terized by recurrent episodes of mania/hypomania and de-
pression, which is found among all ages, races, ethnic groups
and social classes. The regular assessment of people with
BD is an important part of its treatment, though it may be
very time-consuming [21]. There are many beneficial treat-
ments for the patients, particularly for delaying relapses. The
identification of early symptoms is significant for allowing
early intervention and reducing the multiple adverse conse-
quences of a full-blown episode. Despite the importance of
the detection of prodromal symptoms, there are very few
studies that have actually examined the ability of relatives to
detect these symptoms in BD patients. [20] For the purpose
of early treatment, the challenge leads to: how to identify
the prodrome period of BD. Current studies are thus
aimed at detecting prodromes and analyzing the prodromal
symptoms of manic recurrence in clinics.
With regards to the symptom of social isolation, people
are increasingly turning to popular social media, such as
Facebook and Twitter, to share their illness experiences or
seek advice from others with similar mental health conditions.
As the information is being shared in public, people are
subconsciously providing rich contents about their states
of mind. In this paper, we refer to this sharing and data
collection as time-specific subconscious crowdsourcing.
In this study, we carefully look at patients who have been
diagnosed with BD and who explicitly indicate the diagnosis
and time of diagnosis on Twitter. Our goal is to both predict
whether BD rises on a given period of time, and to discover
the prodromal period for BD. It’s important to clarify that
our goal doesn’t seek to offer a diagnosis but rather to make
a prediction of which users are likely to be suffering from the
BD. The main contributions of our work are:
• Introducing the concept of time-specific subconscious
crowdsourcing, which can aid in locating the social
network behavior data of BD patients with the corre-
sponding time of diagnosis.
• A BD assessment mechanism that differentiates be-
tween prodromal symptoms and acute symptoms.
• Introducing the phonological features into the assess-
ment mechanism, which allows for the possibility to
assess patients through text only.
• An automatic recognition approach that detects the
possible prodromal period for BD.
2 RELATED WORK
Social media resources have been widely utilized by researchers
to study mental health issues. The following literature em-
phasizes on data collection and feature engineering, including
subject recruitment, manual data collection, data collection
applications, keyword matching, and combined approaches.
The clinical approach for mental disorders and prodrome
studies are also discussed in this section.
Subject recruitment: Based on customized question-
naires and contact with subjects, Park et al. [15] recruited
participants for the Center for Epidemiologic Studies Depres-
sion scale(CES-D) [17] and provided their Twitter data. By
analyzing the information contained in tweets, participants
were divided into normal and depressive groups based on
their scores on CES-D. An approach like this one requires ex-
pensive costs to acquire data and conduct the questionnaire.
Manual and automatic data collecting: Moreno et
al. [14] collected data via the Facebook profiles of college stu-
dents reviewed by two investigators. They aimed at revealing
the relationship between demographic factors and depression.
Similarly, in our work, we invest on manual efforts to collect
and properly annotate our dataset. In addition, there are
many applications built on top of social networks that provide
free services where users may need to input their credentials
arXiv:1712.09183v1[cs.IR]26Dec2017
Wordcloud
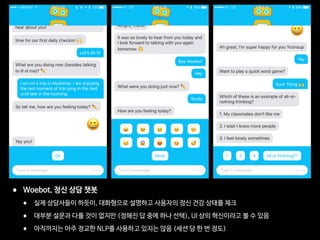
Features(#DIM) 2 mths 3 mths 6 mths 9 mths 12 mths
AG(2)
0.475 0.503 0.445 0.434 0.383
Pol(5)
0.911 0.893 0.843 0.836 0.803
Emot(8)
0.893 0.895 0.908 0.917 0.896
Soc(4)
0.941 0.913 0.845 0.834 0.786
LT(1)
0.645 0.589 0.554 0.504 0.513
TRD(1)
0.570 0.638 0.626 0.615 0.654
Phon(8)
0.889 0.880 0.802 0.838 0.821
Table 2: Average Precision of Single Feature Perfor-
mance
Age and Gender
Mood Polarity Features
Emotional Score
Social Feature
Late Tweet Frequency
Tweet Rate Difference
Phonological Feature
Diagnosed time !
" months
" = 2 months
Figure 1: Illness Period Modeling
features are introduced: (1) Word-level features and BD
Pattern of Life features.
3.4.1 Word-level Features. With respect to the linguis-
tic features for BD, the Character n-gram language fea-
tures(CLF) and LIWC metrics are designed to capture it.
The CLF utilizes n-grams to measure the comment words
or phrases used by users. The tf-idf is utilized in our score-
calculating method, the tf is the frequency of an n-gram and
the document d of df is defined as each particular twitter
user k. The formula for the tf-idf is thus given as:
tfidf
(k,⌧,↵)
vn = freq
(k,⌧,↵)
vn ⇥ log
K
1 + freq
(K,⌧,↵)
vn
(1)
The freq
(k)
vn is the frequency of n-gram vn
, which is n 2 {1, 2}
to represent psychological features, su
terns and the behavioral tendency o
polarity, emotion, and social interacti
full BDPLF, there are five categories:
• Age and Gender: Sit et al. [2
effects on BD, indicating that wom
likely to have Bipolar Disorder
than men. We make use of the ag
proposed by Sap et al. [19], whic
social media.
• Mood Polarity Features: Ow
BD patients experience rapid mo
analysis is firstly adapted to obt
larity portrayed by each user’s t
the sentiment of tweets, the onlin
used, based on Go et al.’s work [
the contents of tweets into thre
positive, negative, and neutral.
those three categories into five
positive ratio, negative ratio, po
combo, and flips ratio.
• Emotional Scores: Beyond th
tion detection tool proposed by
employed to classify the tweets in
gories: joy, surprise, anticipation,
anger, and fear. The emotion cla
further transformed into emotio
esei,
(k)
⌧,↵
=
ei,
(k)
⌧,↵
ecount
진단 받기 1년 전 부터의 트윗을 대조군과 비교 분석
개별 feature만으로도 위험군 분류에 높은 precision을 보였음](https://image.slidesharecdn.com/digitalhealthcare-intheperspectiveofmentaldisorder-180420075555/85/slide-57-320.jpg)


![ORIGINAL ARTICLE
Watson for Oncology and breast cancer treatment
recommendations: agreement with an expert
multidisciplinary tumor board
S. P. Somashekhar1*, M.-J. Sepu´lveda2
, S. Puglielli3
, A. D. Norden3
, E. H. Shortliffe4
, C. Rohit Kumar1
,
A. Rauthan1
, N. Arun Kumar1
, P. Patil1
, K. Rhee3
& Y. Ramya1
1
Manipal Comprehensive Cancer Centre, Manipal Hospital, Bangalore, India; 2
IBM Research (Retired), Yorktown Heights; 3
Watson Health, IBM Corporation,
Cambridge; 4
Department of Surgical Oncology, College of Health Solutions, Arizona State University, Phoenix, USA
*Correspondence to: Prof. Sampige Prasannakumar Somashekhar, Manipal Comprehensive Cancer Centre, Manipal Hospital, Old Airport Road, Bangalore 560017, Karnataka,
India. Tel: þ91-9845712012; Fax: þ91-80-2502-3759; E-mail: somashekhar.sp@manipalhospitals.com
Background: Breast cancer oncologists are challenged to personalize care with rapidly changing scientific evidence, drug
approvals, and treatment guidelines. Artificial intelligence (AI) clinical decision-support systems (CDSSs) have the potential to
help address this challenge. We report here the results of examining the level of agreement (concordance) between treatment
recommendations made by the AI CDSS Watson for Oncology (WFO) and a multidisciplinary tumor board for breast cancer.
Patients and methods: Treatment recommendations were provided for 638 breast cancers between 2014 and 2016 at the
Manipal Comprehensive Cancer Center, Bengaluru, India. WFO provided treatment recommendations for the identical cases in
2016. A blinded second review was carried out by the center’s tumor board in 2016 for all cases in which there was not
agreement, to account for treatments and guidelines not available before 2016. Treatment recommendations were considered
concordant if the tumor board recommendations were designated ‘recommended’ or ‘for consideration’ by WFO.
Results: Treatment concordance between WFO and the multidisciplinary tumor board occurred in 93% of breast cancer cases.
Subgroup analysis found that patients with stage I or IV disease were less likely to be concordant than patients with stage II or III
disease. Increasing age was found to have a major impact on concordance. Concordance declined significantly (P 0.02;
P < 0.001) in all age groups compared with patients <45 years of age, except for the age group 55–64 years. Receptor status
was not found to affect concordance.
Conclusion: Treatment recommendations made by WFO and the tumor board were highly concordant for breast cancer cases
examined. Breast cancer stage and patient age had significant influence on concordance, while receptor status alone did not.
This study demonstrates that the AI clinical decision-support system WFO may be a helpful tool for breast cancer treatment
decision making, especially at centers where expert breast cancer resources are limited.
Key words: Watson for Oncology, artificial intelligence, cognitive clinical decision-support systems, breast cancer,
concordance, multidisciplinary tumor board
Introduction
Oncologists who treat breast cancer are challenged by a large and
rapidly expanding knowledge base [1, 2]. As of October 2017, for
example, there were 69 FDA-approved drugs for the treatment of
breast cancer, not including combination treatment regimens
[3]. The growth of massive genetic and clinical databases, along
with computing systems to exploit them, will accelerate the speed
of breast cancer treatment advances and shorten the cycle time
for changes to breast cancer treatment guidelines [4, 5]. In add-
ition, these information management challenges in cancer care
are occurring in a practice environment where there is little time
available for tracking and accessing relevant information at the
point of care [6]. For example, a study that surveyed 1117 oncolo-
gists reported that on average 4.6 h per week were spent keeping
VC The Author(s) 2018. Published by Oxford University Press on behalf of the European Society for Medical Oncology.
All rights reserved. For permissions, please email: journals.permissions@oup.com.
Annals of Oncology 29: 418–423, 2018
doi:10.1093/annonc/mdx781
Published online 9 January 2018
Downloaded from https://academic.oup.com/annonc/article-abstract/29/2/418/4781689
by guest](https://image.slidesharecdn.com/digitalhealthcare-intheperspectiveofmentaldisorder-180420075555/85/slide-72-320.jpg)


![Copyright 2016 American Medical Association. All rights reserved.
Development and Validation of a Deep Learning Algorithm
for Detection of Diabetic Retinopathy
in Retinal Fundus Photographs
Varun Gulshan, PhD; Lily Peng, MD, PhD; Marc Coram, PhD; Martin C. Stumpe, PhD; Derek Wu, BS; Arunachalam Narayanaswamy, PhD;
Subhashini Venugopalan, MS; Kasumi Widner, MS; Tom Madams, MEng; Jorge Cuadros, OD, PhD; Ramasamy Kim, OD, DNB;
Rajiv Raman, MS, DNB; Philip C. Nelson, BS; Jessica L. Mega, MD, MPH; Dale R. Webster, PhD
IMPORTANCE Deep learning is a family of computational methods that allow an algorithm to
program itself by learning from a large set of examples that demonstrate the desired
behavior, removing the need to specify rules explicitly. Application of these methods to
medical imaging requires further assessment and validation.
OBJECTIVE To apply deep learning to create an algorithm for automated detection of diabetic
retinopathy and diabetic macular edema in retinal fundus photographs.
DESIGN AND SETTING A specific type of neural network optimized for image classification
called a deep convolutional neural network was trained using a retrospective development
data set of 128 175 retinal images, which were graded 3 to 7 times for diabetic retinopathy,
diabetic macular edema, and image gradability by a panel of 54 US licensed ophthalmologists
and ophthalmology senior residents between May and December 2015. The resultant
algorithm was validated in January and February 2016 using 2 separate data sets, both
graded by at least 7 US board-certified ophthalmologists with high intragrader consistency.
EXPOSURE Deep learning–trained algorithm.
MAIN OUTCOMES AND MEASURES The sensitivity and specificity of the algorithm for detecting
referable diabetic retinopathy (RDR), defined as moderate and worse diabetic retinopathy,
referable diabetic macular edema, or both, were generated based on the reference standard
of the majority decision of the ophthalmologist panel. The algorithm was evaluated at 2
operating points selected from the development set, one selected for high specificity and
another for high sensitivity.
RESULTS TheEyePACS-1datasetconsistedof9963imagesfrom4997patients(meanage,54.4
years;62.2%women;prevalenceofRDR,683/8878fullygradableimages[7.8%]);the
Messidor-2datasethad1748imagesfrom874patients(meanage,57.6years;42.6%women;
prevalenceofRDR,254/1745fullygradableimages[14.6%]).FordetectingRDR,thealgorithm
hadanareaunderthereceiveroperatingcurveof0.991(95%CI,0.988-0.993)forEyePACS-1and
0.990(95%CI,0.986-0.995)forMessidor-2.Usingthefirstoperatingcutpointwithhigh
specificity,forEyePACS-1,thesensitivitywas90.3%(95%CI,87.5%-92.7%)andthespecificity
was98.1%(95%CI,97.8%-98.5%).ForMessidor-2,thesensitivitywas87.0%(95%CI,81.1%-
91.0%)andthespecificitywas98.5%(95%CI,97.7%-99.1%).Usingasecondoperatingpoint
withhighsensitivityinthedevelopmentset,forEyePACS-1thesensitivitywas97.5%and
specificitywas93.4%andforMessidor-2thesensitivitywas96.1%andspecificitywas93.9%.
CONCLUSIONS AND RELEVANCE In this evaluation of retinal fundus photographs from adults
with diabetes, an algorithm based on deep machine learning had high sensitivity and
specificity for detecting referable diabetic retinopathy. Further research is necessary to
determine the feasibility of applying this algorithm in the clinical setting and to determine
whether use of the algorithm could lead to improved care and outcomes compared with
current ophthalmologic assessment.
JAMA. doi:10.1001/jama.2016.17216
Published online November 29, 2016.
Editorial
Supplemental content
Author Affiliations: Google Inc,
Mountain View, California (Gulshan,
Peng, Coram, Stumpe, Wu,
Narayanaswamy, Venugopalan,
Widner, Madams, Nelson, Webster);
Department of Computer Science,
University of Texas, Austin
(Venugopalan); EyePACS LLC,
San Jose, California (Cuadros); School
of Optometry, Vision Science
Graduate Group, University of
California, Berkeley (Cuadros);
Aravind Medical Research
Foundation, Aravind Eye Care
System, Madurai, India (Kim); Shri
Bhagwan Mahavir Vitreoretinal
Services, Sankara Nethralaya,
Chennai, Tamil Nadu, India (Raman);
Verily Life Sciences, Mountain View,
California (Mega); Cardiovascular
Division, Department of Medicine,
Brigham and Women’s Hospital and
Harvard Medical School, Boston,
Massachusetts (Mega).
Corresponding Author: Lily Peng,
MD, PhD, Google Research, 1600
Amphitheatre Way, Mountain View,
CA 94043 (lhpeng@google.com).
Research
JAMA | Original Investigation | INNOVATIONS IN HEALTH CARE DELIVERY
(Reprinted) E1
Copyright 2016 American Medical Association. All rights reserved.](https://image.slidesharecdn.com/digitalhealthcare-intheperspectiveofmentaldisorder-180420075555/85/slide-81-320.jpg)


![Assisting Pathologists in Detecting
Cancer with Deep Learning
6
Input & Validation Test
model size FROC @8FP AUC FROC @8FP AUC
40X 98.1 100 99.0 87.3 (83.2, 91.1) 91.1 (87.2, 94.5) 96.7 (92.6, 99.6)
40X-pretrained 99.3 100 100 85.5 (81.0, 89.5) 91.1 (86.8, 94.6) 97.5 (93.8, 99.8)
40X-small 99.3 100 100 86.4 (82.2, 90.4) 92.4 (88.8, 95.7) 97.1 (93.2, 99.8)
ensemble-of-3 - - - 88.5 (84.3, 92.2) 92.4 (88.7, 95.6) 97.7 (93.0, 100)
20X-small 94.7 100 99.6 85.5 (81.0, 89.7) 91.1 (86.9, 94.8) 98.6 (96.7, 100)
10X-small 88.7 97.2 97.7 79.3 (74.2, 84.1) 84.9 (80.0, 89.4) 96.5 (91.9, 99.7)
40X+20X-small 94.9 98.6 99.0 85.9 (81.6, 89.9) 92.9 (89.3, 96.1) 97.0 (93.1, 99.9)
40X+10X-small 93.8 98.6 100 82.2 (77.0, 86.7) 87.6 (83.2, 91.7) 98.6 (96.2, 99.9)
Pathologist [1] - - - 73.3* 73.3* 96.6
Camelyon16 winner [1, 23] - - - 80.7 82.7 99.4
Table 1. Results on Camelyon16 dataset (95% confidence intervals, CI). Bold indicates
results within the CI of the best model. “Small” models contain 300K parameters per
Inception tower instead of 20M. -: not reported. *A pathologist achieved this sensitivity
(with no FP) using 30 hours.
to 10 20% variance), and can confound evaluation of model improvements
by grouping multiple nearby tumors as one. By contrast, our non-maxima sup-
pression approach is relatively insensitive to r between 4 and 6, although less
accurate models benefited from tuning r using the validation set (e.g., 8). Fi-
The FROC evaluates tumor detection and localization
The FROC is defined as the sensitivity at 0.25,0.5,1,2,4,8 average FPs per tumor-negative slide.
Yun Liu et al. Detecting Cancer Metastases on Gigapixel Pathology Images (2017)
Sensitivity at 8 false positives per image](https://image.slidesharecdn.com/digitalhealthcare-intheperspectiveofmentaldisorder-180420075555/85/slide-92-320.jpg)


![RESEARCH ARTICLE
A pilot study to determine the feasibility of
enhancing cognitive abilities in children with
sensory processing dysfunction
Joaquin A. Anguera1,2☯
*, Anne N. Brandes-Aitken1☯
, Ashley D. Antovich1
, Camarin
E. Rolle1
, Shivani S. Desai1
, Elysa J. Marco1,2,3
1 Department of Neurology, University of California, San Francisco, United States of America, 2 Department
of Psychiatry, University of California, San Francisco, United States of America, 3 Department of Pediatrics,
University of California, San Francisco, United States of America
☯ These authors contributed equally to this work.
* joaquin.anguera@ucsf.edu
Abstract
Children with Sensory Processing Dysfunction (SPD) experience incoming information in
atypical, distracting ways. Qualitative challenges with attention have been reported in these
children, but such difficulties have not been quantified using either behavioral or functional
neuroimaging methods. Furthermore, the efficacy of evidence-based cognitive control inter-
ventions aimed at enhancing attention in this group has not been tested. Here we present
work aimed at characterizing and enhancing attentional abilities for children with SPD. A
sample of 38 SPD and 25 typically developing children were tested on behavioral, neural,
and parental measures of attention before and after a 4-week iPad-based at-home cognitive
remediation program. At baseline, 54% of children with SPD met or exceeded criteria on a
parent report measure for inattention/hyperactivity. Significant deficits involving sustained
attention, selective attention and goal management were observed only in the subset of
SPD children with parent-reported inattention. This subset of children also showed reduced
midline frontal theta activity, an electroencephalographic measure of attention. Following
the cognitive intervention, only the SPD children with inattention/hyperactivity showed both
improvements in midline frontal theta activity and on a parental report of inattention. Notably,
33% of these individuals no longer met the clinical cut-off for inattention, with the parent-
reported improvements persisting for 9 months. These findings support the benefit of a
targeted attention intervention for a subset of children with SPD, while simultaneously
highlighting the importance of having a multifaceted assessment for individuals with neuro-
developmental conditions to optimally personalize treatment.
Introduction
Five percent of all children suffer from Sensory Processing Dysfunction (SPD)[1], with these
individuals exhibiting exaggerated aversive, withdrawal, or seeking behaviors associated with
sensory inputs [2]. These sensory processing differences can have significant and lifelong con-
sequences for learning and social abilities, and are often shared by children who meet
PLOS ONE | https://doi.org/10.1371/journal.pone.0172616 April 5, 2017 1 / 19
a1111111111
a1111111111
a1111111111
a1111111111
a1111111111
OPEN ACCESS
Citation: Anguera JA, Brandes-Aitken AN, Antovich
AD, Rolle CE, Desai SS, Marco EJ (2017) A pilot
study to determine the feasibility of enhancing
cognitive abilities in children with sensory
processing dysfunction. PLoS ONE 12(4):
e0172616. https://doi.org/10.1371/journal.
pone.0172616
Editor: Jacobus P. van Wouwe, TNO,
NETHERLANDS
Received: October 5, 2016
Accepted: February 1, 2017
Published: April 5, 2017
Copyright: © 2017 Anguera et al. This is an open
access article distributed under the terms of the
Creative Commons Attribution License, which
permits unrestricted use, distribution, and
reproduction in any medium, provided the original
author and source are credited.
Data Availability Statement: All relevant data are
within the paper and its Supporting Information
files.
Funding: This work was supported by the
Mickelson-Brody Family Foundation, the Wallace
Research Foundation, the James Gates Family
Foundation, the Kawaja-Holcombe Family
Foundation (EJM), and the SNAP 2015 Crowd
funding effort.
•감각처리장애(SPD)를 가진 소아 환자 중 ADHD를 가진 20명에 대해서 실험
•4주 동안 (주당 5일, 25분)Project EVO 게임을 하게 한 결과,
•20명 중 7명이 큰 개선을 보여서 더 이상 ADHD의 범주에 들지 않게 됨
•사용 후 적어도 9개월 동안 효과가 지속되었음
Fig 4. Transfer effect on behavioral and parent report measures. Pre and post (A) response time (B) and resp
revealing within group change. Error bars indicate standard error of the mean. Within group main effects of session
= p .05, ** =.p .01. Sun symbols indicate statistically significant instances where SPD+IA post-training performa
TDC group prior to training. (C) Vanderbilt parent report inattention change bar plot (calculated by pre-post margina
significant group x session interaction. Error bars indicate standard error of the mean. All group x session interactio
stars (* = p .05, ** =.p .01) on bar graph.
https://doi.org/10.1371/journal.pone.0172616.g004
PLOS ONE | https://doi.org/10.1371/journal.pone.0172616 April 5, 2017](https://image.slidesharecdn.com/digitalhealthcare-intheperspectiveofmentaldisorder-180420075555/85/slide-161-320.jpg)


1) The document discusses the concept of a "digital phenotype", which refers to aspects of a person's interactions with technology that can provide diagnostic or prognostic insights into their health conditions. 2) Previous research has found correlations between depressive symptom severity and certain location-based smartphone sensor data, such as increased location variance and disrupted circadian rhythms. 3) This study replicates previous findings using GPS smartphone sensor data collected from 48 college students over 10 weeks, finding significant correlations between depressive symptoms and location variance, entropy, and circadian movement patterns. The relationships were stronger when analyzing weekend versus weekday data.


![[KNAPS] 포스트 코로나 시대, 제약 산업과 디지털 헬스케어](https://cdn.slidesharecdn.com/ss_thumbnails/knaps-210128022335-thumbnail.jpg?width=640&height=640&fit=bounds)

![[대한병리학회] 의료 인공지능 101: 병리를 중심으로](https://cdn.slidesharecdn.com/ss_thumbnails/pathology-201106004112-thumbnail.jpg?width=640&height=640&fit=bounds)


![[C&C] 의료의 미래 디지털 헬스케어](https://cdn.slidesharecdn.com/ss_thumbnails/cc-200616080105-thumbnail.jpg?width=640&height=640&fit=bounds)


![[365mc] 디지털 헬스케어: 의료의 미래](https://cdn.slidesharecdn.com/ss_thumbnails/365mc-200317140059-thumbnail.jpg?width=640&height=640&fit=bounds)

![[ASGO 2019] Artificial Intelligence in Medicine](https://cdn.slidesharecdn.com/ss_thumbnails/asgo2019medicalai191010-191010155811-thumbnail.jpg?width=640&height=640&fit=bounds)


