Noble Metal Free, Visible Light Driven Photocatalysis Using TiO2 Nanotube Arrays Sensitized by P‐Doped C3N4 Quantum Dots
•Download as PPTX, PDF•
0 likes•116 views

1) Phosphorus-doped carbon nitride quantum dots (CNPQDs) were synthesized and decorated on square-shaped TiO2 nanotube arrays (STNAs) via a hydrothermal method to create a CNPQD-STNA composite. 2) Characterization of the CNPQD-STNA composite showed the CNPQDs were uniformly deposited on the STNA with an amorphous structure. 3) Photoelectrochemical testing demonstrated the CNPQD-STNA composite exhibited higher photocurrent density and incident photon-to-current efficiency for visible light-driven water splitting compared to pristine STNAs or TiO2 nanotube arrays coated with undoped C

Recommended
Recommended
More Related Content
What's hot
What's hot (20)
Similar to Noble Metal Free, Visible Light Driven Photocatalysis Using TiO2 Nanotube Arrays Sensitized by P‐Doped C3N4 Quantum Dots
Similar to Noble Metal Free, Visible Light Driven Photocatalysis Using TiO2 Nanotube Arrays Sensitized by P‐Doped C3N4 Quantum Dots (20)
More from Pawan Kumar
More from Pawan Kumar (20)
Recently uploaded
Recently uploaded (20)
Noble Metal Free, Visible Light Driven Photocatalysis Using TiO2 Nanotube Arrays Sensitized by P‐Doped C3N4 Quantum Dots
- 1. Noble Metal Free, Visible Light Driven Photocatalysis Using TiO2 Nanotube Arrays Sensitized by P-doped C3N4 Quantum Dots Pawan Kumar, Piyush Kar, Ajay P. Manuel, Sheng Zeng, Ujwal K. Thakur, Kazi M. Alam, Yun Zhang, Ryan Kisslinger, Kai Cui, Guy M. Bernard, Vladimir K. Michaelis, Karthik Shankar Adv. Optical Mater. 2019, 1901275
- 2. Figure 1. Schematic diagram illustrating the synthesis of a) phosphorus doped carbon nitride quantum dots (CNPQDs). b) Steady state photoluminescence (PL) spectrum of phosphorus doped carbon nitride quantum dots (CNPQDs) and carbon nitride quantum dots (CNQDs) in water (330 nm excitation wavelength). Inset showing fluorescence of CNPQDs sample under UV light irradiation. c) 15N and 31P CPMAS NMR spectra of CNPQDs. d) Flame annealed square shape TiO2 nanotube arrays (STNAs) from aqueous TiO2 nanotube arrays (TNAs). e) Hydrothermal treatment for decoration of CNPQDs on STNA (CNPQD-STNA) and TNA (CNPQD-TNA).
- 3. Figure 2. HRTEM images of CNPQD-STNA a) at 10 nm scale bar showing amorphous layers of CNPQDs deposited on STNA, b) at 5 nm scale bar showing lattice fringes and Moire fringes, insets shows rutile phase TiO2 (110) plane d spacing and TEM FFT diffraction pattern, c) at 5 nm scale bar showing lattice fringes and insets shows rutile (110) and (101) planes d spacing and TEM FFT diffraction pattern. d) Bright field electron image, and STEM elemental maps for C, N, O, P and Ti. e) STEM-EDX spectra of CNPQD-STNA. f) Inner shell ionization edge (core loss) electron energy loss spectra (EELS) of CNPQD-STNA showing P-L edge, C-K edge, N-K edge, and Ti-L edge acquired on STEM. g) EELS elemental mapping of CNPQDSTNA showing map area, C-K edge, P-L edge and N-K edge. h)
- 4. Figure 3. Core-level high resolution XPS spectra of CNPQD-STNA in a) C1s, b) N1s, c) P2p, and d) Ti2p regions.
- 5. Figure 4. a) UV-Vis spectra of CNPQDs in water showing π→π* and n→π* transition and UV-Vis spectra of bulk g- C3N4. b) Diffuse reflectance UV-Vis spectra of TNA, CNPQDs-TNA, STNA and CNPQDs-STNA. c) UPS work function spectra of TNA, CNPQDs-TNA, STNA, CNPQDs-STNA and inset shows cut-off energy (Ecut-off) of secondary electrons. The work function (WF) was determined from the UPS work function spectra using the equation WF (ϕ) = 21.21 – Ecut-off, where 21.21 eV is energy of the incident, He laser used for UPS. d) UPS valence band spectra of TNA, CNPQDs-TNA, STNA, CNPQDs-STNA showing the estimated values of the respective valence band maxima below the Fermi level. Color: TNA (blue), CNPQDs-TNA (green), STNA (red) and CNPQDs-STNA (wine red)
- 6. Figure 5. Photocurrent density vs applied potential plot for a) CNPQDs-STNA and CNPQDs-TNA. b) STNA and TNA. c) Photocurrent density change during light on-off cycle for CNPQDs-STNA under dark conditions, under solar simulated AM1.5 G irradiation with 420 nm cut-off filter, under AM1.5 G irradiation without UV cut-off filter. d) Photocurrent density vs applied potential plot for STNA and CNPQDs-STNA under dark conditions, under 450 nm LEDs irradiation (power density 54.15 mW cm-2) and 500 nm LEDs irradiation (power density 40.58 mW cm-2). e) TNA, CNPQDs-TNA under dark conditions, under 450 nm LEDs irradiation (power density 54.15 mW cm-2). f) IPCE and APCE% of TNA, CNPQDs-TNA, STNA, CNPQDs-STNA samples in 450 and 500 nm wavelength LED. Plot between ABPE% vs potential showing maximum ABPE% of TNA, STNA, CNPQDs-TNA, CNPQDs- STNA g) under solar simulated AM1.5 G irradiation (>420 nm), under AM1.5 G irradiation without UV cut-off filter h) under 450 nm wavelength LEDs irradiation, under 500 nm wavelength LEDs irradiation. All the measurements were carried out in 1.0 M KOH solution at a scan rate of 0.1 mV/sec). i) Bar diagram showing experimentally observed H2 evolution rate and corresponding Faradaic efficiencies using TNA, CNPQDs-TNA, STNA CNPQDs- STNAsamples under AM1.5 G irradiation.
- 7. Figure 6. Results of FDTD simulations of discrete titania nanotubes showing electric field intensities for a) TNAs at 500 nm. b) TNAs at 350 nm. c) STNAs at 500 nm. d) STNAs at 350 nm. e) CNPQDs-STNA at 500 nm. f) CNPQDs-TNA at 500 nm.
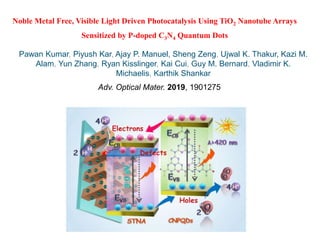
- 8. Figure 7. Mechanistic scheme of photoelectrochemical water splitting on CNPQDs-STNA nanohybrid.
- 9. Figure 8. Schematic showing plexcitonic surface catalytic reduction of 4-NBT (4-nitrobenzenethiol) to DMAB (p, p-dimercaptoazobenzene) and a) Raman spectra of pristine 4-NBT (black), DMAB (purple) and comparison of SERS spectra of plexcitonic surface catalytic transformation of 4-NBT to DMAB on bare Ag (orange),10 nm Ag sputtered TNA (blue), STNA (red), CNPQDs-TNA (green), CNPQDs- STNA (wine red) under 532 nm laser illumination at 1 mW power, and SERS spectra of plasmon-exciton co-induced surface catalytic degradation of 4-NBT to DMAB as function of laser power on (a) 10 nm Ag sputtered on glass, (c) 10 nm Ag sputtered TNA, (d) 10 nm Ag sputtered STNA, (e) 10 nm Ag sputtered CNPQDs-TNA, (f) 10 nm Ag sputtered CNPQDs-STNA.
- 10. Figure S2. Zeta potential distribution of CNPQDs in water for determination of surface charge
- 11. Figure S3. FE-SEM image of (a) top-view of TNA (b) cross-sectional view of TNA (c) top- view of STNA and (d) cross-sectional view of STNA.
- 12. Figure S4. STEM-EDX pattern of TNA samples showing presence of Ti and O elements.
- 13. Figure S5. STEM-EDX pattern of CNPQDs-TNA samples showing presence of C, N, P Ti and O elements.
- 14. Figure S6. a) XRD patterns of TNA, CNPQD-TNA, STNA, and CNPQD-STNA; anatase peaks were assigned in accordance with JCPDS Card # 21-1272, and rutile peaks were indexed to JCPDS Card # 21-1276. b) Raman spectra of TNA, CNPQD-TNA, STNA. Colour: TNA (blue), CNPQD-TNA (green), STNA (red) and CNPQD-STNA (wine red).
- 15. Figure S7. High resolution core level XPS spectra of CNPQDs-STNA in O1s regions.
- 16. Figure S8. a) XPS survey scan spectra of CNPQDs-TNAs (black) and CNPQDs-STNAs (red), HR- XPS spectra of CNPQDs-TNAs nanohybrid in b) C1s, c) N1s, d) P2p, e) Ti2p, and f) O1s regions.
- 17. Figure S9. FTIR spectra of CNPQDs (black), CNPQDs-TNA (green) and CNPQDs- STNA (wine red).
- 18. Figure S10. Electric field intensity along the cross-section of a single nanotube in an array of titania nanotubes (a) CNFQDs-TNA at 450 nm (b) CNFQDs-TNA at 500 nm (d) CNFQDs-STNA at 450 nm and (e) CNFQDs-STNA at 500 nm; (c) and (f) Simulated optical spectra of CNFQDs-TNA and CNFQDs-STNA respectively.
- 19. Figure S11. Photocurrent density vs applied potential plot during light On-Off cycle for CNPQDs- TNA under dark conditions (navy blue), under solar simulated AM1.5 G irradiation with 420 nm cut-off filter (purple), under AM1.5 G irradiation without UV cut-off filter (green) All the measurements were carried out in 1.0 M KOH solution at a scan rate of 0.1 mV/sec.
- 20. Figure S12. Photocurrent density vs applied potential plot for CNPQDs-TNA under dark conditions (navy blue), under 500 nm LED irradiation (power density 40.58 mW cm-2) All the measurements were carried out in 1.0 M KOH solution at a scan rate of 0.1 mV/sec.
- 21. Figure S13. GC chromatogram of gaseous product collected on Pt counter electrode, showing peaks for evolved H2 in PEC water splitting using TNA, CNPQDs-TNA, STNA CNPQDs- STNA as photocatalyst under AM1.5 irradiation.
- 22. Figure S14. GC chromatogram of gaseous product for (a) evolved hydrogen in electrocatalytic reaction under dark (b) evolved hydrogen in photocatalytic reaction under AM1.5 G irradiation and (c) evolved oxygen in photoelectrocatalytic reaction under AM1.5 G irradiation using TNA, CNPQDs-TNA, STNA CNPQDs-STNA as photocatalyst.
- 23. Figure S15. GC chromatogram of oxygen in PEC experiment before and after irradiation under AM1.5 irradiation.