Metal-Free Sulfonate-Sulfate-Functionalized Carbon Nitride for Direct Conversion of Glucose to Levulinic Acid.pptx

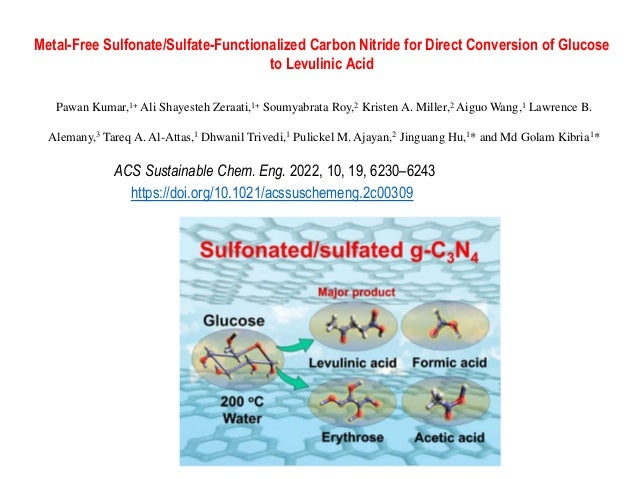
Metal-free heteroatom-doped carbonaceous materials such as carbon nitride (CN) with secondary/tertiary nitrogen-rich catalytic centers as well as chemical and thermal resilience can potentially serve as catalysts for many organic reactions. However, because of the stable alternate Csp2–Nsp2 configuration of N-linked heptazine units (C6N7), the chemical modification of CN via doping and functionalization has been a critical challenge. Herein, we report an exceptional 9.2% sulfur content in CN with sulfonate/sulfate functional groups (CNS) via a one-step in situ synthesis approach. When used as a catalyst for the dehydration/hydration of glucose, CNS catalysts demonstrate a relatively high yield and selectivity toward levulinic acid, LLA, (≈48% yield with 57% selectivity) production. CNS’s high activity of direct conversion of glucose to LLA can be attributed to the synergistic catalytic effects of multiple sulfur functionalities, better dispersibility, and microstructural porosity. The synthesized CNS catalysts offer an energy efficient direct LLA production route to bypass the multistep process of sugar to LLA conversion.

Recommended
Recommended
More Related Content
Similar to Metal-Free Sulfonate-Sulfate-Functionalized Carbon Nitride for Direct Conversion of Glucose to Levulinic Acid.pptx
Similar to Metal-Free Sulfonate-Sulfate-Functionalized Carbon Nitride for Direct Conversion of Glucose to Levulinic Acid.pptx (20)
More from Pawan Kumar
More from Pawan Kumar (20)
Recently uploaded
Recently uploaded (20)
Metal-Free Sulfonate-Sulfate-Functionalized Carbon Nitride for Direct Conversion of Glucose to Levulinic Acid.pptx
- 1. Metal-Free Sulfonate/Sulfate-Functionalized Carbon Nitride for Direct Conversion of Glucose to Levulinic Acid Pawan Kumar,1+ Ali Shayesteh Zeraati,1+ Soumyabrata Roy,2 Kristen A. Miller,2 Aiguo Wang,1 Lawrence B. Alemany,3 Tareq A. Al-Attas,1 Dhwanil Trivedi,1 Pulickel M. Ajayan,2 Jinguang Hu,1* and Md Golam Kibria1* ACS Sustainable Chem. Eng. 2022, 10, 19, 6230–6243 https://doi.org/10.1021/acssuschemeng.2c00309
- 2. Figure 1. Schematic diagram of (a) solid-state synthesis of sulfonate/sulfate-functionalized S-doped CN (CNS) using dicyandiamide and ammonium persulfate in a quartz ampoule. Atoms color: C: dark gray, N: blue, O: red, S: yellow, H: white; (b) sulfonated CN (S-GCN) synthesized using ClSO3H as reported in the literature (29) and (c) CNS synthesized using ammonium persulfate in the current study.
- 3. Figure 2. SEM images of CN (a) and CNS (b) particles; TEM images of CN (c) and CNS (d) with the corresponding SAED patterns in the figure inset. The TEM image of CNS clearly shows the porous structure; (e) HAADF-STEM image and corresponding elemental mapping for C, N, and S for a porous flakelike structure of CNS.
- 4. Figure 3. (a) Direct excitation 50.33 MHz 13C ssNMR spectra of CN and CNS (b) evolution of 13C NMR signals with different contact times for CN and CNS (c) 20.28 MHz 1H-15N CPMAS spectra of pristine CN obtained under the same conditions except for different contact times: (i) tcp = 3 ms, (ii) tcp = 6 ms, and (iii) tcp = 10 ms. The spectra are plotted with the same level of baseline noise to facilitate comparison. (d) 20.28 MHz 1H-15N CPMAS spectra of CNS obtained under the same conditions except for different contact times: (i) tcp = 3 ms, (ii) tcp = 6 ms, (iii) tcp = 10 ms. The spectra are plotted with the same level of baseline noise to facilitate comparison. (e) (i) 20.28 MHz 1H-15N CPMAS spectrum of pristine CN obtained with a contact time tcp = 6 ms. 20.28 MHz 1H-15N CPPI MAS spectra of CN obtained with tcp = 6 ms and a subsequent polarization inversion time ti of (ii) 40 μs, (iii) 100 μs, (iv) 160 μs. (f) (i) 20.28 MHz 1H-15N CPMAS spectrum of CNS obtained with a contact time tcp = 3 ms. 1H-15N CPPI MAS spectra (20.28 MHz) of CNS obtained with tcp = 3 ms and a subsequent polarization inversion time ti of (ii) 40 μs, (iii) 75 μs, (iv) 100 μs.
- 5. Figure 4. (a) FT-IR spectra of CN and CNS; (b) Raman spectra of CN and CNS showing specific D and G bands for the graphenic structure; (c) NH3-TPD spectra of CN and CNS; only the CNS peak is deconvoluted for simplicity. Component peak fitting of XPS spectra of the synthesized CN (d–f) and CNS (g–i): (d and g) C 1s region, (e and h) N 1s region, (f) O 1s region of CN, and (i) S 2p region of CNS.
- 6. Figure 5. Schematic diagram showing the product selectivity using previously reported (a) S-GCN (CN-SO3H) and (b) CNS catalysts; (c) product distribution of glucose hydrothermal oxidation as a function of temperature using CNS and CN. (d) LLA yield using CNS-5, CNS-10, CNS-15, and CNS-20 samples synthesized by 5–20 wt % of ammonium persulfate. (Reaction conditions: glucose = 0.1 g, catalyst = 10 mg, DI water = 10 mL for 4 h).
- 7. Figure 6. A plausible mechanism of glucose dehydration to LLA.
- 8. Figure S1. (a-c) FE-SEM image of CN at different magnifications; Elemental mapping of CN (d) electron image showing scanned area and mapping for (e) C: red (f) N: blue (g) O: green (h) O: Composite of C and N, (i) EDX spectra.
- 9. Figure S2. (a-c) FE-SEM image of CNS at different magnifications; Elemental mapping of the CNS (d) electron image showing scanned area and mapping for (e) C; red (f) N; blue (g) S; orange (h) O; green
- 10. Figure S3. (a-b) HR-TEM images of CNS at different magnification; (c-d) TEM image of CNS showing the porous structure of CNS with the corresponding SAED pattern.
- 11. Figure S4. X-ray diffraction spectra of (a) CN and (b) CNS.
- 12. Figure S8. (a) Lower panel: TGA and DTA of CN Upper panel: DSC thermogram of CN (b) Lower panel: TGA and DTA of CNS Upper panel: DSC thermogram of CNS. Arrows showing exothermic and endothermic direction of the signals.
- 13. Figure S9. XPS elemental survey scan of (a) CN and (b) CNS.
- 14. Figure S10. HR-XPS spectra of CNS in O1s region
- 15. Figure S11. UV-Vis DRS spectra of CN and CNS.
- 16. Figure S12. XPS valence band (VB) spectra of CN and CNS.
- 17. Figure S13. (a) FTIR spectra of recycled CNS catalysts after reaction and washing with THF (b) Raman spectra of recycled CNS catalysts after reaction and washing with THF.
- 18. Figure S14. GC-MS spectra of glucose hydrothermal conversion products using CNS showing levulinic acid fragmentation pattern peaks.