SlideShare a Scribd company logo
1 of 15
Download to read offline
ISSN 2349-7831
International Journal of Recent Research in Social Sciences and Humanities (IJRRSSH)
Vol. 2, Issue 3, pp: (131-145), Month: July 2015 - September 2015, Available at: www.paperpublications.org
Page | 131
Paper Publications
Viability of Nigeria State Governments
Independent of Statutory Allocations:
Empirical Evidence (1999-2013)
1
Dr. Chukwu, U.C, 2
Mr. Aneke, B.O
1
Lecturer, 2
Postgraduate student 1, 2
Department of Accountancy, Ebonyi State University, Abakaliki, Nigeria
Abstract: This broad study empirically evaluates the viability of Nigeria state governments independent of
statutory allocations. The study was basically motivated by the persistent dependence of Nigeria State
Governments on allocations from the Federation Account to the neglect of internally–generated revenues; this
being so even with the current down–turn in the crude oil market, which is the main source of revenue to the
federation account. The study employed the ex- post facto research design and used the regression model to
determine the causal relationship between states internally–generated revenue and statutory allocations on the one
hand, and states total expenditures and total revenues on the other hand, during the period 1999–2013. The results
of the analysis show that, though generally, internally-generated revenues and statutory allocations have
significant effects on the dependent variables (total expenditures and total revenues) their contributions to total
expenditures and total revenues vary significantly. While internally–generated revenues contribute insignificantly
to total expenditures and total revenues, statutory allocations contribute maximally to those dependent variables.
This confirmed the dependency assumption which formed the theoretical framework of this study. The implication
of this is that currently state governments cannot finance their fiscal operations without statutory allocations
and/or external borrowings, thereby posing a threat to their future viability in view of the current down – ward
trend in the prices of oil in the world oil marked upon which the Nigerian national budget is bench – marked. It is
therefore, recommended that state governments should begin to direct more efforts toward effectively tapping the
potentials of their internal sources of revenue as a safeguard against further fall in oil prices and hence, reduction
in statutory allocations.
Keywords: State government finances, statutory allocations, Federation account, internally generated revenue,
Government expenditures.
1. INTRODUCTION
Nigeria operates a federal system of government with three tiers- Federal, States and Local governments. These three
levels of administration have powers and jurisdictions assigned to them by the Federal Constitution. In recognition of
these powers and jurisdictions, the Constitution makes provisions for the collection and distribution of public revenue
among the various levels of government. In specific terms, section 162 of the Constitution, among other things, empowers
the president to table before the National Assembly, on the advice of the Revenue Mobilization, Allocation and Fiscal
Commission, proposals for revenue allocation to the three tiers of government. Thus, every month, any amount standing
to the credit of the said Federation Account is distributed to the three levels of government based on pre-determined
criteria (or formula).
The foregoing constitutional provisions have far-reaching implications for the viability of various tiers of government in
Nigeria.
ISSN 2349-7831
International Journal of Recent Research in Social Sciences and Humanities (IJRRSSH)
Vol. 2, Issue 3, pp: (131-145), Month: July 2015 - September 2015, Available at: www.paperpublications.org
Page | 132
Paper Publications
Prior to the oil boom era in the early 1970s, revenue accrued to the Federation Account from various other sources, apart
from oil, majorly from agricultural products such as palm-oil/kernel, cocoa, groundnut, rubber, cotton, hides and skin, to
mention but a few. However, following the oil-boom all these sources of revenue were neglected such that today Nigeria
derives close to 90% of her revenue from oil exports, being a major member of the Organization of Petroleum Exporting
Countries (OPEC).
Table 1 below (State government Finances, 1999-2013), shows actual figures of States total revenue (TR), statutory
allocations (SA), internally-generated revenue (IGR) and total expenditures (TE) for the period, 1999 to 2013.The
relationships among these variables are presented in tables 2 and 3- Statutory allocations and internally-generated revenue
as percent of total expenditure and States Internally-generated revenue and statutory allocations as percent of total revenue
,respectively.
Table 1: State governments finances (1999 -2013)
Year TR (# bn) SA (# bn) IGR (# bn) TE (# bn)
1999 169.0 103.7 34.1 167.9
2000 359.1 251.6 37.8 359.7
2001 573.5 404.1 59.4 597.0
2002 669.8 388.3 89.6 724.5
2003 855.0 535.2 118.8 921.2
2004 1113.9 777.2 134.2 1125.1
2005 1419.6 921.0 122.7 1243.2
2006 1543.8 1016.1 125.2 1586.8
2007 2065.4 1109.3 305.7 2116.1
2008 2934.8 1694.0 441.1 3021.6
2009 2590.7 973.8 461.2 2776.9
2010 3162.5 1353.7 757.9 3266.2
2011 3410.1 1786.3 509.3 3542.0
2012 3572.5 1857.0 548.1 3844.9
2013 3948.6 2082.3 624.4 4156.3
Source: CBN Annual Reports, various Issues
From table 1, it can be observed that, for most of the period, total expenditure of Nigeria State governments were
considerably higher than their corresponding revenue and, on some periods double the combination of their total statutory
allocations and internally-generated revenue. Thus, on many occasion, States fiscal operations are in deficits.
2. THE PROBLEM
Tables 2 and 3 below show that following the discovering of crude oil in commercial quantities State governments in
Nigeria have persistently depended on federal monthly stipends for funding of their fiscal operations (recurrent as well as
capital expenditures). For instance, CBN Annual reports indicate that between 1999 and 2013 the percentage of IGR
(internally – generated revenue) to overall expenditures of State governments in the country ranges between 7.9% and
23.2% while the percentage of Statutory Allocations to Total Expenditures range from 35.1 to 74.1 percent within the
same period (table 2).
In the same direction, the percentage of Internally generated Revenue to Total Revenue range from 8.1 percent to 23.9
percent while the percentage of Statutory Allocations to Total Revenue has a range of 37.6%-70.5% ( table 3).
ISSN 2349-7831
International Journal of Recent Research in Social Sciences and Humanities (IJRRSSH)
Vol. 2, Issue 3, pp: (131-145), Month: July 2015 - September 2015, Available at: www.paperpublications.org
Page | 133
Paper Publications
Table 2: Statutory Allocations & Internally Generated Revenues as percent of Total Expenditure
Year TE (# billion) SA as % of TE IGR as % of TE
1999 167.9 61.8 20.3
2000 359.7 69.9 10.5
2001 597.0 67.7 10.0
2002 724.5 53.6 12.4
2003 921.2 58.1 12.9
2004 1125.1 69.1 11.9
2005 1243.2 74.1 9.9
2006 1586.8 64.0 7.9
2007 2116.1 52.4 14.4
2008 3021.6 56.1 14.6
2009 2776.9 35.1 16.6
2010 3266.2 41.4 23.2
2011 3542.0 52.4 14.4
2012 3844.9 48.3 14.3
2013 4156.3 50.1 15.0
Source: Authors‘ compilations, 2015
The implication of the foregoing is that without statutory allocations and external loans State governments in Nigeria
cannot finance their operations. This is regrettably so even when most States in Nigeria are endowed with enormous
natural resources (Agricultural, minerals, etc) which if well tapped could significantly reduce their prevailing over-
dependence on federal allocations and external loans.
Of particular concern is the current down-turn in the global oil market. From late 2014 to early part of this year (2015)
official reports indicate that the price of oil had fallen below $70 per barrel as against the previous price of over $100.
This is expected to have far-reaching implications on federal and hence, state governments‘ revenue profiles as
evidenced from a recent media report indicating that the fall in oil prices has reduced government revenue by 25%.
Table 3: States Internally Generated Revenue & Statutory Allocations as percent of Total Revenue
Year TR (# billion) IGR as % of TR SA as % of TR
1999 169.0 20.2 61.4
2000 359.1 10.5 70.1
2001 573.5 10.4 70.5
2002 669.8 13.4 58.0
2003 855.0 13.9 62.6
2004 1113.9 12.0 69.8
2005 1419.6 8.6 64.9
2006 1543.8 8.1 65.8
2007 2065.4 14.8 53.7
2008 2934.8 15.0 57.7
2009 2590.7 17.8 37.6
2010 3162.5 23.9 43.3
2011 3410.1 14.9 52.4
2012 3572.5 15.3 52.0
2013 3948.6 15.8 52.7
Source: Authors‘ compilations, 2015
ISSN 2349-7831
International Journal of Recent Research in Social Sciences and Humanities (IJRRSSH)
Vol. 2, Issue 3, pp: (131-145), Month: July 2015 - September 2015, Available at: www.paperpublications.org
Page | 134
Paper Publications
The situation thus, raises concern over the long-run sustainability of sufficient statutory allocations to the lower tiers of
government in Nigeria. This suggests a need for a determination of the desirable levels of internally generated revenue
and statutory allocations necessary for effective and sustainable financing of State Governments‘ fiscal operations, with a
view to providing answers to the following questions:
-What is the effect of internally-generated revenue on total expenditures of State Governments in Nigeria?
-What is the contribution of statutory allocations to total expenditures of State governments in Nigeria?
-To what extent does internally-generated revenue contribute to the total revenues of State governments in Nigeria?
-What is the effect of statutory allocations on the total revenue of State governments in Nigeria?
3. OBJECTIVES OF THE STUDY
This study seeks to evaluate the viability of Nigeria State governments independent of statutory allocations from the
federation accounts. In particular, we evaluate the causal relationships between States Internally-Generated Revenue and
Statutory Allocations on the one hand, and States Total Expenditures and Total Revenues, on the other hand for the period
1999 to2013. The period 1999-2013 was selected as the period of investigation so as to cover the period during which
Nigeria had the longest period of democratic governance. The beginning of the investigation period of 1999 was preferred
as that was the year the present Constitution of Nigeria, in which the current revenue allocation formula is enshrined came
into effect while the end of the investigation year of 2013 was the year up to which data were fully available. Specifically,
we seek to:
- determine the effect of Internally – Generated Revenue on Total Expenditures of State governments in Nigeria;
- evaluate the contribution of Statutory Allocations to the Total Expenditures of State governments in Nigeria;
- Determine to what extent Internally-generated Revenue contributes to the Total Revenue of State governments in
Nigeria.
- Evaluate the effect of Statutory Allocations on Total Revenue of State governments in Nigeria.
4. HYPOTHESES
Based on the foregoing specified objectives the following null hypotheses are tested:
1 Ho: Internally- generated Revenue has no significant effect on Total Expenditures of State Governments in Nigeria.
2. Ho: Statutory allocations have no significant effect on total expenditures of State governments in Nigeria.
3. Ho: Internally generated revenue has no significant effect on total revenue of State governments in Nigeria.
4. Ho: Statutory allocations have no significant effect on total revenue of State governments in Nigeria.
5. LITERATURE REVIEW
Conceptual Framework:
Section 162(10) of the Nigerian Constitution of 1999 defines revenue as:
―any income or return accruing to or derived by the Government – (federal, States and Local Governments from any
source and includes – any receipt however described, arising from the operation of any law, any return, however
described, arising from or in respect of any property held by the Government of the federation; and any return by way of
interest on loans and dividends in respect of shares or interest held by the government of the federation in any company
or statutory body”.
The section further requires the Federal Government to maintain a
‗special account‘ to be known as ―The Federation Account‖ into which ―all revenues collected by the Government of the
federation except the proceeds from the personal income tax of the personnel of the armed forces of the federation, the
ISSN 2349-7831
International Journal of Recent Research in Social Sciences and Humanities (IJRRSSH)
Vol. 2, Issue 3, pp: (131-145), Month: July 2015 - September 2015, Available at: www.paperpublications.org
Page | 135
Paper Publications
Nigerian Police Force, the Ministry or department of government charged with responsibility for Foreign Affairs and the
residents of the Federal Capital Territory, Abuja shall be paid..”
These legal provisions seem to have provided legal backing for the rather injurious over-dependence of lower levels of
government on statutory allocations to the detriment of other sources of revenue available in their areas of jurisdiction.
Oseni (2013) reports that prior to the local government reforms of 1978, the generation of internal sources of revenue
were at their maximum and that local governments (and states) responsibilities were effectively carried out with or
without help from the central authority. However, when the 1978 reforms were introduced internal revenue generation as
a major means of financing local (and state) governments was abandoned in preference to the revenue from the federal
statutory allocations. This, according to Atakpa, Ocheni and Nwankwo (2012), was principally identified as the bane of
internal revenue generation at local (and States) levels of government. They concluded that self-reliance cannot be
actualized by States and Local Governments unless efforts are intensified to fully tap their internal sources of revenue.
Ekpo (2003) sees fiscal federalism as a system of resolving the relations arising from the political decentralization of the
public sector functions and responsibilities. He sums up the concept of federalism thus:
―The term deals with the allocation of resources among the three tiers and units of government, and institutions for the
discharge of responsibilities assigned to each jurisdictional authority. The nature and well fashioned fiscal relations in
any federal system are crucial to the continual existence of such systems. One of the cardinal principles of federalism is
that no level of government is subordinate to one another, though there must be a central government for this
arrangement”.
Empirical Review:
Aigbepue and Ainabor (2011) carried out a study on the issues and challenges of Nigeria fiscal federalism. Adopting
content analysis as their research method, they described federalism as ―the internalization of the administrative system
designed to cope with size, difference and peculiarities of the regions or state and/or ethnic groups‖. They argue that as a
federating state, Nigeria operates a revenue allocation system which takes care of all component parts of the federation.
Itemizing the objectives of fiscal relationship in a federation as ranging from ensuring correspondence between sub –
national expenditure responsibilities to ensuring consistency with nationally agreed income distribution goals, they argued
that a stable federation‘ can only be realized in an environment of equity, fairness and justice. That is, the evolution of an
equitable revenue formula that would be in the best interest of a stable Nigerian federation.
Oseni (2013) studied the contribution of internally generated revenue to state development in Nigeria. Adopting the
descriptive techniques of analysis he determine the summary statistics and trends of secondary data relating to state
government finances for the years 2007 to 2011. It was found, among others that during the period covered by the study,
internally generated revenue of states represented less than 14% of their entire revenue with Lagos State posting the
highest ratio of IGR to total revenue of over thirty six percent. This was attributed to the engagement of tax consultants by
that State government in its revenue collection.
It was further reported that states having the 13% derivation from petroleum production, with the exception of Rivers and
Edo, have low internally generated revenue in relation to overall revenue. This buttresses the general notion that without
statutory allocations several states cannot discharge their statutory responsibilities. However, whether it is sound
economic reasoning for states to perpetually depend on federal allocations for financing their fiscal operations is a subject
for empirical evaluation.
Agba, Ocheni and Okechukwu (2014) studied the challenges of financing Local Governments in Nigeria in a democratic
setting with a view to suggesting action plans for improvement. Using descriptive research method, the authors critically
reviewed various avenues for generating funds by local governments in Nigeria. They further explored the factors that
affect the viability of local government councils in the context of fiscal federalism as provided for in the 1999 constitution
of the Federal Republic of Nigeria.
The study found, among other things, that the major factors affecting local government finance in Nigeria include uneven
distribution of resources, lack of fiscal freedom, excessive reliance on federal allocations , creation of local councils that
are not viable as well as, ―dishonestly and corruption‖. The paper therefore, recommended that local governments should
ISSN 2349-7831
International Journal of Recent Research in Social Sciences and Humanities (IJRRSSH)
Vol. 2, Issue 3, pp: (131-145), Month: July 2015 - September 2015, Available at: www.paperpublications.org
Page | 136
Paper Publications
intensify efforts in developing avenues for generating funds so as to reduce over dependence on statutory allocations.
An examination of the relationship between government revenue and government expenditure in Nigeria – co integration
and causality approach, was a study carried out by Obioma and Ozughalu (2010). Using empirical data from 1970- 2007,
the study examined the interaction between government revenue and government expenditure in Nigeria. It employed the
‗Engel-Granger two- step co integration‘ techniques, the ‗Johnansen co integration’ method and the ‗Granger causality
test‘ within the ‗Error Correction Modeling (ECM)’ framework. Empirical findings from the study indicate, among other
things, that there is a long-run relationship between government revenue and government expenditure in Nigeria. The
findings thus, affirm the ‗revenue – spend hypothesis’ for Nigeria, implying that expenditures of government are
significantly affected by fluctuations in revenue fluctuations.
Theoretical Framework:
This study is anchored on the Dependency Theory developed in the late 1950s under the guidance of the Director of the
United Nations Economic commission for Latin America, Paul Prebisch (Ferraro, 1996). Prebisch‘s study suggests that
economic activity in the richer counties often lead to serious economic problems in the poorer countries. The poverty of
poor nations is often a by-product of over-reliance on the resources of richer nations
This situation can be likened to the prevailing fiscal federalism in Nigeria whereby States and Local governments depend
largely on the Federal government for revenue allocation for the financing of their fiscal operations. The allocation of the
taxing powers of the three tiers of government in Nigeria (Federal, States and Local governments) in which the central
government control most of the lucrative revenue sources, both in terms of the power to legislate and to administer and
collect (Odusola 2006, cilted in Chukwu , 2011) is in tandem with this theory. In Nigeria, the major tax which the states
share jurisdiction with the federal government is the personal income tax, though its legislation rests with the federal
government. While the federal government collects the personal income tax of the personnel of the armed forces, the
states collect those of other residents in their respective territories. This imbalance in revenue powers of different levels of
government leaves the lower levels of government perpetually dependent on the higher level of government for the
financing of their operations.
Oseni (2013) reports that before the 1976 Local Government reforms IGR generation were at there maximum levels. The
federal government provides little or no assistance to other tiers of government which were effectively discharging their
responsibilities. However, following the advent of statutory allocations the exploitation of internal revenue sources to
finance other tiers of government was severely neglected in preference to the revenue from the federation account. Thus
Atakpa, Ocheni and Nwakwo (2012) concluded that that was the genesis of the persistent dwindling fortunes of revenue
generation at the lower levels of government in Nigeria. It is their opinion that for States and Local governments to be
self-reliant they must look inwards to fully tap their internal sources of revenue. Local government councils partially gave
up most of their traditional revenue sources following the 1981 Revenue Act. Two factors were majorly responsible for
the partial neglect of internal sources of revenue by some local councils- the advent of the oil boom and a statement
credited to a one time Head of State of Nigeria to the effect that the major hindrance to the growth of the Nigerian
economy was ―executive capacity‖ rather than ―finance‖. Prior to that time internally –generated revenue constituted as
much as eighty five percent of total revenue of some local governments. Nevertheless, the need to raise internal revenue
from its dismal level became necessary following the decline in the oil revenue.
Currently there is nearly hundred percent reliance by states in Nigeria on statutory allocations to discharge basic
responsibilities. Without monthly statutory allocations from the federation account no basic operations can be performed.
With this monthly stipends assured, lower levels of government pay minimal attention towards growing their internal
resources which could have helped them to be independent.
Abiola and Asiweh (2012) also highlighted the contribution of Lagos State to government revenue generation in Nigeria.
They stated that Lagos State is among a few states in Nigeria that have left a land mark in terms of independence and use
internally generated revenue. Syndelle (2009) observed that in 2007, Lagos state achieved a gross domestic product of
N3.68 trillion, an equivalent of $29.028 billion making it the biggest contributor to the federation‘s gross domestic
product.
ISSN 2349-7831
International Journal of Recent Research in Social Sciences and Humanities (IJRRSSH)
Vol. 2, Issue 3, pp: (131-145), Month: July 2015 - September 2015, Available at: www.paperpublications.org
Page | 137
Paper Publications
6. RESEARCH DESIGN AND MODEL SPECIFICATION
This study adopts the ex-post facto research design, using time series data covering a period of fifteen years (1999-2013)
on Nigeria State governments‘ finances. The broad objective is to evaluate the respective contributions of States internally
– generated revenue and statutory allocations to total expenditures and total revenues during the study period. This is with
a view to determining the level of fiscal dependency of State governments in Nigeria on Federal Government allocations.
First, we ran a regression analysis of the relationship between States internally – generated revenues and their total
expenditures for the study period with a view to testing hypothesis one. Hypothesis two was tested by running the
regression of the relationship between states statutory allocations and their total expenditures.
We further established the contributions of internally- generally revenue to total revenue of State governments by
regressing the former (internally-generated revenue) against the later(total revenue) to satisfy research objective three;
while the fourth objective of the study was satisfied by regressing total States statutory allocations against total revenue of
States.
Thus, the relationships between the dependent variables (State governments‘ real expenditures and their real total
revenues) and the explanatory variables (States real internally – generated revenues and their real statutory allocations)
were determined by analyzing the following basic equations, using the Granger causality test (Obioma et al, 2010):
RSGTEt = f(αo + αi + RSIGRt + μ1) (i)
RSGTEt = f(αo + αi + RSSAt + μ2) (ii)
RSGTRt = f(αo + αi + RSIGRt + μ1) (iii)
RSGTRt = f(αo + αi + RSSAt + μ2) (iv) where:
RSGTE = Real State Governments expenditures
RSIGR = Real States internally- generally revenue
RSSA = Real States Statutory allocations and
RSGTR = Real State governments total revenue
αo, αi, are parameters to be estimated
u1 and u2 are stochastic error terms.
Data on the variables (i.e. RSGE, RSIGR, RSSA and RSGTR) were collected from the Central Bank of Nigeria Annual
Reports (1999 – 2013).
7. ANALYTICAL TECHNIQUES
The relationships amongst internally – generated revenue, statutory allocations, expenditures and total revenues of state
governments in Nigeria constitute the basis of empirical analysis. The hypotheses were tested using regression analysis
and the F- values were obtained at the 95% level of significance to assess the linearity assumptions. The adjusted
coefficients of determination (R2
) were used to determine whether the explanatory variables, i.e. internally generated
revenues and statutory allocations) adequately explain the behavior patterns of the dependent variables (i.e. State
governments expenditures and total revenues).
The results of the statistical analysis were used to test the hypotheses. For each hypothesis, decision (rejection or
acceptance of the null) is based on the coefficient of each parameter and the F- test values.
8. ANALYSIS OF DESCRIPTIVE RESULTS
Table 4 below is the summary of the descriptive statistics of the means and standard deviations as derived from the
empirical data reported in tables 5-9 (regression outputs of the dependent and the independent variables).It can be
observed from this table that the dependent variables, real total expenditure (RTE) and the independent variables (RTE)
had the highest overall means of #1892. 52bn and #1963.29bn respectively.
ISSN 2349-7831
International Journal of Recent Research in Social Sciences and Humanities (IJRRSSH)
Vol. 2, Issue 3, pp: (131-145), Month: July 2015 - September 2015, Available at: www.paperpublications.org
Page | 138
Paper Publications
Table 4: Summary of descriptive statistics
Variable Mean S.D N
RTE 1963.29 1362.51 15
RTR 1892.55 1286.03 15
RIGR 291.30 243.34 15
RSA 1016.91 627.02 15
Source: Summary of descriptive statistics
Key: RTR = Real total revenue of state governments in Nigeria
RITR = Real internally – generated revenue of state governments in Nigeria
RTE= Real total expenditure of state governments in Nigeria
RSA = Real statutory allocations of state governments in Nigeria
The difference between means of real total expenditure (RTE) and real total revenue (RTR) of #70.74bn (#1963.29 -
#1892.55) indicates the average level of deficit financing of State governments‘ operations during the fifteen – year study
period.
In the same vein, the explanatory variables, real internally-generated revenue (RIGR) and real statutory allocations (RSA)
had relatively lower average yields of #291.30bn and #1016.91bn respectively. Worthy of special note is also, the
significant difference between the means of statutory allocations (RSA) and internally – generated revenue (RIGR).
Average statutory allocations exceed average internally – generated revenue by a whopping #725.6bn (#1016.91-#291.30)
during the study period. In other words, statutory allocations account for nearly 54% of total revenue of state
governments, while the balance of 46% is accounted for by internally – generated revenue and state government‘s
borrowings. The low average yield of internally – generated revenue as compared to statutory allocation is an indication
of the alarming level of over dependence of State governments in Nigeria on statutory allocations over the years.
9. REGRESSION RESULTS
The statistical indexes of the relationship between the dependent and independent variables are summarized in table5
below. The indexes were derived from the actual regression results as detailed in tables 5 to 9.
Table 5: Summary of Regression Result
Equation Const. Regr coef R2
Adjsd R2
Std Erro Sig.
1 RIGR vs RTE 418.867 5.302 0.896 2.888 0.499 0.0000
2 RSA vs RTR - 165.32 2. 093 0.928 0.922 0.162 0.0000
3 RIGR vs RTR 437.632 4.994 0.893 0.884 0.479 0.0000
4 RSA vs RTR -129. 635 1.989 0.893 0.935 0.139 0.0000
Source: Authors Compilations from regressed data
Table 5 shows the regression result of the relationship between the dependent variables (real total expenditure and real
total revenue of State governments) and the independent variables (real internally generated revenue and real statutory
allocations of State governments) for the fifteen – year period (1999- 2013). Each of the four equations represents each of
the four specific objectives set out for this study. The regression results show that the estimated coefficients of the
regression parameters have positive signs, thus confirming our a-priori expectation. The implication of these signs is that
the dependent variables are positively influenced by the independent (explanatory) variables.
ISSN 2349-7831
International Journal of Recent Research in Social Sciences and Humanities (IJRRSSH)
Vol. 2, Issue 3, pp: (131-145), Month: July 2015 - September 2015, Available at: www.paperpublications.org
Page | 139
Paper Publications
From equations 1 (row 1) the coefficient of determination R2
of 0.896 implies that 89.6% of the sample variation in the
dependent variable, total expenditure, is explained or caused by the explanatory variable, internally – generated revenue,
while 10. 4% is unexplained. This means that 10. 4% could be caused by other factors or variables not built into the
model.
In the same vein, the R2
value of 0.893 for equation two implies that 89.3% of the sample variation in total revenue is
explained by internally – generated revenue while 10.7% is unexplained and may have been caused by factors not
included in the regression model.
For equations three and four the coefficients of determinations, R – square values are 0.928 and 0.940 respectively and are
higher than those for equations one and two respectively. This implies that statutory allocations (SA) contribute more to
total State government expenditures (TE) and total revenues (TR) than internally – garneted revenues (IGR).
This is further buttressed by the trends in the movements of the dependent and independent variables as depicted in the
tables, graphs and bar-charts (see appendices).
10. TESTS OF HYPOTHESES
Tables 6-9 provide details of the regression outputs for the tests of hypotheses 1-4. In all four cases the null hypotheses
were rejected leading to the conclusion that the dependent variables and the explanatory variables are positively
correlated. However, the low ratio of internally-generated revenue to total expenditures and total revenues of Nigeria State
government is indicative of the fact that the potentials of their internal revenue sources are not fully exploited. This trend
needs to be reversed.
Table 6: Regression Output of IGR on TE
Dependent Variable: TE
Method: Least Squares
Date: 03/16/15 Time: 06:07
Sample: 1999 2013
Included observations: 15
Variable Coefficient Std. Error t-Statistic Prob.
C 418.8671 186.9411 2.240637 0.0431
IGR 5.301841 0.499405 10.61631 0.0000
R-squared 0.896584 Mean dependent var 1963.293
Adjusted R-squared 0.888629 S.D. dependent var 1362.509
S.E. of regression 454.7005 Akaike info criterion 15.20072
Sum squared resid 2687783. Schwarz criterion 15.29513
Log likelihood -112.0054 Hannan-Quinn criter. 15.19972
F-statistic 112.7061 Durbin-Watson stat 1.591703
Prob(F-statistic) 0.000000
Source: Statistical analysis of empirical data using e-view 3.0
ISSN 2349-7831
International Journal of Recent Research in Social Sciences and Humanities (IJRRSSH)
Vol. 2, Issue 3, pp: (131-145), Month: July 2015 - September 2015, Available at: www.paperpublications.org
Page | 140
Paper Publications
Table 7: Regression Output of SA on TE
Dependent Variable: TE
Method: Least Squares
Date: 03/16/15 Time: 06:17
Sample: 1999 2013
Included observations: 15
Variable Coefficient Std. Error t-Statistic Prob.
C -165.3195 191.5271 -0.863166 0.4037
SA 2.093223 0.161810 12.93631 0.0000
R-squared 0.927917 Mean dependent var 1963.293
Adjusted R-squared 0.922372 S.D. dependent var 1362.509
S.E. of regression 379.6188 Akaike info criterion 14.83978
Sum squared resid 1873435. Schwarz criterion 14.93418
Log likelihood -109.2983 Hannan-Quinn criter. 14.83877
F-statistic 167.3481 Durbin-Watson stat 1.362331
Prob(F-statistic) 0.000000
Source: Statistical analysis of empirical data using e-view 3.0
Table 8: Regression Output of IGR on TR
Dependent Variable: TR
Method: Least Squares
Date: 03/16/15 Time: 06:05
Sample: 1999 2013
Included observations: 15
Variable Coefficient Std. Error t-Statistic Prob.
C 437.6323 179.3699 2.439832 0.0298
IGR 4.994580 0.479179 10.42320 0.0000
R-squared 0.893130 Mean dependent var 1892.553
Adjusted R-squared 0.884909 S.D. dependent var 1286.027
S.E. of regression 436.2847 Akaike info criterion 15.11803
Sum squared resid 2474477. Schwarz criterion 15.21244
Log likelihood -111.3852 Hannan-Quinn criter. 15.11703
F-statistic 108.6432 Durbin-Watson stat 1.474717
Prob(F-statistic) 0.000000
Source: Statistical analysis of empirical data using e-view 3.0
ISSN 2349-7831
International Journal of Recent Research in Social Sciences and Humanities (IJRRSSH)
Vol. 2, Issue 3, pp: (131-145), Month: July 2015 - September 2015, Available at: www.paperpublications.org
Page | 141
Paper Publications
Table 9: Regression Output of SA on TR
Dependent Variable: TR
Method: Least Squares
Date: 03/16/15 Time: 06:15
Sample: 1999 2013
Included observations: 15
Variable Coefficient Std. Error t-Statistic Prob.
C -129.6350 164.8994 -0.786146 0.4459
SA 1.988568 0.139314 14.27402 0.0000
R-squared 0.940022 Mean dependent var 1892.553
Adjusted R-squared 0.935409 S.D. dependent var 1286.027
S.E. of regression 326.8412 Akaike info criterion 14.54039
Sum squared resid 1388727. Schwarz criterion 14.63480
Log likelihood -107.0529 Hannan-Quinn criter. 14.53939
F-statistic 203.7476 Durbin-Watson stat 1.366875
Prob(F-statistic) 0.000000
Source: Statistical analysis of empirical data using e-view 3.0
11. DISCUSSION OF RESULTS
Analysis of the descriptive statistics of State governments finances show that average internally-generated revenue were
consistently low in comparison to the levels of total revenue and total expenditures of state governments during the study
period (1999- 2013). This is attributable to lack of commitment on the part of government revenue agencies to tap fully
the potentials of various revenue sources available to State governments in Nigeria. Contrastingly, the mean contributions
of statutory allocations to total government expenditures and total revenues are quite high. The reason for this is not far-
fetched – Nigeria is a major oil producer and revenue there-from is always in steady supply for distribution to the various
tiers of government. However, with the current significant fall in oil prices in the world market (below $50 per barrel in
February, 2015) it will not augur well for State governments to continue to fold their hands waiting for statutory
allocations.
The results of our empirical analysis further show that both of the explanatory variables (internally – generated revenue
and statutory allocations) have significant relationships with each of the two dependent variables (total expenditures and
total revenues of State governments). This finding is in agreement with Obioma et al (2010) who reported a long- run
relationship between government revenue and government expenditure in Nigeria.
Our analysis further show that statutory allocations constitute the major components of State government expenditures
and total revenue (averaging over 60 percent ) during the study period. However, it has been shown in pervious studies
that over dependence on oil revenue has far – reaching consequences – it may lead to the ―Dutch disease syndrome
(Herberger, 1983, cited in Chukwu, 2011). The studies explain how the convenience of wealth effect influences
governments expenditures and non- oil revenue efforts.
With respect to government expenditures, given the high level of confidence that steady inflow of oil revenue is a
certainty, government tend to increase expenditures beyond acceptable levels thereby inducing inflation.
The minimal contributions of internally – generated revenue to government expenditure and total revenue as revealed in
the descriptive statistics, is attributable to the low yields of our tax system. The reason, according to Osoro (1991), cited in
Chukwu (2011) is that most of Nigerian tax reforms focus on forms of taxes instead of administrative efficiency that
would result to improved income from prevailing sources of tax. Other reasons include administrative inefficiency, faulty
ISSN 2349-7831
International Journal of Recent Research in Social Sciences and Humanities (IJRRSSH)
Vol. 2, Issue 3, pp: (131-145), Month: July 2015 - September 2015, Available at: www.paperpublications.org
Page | 142
Paper Publications
collection system, legislative complexity as well as apathy on the part of those outside the tax net (self – employed
persons).
The concern over the meager contribution of non- oil revenue to the finances of State governments, as revealed in this
study supports Aghevli and Sassanpour (1982) and Veez – Zedeh (1989) who observed that the level of non- oil revenue
is a function of the magnitude of the economic effect of the oil wealth. In specific terms they noted that a nation‘s
perception of the level of its oil wealth determines to what extent effort is exerted towards tapping resources from the non
oil sector. A nation is likely to shift more resources from the oil sector to the non oil sector, through tax increases, the
more the government perceives the oil wealth to be permanent, and vice-versa.
Our finding that high expectation of huge statutory allocations from the central government is a disincentive to internal
revenue generation is further supported by Oseni (2013) who reports that there is a general erroneous notion that without
federal allocations States cannot discharge their civic obligations to the people. However, it should be noted that within
the territorial boundaries of each state a lot of revenue potentials abound which are left untapped. For instance, Lagos
state generates huge amount of internal revenue annually even though it does not receive extra allocations from oil
revenue – quite a good lesson to other states!
The foregoing has the following policy implications: State governments should channel more efforts toward boasting
internal revenue generation as a cushion against swings in oil revenue, and hence the federation account. In particular,
there is the need to revamp the agricultural sector so as to boast food production for local consumption and export.; the tax
administration machinery at the states level should be improved so as to improve the yield of the states tax system
through proper maintenance of registers of taxpayers which should be kept current, free distribution of tax return forms to
all areas, taking into account the geographical distribution of taxpayers and regular field audits at the taxpayers‘ places of
business during which intensive checks of the taxpayer‘s records and business are conducted by trained personnel. The
Internal Revenue Board should make it as a permanent part of its culture, regular town hall meetings with taxpayers and
staff of the Board to educate the former on the need for and benefits of tax compliance.
REFERENCES
[1] Afuberoh D. and Okoye E. (2014), The Impact of Taxation on Revenue Generation in Nigeria: A Study of Federal
Capital Territory and Selected States. International Journal of Public Administration and Management
Research,2(2),31-44.
[2] Agba, M. S; Ocheni S and Nnamani, D. O. (2014). Local Government Finance in Nigeria: Challenges and Prognosis
for action in a Democratic Era (1999-2013), Journal of Good Governance and Sustainable Development in Africa, 2
(1), 84- 96
[3] Agu, C. (2011) Fragile States! Why Sub-national Governments in Nigeria Cannot Subsist on Internally Generated
Revenue? The IUP Journal of Public Finance, 9(1), 25-53.
[4] Aigbepue S. and Ainabor A.E. (2011), Issues and Challenges of Nigerian Fiscal Federalism; Interdisciplinary
Journal of Research in Business, 1 (10), 26-31.
[5] Ariyo, A. (1997). Productivity of the Nigerian Tax System: 1970-1990. AERC Research Paper 67. Nairobi: African
Economic Research Consortium.
[6] Atakpa, M., Ocheni, S., and Nwakwo, B. C. (2012) Analysis of options for Maximizing Local Government
internally generated Revenue in Nigeria, International Journal of Learning & Development; 2 (5)
[7] Blinder, A.S. and Solow, R.M. (1973). Does Fiscal Policy Matter?. Journal of Public Economics, vol. 2: 319–37.
[8] Chang, T. (2009), „Revisiting the Government Revenue-Expenditure Nexus:Evidence from 15 OECD Countries
based on the Panel Data Approach‟.Czech Journal of Economics and Finance, 59(2), 165-172.
[9] Chang, T. and Ho, Y.H. (2002), „A Note on Testing Tax-and-Spend, Spend-and- Tax or Fiscal Synchronization: The
Case of China‟. Journal of EconomicDevelopment, 27(1), 151-160.
[10] Chukwu, U.C. (2011), Implications of Macro-Economic Regimes on the Productivity of the Nigerian Tax System:
A case for Sustainable Fiscal Deficit Financing in Nigeria. Unpublished PhD Thesis presented to the Department of
Accountancy Ebonyi State University, Abakaliki.
ISSN 2349-7831
International Journal of Recent Research in Social Sciences and Humanities (IJRRSSH)
Vol. 2, Issue 3, pp: (131-145), Month: July 2015 - September 2015, Available at: www.paperpublications.org
Page | 143
Paper Publications
[11] Chukwu, U.C. (2011), (Strategies for Effective Tax Administration in South East Nigeria, Journal of Accounting and
Contemporary Studies, 1(1), 21-34.
[12] Dang, D.Y. (2013). Revenue Allocation and Economic Development in Nigeria: An Empirical Study. http://sgo.
sagepub.com/content/3/3/2158244013505602. Retrieved on 6/12/13.
[13] Egwaikhide, F. O.(2004). ―Intergovernmental Fiscal Relations in Nigeria‖.In Egwaikhide, F. O.(eds.).
Intergovernmental Relations in Nigeria, Ibadan: Programme on Ethnic and Federal Studies,1-23
[14] Ekpo, A. (2003): Fiscal federalism: Nigeria Post-Independence experience 1960-90, World Development Vol. 22,
(8), 65-71
[15] Ekpo, A. (2004, August 10-12). Intergovernmental Fiscal relations: The Nigerian Experience. Paper presented at the
10th Year Anniversary of the Financial and Fiscal Commission of South Africa, Cape Town, South Africa.
[16] Federal Republic of Nigeria (1999): ―Constitution‖ Abuja: Federal Government press.
[17] Fashola, B. R. (2013) Lagos Mega Revenue (IGR) Now N23billion Monthly, Retrieved from www.osundefender.org
on March, 2015.
[18] Jimoh, A. (2003, October 7-9). Fiscal federalism: The Nigerian experience. Paper presented at the Ad-Hoc Expert
Group Meeting—Economic Commission for Africa, UNCC, Addis Ababa, Ethiopia.
[19] Khalil, S and Adelabu, S. A.(2011) Fiscal planning and local government administration in Nigeria: The quest for
sustainable rural development, African Journal of Business Management. 6(9). 3482-3489,
[20] Naiyeji, K. (2011) Tax consultants drain government‘s purse, 2011 Revenue Mobilisation,Allocation and Fiscal
Commission (RMAFC) Members‘ Retreat in Uyo, Akwa Ibom State.
[21] Obioma, E.C. and Ozughalu U.M.(2010), An Examination of the Relationship between Government Revenue and
Government Expenditure in Nigeria: Cointegration and Causality Approach, CBN Economic and Financial Review,
48 (2), 35-57.
[22] Ojo, C. O., and Owojori, A. A. (1998) Mobilisation of Internally Generated Revenue in some selected Local
Governments in Ondo state Retrieved from http://hdl.handle.net/123456789/2971 December, 2014.
[23] Olowononi, G. D. (1998). Revenue Allocation and Economics of Federalism. In Amuwo, A., Agbaje, A. Suberu, R.
&Herault, G. (eds.). Federalism and Political Restructuring in Nigeria.Ibadan: Spectrum Books Ltd, PP. 247-260
[24] Omoruyi, S.E. (1983). Growth and Flexibility of Federal Government Tax Revenue: 19601979.Economic and
Financial Review, 21(1): 11–19.
[25] Oseni M. (2013), Internally Generated Revenue in Nigeria:A Panacea for Stae Development, European Journal of
Humanities and Social Sciences, 21(1), 1050-1066.
[26] Osoro, N.E. (1991). ―Tax Reform in Tanzania: Motivations, Directions and Implications‖. A progress Report
presented to the African Economic Research Consortium. Nairobi, Kenya, 26—30 May.
[27] Rutayasire, L.W. (1990). Issues in Public Expenditure Policy in Africa: Evidence from Tanzanian Experience. Paper
presented at the World Bank Conference on African Economic Issues. Nairobi, Kenya, 4—7 June.
[28] Rutayasire, L.W. (1990). Issues in Public Expenditure Policy in Africa: Evidence from Tanzanian Experience. Paper
presented at the World Bank Conference on African Economic Issues. Nairobi, Kenya, 4—7 June.
[29] Toda, H. Y. and Yamamoto, T. (1995). Statistical Inference in Vector Autoregressions with Possibly Integrated
Processes, Journal of Econometrics, (6)6, 225-250.
[30] Von Furstenberg, G. M., Green, R.J. and Jeong, J.H. (1986). Tax and Spend or Spend and Tax? Review of
Economics and Statistics, 68(2), 179-188.
[31] Wahid, A. N. M. (2008). An Empirical Investigation on the Nexus between Tax Revenue and Government
Spending: The Case of Turkey. International Research Journal of Finance and Economics, 16, 46-51.
ISSN 2349-7831
International Journal of Recent Research in Social Sciences and Humanities (IJRRSSH)
Vol. 2, Issue 3, pp: (131-145), Month: July 2015 - September 2015, Available at: www.paperpublications.org
Page | 144
Paper Publications
APPENDICES
APPENDIX A: GRAPHICAL PRESENTATIONS OF EMPIRICAL DATA
APPENDIX B:: BAR –CHAR
B1: STATES INTERNALLY-GENERATED REVENUE AND TOTAL EXPENDITURE
0
1,000
2,000
3,000
4,000
5,000
99 00 01 02 03 04 05 06 07 08 09 10 11 12 13
TE IGR
ISSN 2349-7831
International Journal of Recent Research in Social Sciences and Humanities (IJRRSSH)
Vol. 2, Issue 3, pp: (131-145), Month: July 2015 - September 2015, Available at: www.paperpublications.org
Page | 145
Paper Publications
B2: STATES STATUTORY ALLOCATIONS AND TOTAL EXPENDITURES
B3: STATES INTERNALLY GENERATED REVENUE AND TOTAL REVENUE
B4: STATES STATUTORY ALLOCATIONS AND TOTAL REVENUE
0
1,000
2,000
3,000
4,000
5,000
99 00 01 02 03 04 05 06 07 08 09 10 11 12 13
TE SA
0
1,000
2,000
3,000
4,000
99 00 01 02 03 04 05 06 07 08 09 10 11 12 13
TR IGR
0
1,000
2,000
3,000
4,000
99 00 01 02 03 04 05 06 07 08 09 10 11 12 13
TR SA

More Related Content

What's hot

Macroeconomic forecast and monetary policy update
Macroeconomic forecast and monetary policy updateMacroeconomic forecast and monetary policy update
Macroeconomic forecast and monetary policy updateRuslan Sivoplyas
 
Afghanistan economic 2012
Afghanistan economic 2012Afghanistan economic 2012
Afghanistan economic 2012Mazloomyar
 
Indonesia Economy and ASEAN Economic Community by rizal djaafara
Indonesia Economy and ASEAN Economic Community by rizal djaafaraIndonesia Economy and ASEAN Economic Community by rizal djaafara
Indonesia Economy and ASEAN Economic Community by rizal djaafaraBudi Rachmat
 
Macroeconomics Performance of Bangladesh since Independence
Macroeconomics Performance of Bangladesh since IndependenceMacroeconomics Performance of Bangladesh since Independence
Macroeconomics Performance of Bangladesh since IndependenceIsrat Jahan
 
Woody Hall Economic Conditions Presentation to NCLGIA (7/25/13)
Woody Hall Economic Conditions Presentation to NCLGIA (7/25/13)Woody Hall Economic Conditions Presentation to NCLGIA (7/25/13)
Woody Hall Economic Conditions Presentation to NCLGIA (7/25/13)PublicFinanceTV
 
Weekly media update 16 03_2020
Weekly media update 16 03_2020Weekly media update 16 03_2020
Weekly media update 16 03_2020BalmerLawrie
 
State of the construction industry (2006 2007)
State of the construction industry (2006 2007)State of the construction industry (2006 2007)
State of the construction industry (2006 2007)Lisa Dehner
 
Market Outlook- 2019
Market Outlook- 2019Market Outlook- 2019
Market Outlook- 2019Shreya Gulati
 
Springhill group home loans briefs
Springhill group home loans  briefsSpringhill group home loans  briefs
Springhill group home loans briefsharleybough
 
Us econ ppt lynchburg 3-4-2011 final_dr.shea
Us econ ppt lynchburg 3-4-2011 final_dr.sheaUs econ ppt lynchburg 3-4-2011 final_dr.shea
Us econ ppt lynchburg 3-4-2011 final_dr.shealynchburg
 
PwC Global Economy Watch (oct. 2013)
PwC Global Economy Watch (oct. 2013)PwC Global Economy Watch (oct. 2013)
PwC Global Economy Watch (oct. 2013)PwC France
 
2016 State of the U.S. Economy
2016 State of the U.S. Economy2016 State of the U.S. Economy
2016 State of the U.S. EconomyLisa Dehner
 

What's hot (19)

Covid-19 and Fiscal Policy
Covid-19 and Fiscal Policy Covid-19 and Fiscal Policy
Covid-19 and Fiscal Policy
 
Macroeconomic forecast and monetary policy update
Macroeconomic forecast and monetary policy updateMacroeconomic forecast and monetary policy update
Macroeconomic forecast and monetary policy update
 
Afghanistan economic 2012
Afghanistan economic 2012Afghanistan economic 2012
Afghanistan economic 2012
 
Indonesia Economy and ASEAN Economic Community by rizal djaafara
Indonesia Economy and ASEAN Economic Community by rizal djaafaraIndonesia Economy and ASEAN Economic Community by rizal djaafara
Indonesia Economy and ASEAN Economic Community by rizal djaafara
 
Macroeconomics Performance of Bangladesh since Independence
Macroeconomics Performance of Bangladesh since IndependenceMacroeconomics Performance of Bangladesh since Independence
Macroeconomics Performance of Bangladesh since Independence
 
Woody Hall Economic Conditions Presentation to NCLGIA (7/25/13)
Woody Hall Economic Conditions Presentation to NCLGIA (7/25/13)Woody Hall Economic Conditions Presentation to NCLGIA (7/25/13)
Woody Hall Economic Conditions Presentation to NCLGIA (7/25/13)
 
Weekly media update 16 03_2020
Weekly media update 16 03_2020Weekly media update 16 03_2020
Weekly media update 16 03_2020
 
Economic survey 21
Economic survey 21Economic survey 21
Economic survey 21
 
Advance G20 release of OECD Economic Outlook
Advance G20 release of OECD Economic OutlookAdvance G20 release of OECD Economic Outlook
Advance G20 release of OECD Economic Outlook
 
State of the construction industry (2006 2007)
State of the construction industry (2006 2007)State of the construction industry (2006 2007)
State of the construction industry (2006 2007)
 
Market Outlook- 2019
Market Outlook- 2019Market Outlook- 2019
Market Outlook- 2019
 
Report march 2020
Report march 2020Report march 2020
Report march 2020
 
Springhill group home loans briefs
Springhill group home loans  briefsSpringhill group home loans  briefs
Springhill group home loans briefs
 
Us econ ppt lynchburg 3-4-2011 final_dr.shea
Us econ ppt lynchburg 3-4-2011 final_dr.sheaUs econ ppt lynchburg 3-4-2011 final_dr.shea
Us econ ppt lynchburg 3-4-2011 final_dr.shea
 
PwC Global Economy Watch (oct. 2013)
PwC Global Economy Watch (oct. 2013)PwC Global Economy Watch (oct. 2013)
PwC Global Economy Watch (oct. 2013)
 
Monthly Briefing on the World Economic Situation and Prospects (WESP), No. 60
Monthly Briefing on the World Economic Situation and Prospects (WESP), No. 60Monthly Briefing on the World Economic Situation and Prospects (WESP), No. 60
Monthly Briefing on the World Economic Situation and Prospects (WESP), No. 60
 
State of the US Economy (2016)
State of the US Economy (2016)State of the US Economy (2016)
State of the US Economy (2016)
 
2016 State of the U.S. Economy
2016 State of the U.S. Economy2016 State of the U.S. Economy
2016 State of the U.S. Economy
 
Emerging Economy June 2009 Indicus Analytics
Emerging Economy June 2009 Indicus AnalyticsEmerging Economy June 2009 Indicus Analytics
Emerging Economy June 2009 Indicus Analytics
 

Viewers also liked

The Contribution of the Community in Supporting Schools in Dealing with Selec...
The Contribution of the Community in Supporting Schools in Dealing with Selec...The Contribution of the Community in Supporting Schools in Dealing with Selec...
The Contribution of the Community in Supporting Schools in Dealing with Selec...paperpublications3
 
pembuatan Ice cream
pembuatan Ice creampembuatan Ice cream
pembuatan Ice creamFMM_16
 
Influence of Teachers’ Working Conditions on Curbing Examination Malpractices...
Influence of Teachers’ Working Conditions on Curbing Examination Malpractices...Influence of Teachers’ Working Conditions on Curbing Examination Malpractices...
Influence of Teachers’ Working Conditions on Curbing Examination Malpractices...paperpublications3
 
St. Chavara: A Harbinger of Human Dignity
St. Chavara: A Harbinger of Human DignitySt. Chavara: A Harbinger of Human Dignity
St. Chavara: A Harbinger of Human Dignitypaperpublications3
 
Fanaticism and Barbarism: Synonyms of Dysfunctionality in Nigeria Today
Fanaticism and Barbarism: Synonyms of Dysfunctionality in Nigeria TodayFanaticism and Barbarism: Synonyms of Dysfunctionality in Nigeria Today
Fanaticism and Barbarism: Synonyms of Dysfunctionality in Nigeria Todaypaperpublications3
 
The Role of Community Education in Reducing Child Sexual Abuse
The Role of Community Education in Reducing Child Sexual AbuseThe Role of Community Education in Reducing Child Sexual Abuse
The Role of Community Education in Reducing Child Sexual Abusepaperpublications3
 
Ferndale Villas
Ferndale Villas Ferndale Villas
Ferndale Villas mj oak
 
Kimia kelompok 2
Kimia kelompok 2Kimia kelompok 2
Kimia kelompok 2FMM_16
 
Hak Asasi Manusia
Hak Asasi ManusiaHak Asasi Manusia
Hak Asasi ManusiaFMM_16
 
Veranda 2
Veranda 2Veranda 2
Veranda 2mj oak
 
Pembuatan Telur asin
Pembuatan Telur asinPembuatan Telur asin
Pembuatan Telur asinFMM_16
 
Relationship between Principals’ Leadership Styles and Teachers’ Indiscipline...
Relationship between Principals’ Leadership Styles and Teachers’ Indiscipline...Relationship between Principals’ Leadership Styles and Teachers’ Indiscipline...
Relationship between Principals’ Leadership Styles and Teachers’ Indiscipline...paperpublications3
 
Hard Times and Victorian Urban Society
Hard Times and Victorian Urban SocietyHard Times and Victorian Urban Society
Hard Times and Victorian Urban Societypaperpublications3
 
Determining Satisfaction of the Workplace Environment of Diplomats and Consul...
Determining Satisfaction of the Workplace Environment of Diplomats and Consul...Determining Satisfaction of the Workplace Environment of Diplomats and Consul...
Determining Satisfaction of the Workplace Environment of Diplomats and Consul...paperpublications3
 
ESTABLISHING CHANNELS OF COMMUNICATION IN RESPECT OF GOVERNMENT POLICIES TO D...
ESTABLISHING CHANNELS OF COMMUNICATION IN RESPECT OF GOVERNMENT POLICIES TO D...ESTABLISHING CHANNELS OF COMMUNICATION IN RESPECT OF GOVERNMENT POLICIES TO D...
ESTABLISHING CHANNELS OF COMMUNICATION IN RESPECT OF GOVERNMENT POLICIES TO D...paperpublications3
 
Near Field Communication by Mohammed Mudassir
Near Field Communication by Mohammed MudassirNear Field Communication by Mohammed Mudassir
Near Field Communication by Mohammed MudassirMohammed Mudassir
 

Viewers also liked (18)

The Contribution of the Community in Supporting Schools in Dealing with Selec...
The Contribution of the Community in Supporting Schools in Dealing with Selec...The Contribution of the Community in Supporting Schools in Dealing with Selec...
The Contribution of the Community in Supporting Schools in Dealing with Selec...
 
pembuatan Ice cream
pembuatan Ice creampembuatan Ice cream
pembuatan Ice cream
 
Influence of Teachers’ Working Conditions on Curbing Examination Malpractices...
Influence of Teachers’ Working Conditions on Curbing Examination Malpractices...Influence of Teachers’ Working Conditions on Curbing Examination Malpractices...
Influence of Teachers’ Working Conditions on Curbing Examination Malpractices...
 
Warna
WarnaWarna
Warna
 
St. Chavara: A Harbinger of Human Dignity
St. Chavara: A Harbinger of Human DignitySt. Chavara: A Harbinger of Human Dignity
St. Chavara: A Harbinger of Human Dignity
 
Fanaticism and Barbarism: Synonyms of Dysfunctionality in Nigeria Today
Fanaticism and Barbarism: Synonyms of Dysfunctionality in Nigeria TodayFanaticism and Barbarism: Synonyms of Dysfunctionality in Nigeria Today
Fanaticism and Barbarism: Synonyms of Dysfunctionality in Nigeria Today
 
The Role of Community Education in Reducing Child Sexual Abuse
The Role of Community Education in Reducing Child Sexual AbuseThe Role of Community Education in Reducing Child Sexual Abuse
The Role of Community Education in Reducing Child Sexual Abuse
 
Ferndale Villas
Ferndale Villas Ferndale Villas
Ferndale Villas
 
Kimia kelompok 2
Kimia kelompok 2Kimia kelompok 2
Kimia kelompok 2
 
Hak Asasi Manusia
Hak Asasi ManusiaHak Asasi Manusia
Hak Asasi Manusia
 
Veranda 2
Veranda 2Veranda 2
Veranda 2
 
Pembuatan Telur asin
Pembuatan Telur asinPembuatan Telur asin
Pembuatan Telur asin
 
Relationship between Principals’ Leadership Styles and Teachers’ Indiscipline...
Relationship between Principals’ Leadership Styles and Teachers’ Indiscipline...Relationship between Principals’ Leadership Styles and Teachers’ Indiscipline...
Relationship between Principals’ Leadership Styles and Teachers’ Indiscipline...
 
HAPTIC TECHNOLOGY
HAPTIC TECHNOLOGYHAPTIC TECHNOLOGY
HAPTIC TECHNOLOGY
 
Hard Times and Victorian Urban Society
Hard Times and Victorian Urban SocietyHard Times and Victorian Urban Society
Hard Times and Victorian Urban Society
 
Determining Satisfaction of the Workplace Environment of Diplomats and Consul...
Determining Satisfaction of the Workplace Environment of Diplomats and Consul...Determining Satisfaction of the Workplace Environment of Diplomats and Consul...
Determining Satisfaction of the Workplace Environment of Diplomats and Consul...
 
ESTABLISHING CHANNELS OF COMMUNICATION IN RESPECT OF GOVERNMENT POLICIES TO D...
ESTABLISHING CHANNELS OF COMMUNICATION IN RESPECT OF GOVERNMENT POLICIES TO D...ESTABLISHING CHANNELS OF COMMUNICATION IN RESPECT OF GOVERNMENT POLICIES TO D...
ESTABLISHING CHANNELS OF COMMUNICATION IN RESPECT OF GOVERNMENT POLICIES TO D...
 
Near Field Communication by Mohammed Mudassir
Near Field Communication by Mohammed MudassirNear Field Communication by Mohammed Mudassir
Near Field Communication by Mohammed Mudassir
 

Similar to Viability of Nigerian States Without Federal Funds

Effectiveness of Aggregate Determinants of Deficit Financing on Capital Forma...
Effectiveness of Aggregate Determinants of Deficit Financing on Capital Forma...Effectiveness of Aggregate Determinants of Deficit Financing on Capital Forma...
Effectiveness of Aggregate Determinants of Deficit Financing on Capital Forma...YogeshIJTSRD
 
Foreign Currency Crisis - EG
Foreign Currency Crisis - EGForeign Currency Crisis - EG
Foreign Currency Crisis - EGsamehanani
 
23 jesd owolabi usman--252-263
23 jesd owolabi usman--252-26323 jesd owolabi usman--252-263
23 jesd owolabi usman--252-263Alexander Decker
 
Government Expenditure and Economic Growth Nexus: Empirical Evidence from Nig...
Government Expenditure and Economic Growth Nexus: Empirical Evidence from Nig...Government Expenditure and Economic Growth Nexus: Empirical Evidence from Nig...
Government Expenditure and Economic Growth Nexus: Empirical Evidence from Nig...iosrjce
 
The Impact of Agricultural and Industrial Sectors on Economic Development in ...
The Impact of Agricultural and Industrial Sectors on Economic Development in ...The Impact of Agricultural and Industrial Sectors on Economic Development in ...
The Impact of Agricultural and Industrial Sectors on Economic Development in ...iosrjce
 
International Journal of Humanities and Social Science Invention (IJHSSI)
International Journal of Humanities and Social Science Invention (IJHSSI)International Journal of Humanities and Social Science Invention (IJHSSI)
International Journal of Humanities and Social Science Invention (IJHSSI)inventionjournals
 
Timor-Leste Country Risk Analysis: A Macroeconomic Risk - Thomas Freitas
Timor-Leste Country Risk Analysis: A Macroeconomic Risk - Thomas FreitasTimor-Leste Country Risk Analysis: A Macroeconomic Risk - Thomas Freitas
Timor-Leste Country Risk Analysis: A Macroeconomic Risk - Thomas FreitasAitarak Laran
 
Financial deregulation bounding to credit mobilization in real sector...
Financial deregulation bounding to credit mobilization in real sector...Financial deregulation bounding to credit mobilization in real sector...
Financial deregulation bounding to credit mobilization in real sector...Donald ofoegbu
 
Financial liberalization and economic growth implications for the conduct of...
Financial liberalization and economic growth  implications for the conduct of...Financial liberalization and economic growth  implications for the conduct of...
Financial liberalization and economic growth implications for the conduct of...Alexander Decker
 
IJSRED-V2I1P13
IJSRED-V2I1P13IJSRED-V2I1P13
IJSRED-V2I1P13IJSRED
 
3 jesd owolabi doc---29-37
3 jesd owolabi doc---29-373 jesd owolabi doc---29-37
3 jesd owolabi doc---29-37Alexander Decker
 
2 adaramola anthony olugbenga 9-19
2 adaramola anthony olugbenga 9-192 adaramola anthony olugbenga 9-19
2 adaramola anthony olugbenga 9-19Alexander Decker
 
Government Capital Expenditure and Manufacturing Sector Output in Nigeria
Government Capital Expenditure and Manufacturing Sector Output in NigeriaGovernment Capital Expenditure and Manufacturing Sector Output in Nigeria
Government Capital Expenditure and Manufacturing Sector Output in Nigeriaijtsrd
 
2011 gdp forecast for nigeria
2011 gdp forecast for nigeria2011 gdp forecast for nigeria
2011 gdp forecast for nigeriaPim Piepers
 
The impact of interest rates on the development of an emerging market empiric...
The impact of interest rates on the development of an emerging market empiric...The impact of interest rates on the development of an emerging market empiric...
The impact of interest rates on the development of an emerging market empiric...Alexander Decker
 
21 amassoma ditimi -219-237
21 amassoma ditimi -219-23721 amassoma ditimi -219-237
21 amassoma ditimi -219-237Alexander Decker
 

Similar to Viability of Nigerian States Without Federal Funds (20)

Effectiveness of Aggregate Determinants of Deficit Financing on Capital Forma...
Effectiveness of Aggregate Determinants of Deficit Financing on Capital Forma...Effectiveness of Aggregate Determinants of Deficit Financing on Capital Forma...
Effectiveness of Aggregate Determinants of Deficit Financing on Capital Forma...
 
Turkey 2018
Turkey 2018Turkey 2018
Turkey 2018
 
Foreign Currency Crisis - EG
Foreign Currency Crisis - EGForeign Currency Crisis - EG
Foreign Currency Crisis - EG
 
23 jesd owolabi usman--252-263
23 jesd owolabi usman--252-26323 jesd owolabi usman--252-263
23 jesd owolabi usman--252-263
 
Government Expenditure and Economic Growth Nexus: Empirical Evidence from Nig...
Government Expenditure and Economic Growth Nexus: Empirical Evidence from Nig...Government Expenditure and Economic Growth Nexus: Empirical Evidence from Nig...
Government Expenditure and Economic Growth Nexus: Empirical Evidence from Nig...
 
The Impact of Agricultural and Industrial Sectors on Economic Development in ...
The Impact of Agricultural and Industrial Sectors on Economic Development in ...The Impact of Agricultural and Industrial Sectors on Economic Development in ...
The Impact of Agricultural and Industrial Sectors on Economic Development in ...
 
International Journal of Humanities and Social Science Invention (IJHSSI)
International Journal of Humanities and Social Science Invention (IJHSSI)International Journal of Humanities and Social Science Invention (IJHSSI)
International Journal of Humanities and Social Science Invention (IJHSSI)
 
Timor-Leste Country Risk Analysis: A Macroeconomic Risk - Thomas Freitas
Timor-Leste Country Risk Analysis: A Macroeconomic Risk - Thomas FreitasTimor-Leste Country Risk Analysis: A Macroeconomic Risk - Thomas Freitas
Timor-Leste Country Risk Analysis: A Macroeconomic Risk - Thomas Freitas
 
Financial deregulation bounding to credit mobilization in real sector...
Financial deregulation bounding to credit mobilization in real sector...Financial deregulation bounding to credit mobilization in real sector...
Financial deregulation bounding to credit mobilization in real sector...
 
Financial liberalization and economic growth implications for the conduct of...
Financial liberalization and economic growth  implications for the conduct of...Financial liberalization and economic growth  implications for the conduct of...
Financial liberalization and economic growth implications for the conduct of...
 
IJSRED-V2I1P13
IJSRED-V2I1P13IJSRED-V2I1P13
IJSRED-V2I1P13
 
3 jesd owolabi doc---29-37
3 jesd owolabi doc---29-373 jesd owolabi doc---29-37
3 jesd owolabi doc---29-37
 
Capital Accumulation and Labour Productivity Growth in Nigeria
Capital Accumulation and Labour Productivity Growth in NigeriaCapital Accumulation and Labour Productivity Growth in Nigeria
Capital Accumulation and Labour Productivity Growth in Nigeria
 
2 adaramola anthony olugbenga 9-19
2 adaramola anthony olugbenga 9-192 adaramola anthony olugbenga 9-19
2 adaramola anthony olugbenga 9-19
 
Japan-2015-revitalising-Japan
Japan-2015-revitalising-JapanJapan-2015-revitalising-Japan
Japan-2015-revitalising-Japan
 
Government Capital Expenditure and Manufacturing Sector Output in Nigeria
Government Capital Expenditure and Manufacturing Sector Output in NigeriaGovernment Capital Expenditure and Manufacturing Sector Output in Nigeria
Government Capital Expenditure and Manufacturing Sector Output in Nigeria
 
2011 gdp forecast for nigeria
2011 gdp forecast for nigeria2011 gdp forecast for nigeria
2011 gdp forecast for nigeria
 
The impact of interest rates on the development of an emerging market empiric...
The impact of interest rates on the development of an emerging market empiric...The impact of interest rates on the development of an emerging market empiric...
The impact of interest rates on the development of an emerging market empiric...
 
21 amassoma ditimi -219-237
21 amassoma ditimi -219-23721 amassoma ditimi -219-237
21 amassoma ditimi -219-237
 
IOC Zimbabwe 19052015
IOC Zimbabwe 19052015IOC Zimbabwe 19052015
IOC Zimbabwe 19052015
 

Recently uploaded

internship ppt on smartinternz platform as salesforce developer
internship ppt on smartinternz platform as salesforce developerinternship ppt on smartinternz platform as salesforce developer
internship ppt on smartinternz platform as salesforce developerunnathinaik
 
Presiding Officer Training module 2024 lok sabha elections
Presiding Officer Training module 2024 lok sabha electionsPresiding Officer Training module 2024 lok sabha elections
Presiding Officer Training module 2024 lok sabha electionsanshu789521
 
CELL CYCLE Division Science 8 quarter IV.pptx
CELL CYCLE Division Science 8 quarter IV.pptxCELL CYCLE Division Science 8 quarter IV.pptx
CELL CYCLE Division Science 8 quarter IV.pptxJiesonDelaCerna
 
Introduction to ArtificiaI Intelligence in Higher Education
Introduction to ArtificiaI Intelligence in Higher EducationIntroduction to ArtificiaI Intelligence in Higher Education
Introduction to ArtificiaI Intelligence in Higher Educationpboyjonauth
 
Crayon Activity Handout For the Crayon A
Crayon Activity Handout For the Crayon ACrayon Activity Handout For the Crayon A
Crayon Activity Handout For the Crayon AUnboundStockton
 
Meghan Sutherland In Media Res Media Component
Meghan Sutherland In Media Res Media ComponentMeghan Sutherland In Media Res Media Component
Meghan Sutherland In Media Res Media ComponentInMediaRes1
 
Full Stack Web Development Course for Beginners
Full Stack Web Development Course  for BeginnersFull Stack Web Development Course  for Beginners
Full Stack Web Development Course for BeginnersSabitha Banu
 
Incoming and Outgoing Shipments in 1 STEP Using Odoo 17
Incoming and Outgoing Shipments in 1 STEP Using Odoo 17Incoming and Outgoing Shipments in 1 STEP Using Odoo 17
Incoming and Outgoing Shipments in 1 STEP Using Odoo 17Celine George
 
Capitol Tech U Doctoral Presentation - April 2024.pptx
Capitol Tech U Doctoral Presentation - April 2024.pptxCapitol Tech U Doctoral Presentation - April 2024.pptx
Capitol Tech U Doctoral Presentation - April 2024.pptxCapitolTechU
 
Roles & Responsibilities in Pharmacovigilance
Roles & Responsibilities in PharmacovigilanceRoles & Responsibilities in Pharmacovigilance
Roles & Responsibilities in PharmacovigilanceSamikshaHamane
 
Solving Puzzles Benefits Everyone (English).pptx
Solving Puzzles Benefits Everyone (English).pptxSolving Puzzles Benefits Everyone (English).pptx
Solving Puzzles Benefits Everyone (English).pptxOH TEIK BIN
 
“Oh GOSH! Reflecting on Hackteria's Collaborative Practices in a Global Do-It...
“Oh GOSH! Reflecting on Hackteria's Collaborative Practices in a Global Do-It...“Oh GOSH! Reflecting on Hackteria's Collaborative Practices in a Global Do-It...
“Oh GOSH! Reflecting on Hackteria's Collaborative Practices in a Global Do-It...Marc Dusseiller Dusjagr
 
Earth Day Presentation wow hello nice great
Earth Day Presentation wow hello nice greatEarth Day Presentation wow hello nice great
Earth Day Presentation wow hello nice greatYousafMalik24
 
भारत-रोम व्यापार.pptx, Indo-Roman Trade,
भारत-रोम व्यापार.pptx, Indo-Roman Trade,भारत-रोम व्यापार.pptx, Indo-Roman Trade,
भारत-रोम व्यापार.pptx, Indo-Roman Trade,Virag Sontakke
 
Computed Fields and api Depends in the Odoo 17
Computed Fields and api Depends in the Odoo 17Computed Fields and api Depends in the Odoo 17
Computed Fields and api Depends in the Odoo 17Celine George
 
Framing an Appropriate Research Question 6b9b26d93da94caf993c038d9efcdedb.pdf
Framing an Appropriate Research Question 6b9b26d93da94caf993c038d9efcdedb.pdfFraming an Appropriate Research Question 6b9b26d93da94caf993c038d9efcdedb.pdf
Framing an Appropriate Research Question 6b9b26d93da94caf993c038d9efcdedb.pdfUjwalaBharambe
 
Painted Grey Ware.pptx, PGW Culture of India
Painted Grey Ware.pptx, PGW Culture of IndiaPainted Grey Ware.pptx, PGW Culture of India
Painted Grey Ware.pptx, PGW Culture of IndiaVirag Sontakke
 

Recently uploaded (20)

internship ppt on smartinternz platform as salesforce developer
internship ppt on smartinternz platform as salesforce developerinternship ppt on smartinternz platform as salesforce developer
internship ppt on smartinternz platform as salesforce developer
 
Presiding Officer Training module 2024 lok sabha elections
Presiding Officer Training module 2024 lok sabha electionsPresiding Officer Training module 2024 lok sabha elections
Presiding Officer Training module 2024 lok sabha elections
 
CELL CYCLE Division Science 8 quarter IV.pptx
CELL CYCLE Division Science 8 quarter IV.pptxCELL CYCLE Division Science 8 quarter IV.pptx
CELL CYCLE Division Science 8 quarter IV.pptx
 
Introduction to ArtificiaI Intelligence in Higher Education
Introduction to ArtificiaI Intelligence in Higher EducationIntroduction to ArtificiaI Intelligence in Higher Education
Introduction to ArtificiaI Intelligence in Higher Education
 
Crayon Activity Handout For the Crayon A
Crayon Activity Handout For the Crayon ACrayon Activity Handout For the Crayon A
Crayon Activity Handout For the Crayon A
 
TataKelola dan KamSiber Kecerdasan Buatan v022.pdf
TataKelola dan KamSiber Kecerdasan Buatan v022.pdfTataKelola dan KamSiber Kecerdasan Buatan v022.pdf
TataKelola dan KamSiber Kecerdasan Buatan v022.pdf
 
Meghan Sutherland In Media Res Media Component
Meghan Sutherland In Media Res Media ComponentMeghan Sutherland In Media Res Media Component
Meghan Sutherland In Media Res Media Component
 
Full Stack Web Development Course for Beginners
Full Stack Web Development Course  for BeginnersFull Stack Web Development Course  for Beginners
Full Stack Web Development Course for Beginners
 
Incoming and Outgoing Shipments in 1 STEP Using Odoo 17
Incoming and Outgoing Shipments in 1 STEP Using Odoo 17Incoming and Outgoing Shipments in 1 STEP Using Odoo 17
Incoming and Outgoing Shipments in 1 STEP Using Odoo 17
 
Capitol Tech U Doctoral Presentation - April 2024.pptx
Capitol Tech U Doctoral Presentation - April 2024.pptxCapitol Tech U Doctoral Presentation - April 2024.pptx
Capitol Tech U Doctoral Presentation - April 2024.pptx
 
Roles & Responsibilities in Pharmacovigilance
Roles & Responsibilities in PharmacovigilanceRoles & Responsibilities in Pharmacovigilance
Roles & Responsibilities in Pharmacovigilance
 
Solving Puzzles Benefits Everyone (English).pptx
Solving Puzzles Benefits Everyone (English).pptxSolving Puzzles Benefits Everyone (English).pptx
Solving Puzzles Benefits Everyone (English).pptx
 
9953330565 Low Rate Call Girls In Rohini Delhi NCR
9953330565 Low Rate Call Girls In Rohini  Delhi NCR9953330565 Low Rate Call Girls In Rohini  Delhi NCR
9953330565 Low Rate Call Girls In Rohini Delhi NCR
 
Model Call Girl in Tilak Nagar Delhi reach out to us at 🔝9953056974🔝
Model Call Girl in Tilak Nagar Delhi reach out to us at 🔝9953056974🔝Model Call Girl in Tilak Nagar Delhi reach out to us at 🔝9953056974🔝
Model Call Girl in Tilak Nagar Delhi reach out to us at 🔝9953056974🔝
 
“Oh GOSH! Reflecting on Hackteria's Collaborative Practices in a Global Do-It...
“Oh GOSH! Reflecting on Hackteria's Collaborative Practices in a Global Do-It...“Oh GOSH! Reflecting on Hackteria's Collaborative Practices in a Global Do-It...
“Oh GOSH! Reflecting on Hackteria's Collaborative Practices in a Global Do-It...
 
Earth Day Presentation wow hello nice great
Earth Day Presentation wow hello nice greatEarth Day Presentation wow hello nice great
Earth Day Presentation wow hello nice great
 
भारत-रोम व्यापार.pptx, Indo-Roman Trade,
भारत-रोम व्यापार.pptx, Indo-Roman Trade,भारत-रोम व्यापार.pptx, Indo-Roman Trade,
भारत-रोम व्यापार.pptx, Indo-Roman Trade,
 
Computed Fields and api Depends in the Odoo 17
Computed Fields and api Depends in the Odoo 17Computed Fields and api Depends in the Odoo 17
Computed Fields and api Depends in the Odoo 17
 
Framing an Appropriate Research Question 6b9b26d93da94caf993c038d9efcdedb.pdf
Framing an Appropriate Research Question 6b9b26d93da94caf993c038d9efcdedb.pdfFraming an Appropriate Research Question 6b9b26d93da94caf993c038d9efcdedb.pdf
Framing an Appropriate Research Question 6b9b26d93da94caf993c038d9efcdedb.pdf
 
Painted Grey Ware.pptx, PGW Culture of India
Painted Grey Ware.pptx, PGW Culture of IndiaPainted Grey Ware.pptx, PGW Culture of India
Painted Grey Ware.pptx, PGW Culture of India
 

Viability of Nigerian States Without Federal Funds

  • 1. ISSN 2349-7831 International Journal of Recent Research in Social Sciences and Humanities (IJRRSSH) Vol. 2, Issue 3, pp: (131-145), Month: July 2015 - September 2015, Available at: www.paperpublications.org Page | 131 Paper Publications Viability of Nigeria State Governments Independent of Statutory Allocations: Empirical Evidence (1999-2013) 1 Dr. Chukwu, U.C, 2 Mr. Aneke, B.O 1 Lecturer, 2 Postgraduate student 1, 2 Department of Accountancy, Ebonyi State University, Abakaliki, Nigeria Abstract: This broad study empirically evaluates the viability of Nigeria state governments independent of statutory allocations. The study was basically motivated by the persistent dependence of Nigeria State Governments on allocations from the Federation Account to the neglect of internally–generated revenues; this being so even with the current down–turn in the crude oil market, which is the main source of revenue to the federation account. The study employed the ex- post facto research design and used the regression model to determine the causal relationship between states internally–generated revenue and statutory allocations on the one hand, and states total expenditures and total revenues on the other hand, during the period 1999–2013. The results of the analysis show that, though generally, internally-generated revenues and statutory allocations have significant effects on the dependent variables (total expenditures and total revenues) their contributions to total expenditures and total revenues vary significantly. While internally–generated revenues contribute insignificantly to total expenditures and total revenues, statutory allocations contribute maximally to those dependent variables. This confirmed the dependency assumption which formed the theoretical framework of this study. The implication of this is that currently state governments cannot finance their fiscal operations without statutory allocations and/or external borrowings, thereby posing a threat to their future viability in view of the current down – ward trend in the prices of oil in the world oil marked upon which the Nigerian national budget is bench – marked. It is therefore, recommended that state governments should begin to direct more efforts toward effectively tapping the potentials of their internal sources of revenue as a safeguard against further fall in oil prices and hence, reduction in statutory allocations. Keywords: State government finances, statutory allocations, Federation account, internally generated revenue, Government expenditures. 1. INTRODUCTION Nigeria operates a federal system of government with three tiers- Federal, States and Local governments. These three levels of administration have powers and jurisdictions assigned to them by the Federal Constitution. In recognition of these powers and jurisdictions, the Constitution makes provisions for the collection and distribution of public revenue among the various levels of government. In specific terms, section 162 of the Constitution, among other things, empowers the president to table before the National Assembly, on the advice of the Revenue Mobilization, Allocation and Fiscal Commission, proposals for revenue allocation to the three tiers of government. Thus, every month, any amount standing to the credit of the said Federation Account is distributed to the three levels of government based on pre-determined criteria (or formula). The foregoing constitutional provisions have far-reaching implications for the viability of various tiers of government in Nigeria.
  • 2. ISSN 2349-7831 International Journal of Recent Research in Social Sciences and Humanities (IJRRSSH) Vol. 2, Issue 3, pp: (131-145), Month: July 2015 - September 2015, Available at: www.paperpublications.org Page | 132 Paper Publications Prior to the oil boom era in the early 1970s, revenue accrued to the Federation Account from various other sources, apart from oil, majorly from agricultural products such as palm-oil/kernel, cocoa, groundnut, rubber, cotton, hides and skin, to mention but a few. However, following the oil-boom all these sources of revenue were neglected such that today Nigeria derives close to 90% of her revenue from oil exports, being a major member of the Organization of Petroleum Exporting Countries (OPEC). Table 1 below (State government Finances, 1999-2013), shows actual figures of States total revenue (TR), statutory allocations (SA), internally-generated revenue (IGR) and total expenditures (TE) for the period, 1999 to 2013.The relationships among these variables are presented in tables 2 and 3- Statutory allocations and internally-generated revenue as percent of total expenditure and States Internally-generated revenue and statutory allocations as percent of total revenue ,respectively. Table 1: State governments finances (1999 -2013) Year TR (# bn) SA (# bn) IGR (# bn) TE (# bn) 1999 169.0 103.7 34.1 167.9 2000 359.1 251.6 37.8 359.7 2001 573.5 404.1 59.4 597.0 2002 669.8 388.3 89.6 724.5 2003 855.0 535.2 118.8 921.2 2004 1113.9 777.2 134.2 1125.1 2005 1419.6 921.0 122.7 1243.2 2006 1543.8 1016.1 125.2 1586.8 2007 2065.4 1109.3 305.7 2116.1 2008 2934.8 1694.0 441.1 3021.6 2009 2590.7 973.8 461.2 2776.9 2010 3162.5 1353.7 757.9 3266.2 2011 3410.1 1786.3 509.3 3542.0 2012 3572.5 1857.0 548.1 3844.9 2013 3948.6 2082.3 624.4 4156.3 Source: CBN Annual Reports, various Issues From table 1, it can be observed that, for most of the period, total expenditure of Nigeria State governments were considerably higher than their corresponding revenue and, on some periods double the combination of their total statutory allocations and internally-generated revenue. Thus, on many occasion, States fiscal operations are in deficits. 2. THE PROBLEM Tables 2 and 3 below show that following the discovering of crude oil in commercial quantities State governments in Nigeria have persistently depended on federal monthly stipends for funding of their fiscal operations (recurrent as well as capital expenditures). For instance, CBN Annual reports indicate that between 1999 and 2013 the percentage of IGR (internally – generated revenue) to overall expenditures of State governments in the country ranges between 7.9% and 23.2% while the percentage of Statutory Allocations to Total Expenditures range from 35.1 to 74.1 percent within the same period (table 2). In the same direction, the percentage of Internally generated Revenue to Total Revenue range from 8.1 percent to 23.9 percent while the percentage of Statutory Allocations to Total Revenue has a range of 37.6%-70.5% ( table 3).
  • 3. ISSN 2349-7831 International Journal of Recent Research in Social Sciences and Humanities (IJRRSSH) Vol. 2, Issue 3, pp: (131-145), Month: July 2015 - September 2015, Available at: www.paperpublications.org Page | 133 Paper Publications Table 2: Statutory Allocations & Internally Generated Revenues as percent of Total Expenditure Year TE (# billion) SA as % of TE IGR as % of TE 1999 167.9 61.8 20.3 2000 359.7 69.9 10.5 2001 597.0 67.7 10.0 2002 724.5 53.6 12.4 2003 921.2 58.1 12.9 2004 1125.1 69.1 11.9 2005 1243.2 74.1 9.9 2006 1586.8 64.0 7.9 2007 2116.1 52.4 14.4 2008 3021.6 56.1 14.6 2009 2776.9 35.1 16.6 2010 3266.2 41.4 23.2 2011 3542.0 52.4 14.4 2012 3844.9 48.3 14.3 2013 4156.3 50.1 15.0 Source: Authors‘ compilations, 2015 The implication of the foregoing is that without statutory allocations and external loans State governments in Nigeria cannot finance their operations. This is regrettably so even when most States in Nigeria are endowed with enormous natural resources (Agricultural, minerals, etc) which if well tapped could significantly reduce their prevailing over- dependence on federal allocations and external loans. Of particular concern is the current down-turn in the global oil market. From late 2014 to early part of this year (2015) official reports indicate that the price of oil had fallen below $70 per barrel as against the previous price of over $100. This is expected to have far-reaching implications on federal and hence, state governments‘ revenue profiles as evidenced from a recent media report indicating that the fall in oil prices has reduced government revenue by 25%. Table 3: States Internally Generated Revenue & Statutory Allocations as percent of Total Revenue Year TR (# billion) IGR as % of TR SA as % of TR 1999 169.0 20.2 61.4 2000 359.1 10.5 70.1 2001 573.5 10.4 70.5 2002 669.8 13.4 58.0 2003 855.0 13.9 62.6 2004 1113.9 12.0 69.8 2005 1419.6 8.6 64.9 2006 1543.8 8.1 65.8 2007 2065.4 14.8 53.7 2008 2934.8 15.0 57.7 2009 2590.7 17.8 37.6 2010 3162.5 23.9 43.3 2011 3410.1 14.9 52.4 2012 3572.5 15.3 52.0 2013 3948.6 15.8 52.7 Source: Authors‘ compilations, 2015
  • 4. ISSN 2349-7831 International Journal of Recent Research in Social Sciences and Humanities (IJRRSSH) Vol. 2, Issue 3, pp: (131-145), Month: July 2015 - September 2015, Available at: www.paperpublications.org Page | 134 Paper Publications The situation thus, raises concern over the long-run sustainability of sufficient statutory allocations to the lower tiers of government in Nigeria. This suggests a need for a determination of the desirable levels of internally generated revenue and statutory allocations necessary for effective and sustainable financing of State Governments‘ fiscal operations, with a view to providing answers to the following questions: -What is the effect of internally-generated revenue on total expenditures of State Governments in Nigeria? -What is the contribution of statutory allocations to total expenditures of State governments in Nigeria? -To what extent does internally-generated revenue contribute to the total revenues of State governments in Nigeria? -What is the effect of statutory allocations on the total revenue of State governments in Nigeria? 3. OBJECTIVES OF THE STUDY This study seeks to evaluate the viability of Nigeria State governments independent of statutory allocations from the federation accounts. In particular, we evaluate the causal relationships between States Internally-Generated Revenue and Statutory Allocations on the one hand, and States Total Expenditures and Total Revenues, on the other hand for the period 1999 to2013. The period 1999-2013 was selected as the period of investigation so as to cover the period during which Nigeria had the longest period of democratic governance. The beginning of the investigation period of 1999 was preferred as that was the year the present Constitution of Nigeria, in which the current revenue allocation formula is enshrined came into effect while the end of the investigation year of 2013 was the year up to which data were fully available. Specifically, we seek to: - determine the effect of Internally – Generated Revenue on Total Expenditures of State governments in Nigeria; - evaluate the contribution of Statutory Allocations to the Total Expenditures of State governments in Nigeria; - Determine to what extent Internally-generated Revenue contributes to the Total Revenue of State governments in Nigeria. - Evaluate the effect of Statutory Allocations on Total Revenue of State governments in Nigeria. 4. HYPOTHESES Based on the foregoing specified objectives the following null hypotheses are tested: 1 Ho: Internally- generated Revenue has no significant effect on Total Expenditures of State Governments in Nigeria. 2. Ho: Statutory allocations have no significant effect on total expenditures of State governments in Nigeria. 3. Ho: Internally generated revenue has no significant effect on total revenue of State governments in Nigeria. 4. Ho: Statutory allocations have no significant effect on total revenue of State governments in Nigeria. 5. LITERATURE REVIEW Conceptual Framework: Section 162(10) of the Nigerian Constitution of 1999 defines revenue as: ―any income or return accruing to or derived by the Government – (federal, States and Local Governments from any source and includes – any receipt however described, arising from the operation of any law, any return, however described, arising from or in respect of any property held by the Government of the federation; and any return by way of interest on loans and dividends in respect of shares or interest held by the government of the federation in any company or statutory body”. The section further requires the Federal Government to maintain a ‗special account‘ to be known as ―The Federation Account‖ into which ―all revenues collected by the Government of the federation except the proceeds from the personal income tax of the personnel of the armed forces of the federation, the
  • 5. ISSN 2349-7831 International Journal of Recent Research in Social Sciences and Humanities (IJRRSSH) Vol. 2, Issue 3, pp: (131-145), Month: July 2015 - September 2015, Available at: www.paperpublications.org Page | 135 Paper Publications Nigerian Police Force, the Ministry or department of government charged with responsibility for Foreign Affairs and the residents of the Federal Capital Territory, Abuja shall be paid..” These legal provisions seem to have provided legal backing for the rather injurious over-dependence of lower levels of government on statutory allocations to the detriment of other sources of revenue available in their areas of jurisdiction. Oseni (2013) reports that prior to the local government reforms of 1978, the generation of internal sources of revenue were at their maximum and that local governments (and states) responsibilities were effectively carried out with or without help from the central authority. However, when the 1978 reforms were introduced internal revenue generation as a major means of financing local (and state) governments was abandoned in preference to the revenue from the federal statutory allocations. This, according to Atakpa, Ocheni and Nwankwo (2012), was principally identified as the bane of internal revenue generation at local (and States) levels of government. They concluded that self-reliance cannot be actualized by States and Local Governments unless efforts are intensified to fully tap their internal sources of revenue. Ekpo (2003) sees fiscal federalism as a system of resolving the relations arising from the political decentralization of the public sector functions and responsibilities. He sums up the concept of federalism thus: ―The term deals with the allocation of resources among the three tiers and units of government, and institutions for the discharge of responsibilities assigned to each jurisdictional authority. The nature and well fashioned fiscal relations in any federal system are crucial to the continual existence of such systems. One of the cardinal principles of federalism is that no level of government is subordinate to one another, though there must be a central government for this arrangement”. Empirical Review: Aigbepue and Ainabor (2011) carried out a study on the issues and challenges of Nigeria fiscal federalism. Adopting content analysis as their research method, they described federalism as ―the internalization of the administrative system designed to cope with size, difference and peculiarities of the regions or state and/or ethnic groups‖. They argue that as a federating state, Nigeria operates a revenue allocation system which takes care of all component parts of the federation. Itemizing the objectives of fiscal relationship in a federation as ranging from ensuring correspondence between sub – national expenditure responsibilities to ensuring consistency with nationally agreed income distribution goals, they argued that a stable federation‘ can only be realized in an environment of equity, fairness and justice. That is, the evolution of an equitable revenue formula that would be in the best interest of a stable Nigerian federation. Oseni (2013) studied the contribution of internally generated revenue to state development in Nigeria. Adopting the descriptive techniques of analysis he determine the summary statistics and trends of secondary data relating to state government finances for the years 2007 to 2011. It was found, among others that during the period covered by the study, internally generated revenue of states represented less than 14% of their entire revenue with Lagos State posting the highest ratio of IGR to total revenue of over thirty six percent. This was attributed to the engagement of tax consultants by that State government in its revenue collection. It was further reported that states having the 13% derivation from petroleum production, with the exception of Rivers and Edo, have low internally generated revenue in relation to overall revenue. This buttresses the general notion that without statutory allocations several states cannot discharge their statutory responsibilities. However, whether it is sound economic reasoning for states to perpetually depend on federal allocations for financing their fiscal operations is a subject for empirical evaluation. Agba, Ocheni and Okechukwu (2014) studied the challenges of financing Local Governments in Nigeria in a democratic setting with a view to suggesting action plans for improvement. Using descriptive research method, the authors critically reviewed various avenues for generating funds by local governments in Nigeria. They further explored the factors that affect the viability of local government councils in the context of fiscal federalism as provided for in the 1999 constitution of the Federal Republic of Nigeria. The study found, among other things, that the major factors affecting local government finance in Nigeria include uneven distribution of resources, lack of fiscal freedom, excessive reliance on federal allocations , creation of local councils that are not viable as well as, ―dishonestly and corruption‖. The paper therefore, recommended that local governments should
  • 6. ISSN 2349-7831 International Journal of Recent Research in Social Sciences and Humanities (IJRRSSH) Vol. 2, Issue 3, pp: (131-145), Month: July 2015 - September 2015, Available at: www.paperpublications.org Page | 136 Paper Publications intensify efforts in developing avenues for generating funds so as to reduce over dependence on statutory allocations. An examination of the relationship between government revenue and government expenditure in Nigeria – co integration and causality approach, was a study carried out by Obioma and Ozughalu (2010). Using empirical data from 1970- 2007, the study examined the interaction between government revenue and government expenditure in Nigeria. It employed the ‗Engel-Granger two- step co integration‘ techniques, the ‗Johnansen co integration’ method and the ‗Granger causality test‘ within the ‗Error Correction Modeling (ECM)’ framework. Empirical findings from the study indicate, among other things, that there is a long-run relationship between government revenue and government expenditure in Nigeria. The findings thus, affirm the ‗revenue – spend hypothesis’ for Nigeria, implying that expenditures of government are significantly affected by fluctuations in revenue fluctuations. Theoretical Framework: This study is anchored on the Dependency Theory developed in the late 1950s under the guidance of the Director of the United Nations Economic commission for Latin America, Paul Prebisch (Ferraro, 1996). Prebisch‘s study suggests that economic activity in the richer counties often lead to serious economic problems in the poorer countries. The poverty of poor nations is often a by-product of over-reliance on the resources of richer nations This situation can be likened to the prevailing fiscal federalism in Nigeria whereby States and Local governments depend largely on the Federal government for revenue allocation for the financing of their fiscal operations. The allocation of the taxing powers of the three tiers of government in Nigeria (Federal, States and Local governments) in which the central government control most of the lucrative revenue sources, both in terms of the power to legislate and to administer and collect (Odusola 2006, cilted in Chukwu , 2011) is in tandem with this theory. In Nigeria, the major tax which the states share jurisdiction with the federal government is the personal income tax, though its legislation rests with the federal government. While the federal government collects the personal income tax of the personnel of the armed forces, the states collect those of other residents in their respective territories. This imbalance in revenue powers of different levels of government leaves the lower levels of government perpetually dependent on the higher level of government for the financing of their operations. Oseni (2013) reports that before the 1976 Local Government reforms IGR generation were at there maximum levels. The federal government provides little or no assistance to other tiers of government which were effectively discharging their responsibilities. However, following the advent of statutory allocations the exploitation of internal revenue sources to finance other tiers of government was severely neglected in preference to the revenue from the federation account. Thus Atakpa, Ocheni and Nwakwo (2012) concluded that that was the genesis of the persistent dwindling fortunes of revenue generation at the lower levels of government in Nigeria. It is their opinion that for States and Local governments to be self-reliant they must look inwards to fully tap their internal sources of revenue. Local government councils partially gave up most of their traditional revenue sources following the 1981 Revenue Act. Two factors were majorly responsible for the partial neglect of internal sources of revenue by some local councils- the advent of the oil boom and a statement credited to a one time Head of State of Nigeria to the effect that the major hindrance to the growth of the Nigerian economy was ―executive capacity‖ rather than ―finance‖. Prior to that time internally –generated revenue constituted as much as eighty five percent of total revenue of some local governments. Nevertheless, the need to raise internal revenue from its dismal level became necessary following the decline in the oil revenue. Currently there is nearly hundred percent reliance by states in Nigeria on statutory allocations to discharge basic responsibilities. Without monthly statutory allocations from the federation account no basic operations can be performed. With this monthly stipends assured, lower levels of government pay minimal attention towards growing their internal resources which could have helped them to be independent. Abiola and Asiweh (2012) also highlighted the contribution of Lagos State to government revenue generation in Nigeria. They stated that Lagos State is among a few states in Nigeria that have left a land mark in terms of independence and use internally generated revenue. Syndelle (2009) observed that in 2007, Lagos state achieved a gross domestic product of N3.68 trillion, an equivalent of $29.028 billion making it the biggest contributor to the federation‘s gross domestic product.
  • 7. ISSN 2349-7831 International Journal of Recent Research in Social Sciences and Humanities (IJRRSSH) Vol. 2, Issue 3, pp: (131-145), Month: July 2015 - September 2015, Available at: www.paperpublications.org Page | 137 Paper Publications 6. RESEARCH DESIGN AND MODEL SPECIFICATION This study adopts the ex-post facto research design, using time series data covering a period of fifteen years (1999-2013) on Nigeria State governments‘ finances. The broad objective is to evaluate the respective contributions of States internally – generated revenue and statutory allocations to total expenditures and total revenues during the study period. This is with a view to determining the level of fiscal dependency of State governments in Nigeria on Federal Government allocations. First, we ran a regression analysis of the relationship between States internally – generated revenues and their total expenditures for the study period with a view to testing hypothesis one. Hypothesis two was tested by running the regression of the relationship between states statutory allocations and their total expenditures. We further established the contributions of internally- generally revenue to total revenue of State governments by regressing the former (internally-generated revenue) against the later(total revenue) to satisfy research objective three; while the fourth objective of the study was satisfied by regressing total States statutory allocations against total revenue of States. Thus, the relationships between the dependent variables (State governments‘ real expenditures and their real total revenues) and the explanatory variables (States real internally – generated revenues and their real statutory allocations) were determined by analyzing the following basic equations, using the Granger causality test (Obioma et al, 2010): RSGTEt = f(αo + αi + RSIGRt + μ1) (i) RSGTEt = f(αo + αi + RSSAt + μ2) (ii) RSGTRt = f(αo + αi + RSIGRt + μ1) (iii) RSGTRt = f(αo + αi + RSSAt + μ2) (iv) where: RSGTE = Real State Governments expenditures RSIGR = Real States internally- generally revenue RSSA = Real States Statutory allocations and RSGTR = Real State governments total revenue αo, αi, are parameters to be estimated u1 and u2 are stochastic error terms. Data on the variables (i.e. RSGE, RSIGR, RSSA and RSGTR) were collected from the Central Bank of Nigeria Annual Reports (1999 – 2013). 7. ANALYTICAL TECHNIQUES The relationships amongst internally – generated revenue, statutory allocations, expenditures and total revenues of state governments in Nigeria constitute the basis of empirical analysis. The hypotheses were tested using regression analysis and the F- values were obtained at the 95% level of significance to assess the linearity assumptions. The adjusted coefficients of determination (R2 ) were used to determine whether the explanatory variables, i.e. internally generated revenues and statutory allocations) adequately explain the behavior patterns of the dependent variables (i.e. State governments expenditures and total revenues). The results of the statistical analysis were used to test the hypotheses. For each hypothesis, decision (rejection or acceptance of the null) is based on the coefficient of each parameter and the F- test values. 8. ANALYSIS OF DESCRIPTIVE RESULTS Table 4 below is the summary of the descriptive statistics of the means and standard deviations as derived from the empirical data reported in tables 5-9 (regression outputs of the dependent and the independent variables).It can be observed from this table that the dependent variables, real total expenditure (RTE) and the independent variables (RTE) had the highest overall means of #1892. 52bn and #1963.29bn respectively.
  • 8. ISSN 2349-7831 International Journal of Recent Research in Social Sciences and Humanities (IJRRSSH) Vol. 2, Issue 3, pp: (131-145), Month: July 2015 - September 2015, Available at: www.paperpublications.org Page | 138 Paper Publications Table 4: Summary of descriptive statistics Variable Mean S.D N RTE 1963.29 1362.51 15 RTR 1892.55 1286.03 15 RIGR 291.30 243.34 15 RSA 1016.91 627.02 15 Source: Summary of descriptive statistics Key: RTR = Real total revenue of state governments in Nigeria RITR = Real internally – generated revenue of state governments in Nigeria RTE= Real total expenditure of state governments in Nigeria RSA = Real statutory allocations of state governments in Nigeria The difference between means of real total expenditure (RTE) and real total revenue (RTR) of #70.74bn (#1963.29 - #1892.55) indicates the average level of deficit financing of State governments‘ operations during the fifteen – year study period. In the same vein, the explanatory variables, real internally-generated revenue (RIGR) and real statutory allocations (RSA) had relatively lower average yields of #291.30bn and #1016.91bn respectively. Worthy of special note is also, the significant difference between the means of statutory allocations (RSA) and internally – generated revenue (RIGR). Average statutory allocations exceed average internally – generated revenue by a whopping #725.6bn (#1016.91-#291.30) during the study period. In other words, statutory allocations account for nearly 54% of total revenue of state governments, while the balance of 46% is accounted for by internally – generated revenue and state government‘s borrowings. The low average yield of internally – generated revenue as compared to statutory allocation is an indication of the alarming level of over dependence of State governments in Nigeria on statutory allocations over the years. 9. REGRESSION RESULTS The statistical indexes of the relationship between the dependent and independent variables are summarized in table5 below. The indexes were derived from the actual regression results as detailed in tables 5 to 9. Table 5: Summary of Regression Result Equation Const. Regr coef R2 Adjsd R2 Std Erro Sig. 1 RIGR vs RTE 418.867 5.302 0.896 2.888 0.499 0.0000 2 RSA vs RTR - 165.32 2. 093 0.928 0.922 0.162 0.0000 3 RIGR vs RTR 437.632 4.994 0.893 0.884 0.479 0.0000 4 RSA vs RTR -129. 635 1.989 0.893 0.935 0.139 0.0000 Source: Authors Compilations from regressed data Table 5 shows the regression result of the relationship between the dependent variables (real total expenditure and real total revenue of State governments) and the independent variables (real internally generated revenue and real statutory allocations of State governments) for the fifteen – year period (1999- 2013). Each of the four equations represents each of the four specific objectives set out for this study. The regression results show that the estimated coefficients of the regression parameters have positive signs, thus confirming our a-priori expectation. The implication of these signs is that the dependent variables are positively influenced by the independent (explanatory) variables.
  • 9. ISSN 2349-7831 International Journal of Recent Research in Social Sciences and Humanities (IJRRSSH) Vol. 2, Issue 3, pp: (131-145), Month: July 2015 - September 2015, Available at: www.paperpublications.org Page | 139 Paper Publications From equations 1 (row 1) the coefficient of determination R2 of 0.896 implies that 89.6% of the sample variation in the dependent variable, total expenditure, is explained or caused by the explanatory variable, internally – generated revenue, while 10. 4% is unexplained. This means that 10. 4% could be caused by other factors or variables not built into the model. In the same vein, the R2 value of 0.893 for equation two implies that 89.3% of the sample variation in total revenue is explained by internally – generated revenue while 10.7% is unexplained and may have been caused by factors not included in the regression model. For equations three and four the coefficients of determinations, R – square values are 0.928 and 0.940 respectively and are higher than those for equations one and two respectively. This implies that statutory allocations (SA) contribute more to total State government expenditures (TE) and total revenues (TR) than internally – garneted revenues (IGR). This is further buttressed by the trends in the movements of the dependent and independent variables as depicted in the tables, graphs and bar-charts (see appendices). 10. TESTS OF HYPOTHESES Tables 6-9 provide details of the regression outputs for the tests of hypotheses 1-4. In all four cases the null hypotheses were rejected leading to the conclusion that the dependent variables and the explanatory variables are positively correlated. However, the low ratio of internally-generated revenue to total expenditures and total revenues of Nigeria State government is indicative of the fact that the potentials of their internal revenue sources are not fully exploited. This trend needs to be reversed. Table 6: Regression Output of IGR on TE Dependent Variable: TE Method: Least Squares Date: 03/16/15 Time: 06:07 Sample: 1999 2013 Included observations: 15 Variable Coefficient Std. Error t-Statistic Prob. C 418.8671 186.9411 2.240637 0.0431 IGR 5.301841 0.499405 10.61631 0.0000 R-squared 0.896584 Mean dependent var 1963.293 Adjusted R-squared 0.888629 S.D. dependent var 1362.509 S.E. of regression 454.7005 Akaike info criterion 15.20072 Sum squared resid 2687783. Schwarz criterion 15.29513 Log likelihood -112.0054 Hannan-Quinn criter. 15.19972 F-statistic 112.7061 Durbin-Watson stat 1.591703 Prob(F-statistic) 0.000000 Source: Statistical analysis of empirical data using e-view 3.0
  • 10. ISSN 2349-7831 International Journal of Recent Research in Social Sciences and Humanities (IJRRSSH) Vol. 2, Issue 3, pp: (131-145), Month: July 2015 - September 2015, Available at: www.paperpublications.org Page | 140 Paper Publications Table 7: Regression Output of SA on TE Dependent Variable: TE Method: Least Squares Date: 03/16/15 Time: 06:17 Sample: 1999 2013 Included observations: 15 Variable Coefficient Std. Error t-Statistic Prob. C -165.3195 191.5271 -0.863166 0.4037 SA 2.093223 0.161810 12.93631 0.0000 R-squared 0.927917 Mean dependent var 1963.293 Adjusted R-squared 0.922372 S.D. dependent var 1362.509 S.E. of regression 379.6188 Akaike info criterion 14.83978 Sum squared resid 1873435. Schwarz criterion 14.93418 Log likelihood -109.2983 Hannan-Quinn criter. 14.83877 F-statistic 167.3481 Durbin-Watson stat 1.362331 Prob(F-statistic) 0.000000 Source: Statistical analysis of empirical data using e-view 3.0 Table 8: Regression Output of IGR on TR Dependent Variable: TR Method: Least Squares Date: 03/16/15 Time: 06:05 Sample: 1999 2013 Included observations: 15 Variable Coefficient Std. Error t-Statistic Prob. C 437.6323 179.3699 2.439832 0.0298 IGR 4.994580 0.479179 10.42320 0.0000 R-squared 0.893130 Mean dependent var 1892.553 Adjusted R-squared 0.884909 S.D. dependent var 1286.027 S.E. of regression 436.2847 Akaike info criterion 15.11803 Sum squared resid 2474477. Schwarz criterion 15.21244 Log likelihood -111.3852 Hannan-Quinn criter. 15.11703 F-statistic 108.6432 Durbin-Watson stat 1.474717 Prob(F-statistic) 0.000000 Source: Statistical analysis of empirical data using e-view 3.0
  • 11. ISSN 2349-7831 International Journal of Recent Research in Social Sciences and Humanities (IJRRSSH) Vol. 2, Issue 3, pp: (131-145), Month: July 2015 - September 2015, Available at: www.paperpublications.org Page | 141 Paper Publications Table 9: Regression Output of SA on TR Dependent Variable: TR Method: Least Squares Date: 03/16/15 Time: 06:15 Sample: 1999 2013 Included observations: 15 Variable Coefficient Std. Error t-Statistic Prob. C -129.6350 164.8994 -0.786146 0.4459 SA 1.988568 0.139314 14.27402 0.0000 R-squared 0.940022 Mean dependent var 1892.553 Adjusted R-squared 0.935409 S.D. dependent var 1286.027 S.E. of regression 326.8412 Akaike info criterion 14.54039 Sum squared resid 1388727. Schwarz criterion 14.63480 Log likelihood -107.0529 Hannan-Quinn criter. 14.53939 F-statistic 203.7476 Durbin-Watson stat 1.366875 Prob(F-statistic) 0.000000 Source: Statistical analysis of empirical data using e-view 3.0 11. DISCUSSION OF RESULTS Analysis of the descriptive statistics of State governments finances show that average internally-generated revenue were consistently low in comparison to the levels of total revenue and total expenditures of state governments during the study period (1999- 2013). This is attributable to lack of commitment on the part of government revenue agencies to tap fully the potentials of various revenue sources available to State governments in Nigeria. Contrastingly, the mean contributions of statutory allocations to total government expenditures and total revenues are quite high. The reason for this is not far- fetched – Nigeria is a major oil producer and revenue there-from is always in steady supply for distribution to the various tiers of government. However, with the current significant fall in oil prices in the world market (below $50 per barrel in February, 2015) it will not augur well for State governments to continue to fold their hands waiting for statutory allocations. The results of our empirical analysis further show that both of the explanatory variables (internally – generated revenue and statutory allocations) have significant relationships with each of the two dependent variables (total expenditures and total revenues of State governments). This finding is in agreement with Obioma et al (2010) who reported a long- run relationship between government revenue and government expenditure in Nigeria. Our analysis further show that statutory allocations constitute the major components of State government expenditures and total revenue (averaging over 60 percent ) during the study period. However, it has been shown in pervious studies that over dependence on oil revenue has far – reaching consequences – it may lead to the ―Dutch disease syndrome (Herberger, 1983, cited in Chukwu, 2011). The studies explain how the convenience of wealth effect influences governments expenditures and non- oil revenue efforts. With respect to government expenditures, given the high level of confidence that steady inflow of oil revenue is a certainty, government tend to increase expenditures beyond acceptable levels thereby inducing inflation. The minimal contributions of internally – generated revenue to government expenditure and total revenue as revealed in the descriptive statistics, is attributable to the low yields of our tax system. The reason, according to Osoro (1991), cited in Chukwu (2011) is that most of Nigerian tax reforms focus on forms of taxes instead of administrative efficiency that would result to improved income from prevailing sources of tax. Other reasons include administrative inefficiency, faulty
  • 12. ISSN 2349-7831 International Journal of Recent Research in Social Sciences and Humanities (IJRRSSH) Vol. 2, Issue 3, pp: (131-145), Month: July 2015 - September 2015, Available at: www.paperpublications.org Page | 142 Paper Publications collection system, legislative complexity as well as apathy on the part of those outside the tax net (self – employed persons). The concern over the meager contribution of non- oil revenue to the finances of State governments, as revealed in this study supports Aghevli and Sassanpour (1982) and Veez – Zedeh (1989) who observed that the level of non- oil revenue is a function of the magnitude of the economic effect of the oil wealth. In specific terms they noted that a nation‘s perception of the level of its oil wealth determines to what extent effort is exerted towards tapping resources from the non oil sector. A nation is likely to shift more resources from the oil sector to the non oil sector, through tax increases, the more the government perceives the oil wealth to be permanent, and vice-versa. Our finding that high expectation of huge statutory allocations from the central government is a disincentive to internal revenue generation is further supported by Oseni (2013) who reports that there is a general erroneous notion that without federal allocations States cannot discharge their civic obligations to the people. However, it should be noted that within the territorial boundaries of each state a lot of revenue potentials abound which are left untapped. For instance, Lagos state generates huge amount of internal revenue annually even though it does not receive extra allocations from oil revenue – quite a good lesson to other states! The foregoing has the following policy implications: State governments should channel more efforts toward boasting internal revenue generation as a cushion against swings in oil revenue, and hence the federation account. In particular, there is the need to revamp the agricultural sector so as to boast food production for local consumption and export.; the tax administration machinery at the states level should be improved so as to improve the yield of the states tax system through proper maintenance of registers of taxpayers which should be kept current, free distribution of tax return forms to all areas, taking into account the geographical distribution of taxpayers and regular field audits at the taxpayers‘ places of business during which intensive checks of the taxpayer‘s records and business are conducted by trained personnel. The Internal Revenue Board should make it as a permanent part of its culture, regular town hall meetings with taxpayers and staff of the Board to educate the former on the need for and benefits of tax compliance. REFERENCES [1] Afuberoh D. and Okoye E. (2014), The Impact of Taxation on Revenue Generation in Nigeria: A Study of Federal Capital Territory and Selected States. International Journal of Public Administration and Management Research,2(2),31-44. [2] Agba, M. S; Ocheni S and Nnamani, D. O. (2014). Local Government Finance in Nigeria: Challenges and Prognosis for action in a Democratic Era (1999-2013), Journal of Good Governance and Sustainable Development in Africa, 2 (1), 84- 96 [3] Agu, C. (2011) Fragile States! Why Sub-national Governments in Nigeria Cannot Subsist on Internally Generated Revenue? The IUP Journal of Public Finance, 9(1), 25-53. [4] Aigbepue S. and Ainabor A.E. (2011), Issues and Challenges of Nigerian Fiscal Federalism; Interdisciplinary Journal of Research in Business, 1 (10), 26-31. [5] Ariyo, A. (1997). Productivity of the Nigerian Tax System: 1970-1990. AERC Research Paper 67. Nairobi: African Economic Research Consortium. [6] Atakpa, M., Ocheni, S., and Nwakwo, B. C. (2012) Analysis of options for Maximizing Local Government internally generated Revenue in Nigeria, International Journal of Learning & Development; 2 (5) [7] Blinder, A.S. and Solow, R.M. (1973). Does Fiscal Policy Matter?. Journal of Public Economics, vol. 2: 319–37. [8] Chang, T. (2009), „Revisiting the Government Revenue-Expenditure Nexus:Evidence from 15 OECD Countries based on the Panel Data Approach‟.Czech Journal of Economics and Finance, 59(2), 165-172. [9] Chang, T. and Ho, Y.H. (2002), „A Note on Testing Tax-and-Spend, Spend-and- Tax or Fiscal Synchronization: The Case of China‟. Journal of EconomicDevelopment, 27(1), 151-160. [10] Chukwu, U.C. (2011), Implications of Macro-Economic Regimes on the Productivity of the Nigerian Tax System: A case for Sustainable Fiscal Deficit Financing in Nigeria. Unpublished PhD Thesis presented to the Department of Accountancy Ebonyi State University, Abakaliki.
  • 13. ISSN 2349-7831 International Journal of Recent Research in Social Sciences and Humanities (IJRRSSH) Vol. 2, Issue 3, pp: (131-145), Month: July 2015 - September 2015, Available at: www.paperpublications.org Page | 143 Paper Publications [11] Chukwu, U.C. (2011), (Strategies for Effective Tax Administration in South East Nigeria, Journal of Accounting and Contemporary Studies, 1(1), 21-34. [12] Dang, D.Y. (2013). Revenue Allocation and Economic Development in Nigeria: An Empirical Study. http://sgo. sagepub.com/content/3/3/2158244013505602. Retrieved on 6/12/13. [13] Egwaikhide, F. O.(2004). ―Intergovernmental Fiscal Relations in Nigeria‖.In Egwaikhide, F. O.(eds.). Intergovernmental Relations in Nigeria, Ibadan: Programme on Ethnic and Federal Studies,1-23 [14] Ekpo, A. (2003): Fiscal federalism: Nigeria Post-Independence experience 1960-90, World Development Vol. 22, (8), 65-71 [15] Ekpo, A. (2004, August 10-12). Intergovernmental Fiscal relations: The Nigerian Experience. Paper presented at the 10th Year Anniversary of the Financial and Fiscal Commission of South Africa, Cape Town, South Africa. [16] Federal Republic of Nigeria (1999): ―Constitution‖ Abuja: Federal Government press. [17] Fashola, B. R. (2013) Lagos Mega Revenue (IGR) Now N23billion Monthly, Retrieved from www.osundefender.org on March, 2015. [18] Jimoh, A. (2003, October 7-9). Fiscal federalism: The Nigerian experience. Paper presented at the Ad-Hoc Expert Group Meeting—Economic Commission for Africa, UNCC, Addis Ababa, Ethiopia. [19] Khalil, S and Adelabu, S. A.(2011) Fiscal planning and local government administration in Nigeria: The quest for sustainable rural development, African Journal of Business Management. 6(9). 3482-3489, [20] Naiyeji, K. (2011) Tax consultants drain government‘s purse, 2011 Revenue Mobilisation,Allocation and Fiscal Commission (RMAFC) Members‘ Retreat in Uyo, Akwa Ibom State. [21] Obioma, E.C. and Ozughalu U.M.(2010), An Examination of the Relationship between Government Revenue and Government Expenditure in Nigeria: Cointegration and Causality Approach, CBN Economic and Financial Review, 48 (2), 35-57. [22] Ojo, C. O., and Owojori, A. A. (1998) Mobilisation of Internally Generated Revenue in some selected Local Governments in Ondo state Retrieved from http://hdl.handle.net/123456789/2971 December, 2014. [23] Olowononi, G. D. (1998). Revenue Allocation and Economics of Federalism. In Amuwo, A., Agbaje, A. Suberu, R. &Herault, G. (eds.). Federalism and Political Restructuring in Nigeria.Ibadan: Spectrum Books Ltd, PP. 247-260 [24] Omoruyi, S.E. (1983). Growth and Flexibility of Federal Government Tax Revenue: 19601979.Economic and Financial Review, 21(1): 11–19. [25] Oseni M. (2013), Internally Generated Revenue in Nigeria:A Panacea for Stae Development, European Journal of Humanities and Social Sciences, 21(1), 1050-1066. [26] Osoro, N.E. (1991). ―Tax Reform in Tanzania: Motivations, Directions and Implications‖. A progress Report presented to the African Economic Research Consortium. Nairobi, Kenya, 26—30 May. [27] Rutayasire, L.W. (1990). Issues in Public Expenditure Policy in Africa: Evidence from Tanzanian Experience. Paper presented at the World Bank Conference on African Economic Issues. Nairobi, Kenya, 4—7 June. [28] Rutayasire, L.W. (1990). Issues in Public Expenditure Policy in Africa: Evidence from Tanzanian Experience. Paper presented at the World Bank Conference on African Economic Issues. Nairobi, Kenya, 4—7 June. [29] Toda, H. Y. and Yamamoto, T. (1995). Statistical Inference in Vector Autoregressions with Possibly Integrated Processes, Journal of Econometrics, (6)6, 225-250. [30] Von Furstenberg, G. M., Green, R.J. and Jeong, J.H. (1986). Tax and Spend or Spend and Tax? Review of Economics and Statistics, 68(2), 179-188. [31] Wahid, A. N. M. (2008). An Empirical Investigation on the Nexus between Tax Revenue and Government Spending: The Case of Turkey. International Research Journal of Finance and Economics, 16, 46-51.
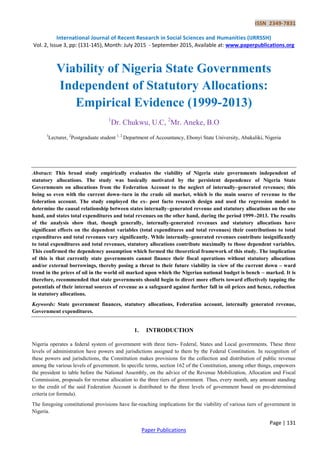
  • 14. ISSN 2349-7831 International Journal of Recent Research in Social Sciences and Humanities (IJRRSSH) Vol. 2, Issue 3, pp: (131-145), Month: July 2015 - September 2015, Available at: www.paperpublications.org Page | 144 Paper Publications APPENDICES APPENDIX A: GRAPHICAL PRESENTATIONS OF EMPIRICAL DATA APPENDIX B:: BAR –CHAR B1: STATES INTERNALLY-GENERATED REVENUE AND TOTAL EXPENDITURE 0 1,000 2,000 3,000 4,000 5,000 99 00 01 02 03 04 05 06 07 08 09 10 11 12 13 TE IGR
  • 15. ISSN 2349-7831 International Journal of Recent Research in Social Sciences and Humanities (IJRRSSH) Vol. 2, Issue 3, pp: (131-145), Month: July 2015 - September 2015, Available at: www.paperpublications.org Page | 145 Paper Publications B2: STATES STATUTORY ALLOCATIONS AND TOTAL EXPENDITURES B3: STATES INTERNALLY GENERATED REVENUE AND TOTAL REVENUE B4: STATES STATUTORY ALLOCATIONS AND TOTAL REVENUE 0 1,000 2,000 3,000 4,000 5,000 99 00 01 02 03 04 05 06 07 08 09 10 11 12 13 TE SA 0 1,000 2,000 3,000 4,000 99 00 01 02 03 04 05 06 07 08 09 10 11 12 13 TR IGR 0 1,000 2,000 3,000 4,000 99 00 01 02 03 04 05 06 07 08 09 10 11 12 13 TR SA