Download to read offline
![International Journal of Scientific Research and Engineering Development-– Volume 2 Issue 1, Jan-Feb 2019
Available at www.ijsred.com
ISSN: 2581-7175 ©IJSRED: All Rights are Reserved Page 94
public enterprises and their priority access to the credit created) slowings (or then slowed down) the financing of the
expenses private sector. Banks accumulated doubtful debts that were difficult to recover, and they were controlled by
the State outside the criteria of efficiency and good management. The decline in economic activity has limited
deposits, resulting in a cumulative process. In the same period the financial bankruptcy has retroacted on the
economy and on the public finances2
. The state budget in this country remains in deficit since 1980 from the 20th
century to the present day. This is explained by both the low level of revenue and the inconsiderate expansion of
expenditures. Indeed, despite the reinstatement of the 1993 taxation of imports of pharmaceuticals, spare parts, raw
materials and capital goods suspended since 1991, were recorded again during this period, and despite a weak
mobilization of recipes[BOUQUIN H., 1992, p. 21]. On the other hand, the public expenditure developed very
quickly notably to finance the cost of political adjustment.
This counter-performance in revenue and the reckless expansion of public spending will result in chronic budget
deficits during the same period of our observation. For example, in 1992 the budget deficit reached 22% of GDP and
in 1994 the budget deficit reached 15% of GDP. In order to finance budget deficits, the government has not found
anything better than to resort to banks and in particular to the Central Bank. It should be added that modern history
has been marked by a phase of very high inflation which has left important traces in the developed countries and
especially in Germany which suffered hyperinflation after the First World War. The consequences are that monetary
leaders in Europe in particular have put the fight against inflation at the heart of the missions of the European Central
Bank. In the years 1983 and 1989, the oil shocks made fear for a moment the return of this hyperinflation with
disastrous consequences on the real economic sphere. In the Democratic Republic of Congo, for example, some
organizations, such as the FAO, maintain that inflation reached catastrophic levels of 6000% in 1993 and 8.800% in
1994.
However, it declined sharply in 1995 (370%) [Salin, 1991, p. 175]. But the new civil war of 1998 interrupted
these efforts, causing a further rise in prices. In 1999, prices climbed 284.9%. The financing needs of the public
sector were then estimated at 8.8% of GDP [Polepole, 2004, pp .18-21]. This trend of overheating domestic prices is
at the root of the dollarization of the economy and the disruption of the financial system. The importance of three-
digit inflation has contributed to the depletion of household purchasing power and significantly reduced the ability of
firms to create jobs. This situation of unbridled price increases for goods and services eventually reinforced the
correlation between inflationary pressures and the exchange rate surge. All these factors have the effect of making the
Democratic Republic of Congo the country where the cost of living is among the highest in the world because of
hyperinflation [Olenghankoy M.J, 2002 pp. 49-50]. The impact of inflation on developing countries and the
Democratic Republic of Congo in particular find the explanation on the one hand in various macroeconomic variables
such as the financing of the state budget deficit, exchange rate movement, income redistribution. To deepen this
study, we start from the following questions:
1. What is the impact of the budget deficit on inflation in the Democratic Republic of Congo, in other words is
inflation in the Democratic Republic of Congo explained by the budget deficit?
2. Would inflation in the Democratic Republic of Congo be explained by other variables?
In order to provide some answers to these concerns, we have made the following assumptions:
2. Assumptions
The implementation of a series of questions necessarily leads to hypotheses. These are born from the questions asked
at the level of the problematic. In response to the above questions, we have made the following assumptions:
1) Inflation in the Democratic Republic of Congo would be explained by the budget deficit,
2) The increased instability of the Congolese economy, inflation in the Democratic Republic of Congo would be
explained by other variables such as: GDP, the money supply and the exchange rate.
3. Choice and interest of the subject
Focusing on the implications of the budget deficit for inflation in the DRC, our work has both a scientific and a social
interest. From the scientific point of view, it is an application, an attempt to put into practice the scientific knowledge
acquired for the purpose of finding solutions to the problems facing the DRC. From a social point of view, in](https://image.slidesharecdn.com/ijsred-v2i1p13-190128124907/85/IJSRED-V2I1P13-2-320.jpg)
![International Journal of Scientific Research and Engineering Development-– Volume 2 Issue 1, Jan-Feb 2019
Available at www.ijsred.com
ISSN: 2581-7175 ©IJSRED: All Rights are Reserved Page 95
determining the impact of the budget deficit on inflation in the Democratic Republic of Congo, even theoretical, we
believe that we will have expanded the database that can allow our authorities to make decisions in the sense of
economic growth.
4. Delimitation of the subject
The scientific rigor requires that all work be limited in time and space. We limited our study to a period from the year
1970-2005. In space, our study is limited only to analyzing the case of the Democratic Republic of Congo.
5. Methodology of the work
As part of this work, we used the statistical method, through the processing of data using software Eviews, on a time
series, we will be able to arrive at an interpretation of the results obtained and finally, we will draw conclusions.
6. Subdivision of work
In addition to the introduction and conclusion, our work is divided into three parts. The first part deals with the
theoretical consideration, the second part presents the determinants of inflation. And finally, the third part focuses on
the empirical estimation of the relationship between inflation and budget deficit.
Part 1. Theoretical considerations
Inflation is a monetary phenomenon. It is therefore absurd - which is often spoken of as inflation, not to mention
money. But besides the monetary phenomenon other variables are likely to influence inflation. It is in this sense that
this part deals with a review of the literature in order to stigmatize the theoretical relationship between these variables
and inflation.
1.1.The currency, prices and inflation
The explanatory theory of the determinants of the general level of the prices rests on three pillars[G. N. MANKIW, 2003,
pp.104]:
• The factors of production determine the level of production Y;
• The money supply determines the nominal value of the PY production;
• Therefore, the price level P is none other than the ratio of the nominal value of the production PY to the level of
production.
In other words, the productive capacity of an economy determines real GDP, the quantity of money determines nominal GDP,
and the GDP deflator is the ratio of nominal GDP to real GDP. This theory explains what happens when the central bank
modifies its money supply. Since the speed of circulation is assumed to be constant, any change in the money supply induces a
proportional change in nominal GDP. Since the factors of production and the production function have already determined real
GDP, the change in nominal GDP necessarily represents a change in the level of prices. As a result, the quantitative theory
implies that the price level is proportional to the money supply. Since the inflation rate is the percentage change in the price level,
this price level theory is also a theory of the rate of inflation. Indeed, the quantitative theory of the currency establishes that the
Central Bank, which controls the supply of money, controls the same fact, as a last resort, the rate of inflation. If the Central
Bank presents the stability of the money supply, the price level will also be stable. If the Central Bank is rapidly increasing the
stock of money, then the price level will also increase rapidly. For this purpose, Mankiw presented a model on the impact of
current and even future money supply on the price level. We propose to present it below to better understand the quintessence of
the relationship. To the extent that the amount demanded of real cash balances depends on the cost of holding these cash
balances, the price level is dependent on the supply of money both contemporary and future. To avoid mathematical
complications, we posit that the money demand function is linear in the natural logarithms of all variables. The money demand
function is: mt – pt = y(Pt+1 – Pt) (1)
With:
• mt: is the logarithm of the quantity of money at time t,
• pt: is the logarithm of the price level at time t,
• y: is a parameter that governs the sensitivity of money demand to the rate of inflation.
By the property of logarithms, mt - pt is the logarithm of real money balances and (pt + 1 - pt) is the rate of inflation between
period t and period t + 1. This equation shows that if inflation increases by one percentage point, the real money holdings
decrease by y%. The expression presented above is based on a series of assumptions. First, the level of production is excluded as
a determinant of money demand, which amounts to assuming it constant. Moreover, by including the inflation rate in the
equation rather than the nominal interest rate, we assume the constant real interest rate. In addition, by incorporating actual](https://image.slidesharecdn.com/ijsred-v2i1p13-190128124907/85/IJSRED-V2I1P13-3-320.jpg)
![International Journal of Scientific Research and Engineering Development-– Volume 2 Issue 1, Jan-Feb 2019
Available at www.ijsred.com
ISSN: 2581-7175 ©IJSRED: All Rights are Reserved Page 98
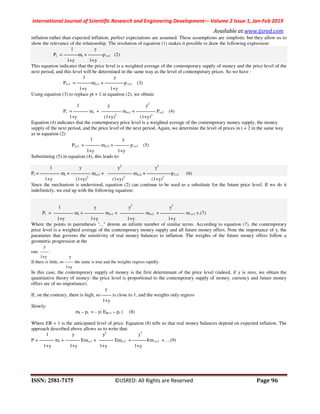
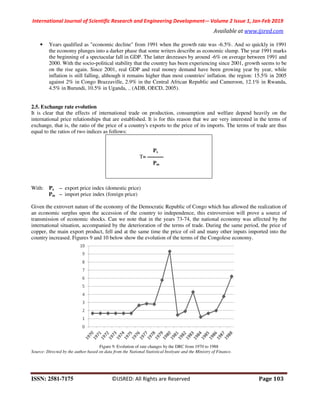
The Democratic Republic of Congo has experienced periods of very marked inflation, where we have reached
three-digit inflation, while for other periods this rate has been double-digit. For a good graphic presentation, we split
the period in two to present this evolution. As can be seen in Figure 1, moderate growth was observed between 1980
and 1983. This rate averaged 9.875%. However, from 1983 an accelerated increase is observed because the rate goes
from 24,5% in 1983 to reach 36,8% in 1990. This situation could be attributed on the one hand to the measures of
zairianization and on the other hand the oil price shock that led to the rise of certain inputs. In 1990 there was a
significant fall in the rate of inflation as this rate rose from 99% to 36.8%. From this period there is a relative stability
but this one does not last long because in 1993 this rate reaches 100,8%. From 1993, SAPs are introduced, Zaire
moves to a flexible exchange rate regime. The economy responded positively to these reforms. Growth picked up and
the inflation rate dropped from 77% in 1993 to 24% in 1995. But by the end of 1996, an increase in public spending
was derailing the adjustment programs and some of the liberalization policies were revised. In June 1999, with the
help of the IMF, the government made one last effort to stabilize the economy. However, inflation fell slightly. We
also note that for the Democratic Republic of Congo, the 90s of the 20th century was the most disastrous with regard
to the rate of inflation. Because this period is characterized by 4-digit inflation. Indeed it is a period characterized by
a strong political instability, looting and destruction of economic growth. High budget deficits were observed and
their financing was carried out either by external debt or by monetary creation. The foreign debt has dominated and
House for which this country is so indebted. For example, there are various unsuccessful monetary reforms that will
increase hyperinflation. Between 1990 and 1994, the rate rose from 264.9% to 9796.9%, or an annual average of
5030.9%. In 1997, with the rigor of the new government, we managed to stabilize this rate at 13.7%. But with the
resumption of the civil war, this rate will quickly reach 134.8% in 1998 and 511.2% in 2000. It is from 2001 that the
country knows a relative political and economic stability. The inflation rate dropped again until 2005.
2.2. Evolution of the Budget deficit in the DRC
The budget deficit is the overtaking of the final budgetary expenses (civil expenses, ordinary and in capital, military
expenses) on the fiscal resources and assimilated [Silem. , Op. Cit., p.227]. The public deficits are the expression, for
the public centers of decision, of an excess of expenses compared to the final receipts[Abraham-Frois, Op. Cit. , p.
113]. We will not be able to visualize all the evolutions in a graph, to do this we are obliged to split into two periods.
Figure 3. Evolution of the budgetary deficit of the DRC during the years 1970 to 1988
Source: Directed by the author based on data from the National Statistical Instiyute and the Ministry of Finance.](https://image.slidesharecdn.com/ijsred-v2i1p13-190128124907/85/IJSRED-V2I1P13-6-320.jpg)
![International Journal of Scientific Research and Engineering Development-– Volume 2 Issue 1, Jan-Feb 2019
Available at www.ijsred.com
ISSN: 2581-7175 ©IJSRED: All Rights are Reserved Page 99
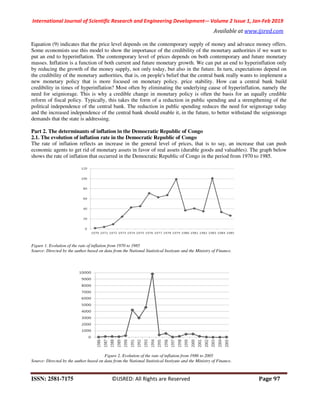
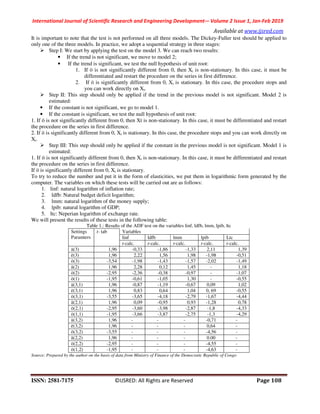
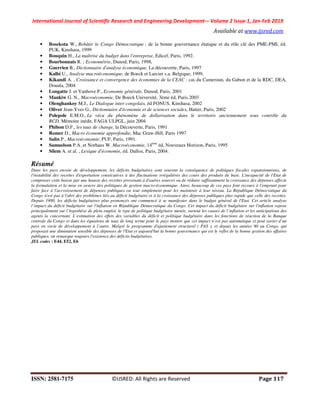
Figure 4. Evolution of the budgetary deficit of the Democratic Republic of Congo during the years 1989-2005
Source: Directed by the author based on data from the National Statistical Instiyute and the Ministry of Finance.
As we see in figures 3 and 4 presented above, the Democratic Republic of Congo has always had budget deficits.
The management of Public Finances is the Achilles tendon of the Congolese economy. The volume of net claims on
the state regularly exceeds 92% of the total money supply. Only about 5% is spent on credit to the economy.The
situation of this aggregate is complicated by the fact of the commitment and the execution of the expenses without
really worrying about the budgetary receipts. The rate of coverage of expenditure by ordinary revenue hardly exceeds
20%, the rest being pure inflation financed by the monetary emissions which unbalance the currency and the market
of goods and services. Expenses increase by 2800% from one year to the next.
The decline in contribution revenues is due to the sluggishness of the economy following looting in late 1991 and
early 1993, which led to the destruction of the production tool and the shutdown of several sectors of activity. It is
enough to observe the evolution of GDP growth rate to be convinced. Despite this sluggish revenue spending has
picked up, especially the wage heading that running costs that tend to align with the development of inflation. Hence
the unpredictability of the erosion of purchasing power leading to incessant wage demands[Bakumanya B.-M., 2008,
pp. 61-63]. This state of affairs seems to indicate the impossibility of a balanced management of public finances
without the prior revival of domestic production based on the restoration of favorable conditions for private
investment. To cope with the many public spending expenses, the government derives resources from taxes. Faced
with the challenge of keeping the budget balance, the government finds it impossible to balance their expenditures
with the revenue from different taxes, which usually implies a budget deficit. It is observed in the developing country
where the system of tax collection, where institutions and capital markets are less developed, the fiscal imbalance is
often the basis of inflation and hyperinflation. Through the figures above, we were able to visualize how the budget
deficit of the Democratic Republic of Congo has changed.
2.3. Evolution of the money supply in the Democratic Republic of Congo
The money supply is a monetary aggregate that is usually assimilated to M2, that is to say, to the set of claims
constituted by money supply (M1) and quasi-money (M2-M1). However, the notion remains very constraining for the
specialists who then consider the money supply like all the credits likely to be controlled by the central
bank[KISONIA M., Op. Cit., pp.36-38]. The definition of money supply is an accounting definition that falls within
the nomenclature conventions. The money supply as currently defined by the European Central Bank (ECB) includes
liquid assets that are likely to be converted immediately into a currency without significant risk of capital and
therefore represent potential means of payment that can be realized, without any effect. loss of value or surplus value.
The decomposition of the money supply into aggregates M1, M2, M3 is based on the greater or lesser ease of
conversion into money of their components. This induces a more or less stable holding behavior of these assets by
non-financial agents. The current classification of the elements of the money supply thus no longer refers as the
classifications prior to 1986 to the banking or non-banking constitutional status of issuing financial intermediaries but
to the monetary and financial behavior of non-financial agents[BERNIER et al. , ed. Dunod, 2001, pp.23-25]. The
evolution of the money supply in the Democratic Republic of Congo is represented by the following graph which will
be divided into two graphs due to space:](https://image.slidesharecdn.com/ijsred-v2i1p13-190128124907/85/IJSRED-V2I1P13-7-320.jpg)
![International Journal of Scientific Research and Engineering Development-– Volume 2 Issue 1, Jan-Feb 2019
Available at www.ijsred.com
ISSN: 2581-7175 ©IJSRED: All Rights are Reserved Page 100
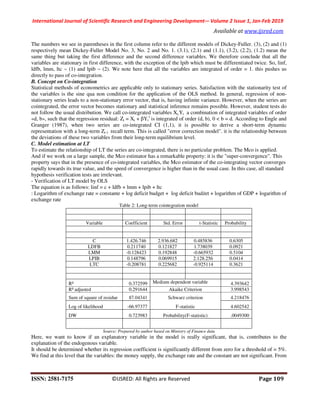
Figure 5. Evolution of the monetary mass of the Democratic Republic of Congo from 1970 to 1985
Source: Directed by the author based on data from the National Statistical Instiyute and the Ministry of Finance.
Figure 6. Evolution of the monetary mass of the Democratic Republic of Congo from 1986 to 2005
Source: Directed by the author based on data from the National Statistical Instiyute and Ministry of Ministry.
The Congolese monetary situation remains marked over the past decade as before by an increasing trend in the
nominal money supply. This instability of the monetary situation has been strengthened, to a large extent by the
weakening of public authority in the aftermath of independence. The changes in the democratic process that began in
1990 were accompanied by lax budget management, which enshrined the monetization of the budget deficit. The
money supply then experienced an evolution at nominal growth rates exceeding any level compatible with the
monetary stability requirements to which the authority in charge of monetary policy in any modern economy is held.
This meteoric rise is certainly not unrelated to the mode of financing to which the State has practically accustomed
for more than 15 years. The repercussions of such an evolution have been disastrous on the general level of the
domestic prices of the goods and services whose increase has significantly reduced the purchasing power of the
consumers if not the consumption itself [LONGATTE and al. , Ed. Dunod, 2001, pp. 40-41]. The evolution of real
M1 saw a slight decrease from 1994 to 1997, then a stability from 1998 to 2000 and a rise from 2001 to 2004. The
evolution of real M2 was almost similar, but since 1996, it has experienced a up to 2005. During this period, we
witnessed the rapid disinflation program, with in the foreground the non-use of money creation to finance the public
deficit. Thus it may be noted that the theses of the quantitative theory of money which link inflation to the growth of
the quantity of money would not be far from being corroborated for the case of the Democratic Republic of Congo.](https://image.slidesharecdn.com/ijsred-v2i1p13-190128124907/85/IJSRED-V2I1P13-8-320.jpg)
![International Journal of Scientific Research and Engineering Development-– Volume 2 Issue 1, Jan-Feb 2019
Available at www.ijsred.com
ISSN: 2581-7175 ©IJSRED: All Rights are Reserved Page 101
2.4. The gross domestic product
The gross domestic product is a measure of domestic production[Bofoya , 2001, p.3], that is, of all goods and services
produced in a given period (usually the year). GDP is closely related to the notion of value added. It represents two
components: market and non-market. It can be evaluated at current prices or at constant prices[Bernier et al. , ed.
Dunod, 2001, p.28]. We will divide it on two graphs.
Figure 7. Evolution of the monetary mass of the Democratic Republic of Congo from 1970 to 1985
Source: Directed by the author based on data from the National Statistical Instiyute and the Ministry of Finance
Figure 8. Change in exchange rate of the Democratic Republic of Congo from 1989 to 2005
Source: Directed by the author based on data from the National Statistical Instiyute and the Ministry of Finance.
The gross domestic product is the main measure of domestic production. Built on a criterion of territoriality, its
calculation consists in adding the productions of all the resident, national or foreign economic units. French national
accounts distinguish between market and non-market productions. Market production is the production that is usually
traded on a market. Non-market output is obtained from factors usually traded on a market and is sold at a price that
is at least less than half its production cost. It consists essentially of services rendered by the authorities for free or
almost. Market output of firms is measured by their added value, the difference between the value of goods and
services produced and the value of goods and services purchased from other firms. As the added values are recorded
without taxes, the calculation of the PIB at the market price is obtained in the following way[Kikandi K., 2004, pp.
19-22].](https://image.slidesharecdn.com/ijsred-v2i1p13-190128124907/85/IJSRED-V2I1P13-9-320.jpg)
![International Journal of Scientific Research and Engineering Development-– Volume 2 Issue 1, Jan-Feb 2019
Available at www.ijsred.com
ISSN: 2581-7175 ©IJSRED: All Rights are Reserved Page 102
Market GDP = Sum of value added of resident enterprises + VAT + Customs
duties.
Merchant GDP = Sum of value added of resident enterprises + VAT + Customs duties.
By deducting consumption of fixed capital from GDP, ie the economic depreciation of capital goods, we obtain the
net domestic product (PIN). The definition of production adopted by the national accounts eliminates domestic
activities and the underground economy. On the other hand, it includes non-market output, which can not be
measured at its cost of production, mainly wages and salaries.
GDP = market GDP + non-market GDP
Over time, the weight of non-market output increased in total output at the expense of market output. Today non-
market production accounts for about 17% of GDP[Mabi Mulumba, 2001, pp.126-128]. By analyzing the Congolese
economy brings out four economic cycles since 1965, namely[Silem A. et al. , 2004, pp. 92-93]:
• The years of growth of 1965-1973 with an average real rate of 7%. This period is characterized by an
expansion of the order of 7% on average. Like most African countries, this growth is driven by favorable
prices for commodities such as copper, cobalt, diamonds and other commodities (agricultural products) on
which the country is dependent. External dependence predisposes the Democratic Republic of Congo to
global market turmoil. It is therefore not a coincidence that these years have been supported by a good level
of copper on the world market, especially since the economy is concentrated on the export of commodities
and more particularly copper from which 60 % of export earnings. In 1973, the Congolese economy was
declining as a result of the downturn in world economic conditions and a decline in the term of trade of
around 8%: copper and cobalt prices fell on the one hand and oil prices and other imported inputs rose,
precipitating the economy into another phase;
• The crisis years of 1975-1982, characterized by an annual GDP growth rate of 1.9% on average. In the
absence of adjustment of economic policy to remedy the deterioration of the terms of trade, the combination
of the fall in copper prices and the rise in the price of oil will cause successive imbalances in the balance of
payments. Budget deficits are taking place and will be financed by a strong expansion of domestic credit
followed by external indebtedness. These deficits and especially their mode of financing will fuel the
inflationary process. The GDP denominates substantially as it appears in the figure above. While Congo's
GDP was about twice as much as the Ivory Coast or Cameroon in 1970, ten years later these countries
doubled their GDP catching the Democratic Republic of Congo and even exceeding it;
• The years of structural adjustment of 1983-1990 where the annual growth rate of the GDP was on average
barely 0.8%, If the presence of the International Monetary Fund and the World Bank is perceptible since the
end of the 70s in the Democratic Republic of Congo it was in fact in 1983 that structural adjustment
programs were applied in order to positively influence the trend of the Congolese economy[Olenghankoy,
2002, pp.102-103]. During this period we observe a modest growth due to the relatively strict corset of the
recovery measures imposed on the Congolese economy. But as the growth observed during this period results
from the measures dictated by the external environment without benefiting from a sincere adherence
emanating from within, they could only temporarily calm the situation.](https://image.slidesharecdn.com/ijsred-v2i1p13-190128124907/85/IJSRED-V2I1P13-10-320.jpg)
![International Journal of Scientific Research and Engineering Development-– Volume 2 Issue 1, Jan-Feb 2019
Available at www.ijsred.com
ISSN: 2581-7175 ©IJSRED: All Rights are Reserved Page 104
Figure 10. Change in exchange rate of the DRC from 1989 to 2005
Source: Directed by the author based on data from the National Statistical Instiyute and the Ministry of Finance.
The determination of the exchange rate first reflects the equilibrium of the money market. Moreover, developed
during the 1970s, in particular by Franklin [Abraham-Frois G. et al., 2002, pp. 73-74], the monetary theory of
exchange is within the framework of the flexible exchange rate regime. The starting point for monetary reasoning is
demand, considered the most stable and important macroeconomic relationship. This function depends, in a classical
way, on income, prices and interest rates.
M = P. (Y, i) et M*=P*. L (Y*, i*)
Where: ‒ M and M* are the stocks of domestic and foreign currency,
‒ P and P* the general level of domestic and foreign prices,
‒ Y the level of real income
‒ i the interest rate
‒ L ( ) the demand function of actual balances.
The determination of the exchange rate is thus explained by the relative changes between countries in the
monetary masses, real incomes and interest rates. The exchange rate, which is the relative price of currencies, is
determined by the money supply which is controlled by the monetary authorities on the one hand, and by the
behavior of the holders of cash on the other hand. It appears that for given interest rates and real incomes, the rate
of depreciation of the currency is equal to the difference between the growth rates of the money supply. The
evolution of the exchange rate in the Democratic Republic of Congo has always followed since 1975, the trend of
the rate of inflation of the national currency, due largely to the financing of budget deficits by the uncalculated
increase of the money supply. Given that the different prices on the market are denominated in currencies (US
dollars), the depreciation of the exchange rate has an impact on prices. Mismanagement in the practice of
exchange rate policy has been the basis of distortions in the functioning of the economy as a whole. Since 1973,
instead of allowing the exchange rate to be fixed according to market forces, as required by the flexible exchange
rate system, the monetary authorities have been engaged in administering the exchange rate, which has led to the
introduction of a rate of exchange. exchange rate, reflecting the reality of the market[Bakandeja wa Mpungu G.,
2002, pp.3-4]. Thus, following the fixed exchange rate regime, we see the same exchange rate over a longer
period.
As can be seen, the immediate result of these distortions has been, on the one hand, the development of the
informal economy and, on the other hand, the recording of a shortfall in the revenues of the state budget. In](https://image.slidesharecdn.com/ijsred-v2i1p13-190128124907/85/IJSRED-V2I1P13-12-320.jpg)
![International Journal of Scientific Research and Engineering Development-– Volume 2 Issue 1, Jan-Feb 2019
Available at www.ijsred.com
ISSN: 2581-7175 ©IJSRED: All Rights are Reserved Page 105
addition, the floating exchange rate system adopted by the Democratic Republic of Congo since 1983 has not
yielded the expected results in terms of holding the currency. Practiced in an environment characterized by the
shortage of foreign exchange and where there is a strong propensity to import, this system has liked speculation
on the currency and thus favored the rise in prices linked to expectations on the evolution of the exchange rate on
the part of economic operators. It should be noted that the DRC's international trade has never been in a good
position, due to the non-competitiveness of domestic prices in the face of foreign prices. It should be noted,
however, that the Democratic Republic of Congo only exhibits raw products, which have not undergone any
processing, but imports the same products because they have undergone a transformation and therefore with
certain added value. From 1988 we are seeing a resulting improvement in the double effect of an increase in
copper and cobalt production, followed by their better prices on the international market. But with the budget
deficit as well as the precariousness of the service of the public debt, the term of the exchange will not tend to
shake overnight.
Part 3. Empirical estimation of the relationship between inflation and budget deficit
This part of the work is devoted to the focus of this study. He proceeds to the statistical analysis of the variables
studied and to the estimation of his model as well as the economic interpretation. Finally, proposals for economic
policies will be made with a view to achieving a desirable level of inflation in the Democratic Republic of Congo.
Note that the econometric estimation of the long-run model by the Ordinary least squares method (OLsM) is done
here using software E.
3.1. Methodological approach to analysis
The methodology of data processing and analysis has been econometric, especially since the variables taken into
account are quantifiable and the series is chronological. We selected some variables that explain the evolution of the
Congolese economy in terms of growth. Since our interest is focused more on the impact or consequence of budget
deficit on inflation in the Democratic Republic of Congo, we are part of the variables that characterize inflation in the
Democratic Republic of Congo[Bahekwa A.M., 2005, pp. 112-114]. We have brought together theory in relation to
inflation and its causes in a general way and particularly of the Democratic Republic of Congo. We have talked about
inflation, the various variables, including budget deficits, money supply, gross domestic product and the exchange
rate, before representing their evolution on charts. The data in relation to these variables were taken from the World
Bank's ROOM CD, we considered the period from 1970 to 2005. These data were processed by the software Eviews
5.0 used in econometrics. Eviews 5.0. is a version of Eviews software that can process time series data on the
computer. We have inserted the collected data, the software has processed them and developed an estimate of the
equation of our model; this allowed to successively identify the progressive approximations tested and also of this
equation towards a most expressive model of the meaning of the variables. To present the model, we started from the
DFA (Enhanced Dickey-Fuller) test, that is ADF in English (Dickey-Fuller augmented) which enabled us to detect
the stationarity of the variables before making the estimation of the model. It involves testing hypotheses based on
quantified observations of reality and measuring the relationships that may exist between the different variables.
3.2. Presentation of the study model
Concept on the model
A model is a presentation of a theory which takes the form of a set of hypotheses on the relations which links the
variables chosen by the one who constructs it and which supposes links of causality between it[Bosekota, 1999, p. 175
].
It is a formal presentation of a phenomenon in the form of equations whose variables are economic quantities. Thus
any model is inevitably an implication of the reality by which one seeks to seize the fundamental features of the
system[Silem A. et al. , 2004, p. 137] .
The model usually has two kinds of ingredients:
• A set of equations that express the supposed links between the variables;
• A classification in two categories of the variables retained by the model: the endogenous variable and the
exogenous variable (s).
In general, a model comes from a theory that assumes a causal link. One of his aims is to simplify the theory in
order to check its coherence. It is thus necessary to test the validity of a theory by confronting the facto [Avon D.](https://image.slidesharecdn.com/ijsred-v2i1p13-190128124907/85/IJSRED-V2I1P13-13-320.jpg)
![International Journal of Scientific Research and Engineering Development-– Volume 2 Issue 1, Jan-Feb 2019
Available at www.ijsred.com
ISSN: 2581-7175 ©IJSRED: All Rights are Reserved Page 106
2004, pp. 34-36] . In econometric language, the set of equations of a model as derived from the theoretical
literature is called the structural form of this model. To be explicit this form must be specified. Our model is a
multiple regression of the form:
logYt = a0 + a1logX1 + a2logX2 + a3logX3 + a4logX4 + ut
Where:
• Yt: ‒ Inflation rate
• X1 ‒ The budget deficyt
• X2 ‒ The money supply
• X3 ‒ The exchange rate
• X4 ‒ The GDP
• ut ‒ The error term
The coefficients a1, a2, a3, a4, are assumed positive.
There may be other variables that may explain the inflation we seem to ignore. Taking into account this hypothesis of
the ignorance of the other variables is found in the model by the introduction of the term of error ut. This model
relates the rate of inflation to the determinants of inflation such as budget deficit, GDP, exchange rate and money
supply. Inflation is considered to be the independent or explained variable while other variables are dependent or
explanatory. This relationship allows us to focus on the impact of fiscal deficit on inflation in the Democratic
Republic of Congo. The error term groups three types of errors[Bofoya, 2001, pp. 170-172]:
• An error of specification: that is to say the fact that the only explanatory variables are not sufficient to
account for the totality of the explained phenomenon;
• Measurement error: that is, the data do not accurately represent the phenomenon;
• A sampling fluctuation error: that is, one sample to another, the observations are slightly different.
Note also that the data used to estimate the GDP growth rate equation are mainly derived from the statistics of the
Central Bank of Congo and those of the World Bank. The study will be done with annual data.
3.3. Estimation of the analysis model
In this part, we proceed to the statistical analysis of the variables, in order to avoid a model estimation with a lot of
error. The use of time series leads to search for regularities in the past values of the series. We will begin by
explaining the estimation method.
A. Estimation method
There are several methods for estimating the parameters of a model: the ordinary least squares method, the maximum
likelihood method, the method of moments, ... The ordinary least squares method is often applied in the linear
adjustment . Drawing a graph on which the explained variable is plotted on the y-axis and the explanatory variable (s)
on the x-axis and linking the observation slices, we obtain a scatter plot which can be adjusted using a right. The
model parameters (or estimators) are obtained by minimizing the distance squared between each observation and the
line thus obtained, hence the name of ordinary least squares (OLS) estimators[Antonin, 1999, p.82]. Our sample
consists of one dependent or explained variable (the inflation rate) and four explanatory variables (budget deficit,
money supply, GDP and exchange rate), observed each over 36 years (from 1970 to 2005). We therefore have 36
observations for each of these variables.
B. Test of classical hypotheses of linear regression models
The estimated parameters are the subject of a number of classical assumptions[Guerrien, 1997, pp. 26-28]:
H1 : Xt values are observed without error;
H2 :E ( ) = 0;
H3: E ( ) = 0 (with j? 0); the errors are uncorrelated (or unrelated);
H4: E ( ) =, the variance of the error is constant (homoscedasticity)
H5: Cov (Xtk) = 0, the error is independent of the explanatory variables;
H6: The matrix (X'X) is regular and the inverse matrix (X'X) -1 exists;](https://image.slidesharecdn.com/ijsred-v2i1p13-190128124907/85/IJSRED-V2I1P13-14-320.jpg)
![International Journal of Scientific Research and Engineering Development-– Volume 2 Issue 1, Jan-Feb 2019
Available at www.ijsred.com
ISSN: 2581-7175 ©IJSRED: All Rights are Reserved Page 107
H7: (X'X) / T tends to a non-singular finite matrix;
H8: T > k +1, the number of observations is greater than the number of explanatory series plus the constant. The
violation of these classic assumptions is problematic. Assumptions H3 and H4 successively state that the errors are
uncorrelated (or independent) and that the error variance is constant (homoscedasticity). When H3 is violated, we are
therefore in the presence of autocorrelation of errors. The estimators remain unbiased but are no longer at minimum
variance.
3.3.1. Stationarity of variables
A. Variable concept
To proceed with the estimation of our model, we will first report the stationarity of the variables to be used. This is
necessary because economic and financial variables are rarely realizations of stationary processes[Kalhi U., Ed. de
Boeck, 1999, pp.17-19]. Non-stationarity may well concern hope than second-order moments. Dipuis Nelson and
Plosser[Romer, 1997, pp. 14-15], the cases of non-stationarity on average are analyzed from two types of processes: TS
process (trend Stationary) which represents the processes characterized by a non-stationarity of deterministic nature
and DS process (Difference Stationary) which represents processes whose nonstationarity is stochastic in nature. In
the first case, the data is marked by a general trend. It is then appropriate to introduce a Trend or a general trend in
the model; In the presence of the second case, if the orders of integration of the variables are different, it is necessary
to differentiate them in order to make them stationary. But to put in relation variables whose orders of integration are
different, without making them stationary, can only lead to false regressions or fallacious regressions. Indeed, the TS
and DS processes are characterized by very different behaviors and they should be distinguished. After a shock, a TS
process returns to its pre-shock level, whereas a DS process never comes back. It is therefore also understood that,
from an econometric point of view, the identification and characterization of non-stationarity is just as fundamental.
To do this, we will use the Dickey-Fuller (DF) test and the Augmented Dickey-Fuller (ADF) test.
A. Procedure and application of the stationarity test [ Phihon, 1991, pp. 75-76]
Dickey and Fuller consider three basic models for the Xt series, t = 1, 2,3, ... T:
1. Model [1]: model without constant or deterministic trend:
(1-ñL) Xt = åt
2. Model [2]: model with constant without deterministic trend:
(1 - ñL) (Xt-i) = å t
3. Model [3]: model with constant and deterministic trend:
(1 - ñL) (Xt - á - at) = å t
In each of the three models, we assume that åt is a white noise: ~, L is the delay operator; Xt is the variable whose
stationarity is tested; ñ, ì, á and â are parameters. If ñ = 1, it means that one of the roots of the delay polynomial is
equal to 1. We say that we are in the presence of a unit root. In other words, Xt is a non-stationary process and
nonstationarity is of a stochastic nature (DS process). We test the null hypothesis of unit root (Xt is integrated of
order 1, that is to say non-stationary) against the alternative hypothesis of absence of unit root (Xt is integrated of
order 0, c ' that is, stationary).
In practice, models are estimated in the following form:
1) Model [1]: Xt = öXt-1 + åt
2) Model [2] : Xt = öXt-1 + ã +åt
3) Model [3] : Xt = öXt-1 +ë+ät +åt
With for each model, ö = ñ - 1 and ~.
We then test the null hypothesis ö = 0 (non-stationarity) against the alternative hypothesis ö < 0 (stationarity) by
referring to the values tabulated by Fuller (1976) and Dickey and Fuller (1979, 1981). Since the critical values are
negative, the decision rule is as follows: If the calculated value of the t-statistic associated with ö is lower than the
critical value, we reject the null hypothesis of nonstationarity. If the calculated value of the t-statistic associated with
ö is greater than the critical value, we accept the null hypothesis of non-stationarity.](https://image.slidesharecdn.com/ijsred-v2i1p13-190128124907/85/IJSRED-V2I1P13-15-320.jpg)
![International Journal of Scientific Research and Engineering Development-– Volume 2 Issue 1, Jan-Feb 2019
Available at www.ijsred.com
ISSN: 2581-7175 ©IJSRED: All Rights are Reserved Page 112
To make the co-integration or error-correction model, two conditions must first be met:
1. All variables must be stationary integrated order = 1
2. Second it is necessary that the residue is stationary of order 0
Let us first mention that there are two techniques, the simplest and the most widespread estimation of an error
correction model (ECM):
• three-step method of Engle and Granger; which is required when working on a large sample (n =
30);
• Hildreth's method; which is often used when working on a small sample.
As part of our study, the first method will apply. In fact, it consists of estimating directly:
∆Yt = α0 +… + αi∆Xt=i … + β∆Yt=i + δε t=1+ ν
i=0 i=t
The coefficient δ (called restoring force towards equilibrium) must be both significant, systematically negative and
between 0 and 1 in absolute value. If not, the long-term correlation mechanism) would go either in the opposite
direction (if δ is positive) and away from the long-term target; either it would go in the same direction (if δ is
negative) by immediately exceeding the target that it is supposed to corrected progressively, and thus deviating from
it over time[Abraham-Frois G. et al., Ed. Dalloz, 2002, pp.58-61]. In practice and using the econometrics software
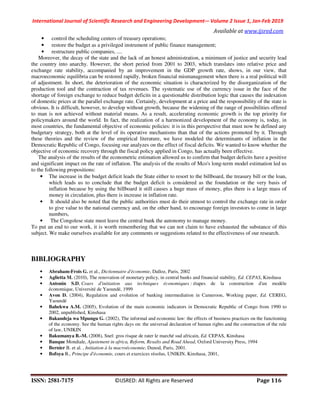
that is the Eviews, we found the following results in the table below:
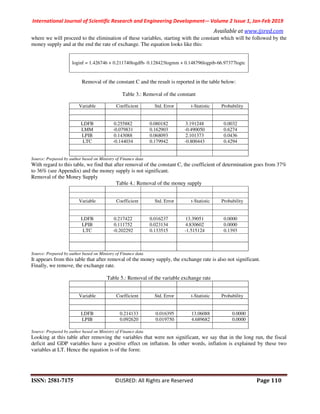
Table 7.: The first estimate of the CT model
Variable Coefficient Std. Error t-Statistic Probability
C 0.104674 0.164448 0.636516 0.5300
D(LDFB,1) 0.068457 0.068682 0.996729 0.3281
D(LDFB(-1),1) 0.008329 0.068145 0.122227 0.9037
D(LPIB,2) 1.121372 0.240880 4.655306 0.0001
D(LPIB(-1),2) 0.593423 0.317619 1.868352 0.0730
D(LINF(-1),1) -0.416173 0.227404 -1.830107 0.0787
RES(-1) -0.335244 0.125692 -2.667187 0.0130
R² 0.613566 Medium dependent variable 0.025352
R² adjusted 0.524389 Akaike Criterion 2.842391
Sum of square of
residue
21.68843 Schwarz criterion 3.159832
Log of likelihood -39.89945 F-statistic 6.880321
DW 2.180885 Prob (F-statistic) 0.000185
Source: Prepared by author based on Ministry of Finance data
As we proceeded in the long term, it is the same way here. We will gradually eliminate non-significant variables by
the method of the successive elimination. Start with the one that is less significant, at each step, we will eliminate the
variable whose contribution was less important. Finally, we retain the final regression when all the coefficients of the
regression were significant compared to a classical critical value.
Table 8.: Final result on the short-term model
Variable Coefficient Std. Error t-Statistic Probability](https://image.slidesharecdn.com/ijsred-v2i1p13-190128124907/85/IJSRED-V2I1P13-20-320.jpg)
![International Journal of Scientific Research and Engineering Development-– Volume 2 Issue 1, Jan-Feb 2019
Available at www.ijsred.com
ISSN: 2581-7175 ©IJSRED: All Rights are Reserved Page 113
D(LPIB,2) 0.761034 0.149293 5.097593 0.0000
RES(-1) -0.321895 0.097266 -3.309451 0.0023
R² 0.555208 Medium dependent variable 0.050480
R² adjusted 0.541308 Akaike Criterion 2.659134
Sum of square
of residue
25.27892 Schwarz criterion 2.748920
Log of
likelihood
-43.20528 DW
2.304354
Source: Prepared by author based on Ministry of Finance data
We see here that this final regression satisfies an important characteristic: the coefficient ñ (called restoring force
towards the equilibrium) associated with the error correction term εt-1 must be both significant, systematically
negative and included between 0 and 1 in absolute value. Let ñ = - 0.32
The model is explained at 55% at CT, that is to say that at LT these variables can not evolve together while at CT,
these variables can evolve together. Hence inflation is explained by GDP in the short term and its equation is as
follows:
loginf = 0,76log PIB - 0,32ut.
E. Macroeconomic impact of fiscal adjustment
It is essentially the way in which it is financed that determines to what extent a public sector deficit is reconcilable
with broader macroeconomic objectives.
The very uneven macroeconomic performance obtained by the Democratic Republic of Congo during the
adjustment reveals the importance of public finance management[Aglietta M., 2010, pp. 58-59]. The Congolese
government's choice to finance public deficits through monetary creation has led to a worsening of inflation. It
emerges that during the phase of strict application of the adjustment program in which the State has more or less
controlled its expenditures, the DRC has achieved good results, as it did between 1984-1986. During this period,
the combination of the various measures concerning the rationalization of expenditures and the maximization of
state revenues made it possible to reduce the budget deficit to 3.3% of GDP, compared to 2.1% over the same
period 1981-1983. This exceptional fiscal adjustment in the post-independence history of the DRC's public
finances has reduced the government's net recourse to domestic credit: 1.1% of GDP compared with 3% in the
previous period. As a result, the monetary counterpart had fallen significantly and inflation had stabilized at
40.6%. This macroeconomic performance will soon prove to be ephemeral because of the rapid deterioration of
public finances due to the cessation of the adjustment program in 1986, to 2.4% in 1987 to reach the record level
of 6.3%. in 1988. According to the criterion of the world bank [Olenghankoy M.J., 2002, pp.56-58], the
budgetary policy is judged:
• Good or satisfactory: if there is a budget surplus or if the overall budget deficit including grants represents
less than 1.5% of GDP,
• It is considered quite good: if the deficit is between 1.5 and 3.5%;
• it is considered bad: if the deficit is between 3.6 and 7.0%;
• and bad if the deficit is 7.1% or more.
To better inform the rest of our developments, we first give an overview of the technical or conventional problems
related to the design of tools for measuring fiscal imbalances.
1. The concept of budget deficit: meaning and measurement.
Budget deficits indicate how much public spending exceeds revenues and hence how much the budget is
increasing domestic demand. The quality of a fiscal policy is often measured in terms of budget deficits. One of the](https://image.slidesharecdn.com/ijsred-v2i1p13-190128124907/85/IJSRED-V2I1P13-21-320.jpg)

The document analyzes the impact of budget deficits on inflation in the Democratic Republic of Congo. It discusses how budget deficits are often caused by expansionary fiscal policies and unstable commodity prices in developing countries. The DRC has faced chronic budget deficits since 1980, as revenues have not kept up with rising expenditures. This has led the government to finance deficits through borrowing from banks and the central bank. Empirical analysis will estimate the effects of budget deficits and other fiscal variables on inflation in the DRC to determine the relationship between deficits and prices. The study covers the period from 1970 to 2005 and aims to provide insights to help economic growth.