
Recommended
Recommended
More Related Content
What's hot
What's hot (19)
Similar to Correlations of Students’ Academic Achievement in Mathematics with Their Error-Detection Abilities
Similar to Correlations of Students’ Academic Achievement in Mathematics with Their Error-Detection Abilities (20)
Recently uploaded
Recently uploaded (20)
Correlations of Students’ Academic Achievement in Mathematics with Their Error-Detection Abilities
- 1. ISSN 2349-7831 International Journal of Recent Research in Social Sciences and Humanities (IJRRSSH) Vol. 3, Issue 1, pp: (1-17), Month: January - March 2016, Available at: www.paperpublications.org Page | 1 Paper Publications Correlations of Students’ Academic Achievement in Mathematics with Their Error- Detection Abilities 1 Meng Kay Ling, 2 Dr. Casey Reason 1 Singapore, 2 Aspen University, United States of America Abstract: While there have been many researches done with regards to error analysis in mathematics, little is known about analysis of error detection abilities. It is necessary that mathematics educators understand the error detection abilities of the students so that appropriate instructions and materials can be given to the learners. In particular, this study investigates the error detection abilities of private school students in mathematics and the correlations with their written test results. A total of 41 private candidates who are reading mathematics sat for three written tests. The first test is an arithmetic test, which assesses the students’ understanding in number operations. The second test is on algebra, and the third test is an error detection test. The results from these three tests are consolidated and analyzed using Excel spreadsheets and a graphic calculator TI-84Plus. Statistical tools such as the regression line, the Pearson product-moment correlation coefficient and the reliability coefficient are used to analyze the data and evaluate the error detection instrument. At the end of the study, it is found that the academic performance of the students in mathematics is highly correlated to their error detection abilities. At the same time, it is also found that the designed error detection test is a reliable instrument which is suitable to predict the future success of a student in mathematics with some limitations. This study is part of a growing body of research on error analysis in mathematics. In using the largely untapped source of students studying in a local private education institution, this project will definitely contribute to future research on similar topics. Keywords: correlation, mathematics education, error-detection, error analysis, academic performance, achievements. 1. INTRODUCTION This project is an exploratory study to investigate the relationship between the academic achievement in mathematics and the error detection abilities of private schools’ students in Singapore. The hypothesis is that the stronger the error detection ability of a student, the better is his or her mathematic achievement. More specifically, this study focuses on (a) the relationship between private school students’ academic achievement in mathematics and their level of error detection abilities and (b) the possible teaching strategies and curriculums which can be developed to help to improve the error detection abilities of the students in mathematics. Two broad mathematics topics have been identified to analyze the error detection abilities of the students. They are: arithmetic and algebra. Arithmetic is chosen because it is the most elementary field of mathematics that students all over the world will learn. The basic concept of addition, subtraction, multiplication and division form the essential mathematical operations known to mankind. In almost every equation, graph, calculus and other important fields of mathematics, they can be disintegrated into the above four basic number operations. To put it simply, if mathematics is a type of language, then arithmetic will be the ABCs of mathematics.
- 2. ISSN 2349-7831 International Journal of Recent Research in Social Sciences and Humanities (IJRRSSH) Vol. 3, Issue 1, pp: (1-17), Month: January - March 2016, Available at: www.paperpublications.org Page | 2 Paper Publications Algebra is chosen because it is the fundamental building block for higher level learning in mathematics. Algebra essentially teaches people the skill of replacing an unknown value using a variable in problem solving. This is an extremely important technique which must be mastered before learning the more advanced mathematics topics. To carry out the research, the students are required to sit for two separate written class tests, one on arithmetic and the other on algebra. The difficulty levels of these two tests are equivalent to that of Grade 10 mathematics in American high schools. After the two written topical tests, a special error detection test is designed and administered to the students. This third test comprises arithmetic and algebra questions together with the solutions to the problems (Appendix C). Most of the solutions are intentionally modified to include errors in the workings. There are also solutions which are free of errors. For the error detection test, students are expected to go through all the questions and their solutions within a limited timeframe, and to detect as many errors as possible that are embedded in the solutions. The results of the error detection test are analyzed and compared with the two written class assessments on arithmetic and algebra respectively. Suitable recommendations and conclusions are subsequently drawn based on the correlational study of the test results. 2. DESCRIPTION OF THE RESEARCH DESIGN 2.1 The Research Methodology: The research methodology adopted for this study is a type of associational research called Correlational Research. In a correlational study, the researcher examines the relationships between two or more variables without attempting to influence them. This is unlike experimental research where the variables involved in the study are intentionally manipulated (Fraenkel & Wallen, 2009, p.328). There are two major purposes in a correlational study. The first purpose is to seek clarifications to our understanding of important relationships between variables. In this case, we are trying to find out the possible relationships between the error detection abilities of students and their academic achievements in mathematics. The second purpose is to carry out prediction studies. If a relationship of adequate power exists between two variables, we can establish a prediction equation to predict the result of one variable if the score of the other variable is available. In this project, it is possible for a teacher to use a prediction equation to predict the academic performances of the students in mathematics if their error detection scores are known (Fraenkel & Wallen, p.329 - 330). The basic design in a correlational study is relatively simple and straightforward. For this project, two variables have been initially identified. The first variable, R, is the combined scores of two written tests on arithmetic and algebra. The second variable, E, is the scores of an error detection test. The design outline for this project with the two variables is shown in Table 1 below. Table 1:Design for Correlational Study with two variables Student Combined Arithmetic & Algebra Test Results, R Error Detection Test Score, E A - - B - - C - - … - - etc - - Three scores are obtained from each individual student in the sample. The variable R comprises the combined scores of the arithmetic and algebra tests while the variable E represents the scores of the error detection test. The two variables are then correlated, and the final correlation coefficient will indicate the degree of linear relationship between them. For more detailed analysis, the above table can be modified into a table which consists of two portions, one for the arithmetic test results and the other for the algebra test results. In this case, there will be four variables under study. The modified table is shown below as Table 2.
- 3. ISSN 2349-7831 International Journal of Recent Research in Social Sciences and Humanities (IJRRSSH) Vol. 3, Issue 1, pp: (1-17), Month: January - March 2016, Available at: www.paperpublications.org Page | 3 Paper Publications Table 1: Design for Correlational Study with four variables Student Arithmetic Test Results, R1 Arithmetic Error Test Score, E1 Algebra Test Results, R2 Algebra Error Test Score, E2 A - - B - - C - - … - - etc - - As a result of this modification, the correlation relationships between the mathematic achievements and the error detection abilities of the students can be separately analyzed under arithmetic and algebra. However, there are two important points to take note while using correlational research methodology for the study. First, we cannot conclude that the variables being measured by the error detection test are the causes of the differences in the variables measured by the written tests (Fraenkel & Wallen, p.336). Generally, correlational research investigates the possible relationships between variables but it does not determine the cause or consequences of differences that already exist between the variables. Second, we must also take note that predictions to a reasonable degree of accuracy can only be done if the given value of one variable for the prediction of the other variable lies within the range of data that are used to develop the prediction equation. This is called interpolation. If the given value of one variable lies beyond the data range used to create the prediction equation, the prediction in this case is highly unreliable and inaccurate. This is commonly known as extrapolation. 2.2 Participants: Participants are students from a private college in Singapore (N = 41) who were enrolled into the GCE ‘O’ levels preparatory course. Data for the current study are collected in the first five months of their course. The students are distributed among three different classrooms, with some of them taking the GCE ‘O’ levels examinations the second time at the end of this year. 2.3 Procedures: This section addresses the procedures of how the project is carried out. The various steps, the time used in completing the steps and the resources used for each step are discussed below. The first step is the design of two written class tests for the students. The first test is on arithmetic and the second test is on algebra. The objective of the tests is to capture the levels of competency of the students in arithmetic and algebra. Both written tests have durations of one hour each, and are administered to 41 private school students. The students sit for the arithmetic test, and then subsequently the algebra test about one month after the arithmetic test. The second step is to design a special written error detection test based on the topics of arithmetic and algebra. The error detection test has duration of about 30 minutes and comprises 18 short questions. The first 8 questions are from arithmetic and the second set of 8 questions from algebra. All the questions will come with the solutions. For each solution, the working steps and the final answer may or may not contain errors. The students are encouraged to spot as many errors as possible in the test. After the administration of the error detection test, the third step is to analyze the test results. The analysis should aim to reveal the relationships between the academic performances of the students in the first two written tests and the number of errors detected by the students. Several tools are used to conduct the analysis. One instrument is the use of regression lines and the Pearson product-moment correlation coefficient to examine the possible linearity relationships between the variables (Fraenkel & Wallen, 2009, 247- 253). Another tool is the use of statistics such as means and percentages to study the averages. It is also possible to use hypothesis testing to examine the hypothesis stated at the beginning of this project proposal. The analysis work requires about two weeks. The final phase is the report writing. In the report, all the essential research findings are discussed. The discussions also include recommendations, project evaluations and possible future research. The report is type-written with the help of a word processor.
- 4. ISSN 2349-7831 International Journal of Recent Research in Social Sciences and Humanities (IJRRSSH) Vol. 3, Issue 1, pp: (1-17), Month: January - March 2016, Available at: www.paperpublications.org Page | 4 Paper Publications 2.4 Instruments: 2.4.1 The arithmetic and algebra tests: In order to capture the students’ level of academic achievements in elementary mathematics, two written tests are designed and administered. The duration for each test is one hour and the total score is 50 marks for each paper. The first test covers essential arithmetic topics such as prime factorization, real numbers, multiples and factors, fractions and decimals, approximation, proportionality, scales and maps, kinematics, interest rates as well as taxation. A sample of the test questions can be found under Appendix A. The second test covers the algebra topics such as algebraic manipulations, algebraic equations, solutions of quadratic equations and algebraic inequalities. A sample of the test questions can be found under Appendix B. The total scores for the two tests are added up to form the values for variable R, as identified under section 2.1 – The Research Methodology. Alternatively, the scores for the two tests can be kept separated as R1 and R2, so as to study the correlation between the error detection score of E1 and E2 respectively. 2.4.2 The error detection test: In order to obtain the error detection abilities of the students, an error detection test is constructed and administered. The test includes 18 questions, with the first 9 questions from arithmetic, and the rest from algebra. All the questions will come with the solutions. Most of the solutions will contain at least 1 error in them, but there are also a few solutions which are error-free. Students are allowed 30 minutes to complete the test. They are to identify as many errors as possible from the 18 questions. If a student feels that the solution has no error, he or she has to indicate that the solution has no error. At the end of the error detection test, a score E will be tabulated for each student. The variable E is then correlated with the variable R to determine any relationship between the mathematic academic performance of the students and their error detection abilities. For more detailed analysis, the error detection scores can be split into first half E1 and second half E2, to be correlated with R1 and R2 so as to determine the correlational relationships for arithmetic and algebra respectively. A sample of the error detection test is shown in Appendix C. 2.4.3 Validity and reliability of the error detection test: Validity in research refers to the correctness, suitability and usefulness of the inferences that researchers draw based on the information that they gathered using the instrument (Fraenkel & Wallen, p.148). There are basically three main types of evidences that a researcher can collect to establish validity of an instrument. They are: content-related evidence of validity, criterion-related evidence of validity and construct-related evidence of validity. To test for validity of the error detection test, the criterion-related evidence of validity is used. In this case, a validity coefficient, which is actually a correlation coefficient, is used as a key index to determine the validity of the instrument (Fraenkel & Wallen, p.152). Further details are provided in section 3.2. Instrument reliability refers to the degree in which an instrument is capable of consistently measures what it is supposed to measure (Carroll, n.d). This means that a reliable instrument, when administered multiple times under the same scenario on the same subject, should produce similar results. To test for reliability of the error detection test, the Cronbach’s coefficient alpha () can be used. The formula to calculate is given as 2 2 1 1 sum i s s k k , where k denotes the number of individual items, 2 is represents the variance for the k individual items and 2 sums represents the variance for the sum of all items (Statsoft, 2012). An alternative method to assess the reliability of the instrument is an internal-consistency method called the split-half procedure. This involves separating the scores of the error detection test into two halves (usually the odd-number items versus the even-number items) and then calculating the correlation coefficient, r, for the two set of scores. The reliability coefficient can then be calculated using the Spearman-Brown prophecy formula as follows: r r tCoefficienliability 1 2 Re (Fraenkel & Wallen, p.156). With 1.00 as the perfect score, a reliability coefficient value of more than 0.70 indicates a reliable instrument. Further details about the use of the reliability coefficient are found in section 3.2.
- 5. ISSN 2349-7831 International Journal of Recent Research in Social Sciences and Humanities (IJRRSSH) Vol. 3, Issue 1, pp: (1-17), Month: January - March 2016, Available at: www.paperpublications.org Page | 5 Paper Publications 2.5 Threats to Internal Validity in Correlational Research: When conducting research, the various threats to internal validity for the study must be addressed. All the extraneous variables, which may possibly explain away the experimental results, need to be eliminated as much as possible (Fraenkel & Wallen, p.337). This should be one of the main concerns of researchers. In a correlational study, the researcher should always pay attention to other variables which may provide alternative explanations to the relationships found in the collected data. The following discussions highlight five of the threats to internal validity for this project, and the evaluation of the likelihood of the threats having effects on the results of the study unless they are controlled. 2.5.1 Location Threat: A location threat to internal validity in a correlational study is common when the same test instrument is administered at locations with slightly different conditions. This can lead to the situation where it is the conditions, rather than the variables being studied, that are accountable for the relationship (Fraenkel & Wallen, p.339 - 340). For the private college in this study, the location threat to internal validity is not a serious issue. This is because most of the classrooms are constructed with very similar conditions such as proper air-conditioning, bright lightings, carpeted floor, comfortable chairs and tables. All the students who are involved in the study will sit for the test under similar conditions. 2.5.2 Instrumentation Threat: Under this threat, there are three areas for consideration: the decay of instrument, the characteristics of the data collector and the biasness of the data collector (Fraenkel & Wallen, p.340). The decay of instrument generally happens when the instrument is being used many times or being used over a prolong period of time. This may render different test scores. For this project, to avoid instrument decay, the students are supposed to complete each of the three written tests (the arithmetic test, the algebra test and the error detection test) within a timeframe of four days. The characteristic of the data collector can also pose a threat to the validity of the experimental results if different people administer the three written tests. For the project, in order to avoid this threat to internal validity, only a maximum of two teachers are involved in administering the three written tests. The biasness of the data collector has always been a threat to internal validity. It is almost impossible to avoid the expectations that have been established based on the results of the first test, and this may well affect the behavior of the examiner on the second or even the third test. For example, if a particular group of students from the sample have done well for the arithmetic test, the teacher may have the tendency to give extra time or additional help to the same group of students on the second or third test. Although the solution to this threat is to use different administrators for each of the three tests (Fraenkel & Wallen, p.341), it is difficult to avoid this threat for the project as only a maximum of two teachers are involved in the study. 2.5.3 Subject Characteristics Threat: When two or more characteristics of a group or individuals are correlated, there is a possibility that the relationships may be explained due to influences from other characteristics (Fraenkel & Wallen, p.338). For this project, although the study is on the correlations between the mathematic academic achievements and the error detection abilities of the students, the relationships may be affected by other subject characteristics. One example is the socioeconomic level of the parents. Parents’ socioeconomic status is likely to be related to the academic mathematic achievements of the students. However, parental socioeconomic status is not likely to be related to the error detection abilities of the students. Although it is desirable to obtain the socioeconomic data from the sample, it is not of high importance. Therefore, the likelihood of such threat of having an effect on the result of the study if not controlled is not high. Another example is the mathematical background of each student. Before the students were enrolled into the college, they have to satisfy the minimum entry requirements. Most of the students enrolled have acquired similar basic mathematics education.
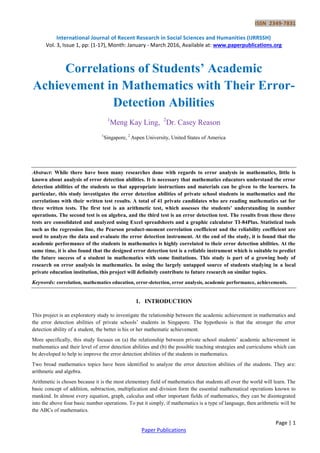
- 6. ISSN 2349-7831 International Journal of Recent Research in Social Sciences and Humanities (IJRRSSH) Vol. 3, Issue 1, pp: (1-17), Month: January - March 2016, Available at: www.paperpublications.org Page | 6 Paper Publications 2.5.4 Testing Threat: This threat refers to the experience of responding to the first instrument which may affect the subject’s responses to the second or even the third instrument. In this project, the students’ experiences in sitting for the arithmetic test may possibly affect their responses to the algebra test or even the error detection test. The solution is to administer the instruments at different times (Fraenkel & Wallen, p.341). For this study, the arithmetic and algebra tests are administered about one month apart, while the error-detection test is administered about half a month after the algebra test. 2.5.5 Mortality Threat: The mortality threat is not really a problem to internal validity for correlational studies. This is because we usually require two set of data in order to construct the scatter plot and the prediction equation. In this case, any student who does not sit for all the three written tests will automatically be omitted from the sample. 3. DISCUSSIONS OF RESEARCH FINDINGS AND RECOMMENDATIONS 3.1 Research Findings: Although a total of 78 test results were collected for the first written arithmetic test, the final usable values which formed the sample size were only 41 results (Appendix D). This was because to qualify as part of the sample, a student must sit for the arithmetic test, the algebra test as well as the error detection test. As many students did not turn up for the algebra test and the error detection test, the sample size was reduced to only 41. Nevertheless, data analysis has revealed some interesting results as discussed below. Using the consolidated results of the two written tests, R and the total error detection test scores, E, a scatter plot was constructed as shown in fig 1. Without calculating the prediction equation (regression line) or the product-moment correlation coefficient (pmcc), there was an apparent upward sloping trend between the two sets of data. The initial analysis showed that for students who scored well in the error detection test, they tend to perform better in the actual written tests in arithmetic and algebra. A more detailed analysis between R and E was conducted with the inclusion of the regression line in the scatter plot (fig 2). With the help of the graphing calculator, TI-84 plus, the regression line of R on E was calculated as R = 4.523 E + 15.435, and the pmcc was approximately +0.800. With pmcc value calculated as +0.800, it implied that there was a strong positive linear correlation between the variables R and E. This is in line with the initial hypothesis that the stronger the error detection ability of a student, the better is his or her mathematic achievement. This also meant that the regression line of R on E can be used to a reasonable degree of accuracy in predicting the written test score of a student based on his or her error detection test result. 0 20 40 60 80 100 120 0 2 4 6 8 10 12 14 16 Error Detection Test Score E WrittenTestScoreR Fig 1: Scatter Plot of R against E
- 7. ISSN 2349-7831 International Journal of Recent Research in Social Sciences and Humanities (IJRRSSH) Vol. 3, Issue 1, pp: (1-17), Month: January - March 2016, Available at: www.paperpublications.org Page | 7 Paper Publications Fig 2: Scatter Plot and Regression Line of R against E Further analysis was done by splitting the data into two groups. The first group comprised the arithmetic test scores of samples, R1, and the scores from arithmetic components in the error detection test, E1. The second group contained the test results from the written algebra test, R2, and the scores from the algebra components of the error detection test, E2. With the data of R1 and E1, another scatter plot was constructed as shown in fig 3. Surprisingly, the upward sloping trend that was observed in fig 1 was not that obvious in this scatter plot. There were multiple dots that appeared vertically above each error detection test score. This meant there were more students with a wider range of written test scores in the arithmetic test who obtained the same score in the arithmetic components of the error detection test. 0 5 10 15 20 25 30 35 40 45 50 0 1 2 3 4 5 6 7 8 Error Detection Test Score E1 WrittenTestScoreR1 Fig 3: Scatter Plot of R1 against E1 Further analysis was done with the regression line of R1 on E1 derived and inserted into the scatter plot as shown in fig 4. The pmcc value between R1 and E1 was also calculated. In this case, the pmcc exhibited a weaker positive linear correlation between the two variables R1 and E1, with a value of only +0.680. This implied that if the students are weak in arithmetic, it may not necessary be due to poor error detection abilities in the topic. Also, the use of the regression line of R1 on E1 for prediction studies has to be done with caution. 0 20 40 60 80 100 120 0 2 4 6 8 10 12 14 16 Error Detection Test Score E WrittenTestScoreR Regression line of R on E: R = 4.523 E + 15.435
- 8. ISSN 2349-7831 International Journal of Recent Research in Social Sciences and Humanities (IJRRSSH) Vol. 3, Issue 1, pp: (1-17), Month: January - March 2016, Available at: www.paperpublications.org Page | 8 Paper Publications Fig 4: Scatter Plot and Regression Line of R1 against E1 A similar analysis was done to the second group of data, which contained the test results from the written algebra test, R2, and the scores from the algebra components of the error detection test, E2. The scatter plot of R2 against E2 was constructed as shown in fig 5 below. Similarly, the upward trend appeared to be weaker than that of the scatter plot in figure 1. However, it can be observed that in general, as the values of R2 increased, the values of E2 also got higher. 0 10 20 30 40 50 60 0 1 2 3 4 5 6 7 8 9 Error Detection Test Score E2 WrittenTestScoreR2 Fig 5: Scatter Plot of R2 against E2 Upon further analysis, the pmcc between the variables R2 and E2 has a value of +0.704. This value implied that the variables R2 and E2 have a fairly weak linear correlation. This correlation value was only slightly stronger than that between R1 and E1. This would also mean that the regression line of R2 on E2: R2 = 4.159 E2 + 4.595, has to be used with caution for prediction purposes due to the fairly weak linear correlation between the two variables. 0 5 10 15 20 25 30 35 40 45 50 0 1 2 3 4 5 6 7 8 9 Error Detection Test Score E1 WrittenTestScoreR1 Regression line of R1 on E1: R1 = 3.604 E1 + 14.9206
- 9. ISSN 2349-7831 International Journal of Recent Research in Social Sciences and Humanities (IJRRSSH) Vol. 3, Issue 1, pp: (1-17), Month: January - March 2016, Available at: www.paperpublications.org Page | 9 Paper Publications Fig 6: Scatter Plot and Regression Line of R2 against E2 3.2 Reliability and validity of the error detection test: In terms of validity, the error detection test was considered a valid test due to the strong correlation coefficient of +0.800 as indicated in section 5.1. In terms of the reliability of the test, the Cronbach alpha coefficient is calculated as 0.782, with the value of k as 18 test items, 755.3 2 is and 22 789.3sums . The Spearman-Brown prophecy formula calculated the reliability coefficient as r r tCoefficliability 1 2 Re . The value of r is the correlation coefficient calculated by splitting the error detection test scores into two halves: the odd- numbered scores versus the even-numbered scores. However, as there are 41 samples for this study, the last test score ‘2’ was omitted to obtain a 20-20 equal halves of scores. With the help of the graphic calculator TI-84 plus, the value of r was +0.684. With this value of r, the reliability coefficient was calculated as 0.812. As both reliability coefficients exceeded 0.700, this indicated that the error detection test was a reliable instrument. 3.3 Implications: From the discussions in the previous section, there are three implications which we have to take note. First, the error detection test, if needs to be used, has to include both the arithmetic and algebra components. This should allow the assessor to obtain a more accurate picture of the error detection abilities of the students and how this had affected their mathematics performances. Second, the constructed regression line to be used as a prediction of students’ future academic performance in mathematic should only serve as a guide. The results should not be the only factor under consideration when estimating the future mathematical success of a student. Third, in order to preserve the confidentiality and internal validity of the study, each of the three tests should be administered to all the possible members in the sample one month after the previous test has been given. At the same time, all the members should also sit for the same test within the same week. 3.4 Limitations of the Study: There are two main limitations of the study. The first limitation is that the regression line should only be used as an interpolation of the possible test results. This means that suitable prediction can only be made if the total possible score of the error detection test is 18. If the error detection test is modified to increase the total test score to more than 18, the existing regression line is no longer valid. The second limitation is that the use of the regression line is only limited to private school students. More research has to be done on public school students to further develop new regression lines. 0 10 20 30 40 50 60 0 1 2 3 4 5 6 7 8 9 Error Detection Test Score E2 WrittenTestScoreR2 Regression line of R2 on E2: R2 = 4.159 E2 + 4.595
- 10. ISSN 2349-7831 International Journal of Recent Research in Social Sciences and Humanities (IJRRSSH) Vol. 3, Issue 1, pp: (1-17), Month: January - March 2016, Available at: www.paperpublications.org Page | 10 Paper Publications 4. CONCLUSION From the above discussions, it can be concluded that there was a fairly strong positive correlation (pmcc = +0.800) between academic achievements of private school students in mathematics with their error detection capabilities. However, when we conduct the correlation analysis separately on the arithmetic test with the error-detection test, and the algebra test with the error-detection test, weaker correlations were obtained. Hence, if there was a need to use an error detection test to ascertain the error detection competencies of the students in mathematics, it would be more convincing to test on both arithmetic and algebra, instead of using just one topic. With the above results, we can prove that students who tend to perform better in mathematics generally have better error detection abilities. Acknowledgement: I would like to give special thanks to my supervisor, Dr Casey Reason, for his valuable inputs and comments. 5. APPENDICES APPENDIX A: A SAMPLE OF THE ARITHMETIC TEST 1) Evaluate {[640-48×5] ÷ [(47-39) × 24- 38×4]}. [2] 2a) Using prime factorization, express 1296 as a product of prime factors. [3] 2b) Hence, evaluate 1296 [2] 3) Find the LCM of 36, 63 and 72. [2] 4) Arrange the following in ascending order: [2] 8 5 , 0.605, 62%, 0.605 5) Evaluate 4 3 1 + 7 2 1 × 3 2 4 ÷ 5 2 2 [2] 6) After spending 5 3 of her money on a skirt, Mary finds that she is short of $5 to purchase a blouse which cost $30.00. Find the amount of money that Mary had at the beginning. [2] 7) 44.1 , -1.6, 0, 3 15 , 21 , +2 a) Write down a set of rational numbers. [2] b) Write down a set of irrational numbers. [2] 8) Estimate, correct to one significant figure, the value of 3570 5972.032.18 [2] 9) The temperature at the top of a mountain was -20°C. At the same time, the temperature at sea level was 8°C. a) Calculate the difference between these temperatures. [1] b) The height of the mountain was 2800m. Given that the temperature changed uniformly with the height, calculate the height above sea level at which the temperature was 0°C. [2] 10) It is required to find a rational number which is equal to the recurring number 0.123123123…. a) If x = 0.123123123…., find the value of 1000x – x. [2] b) Hence, express 0.123123123…. in the form b a , where a and b are integers. [2]
- 11. ISSN 2349-7831 International Journal of Recent Research in Social Sciences and Humanities (IJRRSSH) Vol. 3, Issue 1, pp: (1-17), Month: January - March 2016, Available at: www.paperpublications.org Page | 11 Paper Publications 11) Given that 87 132 = 11484, write down the value of 0087.0 11484.0 [2] 12) Mr Tan took a loan of $10,000 from a bank for 3 years at a rate of 8% compounded annually, what is the total amount of interest that Mr Tan would have to pay after 3 years? ` [2] 13) A piece of land with an actual area of 2.25 km 2 is represented by an area of 9 cm 2 on the map. Find the scale of the map, in the form 1: n. [3] 14) In a factory, 68 workers took 30 h to make 500 sandals. How long will the same group of workers take to produce 900 sandals? [2] 15) Madeline bought a bag of candy weighing 900g. If she eats 30% of the candy each day, how much candy will she have left at the end of the third day? Leave your answer to the nearest gram. [3] 16) 1 ream of paper contains 500 sheets of paper. If the thickness of 1 sheet of paper is 0.2 µm, how high is 10 reams of paper? [2] 17) A car traveling at 90 km/h took 1 2 1 h to travel 4 3 of the journey. Calculate the speed for the remaining 4 1 of the journey if its average speed for the whole journey was 80 km/h. [2] 18) Mr Goh earned a gross annual income of $60,000 last year. He was entitled to the following tax reliefs: personal, $3000; wife, $2000; 2 children, $1500 each; elderly mother, $2500, life insurance premiums and CPF contributions, $6000. Part of the tax rates table is shown below. Chargeable income ($) Rate (%) Gross tax payable ($) On the first 7500 2 150 On the next 12500 5 625 On the first 20000 8 775 On the next 15000 8 1200 On the first 35000 12 1975 On the next 15000 12 1800 a) Calculate the total tax reliefs. [2] Hence, calculate the chargeable income. [2] b) What is the amount of income tax that Mr Goh has to pay? [2] --End of Arithmetic paper— APPENDIX B: A SAMPLE OF THE ALGEBRA TEST 1) Simplify i) a(2a – 4) – 2a(2a + 1). [2] ii) x y 4 5 ÷ x y 64 25 [2] 2) Factorise completely i) yx2 - y, [2] ii) 3cd – 11d – 3ce + 11e, [2] iii) 35316 2 aa . [2] 3) Express as a single fraction in its simplest form. 2 2 )1( 153 x xx – 1 1 x x [3] 4) Without the use of a calculator and using suitable algebraic expressions ONLY, find the value of k in the equation below. [2]
- 12. ISSN 2349-7831 International Journal of Recent Research in Social Sciences and Humanities (IJRRSSH) Vol. 3, Issue 1, pp: (1-17), Month: January - March 2016, Available at: www.paperpublications.org Page | 12 Paper Publications 7.85 2 – 4.15 2 = 12 k 5) Peter is one-fifth as old as his father. Five years ago, Peter was one-tenth as old as his father. How old is Peter now? [3] 6) Given that 4 12 ba ba , find the value of b a . [2] 7) Make a the subject of the formula: ba ka x 2 [4] 8) Solve the following simultaneous equations. [4] 14d + 5u + 158 = 0 11d – 2u + 53 = 0 9) Solve the equation below by using the Completing the Square Method ONLY, giving your answer correct to 2 decimal places. [4] 25x 2 – 40x – 70 = 0 10) Solve 4x 2 + 3x – 2 = 0, giving your answer correct to 3 significant figures. [3] 11) The roots of the equation 3x 2 + qx – p = 0 are – 3 2 and 5. Find the values p and q. [3] 12) Given that 4 5 x and 2 3 3 y , find a) the greatest possible value of yx 2 , [2] b) the largest possible value of 22 xy . [2] 13) A motorist traveled from town A to town B on a 200 km route at an average speed of x km/h. a) Write down an expression in x for the time taken to travel from town A to town B. [1] On his return journey, he increases his speed by 10 km/h and takes a shorter route of 195 km. b) Write down an expression in x for the time taken to travel from town B to town A. [1] c) Given that his traveling times differ by 20 minutes, forms an equation in x and show that it reduces to 2 x - 5x – 6000 = 0 [3] d) Solve the above equation and hence find his total traveling time in hours and minutes. [3] --End of Algebra paper— APPENDIX C: A SAMPLE OF THE ERROR DETECTION TEST Mathematical Error Detection Test Instructions and points to take note: 1) There are altogether 18 questions in this paper. The first 9 questions are from arithmetic and the rest are from algebra. 2) Each question comes with the solution. The solution may or may not have mistakes. 3) You are to read through the questions and their solutions, and to identify as many errors as possible. If an error is identified, please circle the exact point where the error occurs. 4) There are also solutions with no error. For solutions which you think have no error, please place a tick in the box beside the solution. 5) You have 30 minutes to complete the paper. Arithmetic 1) Evaluate {[(-47 + 39) × 24 + 28 ÷ 4] × [423 – 72 ÷ 3]}.
- 13. ISSN 2349-7831 International Journal of Recent Research in Social Sciences and Humanities (IJRRSSH) Vol. 3, Issue 1, pp: (1-17), Month: January - March 2016, Available at: www.paperpublications.org Page | 13 Paper Publications Solution: {[(-47 + 39) × 24 + 28 ÷ 4] × [423 – 72 ÷ 3]} = {[-8 × 24 + 28 ÷ 4] × [423 – 24]} = {[-192 + 28 ÷ 4] × 399} = {[-164 ÷ 4] × 399} = {-41 × 399} = -16359 2) A piece of land with an actual area of 3.24 km2 is represented by an area of 16 cm2 on the map. Find the scale of the map, in the form 1: n. Solution: 16 cm2 ---- 3.24 km2 4 cm ------ 1.8 km 1 cm ------ 0.45 km = 450 cm Scale of map is 1 : 450. 3) Mr Ling invested S$15,000 in a bank at a rate of 4% annual interest compounded half yearly. What is the amount of interest that Mr Ling received after 5 years? Solution: 22204 )04.1(15000 )04.01(15000 )1( 10 25 A A A rPA t Amount received in interest = $22,204 - $15,000 = S$7,204 4) Simplify 2 4 12 33 3 n n Solution: 341824 18 24 8 24 28 242 4 12 33 3 3 33 3 33 3 33 3 nnn n n n n n n n n 5) Evaluate 3 2 2 2 1 4 3 6 5 3 2 , giving the answer as a fraction in the lowest term. Partial Solution: 3 4 12 1 3 2 3 8 2 1 4 3 6 5 3 2 3 2 2 2 1 4 3 6 5 3 2 6) Given that y is inversely proportional to 2x2 , and that y = 15 when x = 4. Find the value of y when x is 5. 1 error 1 error 1 error 1 error No error
- 14. ISSN 2349-7831 International Journal of Recent Research in Social Sciences and Humanities (IJRRSSH) Vol. 3, Issue 1, pp: (1-17), Month: January - March 2016, Available at: www.paperpublications.org Page | 14 Paper Publications Solution: 22 22 x k y x y When x = 4, y = 15, hence 120 4 2 15 2 k k When x = 5, 6.9 5 )120(2 2 y 7) Solve the equation: 123 9273 yyy Partial Solution: yy y y y y yy yy 1232 6 3 33 333 9273 2 263 123 6 3 8) A shopkeeper sold a bag for $158. He made a profit of 20%. Calculate the cost price of the handbag. Solution: 100% --- $158 80% ----- $126.4 The cost price of the handbag is $126.4. 9) Find the least possible value of y – x, given that 2 < x < 5 and 6 < y < 12, where x and y are integers. Solution: Least (y – x) = 6 – 5 = 1 Algebra 1) Factorize 2(x - 2) - a(2 - x) Solution: 2(x - 2) - a(2 - x) = 2(x - 2) - a[-(x - 2)] = 2(x - 2) - a(x - 2) = (2 - a)(x - 2) 2) Make 'c' the subject of the formula: cx c y 2 . Solution: 2 )2( 2 2 2)( y xy c ycxy ccyxy ccyxy ccxy 1 error 1 error 1 error 1 error 1 error 1 error
- 15. ISSN 2349-7831 International Journal of Recent Research in Social Sciences and Humanities (IJRRSSH) Vol. 3, Issue 1, pp: (1-17), Month: January - March 2016, Available at: www.paperpublications.org Page | 15 Paper Publications 3) Express the following as a single fraction: 23 3 21 2 xx . Solution: )23)(21( 1 )23)(21( 6346 23 3 21 2 xxxx xx xx 4) Factorize 9 – 4x2 Solution: 9 – 4x2 = 32 – (4x)2 = (3 + 4x)(3 – 4x) 5) Simplify 1 0 2 1 3 32 3 2 2 3 2 ) 2 1 v u vu vu vu , leaving your answer in positive indices. Solution: v u vu u v vu u v vu v u vu vu vu 3 1324 2 2 1 0 2 1 3 32 3 2 2 4 44 2 1 3 2 ) 2 1 6) Solve the following equation by using the quadratic formula: 0322 xx . Solution: 2 82 2 1242 12 3142)2( 032 2 2 x xx 7) Solve the following equation by completing the square: 02322 xx . Solution: 4 5 4 3 4 5 16 25 4 3 0 16 25 4 3 0 16 9 1 4 3 0 4 3 1 4 3 01 2 3 01 2 3 2 0232 2 2 22 2 2 2 x x x x x xx xx xx 1 error 1 error 1 error No error 1 error
- 16. ISSN 2349-7831 International Journal of Recent Research in Social Sciences and Humanities (IJRRSSH) Vol. 3, Issue 1, pp: (1-17), Month: January - March 2016, Available at: www.paperpublications.org Page | 16 Paper Publications 8) Solve the fractional equation: 2 3 21 2 xx . Solution: 8 7 78 4362 6342 21322 2 3 21 2 xx xx xx xx xx 9) Solve the following linear inequality: xx 213432 . Solution: 3 1 13 1236 1632 63432 213432 xx xx xx xx xx End of Error-Detection Paper APPENDIX D: TEST RESULTS Student No Class Test 1 R1 Arithmetic Class Test 2 R2 Algebra Total Test Score R Error Detection Test (Arithmetic) E1 Error Detection Test (Algebra) E2 Error Detection Test (Final Score) E = E1 + E2 Max 50 Max 50 100 Max 9 Max 9 18 1 47 49 96 6 6 12 2 42 43 85 7 8 15 3 41 44 85 6 6 12 4 42 38 80 6 6 12 5 44 35 79 5 7 12 6 36 39 75 7 4 11 7 37 25 62 5 6 11 8 35 27 62 5 5 10 9 32 27 59 4 5 9 10 36 23 59 4 2 6 11 36 21 57 2 4 6 12 25 30 55 5 6 11 13 24 29 53 3 5 8 14 31 21 52 2 2 4 15 36 15 51 4 3 7 16 30 18 48 5 6 11 17 29 19 48 2 2 4 18 18 29 47 5 3 8 19 28 19 47 1 1 2 20 32 14 46 1 1 2 21 31 14 45 5 4 9 1 error 1 error
- 17. ISSN 2349-7831 International Journal of Recent Research in Social Sciences and Humanities (IJRRSSH) Vol. 3, Issue 1, pp: (1-17), Month: January - March 2016, Available at: www.paperpublications.org Page | 17 Paper Publications 22 22 16 38 4 3 7 23 26 12 38 3 1 4 24 17 20 37 1 1 2 25 19 16 35 2 6 8 26 25 10 35 1 2 3 27 25 9 34 2 3 5 28 19 14 33 2 5 7 29 28 5 33 1 3 4 30 26 4 30 3 3 6 31 20 8 28 2 1 3 32 16 11 27 5 4 9 33 17 7 24 3 1 4 34 18 4 22 1 3 4 35 16 5 21 2 0 2 36 16 4 20 2 3 5 37 11 9 20 0 0 0 38 7 9 16 1 1 2 39 11 5 16 1 1 2 40 9 6 15 1 2 3 41 13 1 14 1 1 2 REFERENCES [1] American Psychological Association (APA) (2001). Publication manual of the American Psychological Association. 5th edition. Washington, DC: American Psychological Association. [2] Carroll, S. (n.d) Instrument Reliability. Retrieved March 27, 2011, from dissertationstatistics.com: http://www. dissertation-statistics.com/instrument-reliability.html [3] Fraenkel, J.R. & Wallen, N.E. (2009) How to Design and Evaluate Research inEducation. 7th Edition. NY: McGraw-Hill. Math-Assessments. Error Pattern Analysis. Retrieved April 17, 2012, from http://math- assessments.wikispaces.com/Error+Pattern+Analysis [4] Nolting, P. (1998). Winning at Math. Academic Success Press. Retrieved March 20, 2012, from http://www. west.net/~ger/math_errors.html [5] Statsoft. Reliability and Item Analysis. Retrieved June 24, 2012, from https://www.statsoft.com/textbook/reliability- and-item-analysis/ [6] Talia, B-Z. (1998). Are Students Overly Confident in Their Mathematical Errors?Research in the Schools, v3 n2, 1 – 4. Retrieved from ERIC database. (EJ625756) [7] White, A. L. (2005). Active Mathematics in Classrooms: Finding Out Why Children Make Mistakes – And Then Doing Something to Help Them. Square One, 15 (4), 15 - 19. [8] Wong, K.Y. (2000). Enhancing Students’ Learning through Error Analysis. Department of Science and Mathematics Education, Universiti Brunei Darussalam.