Download to read offline
![Introduction – Motivation
• Internet of Things social and economic impact [1].
• By 2025, researchers estimate that the IoT will have a potential economic
impact of 11 trillion per year – which would be equivalent to about 11% of
the world economy. They also expect that one trillion IoT devices will be
deployed by 2025.
• Technologies created for IoT are driving computing toward
dispersion [4].
• Multi-Access Edge Computing
• Fog Computing
• Cloudlets
3](https://image.slidesharecdn.com/presentation-190519133603/85/GaruaGeo-Global-Scale-Data-Aggregation-in-Hybrid-Edge-and-Cloud-Computing-Environments-3-320.jpg)
![State of the art – Distributed Computing
• Since the 60s, computing has alternated between centralization
and decentralization [4]
• 60s & 70s: Centralized approaches like batch processing and
timesharing.
• 80s & 90s: Decentralization through the rise of personal computing.
• Mid-00s: Centralized approaches like cloud computing.
• Nowadays: The rise of fog computing and edge computing.
5](https://image.slidesharecdn.com/presentation-190519133603/85/GaruaGeo-Global-Scale-Data-Aggregation-in-Hybrid-Edge-and-Cloud-Computing-Environments-5-320.jpg)
![State of the art – Smart Grids
• For 100 years, there has been no change in the basic structure of
the electrical power grid. Experiences have shown that the
hierarchical, centrally controlled grid of the 20th Century is
ill-suited to the needs of the 21st Century. To address the
challenges of the existing power grid, the new concept of smart
grid has emerged [2].
• Smart Grids are the use case scenario for the testbed application
developed in this work.
• Low latency
• Needs to communicate energy consumption quickly to the grid operator
machines in order to balance demand and energy generation.
• High scalability
• Requires communication across large geographic regions to connect large
numbers of households.
6](https://image.slidesharecdn.com/presentation-190519133603/85/GaruaGeo-Global-Scale-Data-Aggregation-in-Hybrid-Edge-and-Cloud-Computing-Environments-6-320.jpg)
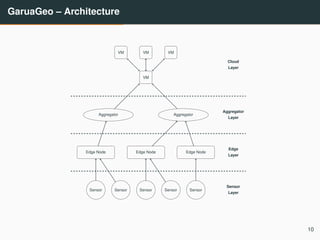
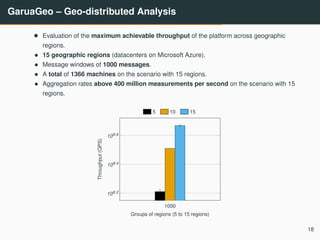
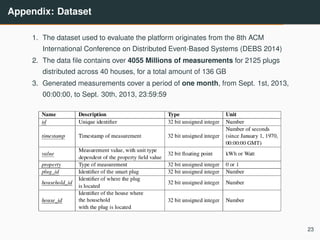
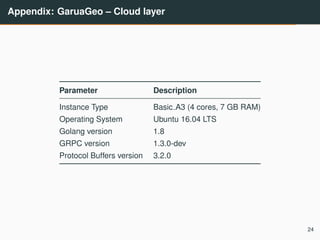
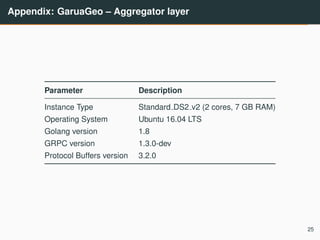

The document presents 'garuageo', a framework for global data aggregation in hybrid edge and cloud computing, aimed at enhancing performance by optimizing the distribution of computational workloads. Through a structured architecture involving cloud, aggregator, edge, and sensor layers, the study evaluates throughput and latency across various geographic regions using data from smart grids. The findings indicate significant improvements in throughput and efficiency when data aggregation occurs closer to edge nodes, suggesting future enhancements in distributed data processing techniques.